Monetary Review - Danmarks Nationalbanks hjemmeside · motif for the first coin in a series of 7-10...
123
2003 Danmarks Nationalbank Monetary Review 4th Quarter D A N M A R K S N A T I O N A L B A N K 2 0 0 3 4
Transcript of Monetary Review - Danmarks Nationalbanks hjemmeside · motif for the first coin in a series of 7-10...

2003
Da
nm
ark
s Na
tion
alb
an
kM
on
eta
ry R
ev
iew
03
Danmarks Nationalbank
Monetary Review 4th Quarter
Danmarks Nationalbank Havnegade 5 DK-1093 Copenhagen K
Telephone +45 33 63 63 63 Fax +45 33 63 71 25
www.nationalbanken.dk E-mail: [email protected]
D A N M A R K S
N A T I O N A L
B A N K 2 0 0 3
4
4
4-kvartal-2003-UK.pmd 19-11-2003, 08:281

12-12-2003 07:14 Antal sider: 1 Rev. nr. kolofon Oprettet af Alice Colombo
The small picture on the front cover is a section of the Århus City Hall Tower, chosen as the
motif for the first coin in a series of 7-10 thematic coins that are issued over a number of
years.
Text may be copied from this publication provided that Danmarks Nationalbank is specifi-
cally stated as the source. Changes to or misrepresentation of the content are not permit-
ted.
The Monetary Review is published by Danmarks Nationalbank and is issued quarterly.
Managing Editor: Jens Thomsen
Editor: Anders Møller Christensen
The Monetary Review can be ordered from:
Danmarks Nationalbank, Information Desk, Havnegade 5, DK-1093 Copenhagen K.
Telephone +45 33 63 70 00 (direct) or +45 33 63 63 63.
E-mail: [email protected]
www.nationalbanken.dk
Scanprint as, Viby J
ISSN 0011-6149
(Online) ISSN 1398-3865

12-12-2003 07:16 Antal sider: 2 Rev. nr. 2 H:\kvo\ENG\2003\4qtr\tiltryk\indhold.doc
Oprettet af Alice Colombo
Recent Economic and Monetary Trends.............................................. 1 SCP – Scandinavian Cash Pool .............................................................. 23
New Statistics Database at Danmarks Nationalbank's Website ........ 27 Volatility in Inflation and Economic Activity in the Nordic Countries............................................................................. 29
Anders Møller Christensen and Niels Lynggård Hansen, Economics
For some years, inflation and activity have fluctuated less in Denmark than in the
other Nordic countries. This is mainly attributed to the Danish fiscal-policy
framework aiming at reducing debt, as well as a consistent fixed-exchange-rate
policy. These policies have shielded Denmark from a number of so-called home-
made shocks.
Inflation Differentials in the Euro Area .............................................. 41
Borca Babic, Economics
The article outlines possible causes of the inflation differentials among the 12
euro area member states since the transition to the third stage of EMU in Janu-
ary 1999. Several factors, including real economic convergence and differences in
the member states' cyclical positions, have contributed.
The IMF and Danmarks Nationalbank's Balance Sheet...................... 53
Louise Mogensen, Financial Markets
Danmarks Nationalbank's balance sheet is affected by various financial accounts
with the International Monetary Fund, IMF. The risk in connection with these
transactions is kept at a very low level.
China's Role in the Global Economy.................................................... 61 Gitte Wallin Pedersen, International Relations
China's role in the world economy has grown significantly after 25 years with
sustained high growth rates. This development has focused international atten-
tion on China and the possible economic consequences to the rest of the world.
Contents

12-12-2003 07:16 Antal sider: 2 Rev. nr. 2 H:\kvo\ENG\2003\4qtr\tiltryk\indhold.doc
Oprettet af Alice Colombo
The Investment Services Directive – a New Basis for Securities Trading in Europe ................................................................................. 77
Birgitte Bundgaard and Anne Reinhold Pedersen, Financial Markets
Political agreement on a new Investment Services Directive may increase com-
petition in the markets once the directive enters into force. The much-needed
adaptation of legislation to the market development will facilitate the integra-
tion of the securities markets in the EU and benefit the business community and
private investors, even though several of the changes implemented by the direct-
ive are not substantial.
The Credit Channel in Monetary-Policy Analyses ............................... 85 Anders Mølgaard Pedersen, Economics
The credit channel is an aggregate term for a number of theories implying that
monetary policy also has an impact via a change in the supply of bank loans. This
article provides an overview of these theories and their practical relevance. In
Denmark the credit channel is presumably less significant than in most other
countries.
Press Releases ........................................................................................ 103
Tables and Graphs Section
Vol. XLII , No. 4

12-12-2003 07:24 Antal sider: 22 Rev. nr. 2 H:\kvo\ENG\2003\4qtr\tiltryk\001-022.doc
Oprettet af Alice Colombo
1
Recent Economic and Monetary Trends
This review covers the period from the beginning of September to the middle of November 2003
INTERNATIONAL FINANCIAL MARKETS
An international economic upturn has become more pronounced since the summer. The USA has seen increasing growth and Japan surprisingly positive growth since the turn of the year, and the growth estimates for 2003 and 2004 have been adjusted upwards. Improved confidence indi-cators and an increase in GDP in the 3rd quarter could mark the begin-ning of a recovery in the euro area.
The expectations in the financial markets of an improvement of the world economy are reflected in the steepening of the yield curve since the early summer. Long-term bond yields have risen since the low in June, cf. Chart 1. The increases were observed during the summer, while
10-YEAR GOVERNMENT BOND YIELDS Chart 1
Source: EcoWin.
0
1
2
3
4
5
6
Jan Mar May Jul Sep Nov Jan Mar May Jul Sep Nov
Per cent
Germany USA Japan2002 2003

12-12-2003 07:24 Antal sider: 22 Rev. nr. 2 H:\kvo\ENG\2003\4qtr\tiltryk\001-022.doc
Oprettet af Alice Colombo
2
in mid-November the yields were slightly lower than the level from the beginning of September. The 10-year government bond yield in both Germany and the USA was approximately 4.3 per cent in mid-November, while the corresponding Japanese bond yield was 1.3 per cent. The USA, Japan and the euro area have kept the monetary-policy interest rates unchanged since June, but there are increasing expectations of mone-tary-policy tightenings during 2004.
Stock prices were almost unchanged from September to mid-November. The slowdown followed a generally rising trend in the USA, Japan and the euro area from March to mid-September. Since March, the US S&P 500 index has increased by almost 25 per cent, the Nikkei index in Japan has risen by approximately 13 per cent and the DJ Stoxx 50 index for the euro area has risen by just over 20 per cent.
On the foreign-exchange markets the dollar continued it's weakening trend. From the beginning of 2002 to October 2003 the effective ex-change rate of the dollar weakened by almost 10 per cent, cf. Chart 2. The dollar's continued weakness recently may reflect uncertainty con-cerning the imbalances in the US economy, including the sustainability of the current-account deficit. The deficit was previously financed via private capital flows, but in recent years it has increasingly been fin-
US DOLLAR VIS-À-VIS OTHER CURRENCIES Chart 2
Note: Source:
Monthly observations. For the bilateral exchange rates an increase in the index indicates a strengthening of the dollar against the currency in question. An increase in the effective-dollar-rate index indicates a strengthening of the dollar against the weighted average of the currencies included in the index. The currencies shown are weighted as follows in the effective-exchange-rate index: euro 17 per cent, Canadian dollar 17 per cent, yen 12 per cent, Mexican peso 11 per cent and renminbi 9 per cent. EcoWin.
70
75
80
85
90
95
100
105
110
115
120
125
Jan Apr Jul Oct Jan Apr Jul Oct
Effective exchange rate Euro Canadian dollar Yen Mexican peso Renminbi
2002 2003
Index, January 2002 = 100

12-12-2003 07:24 Antal sider: 22 Rev. nr. 2 H:\kvo\ENG\2003\4qtr\tiltryk\001-022.doc
Oprettet af Alice Colombo
3
anced by Asian central banks, which have thus accumulated large dollar claims. At the meeting in Dubai in September, the G7 countries called for a more flexible, market-based development of exchange rates be-tween the major economies. The Bank of Japan temporarily reduced its otherwise massive interventions in the foreign-exchange market in order to prevent the yen from strengthening. In the period under review the euro, the Canadian dollar and the Japanese yen strengthened by 6-8 per cent vis-à-vis the dollar. The Mexican peso depreciated vis-à-vis the dol-lar, while the Chinese renminbi remained unchanged (China pursues a fixed-exchange-rate policy vis-à-vis the dollar).
In the period under review the prices for cyclically-sensitive industrial metals rose steadily in the light of improved growth prospects. In mid-November, these prices were just over 10 per cent higher than at the beginning of September.
The oil price ended the period where it started. At the beginning of the period, the oil price decreased after the release of higher-than-expected increases in global oil stocks. The decrease was followed by increases after OPEC's surprising decision to reduce production as from 1 November, and the price (Brent) briefly exceeded 30 dollars per barrel. In mid-November the oil price was just under 30 dollars per barrel.
At the time of going to press the gold price was the highest for 7 years, cf. Chart 3. This is presumably due to several factors, for instance that the gold-producing countries have raised the gold price after the
GOLD PRICE Chart 3
Note: Source:
Monthly observations. EcoWin.
250
275
300
325
350
375
400
USD per troy ounce
Gold
1997 1998 1999 2000 2001 2002 2003

12-12-2003 07:24 Antal sider: 22 Rev. nr. 2 H:\kvo\ENG\2003\4qtr\tiltryk\001-022.doc
Oprettet af Alice Colombo
4
dollar's depreciation vis-à-vis their currencies, since gold is settled in dollars.
THE INTERNATIONAL ECONOMY
Growth in the euro area has been subdued since the turn of the year, while the USA and Japan have experienced increasing growth in the 2nd and 3rd quarters, cf. Chart 4. However, the sustainability of the recovery in the US economy is subject to some uncertainty. The uncertainty is particularly related to the USA's large current-account deficit and government-budget deficit. The US labour market is also a source of concern, since it has shown only weak signs of improvement despite the latest increase in output.
USA The US economy grew by 1.7 per cent quarter-on-quarter in the 3rd quarter. The growth rate has thus been on the increase since the turn of the year, cf. Chart 4. Private consumption accounted for the greatest part of the increase, including an increase by 6.1 per cent in consump-tion of durable consumer goods against the previous quarter. Growth in investments rose, hopefully pointing to a broadly-based upswing.
A major driving force for the increasing growth in 2003 has been the USA's strongly expansionary monetary and fiscal policy. The USA has
QUARTERLY GDP GROWTH IN 2003 Chart 4
Source: EcoWin.
-0.5
0.0
0.5
1.0
1.5
2.0
Per cent, quarter-on-quarter
Q1 Q2 Q3 Q1 Q2 Q3 Q1 Q2 Q3
Euro area USA Japan

12-12-2003 07:24 Antal sider: 22 Rev. nr. 2 H:\kvo\ENG\2003\4qtr\tiltryk\001-022.doc
Oprettet af Alice Colombo
5
made more adjustments to its economic policy than any other country since the start of 2001, cf. Chart 5. The package of tax measures adopted in the spring entered into force in the 3rd quarter, implying e.g. general income-tax cuts and tax cuts for families with children. The monetary-policy interest rate has been reduced on an ongoing basis since 2001 to a historical low of 1 per cent. At the same time, long-term interest rates have been low. The level of interest rates has stimulated private con-sumption, and the 3rd quarter was no exception. This is indicated by the significant increase in households' purchases of durable consumer goods and the resilience of the housing market.
Employment has risen since August, and unemployment fell to 6 per cent in October. In a historical perspective, however, the labour market has developed weakly since the recovery began in late 20011, cf. Box 1. One explanation is lower output growth in this upswing than in previ-ous upswings and exceptionally strong productivity growth. Annual growth in hourly productivity was 4.7 per cent in the 3rd quarter.
The strongly expansionary fiscal policy has aggravated the imbalances. According to an IMF2 estimate, the government deficit is expected to be 6 per cent of GDP in 2003. This more than offsets the current-account deficit, which is estimated at 5.1 per cent of GDP. The private savings deficit has thus disappeared.
Weak employment growth and the imbalances cast doubt about the sustainability of the recovery when the stimuli from economic policy fade away. In addition, the increase in long-term interest rates since the early summer has dampened the stimulus to private consumption from conversion of housing loans.
1 The start of the recovery has been dated by the US research and analysis institute, National Bureau of
Economic Research, NBER. 2 IMF, World Economic Outlook, September 2003.
FISCAL POLICY AND MONETARY POLICY IN THE PERIOD 2001-03 Chart 5
Note: Source:
Fiscal policy is compiled as the structural budget balance as a percentage of GDP. A deterioration of the balance indicates expansion of fiscal policy. The 2003 figures are the IMF's estimates from September 2003. A further easing of Japan's monetary policy by an increase in the target for the banks' deposits with the Bank of Japan is not illustrated in the Chart. IMF, World Economic Outlook, September 2003.
0
1
2
3
4
5
6
7
2001 2002 2003
Per cent
Euro area USA Japan UK
Monetary-policy interest rate
-8
-7
-6
-5
-4
-3
-2
-1
0
1
2
Euro area USA Japan UK
2000 20032000 20032000 20032000 2003
Per cent of GDP Fiscal policy

12-12-2003 07:24 Antal sider: 22 Rev. nr. 2 H:\kvo\ENG\2003\4qtr\tiltryk\001-022.doc
Oprettet af Alice Colombo
6
A JOBLESS RECOVERY IN THE USA Box 1
In the US economy, employment has shown a weak trend in recent years. The eco-
nomic cycle bottomed out in November 2001, and since then employment has fallen
by just over 3/4 million people despite the GDP increase of 6 per cent. The cyclical
upturn since 2001 has therefore been called a jobless recovery. The employment
trend contrasts strongly with previous cyclical upturns where employment typically
showed a strong increasing trend, cf. the Chart (left-hand panel). However, the
current pattern has also been observed before. The previous recession in 1991 in
the USA was followed by a period of growth without job creation. Two consecutive
recoveries with atypical employment trends call for an analysis of the underlying
factors.
One reason why employment has shown a weaker trend in this recovery than on
previous occasions is that the GDP trend has also been weaker than normal despite
the increase, cf. the Chart (right-hand panel).
Ben S. Bernanke, one of the Federal Reserve Governors, recently emphasised
productivity growth as the most significant reason for the absence of job creation1:
Annual productivity growth has been 4.5 per cent on average since the trough of
the recession, i.e. stronger growth than in previous upswings. This reflects higher
productivity growth in general since the mid-1990s and probably also a delayed
effect of major investments in high-tech equipment which the business enterprises
are now learning to put to optimum use. However, other factors may also have con-
tributed to the weak employment pattern. Bernanke mentions four factors: 1) After
the boom years in the late 1990s many business enterprises had a labour surplus,
which entailed an untenable employment level when the recession set in in March
2001. 2) The business enterprises have been reluctant to hire and invest due to po-
litical and economic uncertainty. 3) The business enterprises may have utilised exist-
ing labour rather than hiring new employees in view of rising indirect payroll costs.
4) Structural changes in the US economy have led to permanent rather than tempo-
rary job losses to a higher degree than what is normal during a recession. This
applies to e.g. the manufacturing industry. Since it takes time to create new jobs in
other sectors and retraining may be involved, this may have contributed to the
weak development trend.
EMPLOYMENT AND GDP IN THE USA Chart
Note: Source:
The Charts show the trend in relation to the cyclical trough (the beginning of the expansion) which is 0. EcoWin, NBER and own calculations.
1 Speech at the Global Economic and Investment Outlook Conference, Carnegie Mellon University, Pittsburgh, Pennsylvania on 6 November 2003.
96
97
98
99
100
101
102
103
104
105
-24 -21 -18 -15 -12 -9 -6 -3 0 3 6 9 12 15 18 21 24Month from trough
Average of last 6 recessions Current
Trough = 100 Employment
92
94
96
98
100
102
104
106
108
110
-8 -7 -6 -5 -4 -3 -2 -1 0 1 2 3 4 5 6 7 8Quarter from trough
Average of last 6 recessions Current
Trough = 100GDP

12-12-2003 07:24 Antal sider: 22 Rev. nr. 2 H:\kvo\ENG\2003\4qtr\tiltryk\001-022.doc
Oprettet af Alice Colombo
7
The Federal Open Market Committee, FOMC, has kept interest rates unchanged since the reduction at end-June by 0.25 per cent to 1 per cent. Inflation measured by the broad consumer-price index, CPI, was 2 per cent in October. Core inflation, i.e. CPI excluding food and energy, was 1.3 per cent in October and has been on the decrease for a long time. At the meeting at the end of October, the FOMC maintained its view that the probability, though minor, of an unwelcome fall in infla-tion exceeds that of a rise in inflation. The FOMC therefore found that the risk of inflation becoming undesirably low remains the predominant concern, so monetary-policy accommodation can be maintained for a considerable period.
Japan The national accounts show surprising growth in the Japanese economy, cf. Chart 4. GDP rose by 0.6 per cent in the 3rd quarter after a growth rate of 0.5 per cent in the 1st quarter and 0.9 per cent in the 2nd quarter.
As opposed to real GDP, nominal GDP has been flat since the middle of 2001. The strong GDP growth in constant prices according to the latest national accounts is thus the result of an amplified decrease in the GDP deflator, i.e. the price index adjusting the GDP development from current to constant prices, cf. the left-hand panel of Chart 6. The de-crease is attributable to e.g. a strong drop in the deflator for business investments and is significant compared to the corresponding deflator in the USA, cf. the right-hand panel of Chart 6. Real GDP has to a certain extent shown the opposite pattern of the All Activity Index. This index represents weighted indicators for output in the manufacturing, con-struction and service sectors and thus covers most of the economy. Since the beginning of 2002, the growth rate of this index has been somewhat lower than that of GDP.
The most recent increase was primarily driven by business investments and exports. The course of business investments should be viewed in the
NOMINAL AND REAL GDP IN JAPAN Chart 6
Source: EcoWin.
75
80
85
90
95
100
105
110
115
Index, 1995=100
Business investments, Japan Business investments, USA1995 1996 1997 1998 1999 2000 2001 2002 2003
Deflation of business investments in Japan and the USAGDP deflator and real and nominal GDP
75
80
85
90
95
100
105
110
115
Index, 1st qrt. 1995 = 100
GDP deflator Real GDP Nominal GDP1995 1996 1997 1998 1999 2000 2001 2002 2003
12-12-2003 07:24 Antal sider: 22 Rev. nr. 2 H:\kvo\ENG\2003\4qtr\tiltryk\001-022.doc
Oprettet af Alice Colombo
8
light of improved earnings in business enterprises. Despite the good growth rates recently, Japan's structural problems persist, e.g. in the financial sector.
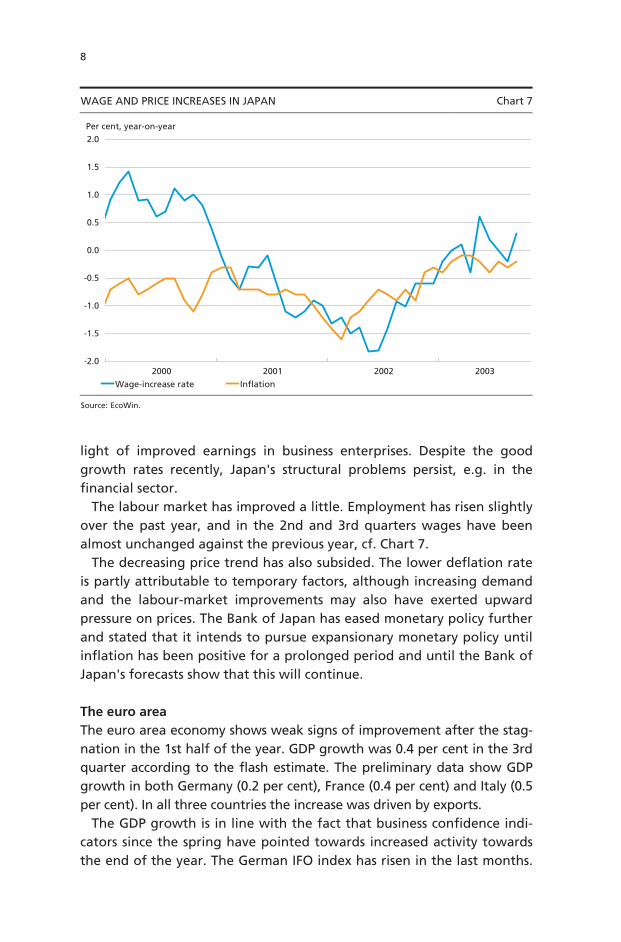
The labour market has improved a little. Employment has risen slightly over the past year, and in the 2nd and 3rd quarters wages have been almost unchanged against the previous year, cf. Chart 7.
The decreasing price trend has also subsided. The lower deflation rate is partly attributable to temporary factors, although increasing demand and the labour-market improvements may also have exerted upward pressure on prices. The Bank of Japan has eased monetary policy further and stated that it intends to pursue expansionary monetary policy until inflation has been positive for a prolonged period and until the Bank of Japan's forecasts show that this will continue.
The euro area The euro area economy shows weak signs of improvement after the stag-nation in the 1st half of the year. GDP growth was 0.4 per cent in the 3rd quarter according to the flash estimate. The preliminary data show GDP growth in both Germany (0.2 per cent), France (0.4 per cent) and Italy (0.5 per cent). In all three countries the increase was driven by exports.
The GDP growth is in line with the fact that business confidence indi-cators since the spring have pointed towards increased activity towards the end of the year. The German IFO index has risen in the last months.
WAGE AND PRICE INCREASES IN JAPAN Chart 7
Source: EcoWin.
-2.0
-1.5
-1.0
-0.5
0.0
0.5
1.0
1.5
2.0
Wage-increase rate Inflation
2000 2001 2002 2003
Per cent, year-on-year
12-12-2003 07:24 Antal sider: 22 Rev. nr. 2 H:\kvo\ENG\2003\4qtr\tiltryk\001-022.doc
Oprettet af Alice Colombo
9
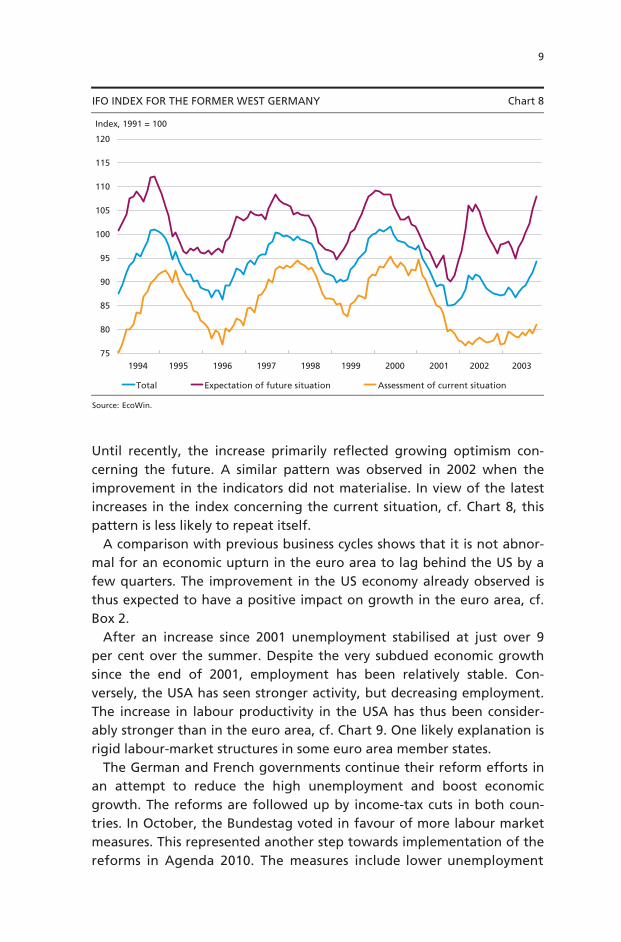
Until recently, the increase primarily reflected growing optimism con-cerning the future. A similar pattern was observed in 2002 when the improvement in the indicators did not materialise. In view of the latest increases in the index concerning the current situation, cf. Chart 8, this pattern is less likely to repeat itself.
A comparison with previous business cycles shows that it is not abnor-mal for an economic upturn in the euro area to lag behind the US by a few quarters. The improvement in the US economy already observed is thus expected to have a positive impact on growth in the euro area, cf. Box 2.
After an increase since 2001 unemployment stabilised at just over 9 per cent over the summer. Despite the very subdued economic growth since the end of 2001, employment has been relatively stable. Con-versely, the USA has seen stronger activity, but decreasing employment. The increase in labour productivity in the USA has thus been consider-ably stronger than in the euro area, cf. Chart 9. One likely explanation is rigid labour-market structures in some euro area member states.
The German and French governments continue their reform efforts in an attempt to reduce the high unemployment and boost economic growth. The reforms are followed up by income-tax cuts in both coun-tries. In October, the Bundestag voted in favour of more labour market measures. This represented another step towards implementation of the reforms in Agenda 2010. The measures include lower unemployment
IFO INDEX FOR THE FORMER WEST GERMANY Chart 8
Source: EcoWin.
75
80
85
90
95
100
105
110
115
120
Index, 1991 = 100
Total Expectation of future situation Assessment of current situation
1994 1995 1996 1997 1998 1999 2000 2001 2002 2003

12-12-2003 07:24 Antal sider: 22 Rev. nr. 2 H:\kvo\ENG\2003\4qtr\tiltryk\001-022.doc
Oprettet af Alice Colombo
10
benefit and a more stringent unemployment benefit regime. At the same time, the Bundestag adopted earlier implementation of a tax re-form whereby income-tax cuts will become effective already in 2004.
EFFECT ON THE EURO AREA OF RISING DEMAND IN THE USA Box 2
Rising demand in the USA can have a positive impact on activity in the euro area. This is
not only due to the direct trade channel between the euro area and the USA, but also to
increased integration of the financial markets and the resulting effects on confidence.
Euro area exports (excluding intra-euro area trade) account for approximately 15
per cent of GDP. Exports to the USA account for approximately 15 per cent of this
share. The direct trade channel thus explains part of the increase in euro area exports,
but the general increase in world trade also plays a role. Besides the direct trade
channel the integration of the financial markets can also have an effect via interest
rates and stock prices. Another factor, which is more difficult to measure, is the effect
on investments and private consumption of increased confidence in the euro area as a
result of higher growth in the USA.
In the global macromodel NiGEM1 a positive shock to private consumption in the
USA of 1 per cent of GDP is simulated. In the model, private consumption will sub-
sequently be higher than normal since consumption in a certain period depends on
consumption in the preceding period. GDP will rise immediately, followed by a
gradual dampening of the effect, cf. the Chart (left-hand panel). The positive shock
to demand in the USA will affect euro area exports by approximately 0.7 per cent in
the first two quarters and GDP by just under 0.2 per cent, cf. the Chart (right-hand
panel). The effect will subsequently decline. The increase in GDP can be explained
by rising exports to the USA, but also rising exports to other countries in view of
the expansion of world trade, cf. the Chart (right-hand panel). The increase in con-
sumption in the USA thus benefits the whole world in the form of increased trade.
EFFECT ON THE EURO AREA OF A SHOCK TO PRIVATE CONSUMPTION IN THE USA
Note: Source:
The effect is compiled as the percentage deviation from a base line scenario. Own calculations in NiGEM.
Monetary policy in both the USA and the euro area is subject to a Taylor rule in the
simulation whereby monetary policy will be tightened if the output gap widens. In
the longer term, this will bring the model back to equilibrium.
NiGEM does not account for a possible effect via the confidence channel and only
partly accounts for the effect via the financial markets. The effect on GDP in the euro
area is thus probably underestimated.
1 NiGEM is compiled by the National Institute of Social and Economic Research in London.
0.0
0.2
0.4
0.6
0.8
1.0
1.2
1.4
1.6
0 1 2 3Quarters after shock
Per cent
Private consumption in the USA GDP in the USA
0.0
0.2
0.4
0.6
0.8
1.0
1.2
1.4
1.6
0 1 2 3Quarters after shock
Per cent
Euro area eports GDP in the euro area World trade

12-12-2003 07:24 Antal sider: 22 Rev. nr. 2 H:\kvo\ENG\2003\4qtr\tiltryk\001-022.doc
Oprettet af Alice Colombo
11
Before the bills can become law, most of them must, however, be proc-essed by the Bundesrat where they have already been rejected once. In France, in connection with the adopted pension reform that will tighten the requirements concerning full pension entitlement in the public sec-tor, a debate of health and labour-market reforms has been initiated. These reforms should go hand in hand with income-tax cuts in 2004.
Several member states' government budget deficits are expected to exceed the limit of 3 per cent of GDP stipulated in the EU Treaty, cf. Chart 10. The worst cases are France and Germany, whose deficits are expected by the European Commission1 to be around 4 per cent for 2003 and 2004. Against this background, the European Commission in October recommended to the Council of Ministers for Economic Affairs and Finance, Ecofin, that notice be given to France to take measures to tighten fiscal-policy in 2004 and 2005 to bring the budget deficit below 3 per cent of GDP by 2005 at the latest. In the middle of November the Commission made a similar recommendation for Germany. If these recommendations are adopted (which was not yet the case at the time of going to press), and if the countries fail to comply, the next step will be to impose sanctions against the two countries. With the recommen-dations for France and Germany the Commission has already stretched
1 The European Commission's autumn forecast 2003.
PRODUCTIVITY IN THE EURO AREA AND THE USA Chart 9
Note: Source:
The latest observation for the euro area is the 2nd quarter since employment data for the 3rd quarter are not yet available. EcoWin.
96
98
100
102
104
106
108
Index, 2001 = 100
Euro area USA
1998 1999 2000 2001 2002 2003

12-12-2003 07:24 Antal sider: 22 Rev. nr. 2 H:\kvo\ENG\2003\4qtr\tiltryk\001-022.doc
Oprettet af Alice Colombo
12
the interpretation of the Stability and Growth Pact to take into ac-count their low economic growth. The fact that the Commission's pro-posal has attracted considerable attention shows that the Stability and Growth Pact works and that it encourages implementation of respon-sible fiscal policy compared to a situation without such rules. Neverthe-less, the upcoming decisions on France and Germany, including whether the Commission's proposal will be further softened, will have a significant impact on the Stability and Growth Pact's "bite" in the future.
Inflation in the euro area has been stable at around 2 per cent since April and was 2 per cent in October with certain variations across the member states.1 Core inflation2 declined during 2002 and has been close to 1.7 per cent in recent months. This was also the level in October. The ECB has made no adjustment to monetary policy since the reduction of the minimum bid rate by 0.5 per cent to 2 per cent in June.
UK The UK economy was almost unaffected by the international economic slowdown thanks to strong domestic demand. A significant adjustment of the national accounts for the 2nd quarter showed that the growth
1 Cf. Inflation Differentials in the Euro Area p. 41 ff.
2 HICP excluding energy, food, alcohol and tobacco.
EXPECTED BUDGET BALANCE IN THE EU MEMBER STATES Chart 10
Source: The European Commission's autumn forecast 2003.
-5 -4 -3 -2 -1 0 1 2 3
Finland
Denmark
Sweden
Belgium
Spain
Luxembourg
Ireland
Austria
Greece
Netherlands
Italy
UK
Portugal
Germany
Frace
Per cent of GDP
2003 2004

12-12-2003 07:24 Antal sider: 22 Rev. nr. 2 H:\kvo\ENG\2003\4qtr\tiltryk\001-022.doc
Oprettet af Alice Colombo
13
rate was 0.6 per cent in the 2nd quarter as well as in the 3rd quarter. Since retail sales and consumer confidence rose in the 3rd quarter, pri-vate consumption continued to be a significant growth factor.
As in the USA, fiscal policy and monetary policy provided strong stimu-li, cf. Chart 5. The European Commission expects a budget deficit of 2.8 per cent in 2003. The low interest rates have supported the housing market, where house prices have increased for a long time. House prices also rose in the period August-October, thereby continuing to stimulate private consumption to a considerable extent.
In November, the Bank of England raised the interest rate by 25 basis points to 3.75 per cent. As the basis for its decision the Monetary Policy Committee stated that credit is still strong, and both private consump-tion and the housing market have slowed less than expected. The rate of increase in house prices is still the principal explanation of the difference between HICP inflation and RPIX inflation, which were 1.4 per cent and 2.7 per cent, respectively, in October. Unlike the RPIX index, the HICP does not include house prices (via rent).
Sweden Sweden saw subdued growth in the 1st half of 2003. Exports nevertheless increased, despite the international economic slowdown, while domestic activity was dampened by unchanged investments and modest growth in public consumption. Private consumption was relatively strong, and fa-vourable retail sales observations from July to September indicate that this tendency continued in the 3rd quarter.
The monetary-policy interest rate has not been changed since the re-duction in July to 2.75 per cent. Inflation measured by the UND1X index was 1.9 per cent in October. Inflation has thus decreased from the high level at the beginning of the year, which was primarily attributable to rising energy prices.
In the referendum on 14 September the Swedish population rejected EMU membership. Just over 56 per cent voted against membership, while just under 42 per cent voted in favour. This result was expected in the financial markets and caused moderate reactions. The Swedish krona weakened briefly after the result, but has strengthened a little since then.
Norway Mainland GDP in Norway moved sideways in the 1st half of the year. The economy was severely affected by the international economic slowdown that coincided with the domestic cost pressure and the strong Nor-wegian krone in 2002, which had a severe adverse impact on Norway's

12-12-2003 07:24 Antal sider: 22 Rev. nr. 2 H:\kvo\ENG\2003\4qtr\tiltryk\001-022.doc
Oprettet af Alice Colombo
14
competitiveness. However, the rate of wage increase was dampened by rising unemployment.
The appreciation of the Norwegian krone in 2002 exerted downward pressure on inflation measured by the KPI-JAE index which declined to below the target of 2.5 per cent. Inflation was 0.9 per cent in August and September. On 17 September Norges Bank lowered the interest rate for the seventh time since December 2002, and the Norwegian krone has depreciated by approximately 10 per cent in effective terms since the turn of the year.
The government's budget proposal for 2004 shows a government defi-cit in even greater conflict with Handlingsreglen (Guideline) than in 2002 and 2003. According to Handlingsreglen the structural non-oil budget deficit must be equivalent to the expected real return on the Petroleum Fund.
The 10 acceding countries The acceding countries have seen relatively robust growth, despite the international economic slowdown. However, growth declined in the 2nd quarter in Hungary, the Czech Republic, Slovakia, Slovenia and the Baltic states, while the expansion of the Polish economy, which started from a trough at the end of 2001, continued. On the other hand, the European Commission expects a significant deterioration of Poland's government budget deficit in 2004. Poland is definitely not the only acceding country with a large government budget deficit. The deficits of Hungary, Slo-vakia, the Czech Republic, Cyprus and Malta are also expected to consid-erably exceed 3 per cent of GDP in 2003 according to the Commission's estimates. The Czech Republic is the extreme case with an expected defi-cit of 8.0 per cent.
In September, both Estonia and Latvia approved EU membership in referendums. It has thus been finally resolved that all ten acceding coun-tries will become EU member states on 1 May 2004.
Argentina In September, Argentina concluded a new agreement with the Interna-tional Monetary Fund, IMF, on a new 3-year arrangement to borrow for a total of 12.5 billion dollars. Prior to the conclusion of the agreement Argentina had defaulted on a payment of 3 billion dollars to the IMF. This was the largest default in the IMF's history, and at the same time Argentina is the first major country to default on its obligations vis-à-vis the IMF.
In the IMF voting procedure on the new arrangement to borrow the Nordic-Baltic constituency and some other countries abstained. In the

12-12-2003 07:24 Antal sider: 22 Rev. nr. 2 H:\kvo\ENG\2003\4qtr\tiltryk\001-022.doc
Oprettet af Alice Colombo
15
opinion of the Nordic-Baltic constituency the arrangement did not meet a number of the important requirements which are normally imposed on countries facing an economic crisis. It is therefore questionable whether the arrangement will help to restore confidence among inter-national creditors and investors.
THE DEVELOPMENT IN THE DANISH FINANCIAL MARKETS
In the period under review the Danish krone has been stable at a level slightly stronger than the central rate in ERM II of kr. 7.46038 per euro. Danmarks Nationalbank intervened little in the foreign-exchange mar-ket. In September and October the foreign-exchange reserve decreased by kr. 1.5 billion to kr. 228.5 billion at the beginning of November.
On 8 September the Danish krone was included in the international currency settlement system, CLS Bank International. This system thus provides for settlement of transactions in 11 different currencies: the US, Canadian, Singapore and Australian dollars, the euro, the pound ster-ling, the Swiss franc, the Japanese yen, the Norwegian and Danish kroner and the Swedish krona. The increased number of currencies in CLS reduces the settlement risk in international foreign-exchange trad-ing. However, the operational risk is concentrated. An automated sys-tem for cross-border collateral between Denmark, Norway and Sweden has been developed to facilitate Scandinavian CLS participants' access to intraday liquidity in the Scandinavian currencies, cf. below on the Scan-dinavian Cash Pool, p. 23.
In the period under review, Danmarks Nationalbank did not adjust the lending rate, the current-account rate or the discount rate, cf. Chart 11. In mid-November, the lending rate thus remained at the level after the last interest-rate reduction in June, i.e. 2.15 per cent, while the current account rate and the discount rate were 2 per cent.
Long-term yields showed the same pattern as long-term yields in the USA and the euro area. The period thus began with an interest-rate decrease, which was replaced by an increase. For the period as whole, the level of interest rates was almost unchanged.
On 23 September, most of eastern Denmark experienced a power fail-ure for a few hours during the day. The power failure did not cause any major problems in the money market. In connection with the power failure, Danmarks Nationalbank contributed liquidity in the form of extraordinary repurchases of certificates of deposit.
In August the ECB announced that the maturity of monetary-policy loans in the euro area would be reduced from 14 to 7 days with effect from the tender on 9 March 2004. Danmarks Nationalbank has chosen to

12-12-2003 07:24 Antal sider: 22 Rev. nr. 2 H:\kvo\ENG\2003\4qtr\tiltryk\001-022.doc
Oprettet af Alice Colombo
16
retain a maturity of 14 days for its monetary-policy loans and certificates of deposit. This maturity has proved suitable for management of the liquidity in kroner, and the experience with Danmarks Nationalbank's monetary-policy instruments has generally been good.1
Lending by banks and mortgage-credit institutes increased by ap-proximately 6 per cent in 2003 against 2002, cf. Chart 12. Growth in lending to households has been almost two percentage points above average, while growth in lending to business enterprises has been a few percentage points below average.
The households' loans from banks and mortgage-credit institutes are not always used for consumption or investment in real assets. The households may choose to place the borrowed funds in financial assets such as securities and deposits. The recent relatively high growth in lend-ing to households may thus reflect some households' borrowing now for planned expenditure later.
A more complete picture of the households' loans and placements can be achieved by including other financial statistics, cf. Box 3. This shows that the increase in lending to households in the first two quarters of 2003 was almost offset by financial placements. In the 3rd quarter of 2003 the households' net financial savings decreased significantly against the 3rd quarter of 2002. This estimate of the households' net financial savings is subject to some uncertainty, but the decrease may be the first sign of acceleration in the households' consumption and hous-ing investments.
As from 1 October amended legislation allowed the mortgage-credit institutes to offer mortgage-credit loans where amortisation is deferred for up to 10 years. Deferred-amortisation loans can be fixed-rate or adjustable-rate loans. The deferred-amortisation period can be placed at the beginning of the loan's term or it can be selected or deselected as requested by the borrower. Deferred-amortisation loans can be re-financed by raising new deferred-amortisation loans. The deferred-amortisation period can thus be prolonged beyond 10 years. However, refinancing requires reassessment of the collateral by the mortgage-credit institute to ensure compliance with the loan limits.
The introduction of deferred-amortisation loans widens the range of products available to the consumers, which is positive. However, this makes greater demand on advice in order to give the borrower an over-view of the current and future financial situation.
1 Recent years' experience with the use of monetary-policy instruments in Denmark is described in the
article Use of Monetary-Policy Instruments, Danmarks Nationalbank, Monetary Review, 1st Quarter 2003.

12-12-2003 07:24 Antal sider: 22 Rev. nr. 2 H:\kvo\ENG\2003\4qtr\tiltryk\001-022.doc
Oprettet af Alice Colombo
17
INTEREST RATES IN DENMARK Chart 11
Source: DN database and EcoWin.
LENDING BY BANKS AND MORTGAGE-CREDIT INSTITUTES Chart 12
Note: Source:
Business includes non-financial and financial corporations, excluding monetary financial institutions. Danmarks Nationalbank.
1.0
1.5
2.0
2.5
3.0
3.5
4.0
4.5
5.0
5.5
Jul Aug Sep Oct Nov Dec Jan Feb Mar Apr May Jun Jul Aug Sep Oct Nov
Per cent
Discount rate Lending rate 3-month Cibor 10-year government bond yield
2002 2003
0
2
4
6
8
10
12
14
Households Business Total
Per cent, year-on-year
19991998 2000 2001 2002 2003

12-12-2003 07:24 Antal sider: 22 Rev. nr. 2 H:\kvo\ENG\2003\4qtr\tiltryk\001-022.doc
Oprettet af Alice Colombo
18
THE COMPILATION OF HOUSEHOLD LOANS AND PLACEMENTS Box 3
Danmarks Nationalbank currently publishes a range of monthly financial statistics
with a short delay. These statistics can be used for an early compilation of the loans
and placements of various sectors during the month.
The Chart shows the household sector's net financial savings broken down by major
components. The households primarily raise loans from banks and mortgage-credit
institutes (MFIs), where they also place a proportion of their savings as deposits. The
remainder of their financial savings is placed primarily in Danish and foreign securities
and in pension schemes via life assurance companies and pension funds.
HOUSEHOLDS' LOANS AN C Chart
Note: Source:
A negative value of "Loans from MFIs" indicates that the households have increased their loans. A positive value of "Deposits with MFIs" indicates that the households have increased their deposits. "Net purchases of securities, etc." includes the households' savings in pension schemes via life assurance companies and pension funds. The net financial savings are calculated here as the net item of the three bars. Danmarks Nationalbank.
The data on the households' accounts with MFIs stem from the MFI balance-sheet
statistics. Data on the households' net purchases of Danish and foreign securities are
based on Danmarks Nationalbank's securities statistics and statistics concerning finan-
cial payments to and from abroad. The households' savings via life assurance compa-
nies and pension funds are compiled as the household sector's own financial savings
in the form of net deposits with MFIs and net purchases of securities.
The monthly calculation in the Chart can in principle be made already on the 18th
banking day after the month covered by the statistics. As from the spring of 2004,
Danmarks Nationalbank will publish quarterly financial accounts of the total financial
assets and liabilities for the principal sectors of the economy. These accounts will be
based on a wider range of sources and provide a more comprehensive picture of the
loans and placements of each sector.
-40
-30
-20
-10
0
10
20
30
40
Loans from MFIs Deposits with MFIs Net purchases of securities, ect. Net financial savings
Kr. billion
Q1 2002 Q2 2002 Q3 2002 Q4 2002 Q1 2003 Q2 2003 Q3 2003
D PLA EMENTS

12-12-2003 07:24 Antal sider: 22 Rev. nr. 2 H:\kvo\ENG\2003\4qtr\tiltryk\001-022.doc
Oprettet af Alice Colombo
19
THE DANISH ECONOMY
The Danish economy was not unaffected by the international economic slowdown. After a small increase in the 1st quarter, GDP decreased by 0,6 per cent in the 2nd quarter. The decrease was particularly attribut-able to domestic demand, with e.g. declining business investments, but also private consumption receded in the 1st half of 2003. Exports were affected by weak cyclical development abroad, but nevertheless fared relatively well compared to other countries' exports. Manufactured ex-ports have thus gained market shares so far in 2003.
After the slowdown in the 1st half of 2003 the Danish economy now shows sign of an upswing. Growing turnover and imports of machinery, etc. indicate a rise in business investments, cf. Chart 13. Increasing retail sales furthermore indicate growth in private consumption. In July and August retail sales were higher than in the period May-June. Car sales also increased from the very low level of the spring, but have been stable recently. The national average of growth in house prices con-tinues to exceed growth in the consumer price index. In the Greater Copenhagen area, which had previously seen the strongest price in-creases, the price for one-family houses nevertheless decreased by a few per cent in the 3rd quarter. Higher disposable income and an expected improvement of the labour market support private consumption in a
MACHINERY AND EQUIPMENT INVESTMENTS IN DENMARK Chart 13
Source: Statistics Denmark.
10
14
18
22
26
30
70
80
90
100
110
120
Machinery and equipment investments
Sales to domestic market and imports of capital goods (right-hand axis)
Kr. billion January 2000 = 100
1995 1996 1998 2000 20021997 1999 2001 2003

12-12-2003 07:24 Antal sider: 22 Rev. nr. 2 H:\kvo\ENG\2003\4qtr\tiltryk\001-022.doc
Oprettet af Alice Colombo
20
forward-looking perspective. Finally, exports will benefit from an upturn in the international export markets.
There are indications that the adverse development in the labour mar-ket is coming to an end. The seasonally-adjusted unemployment rate did rise in September, but although the increase offsets the fall in July and August, the indications from the spring of accelerating unemployment no longer apply. One explanation of the declining unemployment in July and August is that unemployed who were not unemployed last year received holiday pay in their summer holiday rather than daily cash benefits, whereby they were excluded from the statistics. The increase in unemployment in September was thus not surprising.
According to Statistics Denmark's quarterly compilation of public fin-ances, the general-government budget balance has shown a decreasing trend in 2003, cf. Chart 14. The statistics are available up to and includ-ing the 2nd quarter. The deterioration of the budget balance is a strong reflection of the automatic response of public finances to a weakening of the taxation base concurrently with rising expenditure for the unem-ployed. Despite the constraint implemented in 2003, public consumption has also been higher than planned. In the 1st half of 2003 public con-sumption was 1.8 per cent stronger than in the 1st half of 2002. In view of the expansion by 2.1 per cent in 2002 it will be more than difficult to meet the target of an increase in public consumption by 2 per cent for 2002 and 2003 taken as one.
GENERAL GOVERNMENT BUDGET BALANCE IN DENMARK Chart 14
Source: Statistics Denmark.
0.0
0.5
1.0
1.5
2.0
2.5
3.0
3.5
Per cent of GDP
General government budget balance, 4-quarter moving average
2000 2001 2002 2003

12-12-2003 07:24 Antal sider: 22 Rev. nr. 2 H:\kvo\ENG\2003\4qtr\tiltryk\001-022.doc
Oprettet af Alice Colombo
21
The rising trend in the surplus on the current-account of the balance of payments continued in August and September. The surplus for the last 12 months was approximately kr. 36 billion in September, i.e. approxi-mately kr. 9 billion higher than in the preceding 12-month period. The increase is attributable to improvements in the balance of goods and services. Both imports and exports rose in September, and the increase in exports followed a pronounced decline in the preceding months. The improvement of the balance of payments and the declining government surplus in the 1st half of 2003 imply a clear increase in the private sec-tor's saving surplus. This increase can be regarded as an automatic cycli-cal reaction, as it reflects weak development in private consumption and investments, cf. the earlier remarks on the statistics on the private sec-tor's net financial placements.
The sluggish labour market is reflected in the pattern of prices and wages. The annual rate of wage increase within the Danish Employers' Confederation's area subsided throughout the year and was 3.6 per cent in the 3rd quarter.
Inflation measured by the HICP index has receded a little during the year. Recently, inflation has been subdued by declining growth in im-port prices as the effective krone rate increased, cf. Chart 15. HICP infla-tion was 1.7 per cent in September and 1.1 per cent in October. The fall from September to October primarily reflects lower indirect taxes on alcohol and cigarettes. Inflation in Denmark is thus still a little lower
PRICES AND EXCHANGE RATE FOR DENMARK Chart 15
Source: Statistics Denmark and own calculations.
-2
0
2
4
6
8
94
96
98
100
102
1041980 = 100
HICP Price index, imports Nominal effective exchange rate (right-hand axis)
20002000 20022001 2002 2003
Per cent, year-on-year

12-12-2003 07:24 Antal sider: 22 Rev. nr. 2 H:\kvo\ENG\2003\4qtr\tiltryk\001-022.doc
Oprettet af Alice Colombo
22
than inflation in the euro area. Nevertheless, the increase in the HICP excluding energy, food, alcohol and tobacco was 2.4 per cent in October in Denmark against 1.7 per cent in the euro area. Domestic market-determined inflation has overall shown a declining trend during 2003 to around 2 per cent, but rose to 2.5 per cent in October, cf. the Tables and Graphs Section. The principal factor contributing to the latest increase is that falling import prices did not fully lead to lower consumer prices for imported goods.

12-12-2003 07:25 Antal sider: 3 Rev. nr. 2 H:\kvo\ENG\2003\4qtr\tiltryk\023-025.doc
Oprettet af Lone Natorp
23
SCP – Scandinavian Cash Pool
SCP is an automated system for the pledging of cross-border collateral between Denmark, Norway and Sweden. The system was developed in order to facilitate the Scandinavian CLS1 participants' access to intraday liquidity in the Scandinavian currencies.
The main principle of SCP is that liquidity raised at the central bank of one country may be pledged as collateral for loans from the central bank of another country. The participant pledges collateral at the na-tional central bank by transferring liquidity to a special account that is pledged to the foreign central bank. The latter is notified automatically of the pledged amount and on that basis grants credit to the particip-ant. When the participant has repaid the loan to the foreign central bank, the national central bank is informed automatically that the col-lateral may be released, i.e. the amount on the pledged account is automatically transferred back to the participant's current account. SCP may only be used to pledge collateral for intraday credit. 2
SCP is based on existing structures and systems. The liquidity is raised at the national central bank according to national procedures and within national systems. The liquidity is pledged to the foreign central bank via an ordinary transfer between accounts in the national RTGS system. The communication between the central banks is automated and based on existing standards (SWIFT). This structure ensures that cross-border collateral can be pledged via SCP in less than one minute.
BACKGROUND TO AND USE OF SCP
The Scandinavian currencies became part of CLS in September 2003. As a consequence the requirements of the participants' procurement of li-quidity in these currencies have been expanded. Moreover, three of the Scandinavian participants have made a commitment to contribute to the CLS Liquidity Facilities in all three currencies, which means that they must be able to raise large amounts in one or several of the Scandin-
1 CLS (Continuous Linked Settlement) is an international foreign-exchange settlement system. For
further information, see Financial Stability, 2003 page 97. 2 For further information on SCP reference is made to www.nationalbanken.dk under Tasks/Payment
systems/Collateral. For a description of the legal basis for SCP, see Niels C. Andersen and Kirsten Gürt-ler, The Provision of Collateral to Danmarks Nationalbank in a Legal Perspective, Danmarks National-bank, Monetary Review, 3rd Quarter 2003.

12-12-2003 07:25 Antal sider: 3 Rev. nr. 2 H:\kvo\ENG\2003\4qtr\tiltryk\023-025.doc
Oprettet af Lone Natorp
24
avian currencies at short notice. CLS is the primary reason for the estab-lishment of SCP.
However, the use of SCP is not limited to CLS purposes, and the system is open to other than the CLS banks. For instance, SCP will make it pos-sible for banks with activities in more than one Scandinavian country to centralise the pledging of collateral and liquidity management in one country and nonetheless still cover their intraday liquidity requirements in the two other countries.
Today four of the five Scandinavian CLS participants also participate in SCP. During the first month after the Scandinavian currencies became part of CLS, SPC was primarily used to pledge collateral in Denmark in order to obtain intraday liquidity in Norway and Sweden. The explana-tion may be that the participants primarily hold their collateral in Den-mark, or that the payments to CLS are relatively larger in Sweden and Norway compared to the liquidity available in the country in question.
FOCUS ON CROSS-BORDER PLEDGING OF COLLATERAL
The establishment of CLS has generally increased focus on the possibility of pledging cross-border collateral. Particularly the large international banks are motivated by other factors besides CLS to require easier access to cross-border intraday liquidity. In March 2003 a task force under The Payments Risk Committee set up by the Federal Reserve Bank of New York with participants from 13 large international banks published a report on cross-border pledging of collateral and access to intraday liquidity.1
According to the report, the need for cross-border intraday liquidity is increasing. The internationalisation of the financial markets entails that banks increasingly operate beyond their domestic markets. The banks represented in the task force state that around half their payment activ-ities take place in foreign markets, and therefore they require cross-border liquidity. Over the years payment and settlement systems have moreover been introduced which in many ways enhance the overall security of the financial system, but which also make higher demands of the participants' liquidity procurement. CLS is only the most recent example.
The task force recommends that the central banks for the CLS cur-rencies to a larger extent accept securities denominated in foreign cur-rencies as collateral for intraday liquidity. In addition, the task force set
1 The Payments Risk Committee, Report by the Cross-border Collateral Pool Task Force, Managing
Payment Liquidity in Global Markets: Risk Issues and Solutions.

12-12-2003 07:25 Antal sider: 3 Rev. nr. 2 H:\kvo\ENG\2003\4qtr\tiltryk\023-025.doc
Oprettet af Lone Natorp
25
out a number of models for how the central banks might build up an infrastructure for the pledging of cross-border collateral. The models are described in the Box.
On the basis of the report, the opportunities and requirements for fa-cilitating access to cross-border liquidity are being discussed among the central banks. It is clear that in the first instance the need for a facility for pledging cross-border collateral is greatest among the large inter-national players participating in payment settlement in the USA, Europe and Asia. On the other hand, easier access to cross-border intraday liquidity may serve as an incentive to smaller banks to increase their international activities.
MODELS FOR PLEDGING CROSS-BORDER COLLATERAL Box
In the Risk Committee's report the proposed facilities for pledging cross-border collat-
eral are collectively referred to as Cross-border Collateral Pool Facilities. Three basic
models are described. For two of them different options are presented:
• Securities Collateral Pool: In this model, market participants would be able to utilise
foreign securities as collateral for intraday credit at a central bank. The report rec-
ommends an option where all central banks open custodian accounts with one or
perhaps two international central securities depositories (CSDs). A bank requesting
credit in a given currency transfers securities to the account of the relevant central
bank. The CSD notifies the central bank that securities have been pledged as collat-
eral, after which the central bank grants the credit.
• Cash Collateral Pool: In this model, market participants would be able to pledge
foreign currency to a central bank as collateral for intraday credit. One option en-
tails that all central banks open accounts with each other. A bank wishing to pledge
collateral in e.g. US dollars and obtain intraday credit in e.g. pounds sterling, trans-
fers dollars to the Bank of England's account at the Federal Reserve Bank. Against
collateral in this deposit the Bank of England provides credit in sterling. A drawback
of the Cash model is that it cannot be used if one of the central banks is closed.
• Central Bank Guarantee Model: This model is based on the central banks guaran-
teeing each other that collateral has been pledged, either as securities or cash.
When a bank has transferred the collateral to a special guarantee account at a cen-
tral bank, the central bank granting the intraday credit is notified. This model also
requires that the central banks are open at the same time.
The overall recommendation in the report is the establishment of a Securities Collat-
eral Pool. Securities and CSDs are well-known elements of the existing arrangements
for pledging collateral to central banks, and the model functions across time zones.
SCP is a combination of elements from the Cash Collateral Model and the Central
Bank Guarantee Model.


12-12-2003 07:26 Antal sider: 1 Rev. nr. 2 H:\kvo\ENG\2003\4qtr\tiltryk\027.doc Opret-
tet af Kristian Sparre Andersen
27
New Statistics Database at Danmarks Nationalbank's Website
On 29 October Danmarks Nationalbank added a new statistics database to its website, www.nationalbanken.dk. The database contains more than 10,000 time series on 8 different topics. The content of the data-base is expanded on an ongoing basis and by the beginning of 2004 will comprise 12 topics covering the entire spectrum of financial statistics published by Danmarks Nationalbank.
The new database supplements the ordinary statistical publications, comprising the "Nyt" series and the corresponding tables supplements, on the website. Within each topic the database will as a minimum con-tain all time series included in the publications, but in the longer term the database will include far more time series in the form of supple-mentary specifications of the main items of the statistics.
The database will not lead to any changes in the statistical publica-tions. The "Nyt" publications will still highlight and comment in more detail on the most significant development trends in order to support users' application of the statistics.
In future, the database will be updated simultaneously with the issue of the statistical publications.
The database is accessed by downloading predefined tables or by users defining tables with the required time series. In both cases it is possible to choose between different file formats and to indicate the period to be covered by the series. In addition, users have the option to save a search result for later use, e.g. when new data is released for the statis-tics covered by the search.


12-12-2003 07:29 Antal sider: 11 Rev. nr. 2 H:\kvo\ENG\2003\4qtr\tiltryk\029-039.doc
Oprettet af Josephine Rasmussen
29
Volatility in Inflation and Economic Activity in the Nordic Countries
Anders Møller Christensen and Niels Lynggård Hansen, Economics
INTRODUCTION
In recent years, the Nordic countries have been on different tracks in monetary policy. Finland participates in the single European currency, the euro, and Denmark pursues a fixed-exchange-rate policy vis-à-vis the euro. Both countries have thus given up their independent monetary policy to gain stable exchange-rate relations instead. Already in 1993 Sweden announced that an inflation target of 2 per cent would apply to monetary policy as from 1995, whereby the exchange rate would not be managed, but determined by market forces. In 2001, Norway applied an inflation target, but in practice the transition from the fixed-exchange-rate policy vis-à-vis a basket of currencies was gradual and took several years.
Monetary and exchange-rate policy are central elements of the overall economic policy. Based on the Nordic countries' different monetary-policy regimes this article compares the economic development in these four countries in certain areas where differences in monetary policy theoretically should emerge. An outline of the framework for stabilisa-tion policy, including monetary policy, is followed by an analysis of the movements in central macroeconomic variables in the Nordic countries. Finally, possible explanations are offered for differences in the devel-opment of these variables. Iceland is excluded from the analysis since its population is so much smaller than the other Nordic populations that for this reason alone its economy shows far greater fluctuation. In contrast, the other Nordic countries are relatively similar in size and enjoy so many common characteristics concerning the way society operates that a comparison makes sense.
The comparison shows that Denmark's economic performance in re-cent years has been more stable than that of the other Nordic countries. However, so many other factors besides economic policy have been part of the development that it is difficult to draw any firm conclusion from an analysis of this type. Such analyses are more useful for asking ques-

12-12-2003 07:29 Antal sider: 11 Rev. nr. 2 H:\kvo\ENG\2003\4qtr\tiltryk\029-039.doc
Oprettet af Josephine Rasmussen
30
tions than for providing unequivocal answers, but relevant questions make a good driving force for future analyses.
Bearing in mind these caveats one possible explanation is that medium-term orientation of fiscal policy and a consistent fixed-exchange-rate policy shield an economy from the domestic shocks at-tributable to short-sighted fiscal policy and exchange-rate fluctuations. At the same time, the automatic stabilisers of fiscal policy cushion a ma-jor proportion of the external shocks in an appropriate manner.
THE OPPORTUNITIES AND LIMITATIONS OF STABILISATION POLICY
Stabilisation policy is normally taken to mean economic policy designed to dampen the fluctuations in inflation and activity, cf. the Box, which describes a frequently used theoretical framework for stabilisation pol-icy. Monetary and fiscal policy are the most important forms of stabilisa-tion policy.
The level and development of the average standard of living depends primarily on productivity in the broader sense. Key issues in this connec-
A THEORETICAL FRAMEWORK FOR STABILISATION POLICY Box
The theoretical literature on stabilisation policy1 largely agrees that the long-term un-
employment level – or the long-term potential output level, i.e. the output level
compatible with stable price development in the medium term, cannot be influenced to
any significant extent by stabilisation policy. The latter determines whether inflation is
low or high on average, as well as the extent of deviation between actual and potential
output on the one hand and actual and average inflation on the other hand. More fun-
damental factors such as the long-term unemployment level are determined by struc-
tural factors.
To be more specific, current inflation is determined by historical inflation (+), ex-
pected future inflation (+), the deviation of output from the potential level, i.e. out-
put gap (+) and whether the exchange rate is weaker (+) or stronger than its equilib-
rium level. The signs in brackets signify the effect. The current output gap is deter-
mined by the output gap in preceding periods (+), expected output gap in coming
periods (+), whether the exchange rate is weaker (+) or stronger than its equilibrium
level and whether interest rates are lower (+) or higher than the so-called natural
level. Both inflation and the output gap are furthermore affected by shocks to the
economy. Other factors can also be considered, e.g. fiscal policy, which is regarded as
given and thus unaffected by the development in the variables analysed, i.e. inflation,
output gap, interest rates and exchange rate. The optimum course of interest rates
can be determined by adding a supplementary model for the exchange rate and
knowledge of the trade-off between the output gap and the deviation of inflation
from the desired level as perceived by the authorities. A less ambitious aim is to ana-
lyse the implications of various ways to determine interest rates.

12-12-2003 07:29 Antal sider: 11 Rev. nr. 2 H:\kvo\ENG\2003\4qtr\tiltryk\029-039.doc
Oprettet af Josephine Rasmussen
31
CONTINUED Box
Due to shocks and historical factors the output gap will always vary and inflation will
always deviate from the desired level. The model described here implies an immediate
contrast between the two considerations. The objective of the interest-rate policy is to
ensure a politically wanted trade-off between the two. The contrast disappears in the
longer term, so that only the choice between high or low inflation remains, while the
output gap continues to vary around zero.
The immediate trade-off between a low degree of volatility in the output gap and
a low degree of volatility in inflation around the desired level can be illustrated in a
so-called Taylor curve, cf. Chart 1. If the authorities attach great importance to stabili-
sation of inflation, they have to put up with a high degree of variability in the output
gap. This is the case if the central bank is an inflation nutter2. This corresponds to the
SIT point (Strict Inflation Target). It is necessary to accept very large unemployment fluc-
tuations in order to further stabilise inflation. Conversely, the more weight is attached
to keeping unemployment close to the sustainable level in the longer term, i.e. an out-
put gap close to zero, the more unstable inflation will be illustrated by the SOT point
(Strict Output-Gap Target). The FIT point (Flexible Inflation Target) describes a more
normal situation where both factors are considered important. The plotted curve shows
possible efficient outcomes. Basically, the position of the curve is determined by the
shocks to the economy. The smaller the shock, the more southwesterly the curve. A
credible and clear monetary policy is also believed to push the curve in this direction.
The points below the curve cannot be achieved using stabilisation-policy measures,
while points above and to the right of the curve reflect inefficient stabilisation policy.
From point A it is always possible to achieve improvements in one direction without any
costs pulling in the other direction.
TRADE OFF BETWEEN VARIABILITY IN INFLATION AND OUTPUT GAP Chart 1
1 A relatively informal review can be found in contributions to Rethinking Stabilization Policy, 2002, A Sympo-sium Sponsored by the Federal Reserve Bank of Kansas City. This Box is inspired particularly by Lars E.O. Svens-son's contribution, Monetary Policy and Real Stabilization, as well as several other contributions by the same author.
2 Mervyn King introduced the term in Changes in UK Monetary Policy: Rules and Discretion in Practice, Journal of Monetary Economics 39 (1997), pp. 81-97.
Inflation variability
FIT
SIT
SOT
*
*A
Ou
tpu
t-g
ap v
aria
bili
ty

12-12-2003 07:29 Antal sider: 11 Rev. nr. 2 H:\kvo\ENG\2003\4qtr\tiltryk\029-039.doc
Oprettet af Josephine Rasmussen
32
tion are the quality of the labour force, attitudes to change and compe-tition, management competencies in business enterprises, a well-defined legal framework, taxation rules and rules concerning receipt of transfer payments, market proximity, existing resources such as climate, physical capital stock and commodities and many other issues. Several factors, including structural policy, can impact on these fundamental issues.
In practice, there is no sharp distinction between stabilisation policy and structural policy. Any change of tax rules will thus affect both the short-term economic course by dampening or strengthening fluctuations and the long-term course by influencing the population's incentive to e.g. look for work or make purchases across national borders. Similarly, interest and exchange-rate fluctuations may have more long-term impli-cations for the dynamics in society, since they affect the realised as well as the expected future return on investment in real capital. Notwith-standing these caveats, a distinction between stabilisation policy and structural policy must be regarded as useful.
In Sweden and Norway, monetary policy is based on flexible inflation targeting regimes. Applying the theoretical framework outlined in the Box, this provides a good and politically desirable trade-off between the variability in inflation and in the output gap. According to this theoret-ical framework, a fixed-exchange-rate policy implies a less-than-optimum trade-off between the targets1, e.g. corresponding to point A in Chart 1.
EMPIRICAL EVIDENCE
Inflation measured as the rate of increase in the HICP, the Harmonised Index of Consumer Prices in Europe, and the output gap2 for the four Nordic countries since 1996 is shown in Chart 2. Table 1 shows lower variability in inflation, unemployment and output in Denmark than in the other Nordic countries3. Output variability was clearly lowest in Denmark, unemployment variability showed more similar patterns, with Denmark at the low end, while inflation variability in Denmark was only half the level in Sweden and Norway. Finland was somewhere in the middle.
The choice of period was determined by two factors. Firstly, the HICP began to be published in 1995, so it is not possible to calculate the infla-
1 Cf. Lars E.O. Svensson, Exchange Rate Target or Inflation Target for Norway, in Anne Berit
Christiansen and Jan Fredrik Qvigstad (ed.), Choosing a Monetary Policy Target, Oslo 1997 and p. 268 in the reference to the same author in the Box.
2 Defined as actual output less potential output as a percentage of potential output.
3 Assuming an independent normal distribution of inflation rates, the volatility in inflation in Denmark
is significantly lower than in Norway and Sweden.

12-12-2003 07:29 Antal sider: 11 Rev. nr. 2 H:\kvo\ENG\2003\4qtr\tiltryk\029-039.doc
Oprettet af Josephine Rasmussen
33
tion rate before January 1996. Secondly, the early 1990s represented a very turbulent period in Sweden and Finland, which would perform very poorly in a comparison including these years. Such a comparison would not account for the shift in economic policy that was initiated around 1993. Taking 1996 as the starting year means that the initial difficulties will not affect the results significantly.
Furthermore, it should be noted that the narrower price measures en-
tering monetary-policy making in Norway and Sweden show a lower
degree of variability than the HICP. Norway applies the KPI-JAE, i.e. the
consumer-price index adjusted for indirect taxes and energy products, as
HICP AND OUTPUT GAP, 1996-2003 Chart 2
Note: Source:
Output gaps for 2003 are OECD estimates. The most recent HICP observation is from October 2003. Eurostat and OECD, Economic Outlook 73.
STANDARD DEVIATION FOR THE PERIOD 1996-2003 Table 1
Denmark Finland Norway Sweden
HICP, per cent, year-on-year ............................ 0.53 0.78 1.02 0.90 Applied inflation target1, per cent, year-on-year ..................................................... .. .. 0.65 0.76 Output gap, per cent of GDP .......................... 0.67 2.13 1.08 1.83 Unemployment rate, change month-on-month .............................................
0.13 0.10 0.14 0.24
Source: Eurostat and OECD, Economic Outlook 73. 1 Norway applies the KPI-JAE, and Sweden applies the UND1X. The KPI-JAE is available only as from August 1999, and
the rate of increase is thus measured as from August 2000.
-0,5
0,0
0,5
1,0
1,5
2,0
2,5
3,0
3,5
4,0
4,5
-7
-6
-5
-4
-3
-2
-1
0
1
2
3Per cent, year-on-year Per cent of GDP
Finland
1996 1997 1998 1999 2000 2001 2002 2003-0,5
0,0
0,5
1,0
1,5
2,0
2,5
3,0
3,5
4,0
4,5
-7
-6
-5
-4
-3
-2
-1
0
1
2
3Per cent, year-on-year Per cent of GDP
Denmark
1996 1997 1998 1999 2000 2001 2002 2003
-0,5
0,0
0,5
1,0
1,5
2,0
2,5
3,0
3,5
4,0
4,5
-7
-6
-5
-4
-3
-2
-1
0
1
2
3Per cent, year-on-year Per cent of GDP
Norway
1996 1997 1998 1999 2000 2001 2002 2003-0,5
0,0
0,5
1,0
1,5
2,0
2,5
3,0
3,5
4,0
4,5
-7
-6
-5
-4
-3
-2
-1
0
1
2
3Per cent, year-on-year Per cent of GDP
Sweden
1996 1997 1998 1999 2000 2001 2002 2003
Output-gap (right-hand axis)HICP

12-12-2003 07:29 Antal sider: 11 Rev. nr. 2 H:\kvo\ENG\2003\4qtr\tiltryk\029-039.doc
Oprettet af Josephine Rasmussen
34
target variable in monetary policy. In Sweden, the UND1X, i.e. the con-
sumer price index adjusted for indirect taxes and interest expenditure
for owner-occupied housing, plays a significant role. However, the HICP
is the most expedient measure for a comparison of the course of infla-
tion in different countries, since this is the very purpose of the HICP. Denmark seems to have performed well. Moreover, the results are re-
markable. Denmark's monetary policy is oriented towards maintaining a fixed exchange rate vis-à-vis the euro, so it does not respond to inflation or unemployment unless the foreign-exchange conditions are affected1. As mentioned, the theoretical framework described in the Box predicts that a fixed-exchange-rate policy will ceteris paribus result in higher volatility in inflation and/or output than a policy such as flexible infla-tion targeting that directly aims at dampening these fluctuations.
POSSIBLE EXPLANATIONS
In principle, the results could be immediately explained if the Danish economy inherently fluctuates less than the other economies. However, there is no reason to believe that this is the case. In the 1970s Denmark showed a higher degree of volatility than Norway and Sweden, cf. Chart 3. By the applied measures Denmark has moved from second-last to number one during the period2. As mentioned, these countries have dominant common characteristics, so it is likely that other aspects than the inherent factors play a role.
Another immediate explanation could be that in the latest period the other countries were exposed to larger external shocks than Denmark. Bearing in mind the significance of oil-price fluctuations to Norway it is very difficult to specify these issues, let alone to demonstrate that Den-mark was less affected. The emergence and bursting of the IT bubble could be an explanation, although this implies that the IT sector plays a smaller role in Denmark than in the other countries, which is not indic-ated, even though the individual Danish companies are smaller than those in Sweden and Finland.
However, in general Denmark's exports tend to be less dependent on international business cycles than the exports of the other Nordic coun-tries. Danish exporters tend to lose market shares when world trade is growing rapidly, but tend to win market shares when world trade is growing on a modest scale or stagnating. This reflects a relatively strong
1 Danmarks Nationalbank, Monetary Policy in Denmark, 2003.
2 The HICP is not available for the 1970s. The general consumer price index, CPI, is used instead since it
roughly corresponds to the HICP.

12-12-2003 07:29 Antal sider: 11 Rev. nr. 2 H:\kvo\ENG\2003\4qtr\tiltryk\029-039.doc
Oprettet af Josephine Rasmussen
35
significance of products such as pharmaceuticals, wind turbines and food products that are to some degree independent of the general cyclical pattern. Nevertheless, exports of these products are exposed to a num-ber of specific shocks.
A more interesting hypothesis to explain the results is that Denmark's fiscal policy has been more appropriate. As described below, this is sup-ported by ample evidence. This does not, however, imply an activist fis-cal policy as the policy has primarily relied on the automatic stabilisers. If activity increases, tax revenue rises and expenditure for e.g. unemploy-ment benefit decreases. This improvement of public finances was not spent on tax cuts or increased government consumption. On the con-trary, it was used to boost the reduction of the government debt. A de-crease in activity implies the opposite pattern, whereby the debt reduc-tion slows down.
The fiscal policy pursued has thus not been discretionary, i.e. subject to amendment during the financial year, since the Whitsun Package of Economic Measures in 19981.
For a number of years the fiscal-policy stance has been determined when the finance bill for the coming year is presented in August, taking into account the expected economic development as well as compliance with medium-term objectives concerning reduction of government debt. Fiscal policy will often include certain structural-policy measures. If a tight labour market is expected, a certain tightening is planned, and if spare capacity is expected, a certain stimulus is planned. Fiscal policy
1 Financial Report 2002 (in Danish) (p. 65) finds a total of four cases of discretionary fiscal policy since
1980, i.e. 1982-83 (consolidation and transition to the fixed-exchange-rate policy after the change of government), 1986-87 (the Potato Package of Economic Measures), 1993 (kick-start after the change of government) and 1998 (the Whitsun Package of Economic Measures).
VARIABILITY IN OUTPUT GAP AND INFLATION, 1971-80 AND 1996-2003 Chart 3
Note: Source:
The variability is measured as the standard deviation. The output gap is based on annual data. CPI is based on monthly data. The most recent observation is from October 2003. OECD, Economic Outlook 73 and Main Economic Indicators.
0
1
2
3
4
5Per cent, year-on-year
CPI, annual growth
1971-1980 1996-2003
Denmark Finland Norway Sweden
0
1
2
3Per cent
Output gap
1971-1980 1996-2002

12-12-2003 07:29 Antal sider: 11 Rev. nr. 2 H:\kvo\ENG\2003\4qtr\tiltryk\029-039.doc
Oprettet af Josephine Rasmussen
36
then remains unchanged until next year. Denmark has possibly con-ducted a more consistently medium-term-oriented fiscal policy than many other countries, but not a more activist one. For a number of years, the so-called fiscal impulse has been within a rather narrow range around zero. This fiscal impulse is a key issue during the political nego-tiations on the Finance Act for the coming year and shows the immedi-ate impact on GDP from changes in the stance of fiscal policy.
A comparison of the discretionary fiscal policies of various countries can be achieved by applying the, at least superficially, simple method of assessing the changes in cyclically-adjusted budget balance1, cf. Table 2 and Chart 4. This indicates that among the Nordic countries Norway makes least use of discretionary fiscal policy, although Norway's cycli-cally adjusted budget balance has generally shown a deficit, which is not appropriate when output exceeds its potential level. Norway is followed by Denmark and Finland that show slightly greater absolute changes, but considerably below the level in Sweden. In so far as fiscal policy plays a role in the low variability in inflation and unemployment in Denmark, it can thus be argued that the relatively modest degree of activism and the underlying appropriate fiscal-policy stance have shielded the Danish economy from a number of the shocks which can easily be brought about by a more activist fiscal policy.
The exchange rate is another possible source of shocks to the eco-nomy. Table 2 and Chart 4 clearly show considerably stronger volatility in the effective exchange rate in Sweden and Norway than in Denmark and Finland. The effective exchange rate weighs together the individual exchange rates, reflecting their significance to foreign trade. Sweden and Norway experienced rather large fluctuations over relatively short periods. This means that exchange-rate fluctuations can have an abrupt effect on the competitiveness of companies and thus imply shocks to business sectors competing with abroad.
1 It must be emphasised that there are several methods to calculate the cyclically-adjusted budget
balance, cf. Allan Bødskov Andersen, Cyclically Adjusted Government Budget Balances, Danmarks Nationalbank, Monetary Review, 3rd Quarter 2002.
STANDARD DEVIATION FOR THE PERIOD 1996-2002 Table 2
Denmark Finland Norway Sweden
Average absolute change in cyclically- adjusted budget balance, per cent of GDP ..... 0.96 1.03 0.55 2.58 Nominal effective exchange rate1 ................... 2.02 3.23 4.50 6.44 Real effective exchange rate, based on CPI1 .. 2.71 3.62 4.16 5.51
Source: Own calculations and OECD, Economic Outlook 73. 1 Effective exchange rates are based on index 1995=100 and comprise the first 9 months of 2003.

12-12-2003 07:29 Antal sider: 11 Rev. nr. 2 H:\kvo\ENG\2003\4qtr\tiltryk\029-039.doc
Oprettet af Josephine Rasmussen
37
In Finland and Denmark there is no exchange-rate uncertainty for the major part of foreign trade due to Finland's participation in euro and Denmark's fixed-exchange-rate policy vis-à-vis the euro. This facilitates companies' planning in most markets. Since companies do not need to hedge against exchange-rate fluctuations, they can also save money. This stable planning environment may have contributed to less fluctua-tion in Denmark than in the other Nordic countries.
In theory, it is an unsolved issue whether a flexible exchange rate in economies such as the Nordic economies acts as a stabiliser or a source of instability. If a country with a flexible exchange rate unilaterally re-duces interest rates, the exchange rate will normally tend to weaken, implying that both competitiveness and domestic demand will provide a stimulus. This is preferable when lower interest rates are to stimulate the economy. However, in practice the exchange rate has often moved in the opposite direction. Other countries' actual or expected interest-rate changes will also affect the exchange rate, causing it to fluctuate when fluctuation is considered inappropriate. Against the background of the significance of capital flows to the foreign-exchange market and thus to flexible exchange rates, the exchange rate can fluctuate consid-erably in a very short time irrespective of the real economic develop-ment. This implies a shock to the economy. The answer to the question
CYCLICALLY-ADJUSTED BUDGET BALANCE, EFFECTIVE EXCHANGE RATE AND OUTPUT GAP, 1996-2003 Chart 4
Note: Source:
The output gap and the cyclically-adjusted budget balance are calculated by the OECD and include OECD esti-mates for 2003. Own calculations and OECD, Economic Outlook 73.
-6
-4
-2
0
2
4
6
85
90
95
100
105
110
115Per cemt of GDP 1995 = 100
Denmark
1996 1997 1998 1999 2000 2001 2002 2003-6
-4
-2
0
2
4
6
85
90
95
100
105
110
115Per cent of GDP 1995 = 100
Finland
1996 1997 1998 1999 2000 2001 2002 2003
-6
-4
-2
0
2
4
6
85
90
95
100
105
110
115Per cent of GDP 1995 = 100
Norway
1996 1997 1998 1999 2000 2001 2002 2003-6
-4
-2
0
2
4
6
85
90
95
100
105
110
115Per cent of GDP 1995 = 100
Sweden
1996 1997 1998 1999 2000 2001 2002 2003
Nominal effective exchange rate (right-hand axis)Output gap Cyclically-adjusted budget balance

12-12-2003 07:29 Antal sider: 11 Rev. nr. 2 H:\kvo\ENG\2003\4qtr\tiltryk\029-039.doc
Oprettet af Josephine Rasmussen
38
of whether the exchange rate acts as a stabiliser will thus depend on who is asked, what time horizon is used and how the alternative of a fixed exchange rate is perceived1.
In principle, Denmark's greater stability may also be the result of poor conduct of monetary policy in Sweden and Norway. However, nothing supports that this is the case. Observers praise Sveriges Riksbank and Norges Bank as some of the most competent central banks applying inflation targeting in monetary policy even in a global perspective2. We consider this a correct assessment. On the other hand, it implies that the theoretical framework set out in the Box, which does not include fiscal policy as an integral part of stabilisation policy, is too simple. It is thus problematic to transfer conclusions on appropriate monetary-policy re-gimes from the theoretical model to small open economies in the real world.
CONCLUSION
We have taken a look at the volatility in inflation and output in the Nordic countries in recent years. The volatility has been less pronounced in Denmark than in the other countries, which is out of line with the predictions of the standard models for monetary-policy analysis. Irre-spective of the extent of adherence to theoretical modelling the results pose some questions. We will attempt to give preliminary answers pri-marily as regards aspects of relevance to the discussions of economic policy in small, open economies. At the same time, we wish to emphasise that this should by no means be taken as proof.
We find a far greater number of similarities than differences between the Nordic countries, which are furthermore exposed to roughly the same external influences. A comparison thus makes sense. It is also nat-ural in this connection to look at differences between the Nordic coun-tries' stabilisation-policy regimes as important elements to explain the results.
A common feature is that a large number of external shocks can be absorbed by the automatic stabilisers in fiscal policy. This works well in most situations. The stabilisers are of almost equal strength in all Nordic countries.
1 The argument that the exchange rate primarily causes shocks can be found in e.g. Willem H. Buiter,
Optimal Currency Areas: Why Does the Exchange-Rate Regime Matter?, Scottish Journal of Political Economy, 2000. The opposite view that free exchange-rate movements have a stabilising effect can be traced back to Milton Friedman, The Case for Flexible Exchange Rates, in Essays in Positive Eco-nomics, University of Chicago Press, 1953. This has had a strong intellectual influence on the case for flexible exchange rates, cf. several contributions at a conference held by the Bank of Canada in 2000 with the title Revisiting the Case for Flexible Exchange Rates (www.bankofcanada.ca).
2 Cf. e.g. p. 303 in the reference in the Box.

12-12-2003 07:29 Antal sider: 11 Rev. nr. 2 H:\kvo\ENG\2003\4qtr\tiltryk\029-039.doc
Oprettet af Josephine Rasmussen
39
The Nordic countries have different active stabilisation-policy regimes, on the other hand. The review indicates that most major shocks to small, open economies like the Nordic economies are in reality "home made", i.e. due to a too activist fiscal or monetary policy or to exchange-rate fluctuations. In other words, the need for activist stabilisation policy is generally limited, and policy can normally be set within an annual plan-ning framework including the expected cyclical development in the com-ing years. A more activist stabilisation-policy stance will probably lead to instability. Naturally, it cannot be ruled out that active fiscal-policy measures are necessary in certain situations.
In general, medium-term orientation of fiscal policy with a view to debt reduction without any major discretionary adjustments of the fiscal-policy stance from one year to the next will prevent volatility in output and in-flation. This also enhances the credibility of a fixed-exchange-rate policy.
A consistent fixed-exchange-rate policy vis-à-vis the euro anchors infla-tion at a level corresponding to the ECB's definition of price stability. In countries with a flexible-exchange-rate policy the exchange rate often generates inappropriate shocks to the economy.
Another source of shocks is major structural reforms. Some reforms, such as liberalisation of the mortgage-credit market, have an immediate expansionary impact on the economy, while others, such as reduction of the tax rate for deductions on interest paid, have a contractive effect. The embedded volatility can be limited by considering these shocks in fiscal-policy planning and by implementing reforms in a suitable order.
Finally, a discussion of concepts such as the optimum monetary-policy regime that does not include the fiscal-policy framework does not make much sense. The result of such analyses is of limited practical importance to economic policy in small, open economies.


12-12-2003 07:32 Antal sider: 12 Rev. nr. 2 H:\kvo\ENG\2003\4qtr\tiltryk\041-052.doc Opret-
tet af Borka Babic
41
Inflation Differentials in the Euro Area
Borka Babic, Economics
INTRODUCTION
Inflation varies considerably across the euro area member states with low inflation in Germany and inflation significantly above average in a number of small member states such as Ireland. The inflation differen-tials among the 12 member states became an important issue in connec-tion with the transition to the third stage of EMU in January 1999 since the objective of the single monetary policy is to achieve price stability in the euro area taken as one without considering inflation differentials among the individual member states. It is therefore interesting to ob-serve the development of the differentials since the beginning of 1999, and to examine their possible causes. Whether the differentials will pose a problem very much depends on their underlying factors.
In some cases, inflation differentials entail no problems for the economy. In a monetary union where monetary and foreign-exchange policy cannot be used for stabilisation purposes in the individual mem-ber states, changes in relative prices (and thus inflation differentials) may be necessary for adjustment to asymmetrical shocks. In addition, inflation differentials may be the result of real-economic convergence with high growth rates in member states with low income levels, which can thus catch up with the rich member states. Differences in the mem-ber states' cyclical positions can also lead to inflation differentials with-out causing problems.
On the other hand, inflation differentials can be source of concern if they reflect inappropriate economic policy, wage increases out of line with productivity, bubbles in the stock market or the housing market, etc.
Furthermore, inflation differentials are of significance to monetary policy. As mentioned a single monetary policy applies in EMU where no special account can be taken of developments in individual member states. As a result, monetary policy may seem too expansionary in mem-ber states with high capacity utilisation and inflation above the EMU average. Conversely, monetary policy may seem too contractive in mem-ber states with relatively low inflation and available capacity.

12-12-2003 07:32 Antal sider: 12 Rev. nr. 2 H:\kvo\ENG\2003\4qtr\tiltryk\041-052.doc Opret-
tet af Borka Babic
42
ARE THERE INDICATIONS OF CONVERGENCE OF INFLATION RATES?
Inflation in the euro area rose during 1999 and 2000 and has remained almost unchanged since then. The pattern of average inflation in the euro area covers considerable variations across the member states, cf. Chart 1. The lowest inflation rate has been around 1 per cent year-on-year, while the highest has been approximately 4-5 per cent year-on-year in recent years. The large member states – which have the greatest weights in the calculations of average inflation – experienced low inflation. It follows that inflation in the euro area is closer to the lowest than to the highest inflation rate.
Inflation differentials can be measured in several ways. The following three simple measures have been calculated monthly since 1997: un-weighted standard deviation, weighted standard deviation (this meas-ure takes into account the size of the member state, whereby large member states have a greater weight in the calculations)1, and the un-weighted coefficient of variation, i.e. unweighted standard deviation divided by average inflation (according to this measure an increase in the deviation occurring simultaneously with – and proportionally to – a rise in average inflation will not entail greater divergence).
1 The weights applied by Eurostat to the calculation of inflation for the euro area are applied here.
INFLATION IN THE EURO AREA Chart 1
Note: Source:
Inflation measured in terms of HICP. The lowest/highest inflation shows inflation for each month in the member state with the lowest/highest inflation rate. EcoWin and own calculations.
-2
-1
0
1
2
3
4
5
6
7
8
Euro area Lowest inflation Highest inflation
1997 1998 1999 2000 2001 2002 2003
Per cent, year-on-year

12-12-2003 07:32 Antal sider: 12 Rev. nr. 2 H:\kvo\ENG\2003\4qtr\tiltryk\041-052.doc Opret-
tet af Borka Babic
43
In 2003 unweighted as well as weighted standard deviations have been almost on a par with the level at the transition to the third stage of EMU, cf. Chart 2. By these two measures, divergence declined through-out 1999, but increased in 2000 and has remained almost unchanged since then. The coefficient of variation decreased throughout 1999 and has remained almost unchanged since then. As opposed to the standard deviation, the coefficient of variation did not rise during 2000 since the increase in divergence measured in terms of standard deviation occurred simultaneously with the increase in average inflation in the euro area.
Throughout the entire period several member states experienced higher than average inflation rates in both weighted and unweighted terms: Ireland, the Netherlands, Greece, Portugal and Spain, cf. Chart 3. In Germany, on the other hand, inflation was below average. The high-inflation member states are considerably smaller than Germany, and consequently weighted average inflation in the euro area is lower than unweighted average inflation. In the member states with high inflation, the deviations from weighted inflation are therefore greater than the deviations from unweighted inflation, while the opposite applies to member states with inflation rates below average.
Since 1999, the number of member states deviating strongly from the weighted average has increased. In the 1st half of 2003, 4-6 member states deviated from the weighted average by more than 1 percentage point, cf. Chart 3.
INFLATION DIFFERENTIALS IN THE EURO AREA, PER CENT Chart 2
Note: Source:
Inflation measured in terms of HICP. EcoWin and own calculations.
0.0
0.2
0.4
0.6
0.8
1.0
1.2
1.4
1.6
Unweighted standard deviation Weighted standard deviation Coefficient of variation
1997 1998 1999 2000 2001 2002 2003

12-12-2003 07:32 Antal sider: 12 Rev. nr. 2 H:\kvo\ENG\2003\4qtr\tiltryk\041-052.doc Opret-
tet af Borka Babic
44
Development in the individual HICP components The analysis of the subcomponents shows that energy and unprocessed food contribute a great deal to the inflation differentials, cf. Chart 4. The divergence in price increases for energy products rose considerably during 1999 and at the beginning of 2000 when energy prices increased strongly and the euro depreciated. The divergence has subsided a little since then.
In addition, the inflation differentials across the member states are greater for services than for non-energy industrial goods. Low diver-gence in prices for industrial goods reflects strong cross-border compe-tition via trade in goods. This is not least the case in Ireland, which showed the highest price increases in overall terms, but, unlike other high-inflation member states, a lower price increase for industrial goods than the average for the euro area. The high inflation can be attributed solely to strong price increases in the service sector. Inflation in the service sector was lowest in Germany and France. The pattern of inflation differentials in the service sector can reflect varying cyclical
DEVIATIONS FROM INFLATION IN THE EURO AREA Chart 3
Note: Source:
AT: Austria, BE: Belgium, DE: Germany, ES: Spain, FI: Finland, FR: France, GR: Greece, IE: Ireland, IT: Italy, LU: Luxembourg, NL: Netherlands, PT: Portugal. Inflation measured in terms of HICP. The right-hand panel shows the number of member states whose inflation rate deviates from the average by more than 1 percentage point (in weighted terms). EcoWin and own calculations.
INFLATION DIFFERENTIALS FOR HICP SUBCOMPONENTS Chart 4
Note: Source:
Inflation differentials measured as unweighted standard deviation. Eurostat and own calculations.
0
1
2
3
4
5
6
7
8
9
1997 1998 1999 2000 2001 2002 2003
Number of member states with high/low inflation
-1.5
-1.0
-0.5
0.0
0.5
1.0
1.5
2.0
2.5
AT BE DE ES FI FR GR IE IT LU NL PTWeighted deviation, 1999-2002 Unweighted deviation, 1999-2002
Percentage points
0
1
2
3
4
5
6
1997 1998 1999 2000 2001 2002 2003
Unprocessed food Processed food
0
1
2
3
4
5
6
1997 1998 1999 2000 2001 2002 2003
Services Non-energy industrial goods Energy

12-12-2003 07:32 Antal sider: 12 Rev. nr. 2 H:\kvo\ENG\2003\4qtr\tiltryk\041-052.doc Opret-
tet af Borka Babic
45
positions, different degrees of flexibility in the labour market or real convergence. Comparison with other countries A comparison with the USA, where inflation differentials are measured across 14 Metropolitan Statistical Areas, shows slightly higher inflation differentials across the euro area members states, cf. Chart 5. However, the inflation differentials among the EMU member states are consider-ably greater than the inflation differentials between the regions/states in Germany, Italy and Spain.1 In terms of size and heterogeneity the euro area resembles the USA rather than any individual euro area member state, so some inflation differentials can be assumed always to exist.2
UNDERLYING REASONS FOR INFLATION DIFFERENTIALS
Whether inflation differentials present a problem depends on their causes, among other factors. Some of the causes are reviewed here to-gether with an assessment of the role of the individual factors in the development in inflation differentials in the euro area.
1 Cf. ECB (2003b).
2 The variations in the divergence between the USA on the one hand and Germany, Italy and Spain on
the other can be explained by e.g. stronger growth differentials across the regions in the USA. Fur-thermore, fiscal policy is considerably more decentralised in the USA than in the individual euro area member states. The countries' sizes probably also play a role.
INFLATION DIFFERENTIALS IN THE EURO AREA AND THE USA, PER CENT Chart 5
Note: Source:
Inflation differentials measured as unweighted standard deviation. EcoWin, US Bureau of Labor Statistics and own calculations.
0.0
0.2
0.4
0.6
0.8
1.0
1.2
1.4
1.6
USA Euro area
1997 1998 1999 2000 2001 2002 2003

12-12-2003 07:32 Antal sider: 12 Rev. nr. 2 H:\kvo\ENG\2003\4qtr\tiltryk\041-052.doc Opret-
tet af Borka Babic
46
Price level convergence Price level differentials and price-level convergence can possibly explain the divergence in the inflation patterns. Member states with a relatively low price level have a higher than average inflation rate and will thus catch up with countries with a higher price level. Convergence in traded-goods price levels can be expected as a consequence of increased inte-gration. Convergence in prices for non-traded goods can be explained by real-economic convergence. The Balassa-Samuelson effect is often mentioned in this connection. According to the Balassa-Samuelson ef-fect, member states with low income and productivity levels see stronger productivity growth in the traded-goods sector, whereby they will catch up with the more affluent countries. Productivity increases in the traded-goods sector not only lead to higher wages in the sector, but also impact on the non-traded-goods sector. The result is higher prices for non-traded goods and thus higher inflation which in this case does not reflect a deterioration of competitiveness.
There is a negative correlation between the price level in 1998 and av-erage inflation in the period 1999-2002, cf. Chart 6.1 This means that the member states with a low price level at the beginning of the period (Por-tugal, Greece and Spain) have seen higher inflation and vice versa. How-ever, high inflation was observed in Ireland and the Netherlands despite a price level close to the average.2 As mentioned, price-level convergence can be a result of convergence in income levels. Chart 6 shows a weak negative correlation between inflation and GDP per capita.
1 Measured in terms of standard deviation (unweighted) the price differentials were reduced from
0.13 in 1998 to 0.11 in 2002. 2 Hufbauer and Wada (2001) find a negative correlation between inflation in 2000 and the price level
in 1999. According to the study a country with a price level 10 per cent lower than average will have an inflation rate that is 0.5 percentage points higher than average. According to the study, price-level differentials can explain only around 13 per cent of the variation in inflation rates.
INFLATION AND PRICE AND INCOME LEVELS Chart 6
Note: Source:
AT: Austria, BE: Belgium, DE: Germany, ES: Spain, FI: Finland, FR: France, GR: Greece, IE: Ireland, IT: Italy, LU: Luxembourg, NL: Netherlands, PT: Portugal. Inflation measured in terms of HICP excluding energy and unproc-essed food, as the average for the period 1999-2002. The price level and GDP are from 1998 measured in relation to the EU average. Eurostat and EcoWin.
Inflation and income level
0
1
2
3
4
5
0.6 0.8 1.0 1.2 1.4 1.6 1.8 2.0
PT
GR ES IT
IE
NL
LUFI
BE
ATFR
DE
Inflation, per cent
Relative GDP per capita
Inflation and price level
0
1
2
3
4
5
0.6 0.7 0.8 0.9 1.0 1.1 1.2
PTGR
ES
IT
IE
NL
LU
FI
BE AT FR
DE
Inflation, per cent
Relative price level

12-12-2003 07:32 Antal sider: 12 Rev. nr. 2 H:\kvo\ENG\2003\4qtr\tiltryk\041-052.doc Opret-
tet af Borka Babic
47
Several empirical studies have assessed the role of the Balassa-Samuelson effect in inflation patterns. Table 1 shows the estimated inflation differ-entials according to this effect as well as the actual differentials. The Table shows that actual inflation differentials were generally somewhat higher than the hypothetical inflation differentials. High inflation in Greece and to some extent in Portugal and Spain can be explained by the Balassa-Samuelson effect. Among the low-inflation member states, the model can be applied to Germany.
There are still considerable variations in price levels for both non-traded and traded goods in the euro area. The price variations can be explained by indirect taxes, distribution-channel structures, the competi-tive environment, etc. Increased integration should ceteris paribus lead to price convergence and thus inflation differentials. The low price and income levels in the accession countries will probably lead to higher in-flation differentials in the euro area, once the accession countries have qualified for EMU membership.
Cyclical position The individual member states are at various cyclical stages which also contributes to explaining the divergence in price developments. In periods with higher output than the potential level the member state in question would typically be subject to inflationary pressure and vice versa. Chart 7 shows a positive correlation between the output gap and inflation. Ireland accounted for the highest inflation rate and the widest positive output gap, and in the Netherlands, a correlation between a strong cyclical position and relatively high inflation can also be ob-served. Germany at the other end showed both the lowest inflation and the narrowest output gap. Differentials in employment and wage pat-terns, wage drift and growth in lending also support the hypothesis that inflation differentials are attributable to e.g. cyclical factors.
The fiscal-policy stance is of significance to the inflation differential pattern. Expansionary fiscal policy tends to stimulate growth and thus
INFLATION DIFFERENTIALS ACCORDING TO THE BALASSA-SAMUELSON EFFECT (BS) AND ACTUAL INFLATION DIFFERENTIALS Table 1
BE DE GR ES FR IE IT NL AT PT FI
BS 0.6 -0.6 1.6 0.5 0.1 1.3 0.5 0.1 0.2 0.7 0.5 Actual -0.1 -0.8 1.4 1.2 -0.4 2.5 0.5 1.2 -0.2 1.7 0.4
Note: AT: Austria, BE: Belgium, DE: Germany, ES: Spain, FI: Finland, FR: France, GR: Greece, IE: Ireland, IT: Italy, LU:Luxembourg, NL: Netherlands, PT: Portugal. BS is calculated by the ECB as the average of the following studies:Alberola and Turväinen (1998), IMF (1999), Canzoneri et al. (2001), De Grauwe & Skudelny, Sinn & Reutter (2001). The studies cover various periods between 1960 and 1997. Actual inflation differentials are averages forthe period 1999-2002. Inflation is measured in terms of HICP excluding energy and unprocessed food.
Source: ECB (2003b), Eurostat.

12-12-2003 07:32 Antal sider: 12 Rev. nr. 2 H:\kvo\ENG\2003\4qtr\tiltryk\041-052.doc Opret-
tet af Borka Babic
48
impact on the output gap. This can affect inflation. However, there is no unequivocal correlation between fiscal policy and inflation. Ireland's fiscal policy was expansionary during this period which probably con-tributed to the high inflation rate, but Germany's almost equally expan-sionary fiscal policy did not prevent low inflation since Germany had idle resources. Asymmetrical shocks A varying degree of dependence on oil can lead to strong deviations in inflation rates across the member states in periods of large changes in oil-prices e.g. in 1999 and 2000, cf. Chart 8 and the section on develop-ment in the HICP subcomponents. There is no strong correlation be-tween the member states' dependence on oil (measured in terms of net imports as a ratio of GDP) and inflation in the period 1999-2002.1 Among the high-inflation member states Greece and Portugal are strongly de-pendent on oil. The weak correlation between inflation and the mem-ber states' dependence on oil can be explained by various administrative measures to counter the effect of energy prices on the consumer-price index.
The euro depreciated strongly in the period 1999-2000. Exchange-rate fluctuations can have a varying impact on the individual member states since some are more dependent on extra-euro area imports than others, cf. Chart 8.2 Ireland, the Netherlands and Belgium are the most open member states measured as the ratio of extra-euro area imports to GDP.
1 See ECB (2003b).
2 Honohan and Lane (2003) find that exchange-rate fluctuations have a considerable impact on infla-
tion differentials. According to their empirical survey, a relative depreciation of the nominal effective change rate by 3.5 per cent leads to an inflation differential of 1 percentage point. In the period 1998-2000 Ireland's nominal effective exchange rate depreciated by 11 per cent, while France's de-preciated by only 4 per cent.
INFLATION, OUTPUT GAP AND BUDGET BALANCE, PER CENT Chart 7
Note: Source:
AT: Austria, BE: Belgium, DE: Germany, ES: Spain, FI: Finland, FR: France, GR: Greece, IE: Ireland, IT: Italy, LU: Luxembourg, NL: Netherlands, PT: Portugal. Inflation measured in terms of HICP excluding energy and unproc-essed food. Inflation and output gap are averages for the period 1999-2002. Change in the cyclically adjusted budget balance (CAB) is calculated as the difference between the CAB in 2002 and 1998. Eurostat and EcoWin.
Inflation and cyclically adjusted budget balance
0
1
2
3
4
5
-6 -4 -2 0 2 4Change in CAB
PTGR
ES IT
IE
NLFI
BEAT
FR
DE
Inflation Inflation and outpout gap
0
1
2
3
4
5
0 1 2 3 4 5Output gap
PTGR
ES
IT
IE
NL
LUFIBE
AT FR
DE
Inflation

12-12-2003 07:32 Antal sider: 12 Rev. nr. 2 H:\kvo\ENG\2003\4qtr\tiltryk\041-052.doc Opret-
tet af Borka Babic
49
As Table 2 shows, the contribution from increases in import costs is con-siderable in Ireland and Belgium, while the contribution from import costs to total inflation in the Netherlands is not particularly large. The inflation increase in Belgium was nevertheless moderate due to changes in administrative prices, which offset the effect of strong import infla-tion. The effect of the euro's latest appreciation is not yet visible in in-flation to any significant extent.
The product and labour markets in the euro area are characterised by a low degree of flexibility in prices and wages, so that adjustment to shocks is slow, particularly if a downward adjustment is required. Struc-tural labour-market reforms are a current topic in several member states. Structural reform will no doubt reduce inflation differentials in the long term, but may increase inflation differentials in the short term unless they are implemented simultaneously in all member states. Other reasons Inflation differentials can also be attributed to other factors such as changes in administrative prices and indirect taxes, etc. The Netherlands is the euro area member state where changes in indirect taxes contrib-uted most to inflation in this period.
INFLATION AND OPENNESS Chart 8
Note: Source:
AT: Austria, BE: Belgium, DE: Germany, ES: Spain, FI: Finland, FR: France, GR: Greece, IE: Ireland, IT: Italy, LU: Luxembourg, NL: Netherlands, PT: Portugal. The right-hand panel shows changes in inflation in the period 1999-2002. Inflation measured in terms of HICP excluding energy and unprocessed food. Extra-euro area imports measured as a ratio of GDP on average for 2000-01. Eurostat, EcoWin and Honohan and Lane (2003).
ANNUAL CHANGES IN THE FINAL DEMAND DEFLATOR (FDD) AND CONTRIBUTION FROM IMPORT COSTS (IC) Table 2
BE DE GR ES FR IE IT NL AT PT FI
FDD 2.3 0.9 3.2 3.3 1.0 4.2 2.3 3.1 1.1 3.3 1.3 IC 1.6 0.8 0.8 1.1 0.5 2.2 0.9 1.3 1.1 0.7 0.5
Note: AT: Austria, BE: Belgium, DE: Germany, ES: Spain, FI: Finland, FR: France, GR: Greece, IE: Ireland, IT: Italy, LU: Luxembourg, NL: Netherlands, PT: Portugal. Average annual change in the final demand deflator in the period 1999-2002. IC is the contribution from import costs.
Source: ECB (2003b)
Inflation and extra-euro area imports
0
10
20
30
40
50
60
70
AT BE DE ES FI FR GR IE IT LU NL PT
0.0
0.5
1.0
1.5
2.0
2.5
3.0
Per cent
Imports from outside EMU Inflation (right-hand axis)
Per cent of GDPOil price and exchange rate
0
5
10
15
20
25
30
35 80
85
90
95
100
105
110
115
Oil price (Brent) Nominal effective exchange rate (right-hand axis)
Dollars per barrel Index (inverse)
1997 1998 1999 2000 2001 2002 2003
12-12-2003 07:32 Antal sider: 12 Rev. nr. 2 H:\kvo\ENG\2003\4qtr\tiltryk\041-052.doc Opret-
tet af Borka Babic
50
CONCLUSION
Inflation differentials are almost the same as at the beginning of 1999. Throughout the period inflation has been higher than average in Ire-land, the Netherlands, Greece, Portugal and Spain. Germany, on the other hand, has shown low inflation. The number of member states with a relatively strong deviation from the average was on the increase until recently. The analysis of the subcomponents shows that energy espe-cially contributes to divergence. Furthermore, as expected, the service sector shows greater inflation divergence than manufacturing industry (excluding energy). Since most factors that have contributed to the infla-tion differentials since the start of EMU continue to exist, some inflation differentials can be assumed always to exist. This is supported by the USA's experience.
However, this complex issue cannot be completely illuminated by the partial analysis of the causes of inflation differentials applied here. Nevertheless, the analysis provides for important conclusions. Deviation of inflation from the average can be attributed to various factors in the relevant member states. The most important factor in the three member states with the lowest income level, i.e. Portugal, Spain and particularly Greece, is price and income convergence, including the Balassa-Samuelson effect. In the Netherlands and Ireland, on the other hand, cyclical factors played a significant role. In addition, among the euro area member states changes in indirect taxes contributed most to infla-tion development in the Netherlands, and in Ireland exchange-rate fluc-tuations probably also contributed to the high inflation rate. Germany's low inflation can be attributed to cyclical factors especially, but pre-sumably also to real-economic convergence.
If a relatively high inflation rate is attributable to price and income convergence or cyclical adjustment, it presents no problem. These factors have played a significant role, as explained above, but can hardly ac-count for the entire development. The rigidities in the labour market entailed slow adjustment to shocks such as the oil-price increases in 1999-2000 and thus also contributed to the differentials. The structural reforms to increase the flexibility in the labour and product markets will provide for smoother adjustment to shocks. Another adjustment option is to implement a more consistent stability-oriented fiscal policy. The automatic stabilisers should thus be allowed to work and it should be possible to adjust fiscal policy more actively if there are prospects of overheating or high unemployment.

12-12-2003 07:32 Antal sider: 12 Rev. nr. 2 H:\kvo\ENG\2003\4qtr\tiltryk\041-052.doc Opret-
tet af Borka Babic
51
REFERENCES
Alberola, E. and T. Tyrväinen (1998), Is there Scope for Inflation Differ-entials in EMU? An Empirical Evaluation of the Balassa-Samuelson Model in EMU Countries, Bank of Finland Discussion Paper, 15/98.
Arnold, I.J.M. and C.J.M. Kool (2002), The role of inflation differentials in regional adjustment: Evidence from the United States, University of Rot-terdam and Maastricht, mimeo.
Duarte, M. and A.L. Wolman (2002), Regional inflation in a currency union: Fiscal policy vs. fundamentals, ECB, Working Paper no. 180.
Canzoneri, M., Cumby, R., Diba, B. and G. Eudey (2001), Productivity Trends in Europe: Implications for real exchange rates, real interest rates, and inflation, mimeo, Georgetown University, Washington, DC.
Cecchetti, S.G., N.C. Mark and R. Sonora (1999), Price Level Convergence Among United States Cities: Lessons for the European Central Bank, Federal Reserve Bank of New York.
ECB (2003a), Monthly Bulletin, April 2003.
ECB (2003b), Inflation differentials in the Euro Area: Potential causes and policy implications.
Honohan, Patrik and Philip R. Lane (2003), Divergent inflation rates in EMU, Economic Policy, October 2003, p. 357-394.
Hufbauer G.C., J.H. Rogers and E. Wada (2001), Price level convergence and inflation in Europe, Working Paper no. 01-1, Institute for interna-tional economics.
Rogers, J.H. (2002), Monetary union, price level convergence, and infla-tion: How close is Europe to the United States? Board of Governors of the Federal Reserve System, International Finance Discussion Papers, no. 740.
Ortega, E. (2003), Persistent inflation differentials in Europe, Banco de España, Economic Bulletin, January 2003.

12-12-2003 07:32 Antal sider: 12 Rev. nr. 2 H:\kvo\ENG\2003\4qtr\tiltryk\041-052.doc Opret-
tet af Borka Babic
52
Rogers, J. H. (2001), Price level convergence, relative prices, and inflation in Europe, Board of Governors of the Federal Reserve System, Interna-tional Finance Discussion Papers, no. 699.
Sinn, H. W. and M. Rautter (2001), The minimum inflation rate for euro-land, NBER Working Paper no. 8085, Cambridge.
Visconti, G.A. (2002), Inflation Differentials before and after the EMU, Università degli Studi de Firenze, Departimento de Statistica, Working Paper 2002/19.
12-12-2003 07:35 Antal sider: 8 Rev. nr. 2 H:\kvo\ENG\2003\4qtr\tiltryk\053-060.doc
Oprettet af Louise C. Mogensen
53
The IMF and Danmarks Nationalbank's Balance Sheet
Louise Mogensen, Financial Markets
The primary objective of the International Monetary Fund (IMF) is to prevent crises in the international monetary system. The IMF monitors the economic and financial development in its 184 member countries and submits recommendations concerning economic policy. The IMF may also provide temporary financial assistance to member countries to help ease balance-of-payments adjustments. The IMF has several financial accounts with Denmark as one of its member countries. Denmark's fin-ancial commitment as an IMF member country is called the quota. Via payment of quota resources Danmarks Nationalbank participates in the financing of the loans offered by the IMF via its General Resources Ac-count. Danmarks Nationalbank also holds Special Drawing Rights, SDR. Moreover, Denmark participates in a number of special arrangements to borrow that are administered by the IMF.
Danmarks Nationalbank's accounts with the IMF are registered on the liability and asset sides of its balance sheet. The assets less the liabilities constitute Danmarks Nationalbank's net claim on the IMF, which in ac-cordance with international conventions is part of the foreign-exchange reserve.
Danmarks Nationalbank's net claim on the IMF amounted to kr. 8.3 billion at end-2002, equivalent to more than 4 per cent of the foreign-exchange reserve. The quota is approximately 8 per cent of the foreign-exchange reserve. In 1969, when Danmarks Nationalbank took over the responsibility for accounts with the IMF from the Ministry of Finance, Denmark's quota was 46 per cent of the foreign-exchange reserve. The relative significance of Denmark's financial accounts with the IMF has thus diminished, cf. Chart 1.
This article describes how the IMF influences Danmarks Nationalbank's balance sheet and how the derived financial risks are managed. It must be emphasised in the first instance that Danmarks Nationalbank is not exposed to a credit risk vis-à-vis the individual countries that receive loans.

12-12-2003 07:35 Antal sider: 8 Rev. nr. 2 H:\kvo\ENG\2003\4qtr\tiltryk\053-060.doc
Oprettet af Louise C. Mogensen
54
THE IMF ON DANMARKS NATIONALBANK'S BALANCE SHEET
Danmarks Nationalbank's annual accounts published in its Report and Accounts include only one IMF-related item on respectively the asset and the liability sides, cf. Table 1.
The asset item can be broken down, however, so as to determine its sources and explain why it is subject to ongoing adjustment. Claims on the IMF consist of the following categories of accounts: the quota, SDR holdings, and the special arrangements to borrow: Poverty Reduction and Growth Facility, PRGF, and New Arrangements to Borrow, NAB. These accounts are all described below. Table 2 presents a breakdown of the asset item in Table 1.
DENMARK'S QUOTA AS A RATIO OF THE FOREIGN-EXCHANGE RESERVE, 1969-2002 Chart 1
Note: Source:
The foreign-exchange reserve is calculated excluding the gold stock. IMF, International Financial Statistics.
ACCOUNTS WITH THE IMF AS SHOWN IN REPORT AND ACCOUNTS 2002 Table 1
Kr. billion
Assets Liabilities
Claims on the International Monetary Fund (IMF), etc. ......... 8.3
Counterpart of Special Drawing Rights allocated by the International Mone-tary Fund (SDR) .......................................... 1.7
Source: Report and Accounts, 2002, Danmarks Nationalbank.
0
10
20
30
40
50
60
70
1969 1972 1975 1978 1981 1984 1987 1990 1993 1996 1999 2002
Per cent

12-12-2003 07:35 Antal sider: 8 Rev. nr. 2 H:\kvo\ENG\2003\4qtr\tiltryk\053-060.doc
Oprettet af Louise C. Mogensen
55
The net claim on the IMF is included in the foreign-exchange reserve since it can be made available to Denmark at short notice. The counter-part of allocated SDR is not set off against the holdings of SDR, how-ever. The explanation is that SDR is intended to be a reserve asset that is independent of gold or the balance-of-payments positions of other countries. A key aspect of the international agreement on allocation of SDR in 1969 was and is that the counterpart of allocated SDR should not be deducted from a country's foreign-exchange reserve. DANMARKS NATIONALBANK'S QUOTA
Danmarks Nationalbank's membership contribution to the IMF is called the quota1. Denmark's quota amounts to SDR 1.6 billion, equivalent to kr. 15.8 billion, at the end of 2002.
In principle, the quota is registered on both the liability and the asset sides. The liability side shows the Fund's holdings of Danish kroner while the asset side shows Danmarks Nationalbank's claim on the IMF.
According to the IMF Articles of Agreement, one quarter of the quota must be paid to the IMF in SDR or in a currency widely used in the inter-national foreign-exchange markets, such as the US dollar. Payment of dollars reduces the Fund's holdings of Danish kroner. The remaining three quarters of the quota constitute the Fund's holdings of Danish kroner before drawing on the quota.
The difference between the quota and the Fund's holdings of Danish kroner is called Denmark's reserve position with the IMF. The Fund's holdings of Danish kroner, and thereby also the reserve position, are
1 The cooperation with the IMF is described in further detail at www.imf.org, www.nationalbanken.dk
or in Danmarks Nationalbank's Annual Reports.
ACCOUNTS WITH THE IMF, BREAKDOWN Table 2
Balance sheet, end-2002, kr. billion
Assets Liabilities
Quota (fixed) ............................. 15.8 The Fund's holdings of Danish kroner ............................................. 8.9
Holdings of SDR ........................ 0.7 Counterpart of allocated SDR ....... 1.7 PRGF loans ................................. 0.6
NAB ............................................ 0
Note: The counterpart of the allocated SDR on the liabilities side is not set off against the net claims, in accordance with the principles stipulated in the IMF's Balance of Payments Manual. PRGS stands for Poverty Reduction and Growth Facility which is a special arrangement to borrow for poor countries. NAB stands for New Arrangements to Borrow and is currently not in use. Danmarks Nationalbank's reserve position with the IMF is defined as the quota less the Fund's holdings of Danish kroner on Danmarks Nationalbank. The reserve position thus amounted to kr. 6.9 billion at end-2002 (kr. 15.8-8.9 billion).
Source: Danmarks Nationalbank.

12-12-2003 07:35 Antal sider: 8 Rev. nr. 2 H:\kvo\ENG\2003\4qtr\tiltryk\053-060.doc
Oprettet af Louise C. Mogensen
56
adjusted on an ongoing basis when the IMF either draws on or makes deposits to its account, while the quota, i.e. the IMF's maximum draw-ing, is fixed.
The IMF's quota resources enable countries with balance-of-payments problems to raise loans from the IMF. The loans are granted via an ex-change system which enables countries needing "hard" currency to buy currency via the IMF from countries whose foreign-exchange situation is favourable.
The bookkeeping aspect of an IMF loan is illustrated in Table 3 by an example where a country purchases "hard" currency from the IMF and the IMF finances the entire purchase by drawing on Denmark. In prac-tice, the financing of the IMF's lending is distributed among the coun-tries (currently 44) that are eligible for inclusion in the IMF's Financial Transactions Plan in view of their favourable foreign-exchange and reserve position.
Denmark's lending to other countries via the IMF under this arrange-ment does not affect the foreign-exchange reserve, since any drawing on the foreign-exchange reserve is set off by an increase in the reserve position, cf. Table 3.
HOLDINGS OF SDR
Danmarks Nationalbank's balance sheet also includes holdings of SDR (Special Drawing Rights)1. Denmark has been allocated SDR 179 million, corresponding to kr. 1.7 billion. The counterpart of the allocated SDR is 1 The value of SDR is calculated on the basis of a basket of currencies: euro, yen, pound sterling and
dollar. SDR is potentially a claim on the other IMF countries' currencies, whereby owners of SDR may exchange amounts into these currencies.
EXAMPLE OF LENDING KR. 1 BILLION IN DOLLARS VIA THE IMF Table 3
Changes in the balance sheet
Assets Liabilities
Quota, fixed ................................................ 0 Dollar holdings in the foreign-exchange reserve ......................................................... -1
The Fund's holdings of Danish kroner .......................... -1
Changes in the foreign-exchange reserve
Quota, fixed ............................................................................................................... 0 Reserve position ......................................................................................................... +1 Dollar holding ............................................................................................................ -1
Foreign-exchange reserve, net ................................................................................. 0
Note: The reserve position increases since the quota is unchanged and the Fund's holding of Danish kroner decreases(Reserve position=Quota - the Fund's holding of Danish kroner).

12-12-2003 07:35 Antal sider: 8 Rev. nr. 2 H:\kvo\ENG\2003\4qtr\tiltryk\053-060.doc
Oprettet af Louise C. Mogensen
57
a liability which by definition is fixed and is only adjusted when new SDR are allocated to the IMF member countries that participate in the SDR system1. The holdings of SDR constitute an asset made available to Danmarks Nationalbank.
Countries requiring "hard" currency may exchange SDR via countries with excess international liquidity (or purchase SDR if required). In order to ensure the liquidity of the SDR system, Denmark like several other IMF member countries has concluded an agreement with the IMF for the exchange of SDR within a certain framework. Denmark's SDR exchange framework is SDR 25-300 million. Danmarks Nationalbank's holdings of SDR fluctuate within this framework, cf. Chart 2.
In recent years, exchange of SDR has been initiated solely by the IMF's SDR Department which administers the arrangement. At the end of 2002 Danmarks Nationalbank's holdings of SDR amounted to SDR 76 million, corresponding to kr. 0.7 billion. This means that by that time Danmarks Nationalbank had sold SDR worth approximately kr. 1 billion in net terms out of the original SDR allocation.
This arrangement does not affect the size of the foreign-exchange re-serve either, since the holdings of SDR are already included in the
1 SDR were last allocated in 1981. In 1997 the IMF adopted a proposal to double the existing amount
of SDR. The proposal would allocate the same amount of SDR to all IMF member countries as a ratio of the countries' quotas (29.315788813 per cent). Denmark has approved the proposal, but it has not yet been accepted by a sufficient number of countries for it to enter into force. The USA among other countries refuses to approve the proposal.
ALLOCATION AND HOLDINGS OF SDR Chart 2
Source: IMF.
-150
-100
-50
0
50
100
150
200
250
300
1984 1986 1988 1990 1992 1994 1996 1998 2000 2002
Difference SDR holdings SDR allocation
Million SDR

12-12-2003 07:35 Antal sider: 8 Rev. nr. 2 H:\kvo\ENG\2003\4qtr\tiltryk\053-060.doc
Oprettet af Louise C. Mogensen
58
foreign-exchange reserve. If SDR are exchanged for e.g. dollars, Dan-marks Nationalbank's dollar holdings will increase by an amount equiva-lent to the decrease in the SDR holdings, so that the total foreign-exchange reserve remains unchanged.
SPECIAL ARRANGEMENTS TO BORROW
Besides quota resources and holdings of SDR Danmarks Nationalbank's lending via a special arrangement, the Poverty Reduction and Growth Facility, PRGF, of kr. 0.6 billion at end-2002 is also stated on the asset side of the balance sheet. Finally, Danmarks Nationalbank's participation in the New Arrangements to Borrow, NAB, is stated1. Under NAB it is possible to draw up to SDR 367 million (approximately kr. 3.5 billion at end-2002) on Danmarks Nationalbank, but this arrangement is currently not in use.
The net claims on the IMF totalled kr. 8.3 billion at end-2002, cf. Tables 1 and 2.
DANMARKS NATIONALBANK'S RISK VIS-À-VIS THE IMF
Financial risks vis-à-vis the IMF can be divided into credit risk, currency risk and interest-rate risk. Danmarks Nationalbank's credit exposure to the IMF is considerable. However, the IMF has a very high credit stand-ing, so that the credit risk is minimal. Danmarks Nationalbank seeks to minimise the interest-rate risk and currency risk2.
Danmarks Nationalbank's credit exposure in connection with these arrangements can be divided into exposure vis-à-vis respectively the IMF, the PRGF "Trust Fund" and the SDR Department.
Danmarks Nationalbank's credit exposure vis-à-vis the IMF is compiled as the sum of Danmarks Nationalbank's quota and loan commitments under the NAB arrangements.
Subject to a government guarantee Danmarks Nationalbank has made a loan commitment under PRGF for a maximum of SDR 100 mil-lion (kr. 962 million at end-2002). The PRGF arrangements are adminis-tered by the IMF as a separate "Trust Fund" with its own (very large) reserves.
1 The two arrangements to borrow are described in further detail at www.imf.org.
2 Danmarks Nationalbank's risk management is described in Ib Hansen and Christian Ølgaard, Dan-
marks Nationalbank's Risk Management, Danmarks Nationalbank, Monetary Review, 2nd Quarter 2000.

12-12-2003 07:35 Antal sider: 8 Rev. nr. 2 H:\kvo\ENG\2003\4qtr\tiltryk\053-060.doc
Oprettet af Louise C. Mogensen
59
Danmarks Nationalbank's credit exposure vis-à-vis the SDR Department is compiled as its commitments to pay for SDR. Danmarks Nationalbank's maximum commitment is to buy SDR equivalent to twice the value of the allocated SDR, i.e. kr. 3.4 billion at end-2002.
Table 4 shows the total credit exposure. Danmarks Nationalbank does not assume credit risk vis-à-vis third
countries in connection with loans or exchange of quota resources or SDR, since all claims are on the IMF, the SDR Department or the special arrangements to borrow. Due to the IMF's high credit standing the credit risk is found to be low. The credit standing is the result of the international agreements to which the member countries are mutually committed under the IMF's Articles of Agreement as well as the IMF's reserves, including considerable gold reserves1.
Danmarks Nationalbank is exposed to an immediate currency risk in SDR, since accounts with the IMF are settled in SDR. In the management of Danmarks Nationalbank's currency risk the value of SDR is distributed on the currencies included in the calculation of SDR, and forward trans-actions are then concluded so that the risk is solely vis-à-vis the euro, which is the target of Denmark's fixed-exchange-rate policy. It follows that purchase and sale of SDR do not affect Danmarks Nationalbank's currency exposure, making it possible to keep the currency risk vis-à-vis the IMF at a very low level.
The IMF's remuneration of SDR is a weighted 3-month interest rate from the USA, Japan, the euro area and the UK. The rate of interest on the reserve position is reduced by a contribution (in October 2003 ap-
1 The gold reserve amounts to approximately 3,200 tonnes as of 31 July 2003 and is stated in the IMF's
"Financial Statement" at historical cost price as determined by the IMF's Articles of Agreement. Since this is considerably less than the market value, the gold holdings constitute a considerable hidden reserve for the IMF.
DANMARKS NATIONALBANK'S CREDIT EXPOSURE VIS-À-VIS THE IMF Table 4
End-2002 Kr. billion
IMF Quota ................................................................................................ 15.8 New Arrangements to Borrow, NAB ............................................... 3.5
PRGF, Trust fund Poverty Reduction and Growth Facility ...........................................
1.0
SDR Department SDR (Maximum equivalent to twice the allocated amount) ......... 3.4
Total credit exposure ........................................................................ 23.7
Note: Lending under the PRGF arrangement is guaranteed by the Danish central government since it is administered by the IMF as a separate "Trust Fund".

12-12-2003 07:35 Antal sider: 8 Rev. nr. 2 H:\kvo\ENG\2003\4qtr\tiltryk\053-060.doc
Oprettet af Louise C. Mogensen
60
proximately 0.1 per cent) to cover the IMF's administration and to build up reserve funds within the IMF1.
Danmarks Nationalbank seeks to minimise the interest-rate risk vis-à-vis the IMF since all transactions in connection with the arrangements to borrow and the exchange of SDR are kept neutral for the duration of the foreign-exchange reserve. Transactions solely entail adjustments to the money-market placements of the foreign-exchange reserve.
1 Danmarks Nationalbank's outstanding loans under the PRGF arrangements are also remunerated at
the SDR interest rate. However, the poor developing countries receiving loans under this arrange-ment pay interest at only 0.5 per cent per annum. The difference between the market-determined SDR interest rate and the low lending rate is covered by interest subsidies. It should be emphasised that these interest subsidies are covered by the industrialised countries and other rich countries via their development aid budgets (DANIDA in Denmark). Danmarks Nationalbank does not contribute interest subsidies to this arrangement.

12-12-2003 07:42 Antal sider: 16 Rev. nr. 2 H:\kvo\ENG\2003\4qtr\tiltryk\061-077.doc
Oprettet af Gitte Wallin Pedersen
61
China's Role in the Global Economy
Gitte Wallin Pedersen, International Relations
INTRODUCTION
Since 1978 China has seen consistently high growth rates as a result of the major economic reforms launched two years after the death of Mao Zedong. Since then China has been a centrally planned economy com-bined with market economy in designated zones.
The economic development has multiplied the significance of China in the global economy since the late 1970s, although China's share of global GDP and trade does not reflect the size of its population, cf. Tables 1 and 2. For comparison, Chinas GDP is 7 times that of Denmark.
CHINA'S WEIGHT IN THE GLOBAL ECONOMY Table 1
China's global percentage GDP Trade Population
1977 ................................................................ 0.7 0.6 22.4 1982 ................................................................ 0.9 1.2 22.0 1987 ................................................................ 1.4 1.7 21.7 1992 ................................................................ 1.8 2.2 21.5 1997 ................................................................ 2.7 2.9 21.1 2002 ................................................................ 3.4 4.8 20.7
Source: Figures for GDP (constant prices) and population are from the World Bank, while trade figures are from the IMF.
THE WORLD'S LARGEST ECONOMIES IN 2002 Table 2
Percentage
of global GDP GDP growth (in per cent)
Percentage of global population
GNI per capita (US dollars)
USA ................................... 32.3 2.3 4.7 35,060 Japan ................................ 12.3 -0.7 2.1 33,550 Germany ........................... 6.1 0.2 1.3 22,670 UK ..................................... 4.8 1.5 0.9 25,250 France ............................... 4.4 1.0 1.0 22,010 China ................................. 3.8 8.0 20.7 940 Italy ................................... 3.7 0.4 0.9 18,960
World................................. 100.0 1.7 100.0 5,080
Memo: Euro area .............. 20.5 0.7 4.9 20,230
Note: China's share of global GDP is 12 per cent measured by purchasing-power parity, which is primarily of signifi-cance to Chinese welfare.
Source: World Bank. GDP in current prices.

12-12-2003 07:42 Antal sider: 16 Rev. nr. 2 H:\kvo\ENG\2003\4qtr\tiltryk\061-077.doc
Oprettet af Gitte Wallin Pedersen
62
Today China is the world's sixth largest economy measured by GDP. In spite of the sustained high growth rates it lags far behind the USA and Japan, and the gross national income per capita is very low, even when compared with the world average.1 However, poverty halved during the 1990s so that only 16 per cent of the Chinese population lived on less than 1 US dollar a day in 2000.2
The decentralised development model has created regional differences as regards income level, infrastructure, etc., particularly between inland China and the more wealthy coastal areas in Eastern China. This means that the most affluent fifth of the population account for almost half of total consumption.3
China's growth has primarily been driven by market-oriented reforms and the opening of the Chinese economy to the rest of the world. Com-bined with low production costs, the liberalisation measures in recent years have lead to significant increases in exports and foreign direct investments. The high level of foreign demand strengthens China's posi-tion in the region and in the world, but also entails increased focus on whether China's growth is taking place at the cost of other countries.
CHINA'S OPENING TO THE WORLD
Politically China has aimed for a more constructive and diplomatic line, which means that China is gradually being recognised as a super power. President Hu Jintao was the first Chinese leader ever to participate in a G8 meeting in 2003. In economic terms, the new openness has so far focused on trade and foreign direct investments, while capital restric-tions still play a major role in the financial area.
Both politically and economically China's accession to the World Trade Organisation, WTO, on 11 December 2001 was a landmark event. The WTO commitments require extensive adjustments of Chinese economy and legislation, cf. the Box. At the same time the various sectors within the Chinese economy must prepare for increased competition.
Merchandise trade China's merchandise trade has increased by an average of just over 15 per cent annually during the last 20 years. Focus tends to be on exports, but growth in imports has not been significantly lower. In 2002 exports accounted for 26 per cent of GDP, while imports accounted for 24 per
1 China's gross national income per capita is also low if calculated in purchasing-power-parity terms.
According to the World Bank it was 4,390 dollars in 2002, against 7,570 dollars globally (World Development Indicators, WDI, 2003).
2 World Bank.
3 Cf. the UN Human Development Report 2003.

12-12-2003 07:42 Antal sider: 16 Rev. nr. 2 H:\kvo\ENG\2003\4qtr\tiltryk\061-077.doc
Oprettet af Gitte Wallin Pedersen
63
cent. For comparison, exports and imports made up respectively 33 and 28 per cent of Denmark's GDP in 2002.1 China's largest trading partner is Japan, with 17 per cent of China's total trade, followed by the USA and Hong Kong at respectively 16 and 11 per cent.2 Hong Kong's importance fell significantly up through the 1990s, cf. Chart 1. Today the USA, Japan and Hong Kong jointly account for approximately 55 per cent of China's exports. To a higher degree than its exports, China's imports are distrib-uted on many different countries, with Japan, Hong Kong, Taiwan, the USA and Korea as the key trading partners.
Overall the structure of China's merchandise trade does not differ essentially from that of industrialised countries – such as the USA – char-acterised by a large share of manufactures and limited trade in agricul-tural products, cf. Table 3. Japan, however, differs significantly from both the USA and China, since imports of mining and agricultural prod-
1 Source: IMF Direction of Trade Statistics, the World Bank and Statistics Denmark.
2 All figures for Hong Kong are subject to reservations owing to the registration method for transit
trade. Hong Kong's key role in Chinese trading also leads to more general differences in the bilateral trade figures provided by China and the individual trading partner.
CHINA'S ACCESSION TO THE WTO Box
China joined the WTO on 11 December 2001 after 15 years of negotiations. In that
connection China committed itself to non-discriminatory treatment of all WTO mem-
bers, so that foreign enterprises are not treated less favourably than Chinese enter-
prises. Likewise, Chinese goods produced for respectively export and domestic sale
must be treated equally. Implementation will take place via a revision of Chinese
legislation to bring it into full compliance with the terms of the WTO Agreement.
The agreement between the WTO and China is extensive and includes specific
schedules for adaptation in a great many areas. The following should be emphasised:
• Goods. Gradual elimination or reduction of tariffs, primarily in 2004, but by 2010 at
the latest. On average tariffs for agricultural products are lowered to 15 per cent,
while tariffs for industrial goods are lowered to 8.9 per cent. China must limit sub-
sidies for agricultural production to 8.5 per cent of output. As for all WTO mem-
bers, quotas on textiles must be abolished by 31 December 2004, but until end-2008
WTO members may limit textile imports from China in the event of significant
market disruptions.
• Services. As regards financial institutions, foreign institutions may provide trans
actions in foreign currency upon Chinas accession. Two years after accession the
foreign institutions may provide transactions in local currency to Chinese enter-
prises. Five years after accession all restrictions must be abolished. As regards insur-
ance companies, there will be a gradual opening to foreign ownership. Two years
after the accession 100 per cent foreign-owned companies will be permitted within
non-life insurance – for other types of insurance 100 per cent foreign-owned com-
panies will not be permitted until five years after accession.
Source: WTO.

12-12-2003 07:42 Antal sider: 16 Rev. nr. 2 H:\kvo\ENG\2003\4qtr\tiltryk\061-077.doc
Oprettet af Gitte Wallin Pedersen
64
ucts are considerable. A major difference between the three countries is seen in exports of machinery and transport equipment, which for the USA - and in particular for Japan - are by far the most important export group. Approximately 40 per cent of China's exports comprises products such as clothing, textiles, footwear and toys.
China mainly exports low-priced, labour-intensive products without sophisticated technology, and its main comparative advantages lie
DESTINATIONS FOR CHINESE EXPORTS Chart 1
Source: Direction of Trade Statistics, IMF.
COMPOSITION OF TRADE FOR CHINA, USA AND JAPAN IN 2002 Table 3
Percentages China Japan USA
Exports Imports Exports Imports Exports Imports
Agricultural products ................... 5.8 7.4 1.1 16.7 10.4 6.2 Mining products ........................... 4.2 11.9 1.7 24.7 3.7 12.5 Manufactures ............................... 90.0 80.7 97.2 58.6 85.9 81.3 Iron and steel .............................. 1.0 4.6 3.9 0.7 0.9 1.4 Chemicals .................................... 4.7 13.3 8.3 7.7 12.3 7.7 Other semi-manufactures .......... 7.8 4.9 4.5 4.4 6.3 7.3 Mach. and transp. equip. ........... 39.1 46.7 70.2 28.5 52.8 44.8 Clothing and textiles .................. 19.0 4.9 1.6 6.7 2.5 7.3 Other consumer goods1 .............. 18.4 6.3 8.6 10.6 11.1 12.8
Total .............................................. 100.0 100.0 100.0 100.0 100.0 100.0
Total merchandise (billion USD)2 .. 324.9 293.6 398.8 330.5 662.1 1,149.2
Source: International Trade Statistics 2003, WTO. 1 Including household articles, footwear, photo equipment, watches. 2 Excluding unspecified products.
1990
USA EU (15) Japan Hong Kong Other countries
2002

12-12-2003 07:42 Antal sider: 16 Rev. nr. 2 H:\kvo\ENG\2003\4qtr\tiltryk\061-077.doc
Oprettet af Gitte Wallin Pedersen
65
within leather products, clothing, textiles, and to some extent IT and consumer electronics.1 As regards high-technology exports, Malaysia, the Philippines and Singapore are the frontrunners, and China has not reached the level of the USA and Japan.2 Nonetheless, the transition is underway, and high-technology products can be expected to gain con-siderable ground in the years to come. High-technology products as a percentage of exports doubled from 1995 to 2001, investments in re-search and development are rapidly increasing, and currently approxi-mately 700,000 new engineers graduate every year.
Foreign direct investments Foreign direct investments have been an important element of China's opening to the outside world. The rules were originally very restrictive, but they have been relaxed gradually, and investments have become attractive via tax incentives and information campaigns. At the same time wages are low, and certain industries have been liberalised. Foreign direct investments were more or less non-existent in the late 1970s, but accounted for just over 4 per cent of GDP in 2002.
Foreign direct investments are difficult to calculate and tend to fluctu-ate from year to year, but investments in China rose steadily during the 1990s, cf. Table 4. In a global perspective the USA has for many years been the largest recipient of foreign direct investments, but in 2002 China reached a level of almost 53 billion dollars and thus surpassed the USA. For the USA foreign direct investments were particularly low in 2002 against the background of the weak cyclical position. The devel-
1 Cf. International Trade Center (UNCTAD/WTO). Comparative advantages are calculated using the
Balassa formula. For the sectors specified the share of world exports is significantly higher than the sector's share of national exports (1.72-4.53).
2 Cf. the World Bank.
FOREIGN DIRECT INVESTMENTS IN SELECTED COUNTRIES Table 4
Billion dollars 1992 1994 1996 1998 2000 2002
China ............................ 11.2 33.8 40.2 43.8 40.8 52.7 USA .............................. 18.9 45.1 84.5 174.4 314.0 30.0 Japan ........................... 2.8 0.9 0.2 3.2 8.3 9.3 Singapore .................... 2.2 8.6 8.6 7.6 12.5 7.7 India ............................. 0.2 1.0 2.5 2.6 2.3 3.4 Korea ........................... 0.7 1.0 2.3 5.4 9.3 2.0 Taiwan ......................... 0.9 1.4 1.9 0.2 4.9 1.4 Indonesia ..................... 1.8 2.1 6.2 -0.4 -4.6 -1.5
World ........................... 175.8 256.0 386.1 686.0 1,393.0 651.2
Memo: Denmark ......... 1.0 5.0 0.8 7.7 32.8 6.0
Source: UNCTAD (World Investment Report).

12-12-2003 07:42 Antal sider: 16 Rev. nr. 2 H:\kvo\ENG\2003\4qtr\tiltryk\061-077.doc
Oprettet af Gitte Wallin Pedersen
66
opment in China means that in absolute terms the country has reached the level typically seen in the large European countries. The other coun-tries in Asia are not large recipients of foreign direct investments.
In the first years, Hong Kong and Taiwan were the major investors in China, but gradually multinationals from the USA, Europe and Japan have also begun to play a large role.1 Hong Kong accounts for a third of the foreign direct investments, which is more than three times as much as the second-largest investor, the USA, cf. Chart 2. Practically all invest-ments have been made in Eastern China, where the Chinese authorities have designated special economic zones that were initially given permis-sion to introduce extensive liberalisation measures. Investments were not able to spread to other parts of China until the 1990s.
US and European investors appear to be attracted by the Chinese mar-ket potential, while Hong Kong and Taiwan investors tend to be more export-oriented focusing on cost benefits, particularly low wages. More than half of China's merchandise exports are manufactured by foreign-invested companies.2 For all foreign investors the open and liberal atti-tude of the Chinese authorities, i.e. easy access and various preferential schemes e.g. in relation to taxation, is considered to be decisive, how-
1 Cf. Wanda Tseng and Harm Zebregs (2002) Foreign Direct Investments in China: Some Lessons for
other countries. IMF Policy Discussion Paper. 2 Cf. JP Morgan Special Report (2003), Understanding China's trade.
COUNTRY OF ORIGIN OF FOREIGN DIRECT INVESTMENTS IN CHINA IN 2002 Chart 2
Note: Source:
The above 12 countries account for an accumulated 76.8 per cent of foreign direct investments in China in 2002. National Bureau of Statistics of China.
0 2 4 6 8 10 12 14 16 18
Hong Kong
USA
Japan
Taiwan
Korea
Singapore
Germany
UK
Canada
France
Netherlands
Macao
Billion dollars

12-12-2003 07:42 Antal sider: 16 Rev. nr. 2 H:\kvo\ENG\2003\4qtr\tiltryk\061-077.doc
Oprettet af Gitte Wallin Pedersen
67
ever.1 The preferential schemes are a major reason why investments in China are far higher than investments in e.g. India, which also offers low wages and a large, promising market. Most studies indicate a strong correlation between foreign direct investments and GDP growth in China. Investors are attracted by the enormous market potential and thus reinforce the growth trend. Foreign direct investments are thus estimated to have contributed almost 3 percentage points annually to China's growth in the 1990s.2
Financial conditions Chinese capital restrictions have traditionally been extensive and modifi-cations are introduced at a very slow pace. Since 1994 China has in prac-tice maintained a fixed-exchange-rate policy vis-à-vis the US dollar within a band of ± 0.3 per cent, which was narrowed to ±0.02 per cent after the Asian crisis.3 If an equilibrium is not immediately reached, the central bank intervenes to absorb excess supply or demand. The Chinese currency, the renminbi, is only partially convertible, and merely a few selected banks may trade in the market. Enterprises must to a large ex-tent deliver foreign exchange to one of these banks and conduct trans-
1 Some of the investments are also considered to result from round-tripping, i.e. Chinese capital that
returns to China as foreign investments in order to benefit from these schemes. 2 Cf. Harm Zebregs (2003): Foreign Investment and Output Growth. IMF: China Competing in the
Global Economy. 3 Cf. Nicolas Blancher (2003): Exchange Rate Policy. IMF: China Competing in the Global Economy.
INCREASE IN CHINA'S CONSUMER PRICE INDEX AND EXCHANGE RATE Chart 3
Source: EcoWin.
-5
0
5
10
15
20
25
30
1986 1988 1990 1992 1994 1996 1998 2000 2002
0
0.05
0.1
0.15
0.2
0.25
0.3
0.35
Inflation (Consumer Price Index) Exchange rate
Per cent, year-on-year Dollar/renminbi

12-12-2003 07:42 Antal sider: 16 Rev. nr. 2 H:\kvo\ENG\2003\4qtr\tiltryk\061-077.doc
Oprettet af Gitte Wallin Pedersen
68
actions via them. The capital restrictions are only slowly being relaxed. The period since 1978 has seen periods of high inflation and weakening of the renminbi, which the fixed-exchange-rate policy put an end to in 1994, cf. Chart 3.
The financial sector is dependent on the capital restrictions. At the end of 2002 the financial system had non-performing loans corresponding to 45 per cent of GDP, almost 560 billion dollars. Most of the non-performing loans are held by banks, where 21 per cent of loans were non-performing in mid-2003, equivalent to 30 per cent of GDP. The problem is most significant in the four large state-owned commercial banks, which have granted loans to e.g. large, unprofitable state-owned enterprises, most of which are unable to service the loans. Nonetheless a financial opening is imminent, since the WTO commitments entail full market access for foreign banks by the end of 2006.
Foreign investors' access to investing in Chinese securities is gradually improving. The Chinese stock market comprises A and B shares. Tradi-tionally A shares have been denominated in renminbi and reserved for domestic investors, but since December 2002 certain foreign financial institutions have also been able to purchase A shares. So far this has not had any major impact on the development in the stock index, cf. Chart 4, presumably because the institutions must meet stringent conditions to be granted permission, and subsequent stock trading is subject to nu-merous restrictions.
DEVELOPMENT IN CHINESE STOCK MARKET Chart 4
Note: Source:
Monthly observations (averages). Latest observation 14 November 2003. EcoWin.
0
100
200
300
400
500
600
700
800
1992 1993 1994 1995 1996 1997 1998 1999 2000 2001 2002 2003
China Shanghai SE A China Shanghai SE B S&P 500
Index, 1 Januar 1992 = 100

12-12-2003 07:42 Antal sider: 16 Rev. nr. 2 H:\kvo\ENG\2003\4qtr\tiltryk\061-077.doc
Oprettet af Gitte Wallin Pedersen
69
Likewise, B shares, which are denominated in US dollars and Hong Kong dollars, were formerly reserved for foreign investors. Domestic investors were given access to trading B shares at the beginning of 2001, and prices doubled in two months. Combined with a high level of savings in China, this indicates that relaxation of the capital restrictions imposed on domestic investors could lead to significant capital outflows from China.
CONSEQUENCES FOR THE REST OF THE WORLD
China's economic development has given rise to fears that growth is taking place at the expense of other countries, including the Asian coun-tries. Neither the Asian crisis in 1997-98 nor the global economic stagna-tion in the last couple of years has prevented the Chinese economy from growing.
In the 1990s growth in China was far higher than in most other coun-tries worldwide, and this trend is expected to continue, inter alia as a consequence of China's development stage and the possibility of bene-fiting from catching-up effects, cf. Chart 5. Nonetheless, most countries in Asia have also seen high economic growth rates compared with the rest of the world. Except during the Asian crisis, growth rates in the USA,
ANNUAL REAL GDP GROWTH FOR SELECTED COUNTRIES Chart 5
Note: Source:
Developing Asia: Afghanistan, Bangladesh, Bhutan, Brunei, Cambodia, China, Fiji, India, Indonesia, Kiribati, Laos, Malaysia, Maldives, Myanmar, Nepal, Pakistan, Papua New Guinea, Philippines, Samoa, Solomon Islands, Sri Lanka, Thailand, Tonga, Vanuatu and Vietnam. IMF.
-5
0
5
10
15
1989 1990 1991 1992 1993 1994 1995 1996 1997 1998 1999 2000 2001 2002 2003 2004
China EU USA Japan Developing Asia Developing Asia excluding China and India
Per cent

12-12-2003 07:42 Antal sider: 16 Rev. nr. 2 H:\kvo\ENG\2003\4qtr\tiltryk\061-077.doc
Oprettet af Gitte Wallin Pedersen
70
EU and Japan have been significantly lower than in the Asian countries. During the last 20 years new production patterns have emerged in Asia, where labour-intensive industries are moving from newly industrialised Asian countries (Hong Kong, Korea, Singapore and Taiwan) to e.g. China. This has not had a negative impact on welfare.1 According to the World Bank the increasing trend in gross national income per capita (constant prices) in the newly industrialised Asian countries has con-tinued, even after the Asian crisis and China's opening to the world.
As regards exports, several Asian countries – unlike China – have lost export shares, cf. Table 5. It should, however, be noted that China typi-cally has trade deficits vis-à-vis a number of Asian countries, including Taiwan, Korea, Malaysia, Thailand and the Philippines.2 In the first months of 2003 the top-ten list of China's bilateral trade deficits in-cluded these countries and Japan.3 As regards foreign direct investments, the increasing investments in China have not led to lower investments in the rest of Asia.4 Japan, Korea and Taiwan have seen increases since 1995, cf. Table 4. Indonesia has had problems, which should be seen against the background of, inter alia, the terrorist attack on Bali and the general economic and political situation in Indonesia. Domestic factors are key to foreign direct investments and, as mentioned previously, China has chosen to introduce favourable schemes.
Among the more affluent countries there has been some concern that manufacturing jobs would be lost to China, and the USA has announced its intention to impose a cap on Chinese textiles. In the USA and Japan employment in manufacturing constitutes a diminishing percentage of total employment, cf. Chart 6.
1 See e.g. BIS 73rd Annual Report (2003).
2 Cf. IMF Direction of Trade Statistics.
3 Cf. Ministry of Commerce of the People's Republic of China.
4 See e.g. Deutsche Bank (2003): China as potential superpower: Regional responses.
SELECTED COUNTRIES' PERCENTAGES OF GLOBAL EXPORTS Table 5
1992 1994 1996 1998 2000 2002
China ........................................... 2.28 2.85 2.85 3.40 3.91 5.12 USA .............................................. 11.93 12.07 11.75 12.60 12.10 10.91 Japan ........................................... 9.07 9.31 7.76 7.18 7.50 6.56 Korea ........................................... 2.04 2.27 2.59 2.46 2.69 2.54 Taiwan ......................................... 2.17 2.21 2.19 2.05 2.32 n.a. Singapore .................................... 1.69 2.28 2.36 2.04 2.16 1.97 Indonesia ..................................... 0.91 0.94 0.94 0.90 0.97 0.90 India ............................................. 0.49 0.57 0.61 0.67 0.69 0.79
World ........................................... 100 100 100 100 100 100
Memo: Denmark ......................... 1.12 0.94 0.89 0.89 0.80 0.70
Source: IMF (Direction of Trade Statistics).

12-12-2003 07:42 Antal sider: 16 Rev. nr. 2 H:\kvo\ENG\2003\4qtr\tiltryk\061-077.doc
Oprettet af Gitte Wallin Pedersen
71
Nonetheless, calculations indicate that only a very small proportion of the development in the USA and Japan is attributable to China.1 The decline in employment in manufacturing is primarily a result of in-creased productivity and welfare, which in turn boost demand for ser-vices. For instance, productivity in US manufacturing doubled from 1980 to 2001.2
In addition, Japan has criticised China for exporting deflation and called for an upwards adjustment of the renminbi. The problem is pre-sumably exaggerated since the deflationary effects primarily relate to lower-priced manufactures, which constitute a relatively small pro-portion of the consumer price indices in the other Asian countries. Most Asian countries also apply flexible exchange-rate regimes enabling infla-tion targeting.3 Finally, deflation has now been replaced by slight infla-tion in China, measured by consumer prices. This development is expected to continue in the coming years.
Recently the USA has criticised China's fixed-exchange-rate policy and called for a more flexible renminbi. The dollar has fallen significantly in 2003, and the renminbi has followed suit. The USA has assessed that the Chinese economy is strong and that the renminbi is undervalued, e.g. against the background of the rapidly growing foreign-exchange re-
1 See e.g. UBS (2003) Outsourcing, Shmoutsourcing.
2 Cf. Ecowin, output per hour.
3 However, Hong Kong and Malaysia, among others, have tied their currencies to the dollar.
PROPORTION OF THE LABOUR FORCE EMPLOYED IN MANUFACTURING Chart 6
Source: EcoWin and the World Bank.
0.10
0.12
0.14
0.16
0.18
0.20
0.22
0.24
0.26
1980 1982 1984 1986 1988 1990 1992 1994 1996 1998 2000 2002
Japan USA

12-12-2003 07:42 Antal sider: 16 Rev. nr. 2 H:\kvo\ENG\2003\4qtr\tiltryk\061-077.doc
Oprettet af Gitte Wallin Pedersen
72
serve, cf. Chart 7. Estimations indicate that the renminbi is undervalued by 15-25 per cent.1
The USA's and Japan's focus on China reflects the fact that China is a major trading partner. For many years the USA's largest trade deficit was vis-à-vis Japan. However, in 2000 China took over this position, and in 2002 the USA had a deficit of 103 billion dollars vis-à-vis China, which is far more than it ever had vis-à-vis Japan, cf. Chart 8.2 In 2002 China was the third largest exporter to the USA after Canada and Mexico. For Japan, the USA has been the largest trading partner for many years, both in terms of imports and exports, but in 2002 China became the primary source of Japanese imports. Denmark's trade deficit vis-à-vis China is also increasing, and was just under kr. 7 billion in 2002.3 Gener-ally China's large trade surplus vis-à-vis the USA is not typical of bilateral trade between China and other countries, since China's total trade sur-plus was approximately 30 billion dollars in 2002, i.e. far below the surplus vis-à-vis the USA.4
An adjustment of the renminbi will not necessarily imply a significant positive effect on the US balance of trade. In the period 1995-2001 the
1 See e.g. Morris Goldstein (2003), China's Exchange rate regime.
2 According to the IMF Direction of Trade Statistics, China's trade surplus vis-à-vis the USA was 43
billion dollars in 2002. There are generally large differences in the calculations from respectively China and its trading partners owing to Hong Kong's major significance to China's trade.
3 Cf. Statistics Denmark, Statistical Yearbook 2003.
4 Cf. IMF Direction of Trade Statistics.
CHINA'S FOREIGN-EXCHANGE RESERVE AND NOMINAL EXCHANGE RATE Chart 7
Source: EcoWin.
0
50
100
150
200
250
300
350
400
450
1994 1995 1996 1997 1998 1999 2000 2001 2002 2003
8
8.1
8.2
8.3
8.4
8.5
8.6
8.7
8.8
8.9
Foreign exchange reserve (left-hand axis) Exchange rate
Billion dollar Renminbi/dollar

12-12-2003 07:42 Antal sider: 16 Rev. nr. 2 H:\kvo\ENG\2003\4qtr\tiltryk\061-077.doc
Oprettet af Gitte Wallin Pedersen
73
real effective dollar rate strengthened by more than 30 per cent.1 In the same period the USA's merchandise imports from China increased by an annual average of 15 per cent, even though the annual average increase in the USA's total merchandise imports was only 8 per cent.2 US im-porters have thus perceived Chinese products as relatively "cheap" although the renminbi – unlike many other currencies – kept up with the strengthening of the US dollar. The significant Chinese exports to a large extent reflect productivity gains and comparative advantages in the form of low production costs. The Institute for International Eco-nomics has assessed that an upwards adjustment of the renminbi by 20 per cent, combined with a revaluation of 10 per cent in the other Asian emerging market economies and Japan would improve the USA's bal-ance of payments by 50 billion dollars3, equivalent to only one tenth of the total US balance-of-payments deficit in 2002.
It is also arguable to what extent the renminbi is undervalued. The Chinese balance-of-payments surplus has only averaged approximately 2 per cent since 1995, and it is vulnerable in view of the adaptations of the economy which must necessarily take place because of the WTO com-mitments and the high growth in investments that are prerequisites of continued catching-up. Moreover, the build-up of the foreign-exchange
1 Cf. EcoWin.
2 Cf. U.S. Census Bureau.
3 See e.g. Morris Goldstein (2003), China's Exchange rate regime.
THE US BALANCE OF TRADE VIS-À-VIS CHINA AND JAPAN Chart 8
Source: U.S. Census Bureau.
0
20
40
60
80
100
120
1986 1987 1988 1989 1990 1991 1992 1993 1994 1995 1996 1997 1998 1999 2000 2001 2002
The US trade deficit vis-á-vis China The US trade deficit via-à-vis Japan
Billion dollar

12-12-2003 07:42 Antal sider: 16 Rev. nr. 2 H:\kvo\ENG\2003\4qtr\tiltryk\061-077.doc
Oprettet af Gitte Wallin Pedersen
74
reserve is mainly attributable to the development in foreign direct in-vestments. For instance, the foreign-exchange reserve increased by 60 billion dollars in the 1st half of 2003, while the merchandise trade sur-plus was 6.9 billion dollars and foreign direct investments were 26 billion dollars.1 Finally, it is generally difficult to determine the "correct" ex-change rate. The real effective exchange rate for the renminbi in mid-2003 was slightly higher than the 1990 level after having been signifi-cantly higher in the intervening years, e.g. 14 per cent higher in 2001 on average. An equivalent trend is seen for the dollar, which is also back at the 1990 level. The level of the euro is approximately 15 per cent lower, while the yen is approximately 5 per cent higher than in 1990.2
In the short term the problems with e.g. non-performing loans in the financial sector imply that floating the renminbi – which requires abol-ishment of the capital restrictions and thus entails risk of a significant outflow of capital and a financial crisis – would not necessarily strengthen it. Much of the discussion is therefore focused on the strat-egy for increasing the flexibility of the renminbi. Most experts believe that the first step should be a revaluation of the renminbi, a widening of the fluctuation band and/or pegging to the US dollar, yen and euro, not merely the dollar, while actual floating of the renminbi should not take place for some time yet.3
The Chinese authorities have indicated that the fixed-exchange-rate policy will be maintained for the time being, but that they are consider-ing widening the fluctuation band, as well as pegging the renminbi to a basket of currencies. At present the focus areas are economic growth and the required structural reforms, which may cause major problems, including in the financial sector and the labour market. The government budget is facing major challenges in view of the non-performing loans held by the state-owned banks, the restructuring of the state-owned enterprises, and the need to expand the social security system. Privatisa-tions entail risk of social unrest since the state-owned enterprises consti-tute a social welfare system. SUSTAINED GROWTH IN CHINA?
So far China has experienced impressive economic and political devel-opment as a result of a new Chinese attitude to the rest of the world, as well as extensive reforms of China's economy. The economic growth in
1 Cf. JP Morgan.
2 Cf. EcoWin (Real Effective Exchange Rate, which also takes unit-labour costs into account).
3 See e.g. Morris Goldstein and Nicholas Lardy (2003, Institute for International Economics), Two-stage
Currency Reform for China.

12-12-2003 07:42 Antal sider: 16 Rev. nr. 2 H:\kvo\ENG\2003\4qtr\tiltryk\061-077.doc
Oprettet af Gitte Wallin Pedersen
75
China has been due mainly to capital accumulation and increasing Total Factor Productivity (a residual growth factor), while the contribution from labour force growth has been lower, cf. Table 6. It is typical of the catching-up process that capital accumulation plays a significant role in generating economic growth. It is, however, remarkable that employ-ment does not play any major role. Growth in employment may have been dampened as a result of the "hukou" system which for many years prevented people born in rural areas from seeking employment in the cities.1 Incidentally, the extensive reforms have led to higher unemploy-ment.2
The estimations render it plausible that China can sustain a growth rate of 7-8 per cent in the coming years.3 China's possibilities of transfer-ring labour force from low-productivity to high-productivity industries will be considerable for many years to come, since streamlining has so far primarily taken place in specially designated small economic zones. Historically newly industrialised Asian countries such as Taiwan and Ko-rea have been able to sustain high growth rates for many years.
At an annual growth rate of 7-8 per cent, China's GDP will double every 10 years. China can therefore be expected to play a still larger role in the global economy – not only as an exporter, but also as an importer – and to provide access to a market with 1.3 billion new consumers.4 However, there is still a long way to go before China's weight in the global economy will reflect its actual size. If China can sustain an aver-age annual growth rate which is 3 percentage points above that of the
1 Some restrictions have been abolished so rural citizens can be employed in cities, but access to e.g.
education, health and social services is still subject to the hukou system. According to the World Bank, approximately 60 per cent of the Chinese population lives in rural areas.
2 Officially the unemployment rate has been 2-4 per cent during the last 20 years (cf. the International
Labour Organisation), but at the end of 2002 the Chinese government acknowledged that unem-ployment was at least 7 per cent and rising.
3 The reliability of the Chinese statistics has often been questioned, and some observers believe that
growth is overestimated, cf. Poul Heytens and Harm Zebregs. Goldman Sachs, however, rather be-lieves growth in recent years to be underestimated. In early November 2003 Lawrence Klein said, "My position is that the China numbers are credible".
4 From 1998 to 2001 the number of PCs per 1,000 persons increased from 8.9 to 19, the number of
Internet users increased from 2.1 million to 33.7 million, and the number of telephones per 1,000 persons increased from 88.6 to 247.7 according to the World Bank.
FACTORS CONTRIBUTING TO CHINESE GROWTH Table 6
Percentage of GDP 1990-94 1995-99 2000-05 2006-10
Potential growth ........................ 9.7 8.7 7.2 7.5 Capital accumulation .................. 6.4 6.4 5.7 5.9 Labour force growth .................. 0.5 0.4 0.3 0.2 TFP growth .................................. 2.8 2.0 1.2 1.4
Actual growth ............................. 10.1 8.4 - -
Source: Paul Heytens and Harm Zebregs (2003): How fast can China grow? IMF: China Competing in the Global Economy.

12-12-2003 07:42 Antal sider: 16 Rev. nr. 2 H:\kvo\ENG\2003\4qtr\tiltryk\061-077.doc
Oprettet af Gitte Wallin Pedersen
76
global economy, it will take 40 years before China's share of global GDP reaches the level of 12 per cent where Japan's was in 2002, and almost 60 years before China's GDP – like its population in 2002 – accounts for a fifth of the global GDP.

12-12-2003 07:45 Antal sider: 8 Rev. nr. 2 H:\kvo\ENG\2003\4qtr\tiltryk\079-084.doc Oprettet
af birgitte bundgaard madsen
77
The Investment Services Directive – a New Basis for Securities Trading in Europe
Birgitte Bundgaard and Anne Reinhold Pedersen, Financial Markets INTRODUCTION
On 7 October 2003 the Council of Ministers of Economic Affairs and Finance (Ecofin Council) reached political agreement on a new Invest-ment Services Directive (ISD). Final adoption of the directive awaits in-corporation of the amendments proposed by the European Parliament. These amendments are still in the negotiation phase.
The directive will influence the development of the securities markets in the EU. It is to replace the current Investment Services Directive of 1993, which is out of date in areas such as investor protection, types of investment services on the market and the overall market structure. Fur-thermore, the current directive has proved to be an insufficient founda-tion for a single securities market in the EU. The new directive seeks to further harmonise the rules concerning investment firms. In Denmark, this category includes investment companies and credit institutions of-fering securities trading services. This will be a further contribution to the creation of a single market for financial services in the EU, which is the very objective of the EU's Financial Services Action Plan adopted in 1999.
Another aspect of the background to the directive is the increasing use over a number of years of financial products as alternatives to conven-tional bank financing and placement of funds as bank deposits. Business enterprises can raise capital on the financial markets instead of bank loans, and households can place their savings in securities instead of bank deposits, particularly in the form of units in collective investment undertakings or via pension schemes. The financial markets and their functioning thus play an increased role in financial stability.
A solid legal and regulatory framework on the financial markets would very much enhance investor confidence, liquidity and the robust-ness of the financial markets. It is especially important not to undermine investor confidence, which could happen if the markets function poorly or lack transparency. Investor protection is therefore a key issue in the directive.

12-12-2003 07:45 Antal sider: 8 Rev. nr. 2 H:\kvo\ENG\2003\4qtr\tiltryk\079-084.doc Oprettet
af birgitte bundgaard madsen
78
The directive represents a much-needed regulatory adjustment to the market development. Competition may intensify between the market participants, and the directive will ensure a level playing field between countries. The directive also provides for increased integration of the securities markets for the benefit of the business community and private investors alike. Market transparency is generally expected to be en-hanced. Unfortunately, the requirements of increased transparency do not cover bonds.
The political agreement reached by the Ecofin Council reflects a com-promise to balance the considerations of market function and investor protection.
The directive is a framework directive, i.e. several issues must be sub-sequently specified in a committee procedure with the participation of the member states and the European Commission (the Lamfalussy procedure).
The principal elements of the Investment Services Directives are de-scribed in the following, where the possible effects of the directive are also reviewed.
KEY ELEMENTS OF THE NEW INVESTMENT SERVICES DIRECTIVE
The EU securities markets have become more complex as a result of in-creasing competition concerning securities trading between stock ex-changes, other trading systems (multilateral trading facilities, MTFs) and investment firms. Liquidity has become more dispersed and transparency has deteriorated. One of the main objectives of the directive is thus to promote the creation of transparent, efficient and integrated financial markets. This will primarily be achieved by requirements of increased transparency on the markets and harmonisation of the rules concerning the various types of marketplace.
The market complexity with many participants and new products has made it difficult for the investors, particularly private investors, to get an overview of the markets. It can therefore be a greater source of concern for the investor whether an investment firm is able to exploit the trad-ing opportunities and achieve the best possible deal for the investor. Another key objective of the new Investment Services Directive is there-fore to enhance investor protection in the EU member states. This will be achieved especially by harmonising the conduct of business rules and ensuring the best execution of a securities deal for the client. A number of new services and instruments have gained ground in the financial markets, cf. the Box. These services and instruments need to be regu-lated, and the Investment Services Directive represents such regulation.

12-12-2003 07:45 Antal sider: 8 Rev. nr. 2 H:\kvo\ENG\2003\4qtr\tiltryk\079-084.doc Oprettet
af birgitte bundgaard madsen
79
FINANCIAL CONCEPTS IN THE INVESTMENT SERVICES DIRECTIVE Box
Investment firms are firms that provide investment services in connection with secur-
ities trading, such as portfolio management of clients' securities portfolios and pur-
chase and sale of securities. In Denmark, this category includes investment companies
and credit institutions.
Investment services comprise reception and transmission of orders in relation to one
or more financial instruments, dealing on own account, execution of orders on behalf
of clients, managing portfolios of clients' securities, investment advice, underwriting
and placement of financial instruments and operation of multilateral trading
facilities.
Ancillary investment services include safekeeping and administration of financial in-
struments for the account of clients, advice concerning capital structure, etc., foreign-
exchange services where these are connected to the provision of investment services,
investment research and other types of general recommendations.
Financial instruments are described in the directive as transferable securities,
money-market instruments, units in collective investment undertakings, credit deriv-
atives, contracts for differences, options, futures, swaps, forward-rate agreements
(FRAs) and other derivatives. The directive also covers commodity derivatives for cash
settlement and commodity derivatives for physical settlement if traded on a regulated
market and/or via an MTF. The Danish Securities Trading Act classifies all these in-
struments as securities.
Regulated market is a multilateral system operated by a market operator, which
brings together third-party buying and selling interests in a way that results in a
contract concerning financial instruments admitted to trading on the regulated
market.
Multilateral trading facility, MTF, means a multilateral system operated by an in-
vestment firm or a market operator, which brings together third-party buying and
selling interests in a way that results in a contract concerning securities.
Best execution is the requirement for investment firms to take all reasonable pre-
cautions to ensure the best possible result for the client of a securities deal. The as-
sessment of the best result must take into account price, costs, speed and likelihood of
execution, the size of the trade and other relevant factors.
Conduct of business rules stipulate that investment firms must act honestly, fairly
and professionally in accordance with the best interest of their clients. The specific re-
quirement is for an investment firm to obtain information from the client so as to en-
able the investment firm to provide good advice. Furthermore, investment firms are
required to inform the client of a number of issues, including fees.
Clearing and settlement is the process after conclusion of a securities deal whereby
the parties' obligations are settled, finality is ensured and securities and money are
exchanged.
Systematic internalisation is conducted by an investment firm carrying out the
client's trading orders in an organised, regular and systematic manner against the in-
vestment firm's proprietary securities trading position.
Pre-trade transparency means the publication of prices and volumes applied by the
price offerer.
Post-trade transparency means the publication of prices in the transaction executed.
The volume and timing of execution must also be published.

12-12-2003 07:45 Antal sider: 8 Rev. nr. 2 H:\kvo\ENG\2003\4qtr\tiltryk\079-084.doc Oprettet
af birgitte bundgaard madsen
80
Enhanced transparency The directive introduces rules on increased transparency to enhance the market participants' opportunities to compare prices offered by various marketplaces/players and create a level playing field between the vari-ous market players. The requirements concern pre- and post-trade transparency on trading in stock-exchange-listed shares. Pre-trade trans-parency comprises publication of prices and volumes admitted to trad-ing, while post-trade transparency comprises publication of prices and volumes in the actual trade. The transparency requirements apply to regulated markets, multilateral trading facilities and certain investment firms trading with clients against the firm's proprietary trading position. The investment firms covered by the rules will be those executing clients' trading orders in an organised, regular and systematic manner against their proprietary trading positions (systematic internalisation whereby an investment firm e.g. has established on-line investment access to trade against the firm's proprietary trading position). Illiquid shares and very large share transactions are exempt from the requirement of pre-trade transparency.
The transparency rules do not apply to bond trading, but two years after adoption of the directive the Commission intends to examine whether the rules can be expanded to include other financial instru-ments than shares. The exclusion of bonds from the transparency rules implies that the publication of offered prices and the prices of the actual bond trades is not subject to EU requirements. However, according to the directive's preamble the member states may set out national rules concerning pre- and post-trade information for other securities than shares, including bonds. Regulation of multilateral trading facilities Recent years have seen the emergence of a number of trading systems, especially in the USA, in which the members trade stock-exchange-listed securities among themselves, but which are not trading systems on a regulated market1. So far, these trading facilities have been regulated as investment firms or regulated markets in the various member states. In order to create a level playing field between different marketplaces such trading systems will also be subject to EU regulations under the Invest-ment Services Directive. The rules governing such trading systems or multilateral trading facilities, MTFs, will in several respects correspond to the rules concerning regulated markets, since MTFs and regulated mar-
1 Multilateral trading facilities or alternative trading systems are described in further detail in Birgitte
Søgaard Jensen and Lone Natorp, A Change in the Stock-Exchange Environment, Danmarks National-bank, Monetary Review, 2nd Quarter 2000.

12-12-2003 07:45 Antal sider: 8 Rev. nr. 2 H:\kvo\ENG\2003\4qtr\tiltryk\079-084.doc Oprettet
af birgitte bundgaard madsen
81
kets have a number of functions in common. An MTF needs to have transparent and objective membership rules and is subject to the same organisational requirements as an investment firm (including require-ments of internal control, risk management and trade registration). The group of members of an MTF can be the same as for regulated markets, whereby investment companies and credit institutions may become members. Other persons or firms may become members if they comply with a number of requirements concerning e.g. eligibility and integrity, trading competence and resources, including the ability to guarantee sufficient settlement of transactions. When MTF members execute trades, they will be subject to the investor protection rules solely if they trade on a client's behalf. Only investment firms and markets operators for regulated markets may establish MTFs. A new set of rules for investment firms The new Investment Services Directive further harmonises rights and obligations for investment firms in the EU. The underlying factors in-clude the fact the 1993 Investment Services Directive has proved to be insufficient in the process towards integration.
A new feature is an obligation to identify conflicts of interest between the investment firm's range of activities and the client's interests1. Fur-thermore, investments firms must seek to manage the conflicts of inter-est to prevent them from adversely affecting the interests of clients. Where the conflicts of interest cannot be managed with reasonable con-fidence, this must be disclosed to the clients. In addition, investment firms are granted access to establish a multilateral trading facility. In-vestment firms are also subject to a number of transparency require-ments concerning share trading against their proprietary trading posi-tion, conduct of business rules and best execution. These are described in other sections.
Investor protection The conduct of business rules are harmonised to enhance the protection of investors in the EU member states. Investment firms must inform the client of a number of issues concerning the firm and the services it offers as well as fees and trading costs. At the same time, the investment firm must be familiar with the client's investment experience, financial situ-ation and investment objectives to be able to find suitable investment products for the client. The client must be advised to this effect. How-
1 Conflicts of interest can arise if investment firms e.g. conduct a financial analysis of a business enter-
prise with a view to investment recommendations while also handling the sale of the enterprise's new issue of shares.

12-12-2003 07:45 Antal sider: 8 Rev. nr. 2 H:\kvo\ENG\2003\4qtr\tiltryk\079-084.doc Oprettet
af birgitte bundgaard madsen
82
ever, the investment firm may offer the client trading of simple types of securities1 without the investment firm having to familiarise itself with the client's situation. Such trades are called "execution-only" trades. Prior to execution-only trades the client must be notified of the fact that the investment firm has not assessed the client and not provided advice.
The directive introduces a provision for investment firms to take all reasonable precautions to secure "best execution", i.e. the best possible result of a securities trade for the client. The assessment of the best pos-sible result must take into account factors such as price, costs, speed of execution, the size of the trade and other relevant factors2. Investment firms must implement internal guidelines for how to ensure the best possible result for the client. The client must accept the guidelines and acknowledge that securities trading will take place against the invest-ment firm's proprietary trading position rather than on a regulated market. It will no longer be possible for the member states to require that trading in stock-exchange-listed securities shall be executed via a stock exchange (stock-exchange obligation).
New areas This directive implements EU regulation of a number of investment ser-vices and financial instruments. Investment advice is classified as an in-vestment service, whereby an investment advisor must be approved as an investment company subject to a number of requirements regarding e.g. conduct of business, management of conflicts of interest and capital adequacy. However, firms providing advice only and/or solely executing orders on behalf of clients will be subject to more lenient capital-adequacy requirements than investment companies and/or subject to a requirement concerning professional indemnity insurance.
Financial analysis is included in the list of ancillary investment services. When an investment firm makes general investment recommendations in the form of financial analyses, or provides other types of investment advice, the firm must thus comply with the rules in the directive concern-ing the avoidance of conflicts of interest, which may be detrimental to the client.
Credit and commodity derivatives are included in the list of financial instruments regulated by the directive. As a basic rule, only investment firms may trade in securities. However, firms whose main activity is to trade in commodity derivatives and/or commodities on own account
1 Quoted shares and money-market instruments, bonds and other debt instruments (except if they
include a derivative), units in collective investment undertakings and other non-complex financial products.
2 In connection with the implementation of the directive, the weighting of the individual factors in the
overall determination of "best execution" must be specified.

12-12-2003 07:45 Antal sider: 8 Rev. nr. 2 H:\kvo\ENG\2003\4qtr\tiltryk\079-084.doc Oprettet
af birgitte bundgaard madsen
83
may execute such trading without being subject to the provisions of the directive. A case in point is electricity firms' trading in electricity derivatives.
EFFECTS OF THE NEW INVESTMENT SERVICES DIRECTIVE
The adoption of the Investment Services Directive is expected to affect market participants, regulated markets, private and institutional in-vestors and financial authorities alike. Competition will intensify in sev-eral areas. It will be easier for investment firms to carry out cross-border activities within the EU in increased competition. The member states will no longer be able to require securities trading to take place via a stock exchange. At the same time, the directive will harmonise the rules con-cerning securities trading on regulated markets, via multilateral trading facilities and against the proprietary trading positions of investment firms. This creates a level playing field for the various market players.
In some member states, especially the UK, the regulation of multi-lateral trading facilities will induce a number of investment firms to set up multilateral trading facilities to continue their current securities trad-ing activity via trading systems outside the regulated market system.
In general, the directive will require EU investment firms to comply with more comprehensive rules concerning conduct of business and best execution, and firms facing potential conflicts of interest will have to introduce schemes for identification and management of the conflicts, so as not to adversely affect client interests.
The directive does not comprise clearing and settlement of securities transactions. This element of securities trading is regarded by e.g. the authorities as one of the obstacles to efficient cross-border securities trading1. A proposal from the European Commission to include clearing and settlement is therefore required for the new Investment Services Directive to take full effect.
The effects in Denmark The rules of the Investment Services Directive are not expected to im-pose significant additional burdens on Danish investment firms, since Danish legislation on good conduct in securities trading and good con-duct of business already covers a number of the above issues. However, some amendment of the Danish rules will be required. The current Dan-
1 In the Giovannini Group's report, Cross-Border Clearing and Settlement Arrangements in the Euro-
pean Union, November 2001, the direct costs related to clearing and settlement of cross-border transactions in the EU are estimated to be approximately 11 times higher than for domestic trans-actions.

12-12-2003 07:45 Antal sider: 8 Rev. nr. 2 H:\kvo\ENG\2003\4qtr\tiltryk\079-084.doc Oprettet
af birgitte bundgaard madsen
84
ish rules on disclosure in share transactions will be formally tightened by the directive's publication provisions, since the Danish rules contain no specific transparency provisions. These rules were instead implemented by the Danish regulated markets. In this connection new transparency rules concerning systematic internalisation will be required, cf. the Box.
Enhanced transparency in share trading and improved investor protec-tion at European level are expected to contribute to the investors' per-ception that they achieve the best possible deal. As mentioned, the more comprehensive transparency requirements concerning securities prices exclude bonds. In a European context, the Danish securities mar-ket is unique in view of the very large turnover of stock-exchange-listed bonds, especially mortgage-credit bonds. With this directive, transpar-ency on the bond market will no longer be subject to requirements at European level. However, at national level such requirements can still be implemented. In such case, the substantial variation in structure and price formation between the stock market and the bond market and between various bond types should be taken into account. Any national transparency rules should therefore consider the specific functioning of the various markets, so as to not distort competition. CONCLUSION
The adoption of the Investment Services Directive will represent a much needed adaptation of EU legislation to the market development. The securities markets are changing rapidly, and have changed considerably since the adoption of the first ISD in 1993. The new directive may intens-ify competition on the markets and provides for better integration of the securities markets in the EU. Overall, these factors can benefit both the business community and private investors, even though several of the changes implemented by the directive are not substantial.

12-12-2003 07:48 Antal sider: 17 Rev. nr. 2 H:\kvo\ENG\2003\4qtr\tiltryk\085-101.doc
Oprettet af Anders Mølgaard Pedersen
85
The Credit Channel in Monetary-Policy Analyses
Anders Mølgaard Pedersen, Economics
INTRODUCTION
In the economic literature a distinction is usually drawn between various transmission channels of monetary policy. These describe how changes in interest rates and exchange rates affect the decisions of business en-terprises and households. For instance, an increase in interest rates may entail a lower level of business investments since it will be more expen-sive to borrow (the investment channel), or lower consumption by households since their assets or disposable income will fall (the con-sumption channel).
In addition to these channels a monetary-policy credit channel has at-tracted increasing attention in recent years. The credit channel is an aggregate term for a series of theories implying that the supply of bank loans may decline when interest rates go up1. This means that some bank customers cannot obtain the loans they want, or that their loan costs rise in excess of the original increase in interest rates. The credit channel thus amplifies the effect of the increase in interest rates on in-vestments and private consumption.
This article first provides a brief overview of various theoretical ex-planations of the credit channel. This is followed by a presentation of various types of studies of the credit channel in the euro area, where it has been strongly in focus in recent years. Finally, the relevance of a credit channel in Denmark is briefly discussed.
Several empirical studies indicate that the mechanisms underlying a credit channel are of some relevance in the USA. Since financing in the euro area member states predominantly takes place via banks, this might be expected to apply to the euro area as well. However, recent studies indicate that a credit channel could be of less importance in the
1 In principle the supply of loans may also increase when interest rates fall. However, several studies
indicate that the mechanisms underlying a credit channel are particularly relevant when interest rates go up. The remainder of this article will focus on a scenario with rising interest rates.

12-12-2003 07:48 Antal sider: 17 Rev. nr. 2 H:\kvo\ENG\2003\4qtr\tiltryk\085-101.doc
Oprettet af Anders Mølgaard Pedersen
86
euro area than previously expected. Presumably, a credit channel does not play a major role in Denmark either, partly as a result of the wide-spread use of mortgage-credit loans.
THEORETICAL PRESENTATIONS OF THE CREDIT CHANNEL
In the theoretical literature the credit channel is often split into two subchannels, the balance-sheet channel and the bank-lending channel. They emerge via the effect of interest-rate changes on respectively bor-rowers' and banks' balance sheets. The two channels are outlined be-low1.
The balance-sheet channel The mechanisms underlying a balance-sheet channel can be described on the basis of a normal lending situation2. A bank considering granting a loan to a customer will require a higher rate of interest than its own financing interest rate (e.g. a deposit or money-market rate). The bank's credit-risk premium for lending to the customer accounts for part of this interest-rate differential3. This premium covers the risk that the customer is unable to repay the loan.
A general increase in interest rates is now assumed (i.e. the same in-crease in all interest rates). According to the balance-sheet channel, this increase may affect the customer's balance sheet in a way that makes it more difficult for the customer to repay the loan. For example, the value of certain assets such as securities or real property may fall, so that the customer's wealth decreases. This heightens the risk that the customer will subsequently become insolvent. In addition, the customer's debt burden increases, which also makes it more difficult to service the loan.
Usually the bank reacts to this deterioration of the customer's ability to meet payments by tightening its credit policy. The bank can do so by altering its terms and conditions for loans to the customer (i.e. interest rates, credit maximum, collateral requirement, etc.). The bank may e.g. require a higher credit-risk premium when lending to the customer in question. This is equivalent to the bank raising its lending rate in excess of the general increase in interest rates. In this situation the balance-sheet channel thereby amplifies the effect of the interest-rate increase on the customer's loan costs.
1 See e.g. Bernanke and Gertler (1995) or Hubbard (1995) for a more detailed description of the two
channels. 2 The balance-sheet channel may also apply to other types of credit than bank loans. Consequently, it
is often referred to as the broad credit channel. 3 The interest-rate differential must also cover the bank's administration costs and the interest-rate risk
arising from having deposits and loans with different maturities, and contribute to the bank's return on equity.

12-12-2003 07:48 Antal sider: 17 Rev. nr. 2 H:\kvo\ENG\2003\4qtr\tiltryk\085-101.doc
Oprettet af Anders Mølgaard Pedersen
87
The bank may also tighten its credit policy by altering its credit standards (i.e. the criteria for accepting customers as borrowers). If the bank tightens its credit standards, the customer may be rejected as a borrower by the bank. The customer may then obtain a loan from an-other bank or from another source of finance, but usually on less favourable terms. Again the result will be an increase in loan costs ex-ceeding the general increase in interest rates.
In some descriptions of the balance-sheet channel it is assumed that the customer must pledge specific assets as collateral for the loan. If the value of the assets falls after an increase in interest rates, the maximum loan amount covered by the collateral decreases. The customer may bor-row the differential amount without collateral, but usually at a higher rate of interest. The result is thus also a higher increase in loan costs than the general increase in interest rates warrants. In this case, how-ever, the lower supply of bank loans is not due to a tightening by the banks, but a result of a decline in the value of the collateral.1
The mechanisms underlying a balance-sheet channel may also apply in other situations than when interest rates change. For instance, a bor-rower's ability to meet payments may deteriorate in a period of low growth and declining employment. By charging a higher risk premium on lending, or by tightening credit standards, the banks' credit policy tends to be procyclical. In the economic literature this mechanism is re-ferred to as the financial accelerator effect.
The bank-lending channel The bank-lending channel works through the effects of higher interest rates on the banks' balance sheets. These effects imply that the banks must reduce their lending in excess of any fall in the demand for loans. Consequently, the banks have to tighten their credit policies, i.e. their terms and conditions for loans or their credit standards. As a result some customers will not be able to obtain the loans they want, or their loan costs will increase disproportionately.
An explanation of this channel is based on a relationship between a change in interest rates and the banks' capital reserves (the "capital-adequacy explanation"). Today banks in most countries are subject to standardised capital-adequacy requirements intended to cover various
1 In connection with the balance-sheet channel, the cash-flow channel is often mentioned. Many
business enterprises prefer to finance their activities via their regular cash flows instead of bank loans, since they save e.g. the credit-risk premium. The cash-flow channel assumes that the cash flows of some business enterprises decrease when interest rates increase, entailing a higher degree of bank borrowing. The business enterprises' financing costs thus increase in excess of the original increase in interest rates. The cash-flow channel differs from the balance-sheet channel in that the supply of bank loans does not change.

12-12-2003 07:48 Antal sider: 17 Rev. nr. 2 H:\kvo\ENG\2003\4qtr\tiltryk\085-101.doc
Oprettet af Anders Mølgaard Pedersen
88
risks in relation to their activities1. An increase in interest rates may en-tail a capital loss on securities, thus reducing the capital reserves of the banks. If the capital reserves drop to a low level or the statutory mini-mum level, the banks may wish to reduce lending by e.g. tightening their credit policy vis-à-vis some customers.
Box 1 outlines another explanation of this channel commonly found in the economic literature (the "deposit explanation"). It assumes that a tightening of monetary policy leads to a fall in bank deposits, so that
1 The requirements are described in the Basel Committee's capital-adequacy rules. For a status of the
current work to revise these rules, see Borup and Lykke (2003).
THE DEPOSIT EXPLANATION OF A BANK LENDING CHANNEL Box 1
According to the bank-lending channel, a monetary-policy tightening may have a
number of balance-sheet effects forcing the banks to reduce their lending. A wide-
spread explanation in the literature is that a monetary-policy tightening leads to a fall
in bank deposits so that lending must be reduced correspondingly. For various reasons
this explanation is, however, not fully relevant in all countries.
A monetary-policy tightening may reduce deposits if the banks are required to hold
non-interest-bearing reserves at the central bank. A bank's reserve requirement is of-
ten calculated as a fixed percentage of its deposits. If monetary policy is tightened, it
usually becomes more expensive for the bank to meet the reserve requirement for a
certain volume of deposits. Consequently, the bank often prefers to reduce deposits,
e.g. by raising its deposit rates less than the monetary-policy interest rates.
The link between monetary policy and bank deposits can also arise if deposit rates
are regulated. For instance, banks may not be allowed to raise the deposit rate above
a certain limit. When monetary policy is tightened it will then become less attractive
to deposit funds in bank accounts (because the yield on other assets, e.g. short-term
bonds, has increased), and deposits will decrease.
In practice, however, there has been a tendency to abandon non-interest-bearing
reserve requirements and regulation of deposit rates. For instance, in the euro area
reserve requirements bear interest at the marginal rate for the ECB's main refinancing
operations. Some euro area deposit rates still respond with some sluggishness to
changes in the monetary-policy interest rates, but this has become less pronounced
since the introduction of the euro, cf. De Bondt (2002).
In many countries deposits are more likely to increase than to decrease when
monetary-policy interest rates are raised. According to several empirical studies the
demand for money (i.e. in practice the demand for deposits) is positively linked to
short-term market interest rates or negatively to the spread between long-term and
short term market interest rates. The reason is that deposit rates in many countries
follow short-term market interest rates relatively closely.
Even if deposits were to decline following a monetary-policy tightening, the banks
need not necessarily reduce lending. Instead they may choose to finance lending by
borrowing in the money market or by issuing bonds. The banks may also start by re-
ducing other – typically more liquid – assets than loans, e.g. deposits at other banks or
their bond portfolios.

12-12-2003 07:48 Antal sider: 17 Rev. nr. 2 H:\kvo\ENG\2003\4qtr\tiltryk\085-101.doc
Oprettet af Anders Mølgaard Pedersen
89
lending activities must be reduced correspondingly. The link between a change in monetary policy and bank deposits may be seen if e.g. the banks are required to hold non-interest-bearing reserves at the central bank, or if deposit rates are regulated. As stated in the Box, this explan-ation is not fully relevant in all countries.
Like the balance-sheet channel, the bank-lending channel may also apply in other situations than when interest rates changes. For instance, in a period of economic slowdown, some banks may sustain large lend-ing losses, which undermine their capital reserves. As mentioned above, they may then tighten their credit policies in order to reduce lending. In practice it may be difficult to determine whether a tightening of the banks' credit policies is attributable to this factor or to concerns about a borrower's ability to meet payments (i.e. a balance-sheet channel).
METHODS TO ANALYSE THE CREDIT CHANNEL
A general problem in connection with empirical studies of a credit chan-nel is how to distinguish between the supply and demand effects of a change in bank lending. For instance, reduced bank lending following an increase in interest rates may be attributable to a decrease in the supply of loans in accordance with a credit channel, as well as lower demand for loans owing to higher interest rates. In addition, the de-mand for loans may also fall if economic activity has slowed down or is expected to slow down.
Various methods have been applied to distinguish between changes in the supply of and demand for loans. Some are briefly described in Box 2. In general, the different methods have been initially applied to studies using US data, cf. the references in the Box.
The strength of a credit channel in various countries may also be as-sessed by comparing relevant indicators of financial structures. This has been done in studies of a credit channel in e.g. the euro area member states1. In another type of study selected banks are asked about their view of the development in the supply of and demand for loans. This is done regularly in both the USA and the euro area.
THE CREDIT CHANNEL IN THE EURO AREA
Recent years have witnessed growing interest in investigating the im-pact of a credit channel in the euro area. This should be seen against the background of the introduction of the single monetary policy in the euro area member states, which has boosted interest in its transmission
1 See e.g. Kashyap and Stein (1997) and Cecchetti (2001).

12-12-2003 07:48 Antal sider: 17 Rev. nr. 2 H:\kvo\ENG\2003\4qtr\tiltryk\085-101.doc
Oprettet af Anders Mølgaard Pedersen
90
channels. Moreover, several US studies indicate that this channel plays a certain role in the USA1. Since a relatively large proportion of euro area
1 All the studies using US data referred to in Box 2 indicate that a credit channel exists in the USA.
METHODS OF STUDYING A CREDIT CHANNEL Box 2
Empirical studies of a credit channel have been based on different methods. The
following methods have been widely used (references in brackets are examples of
studies applying US data): • Studies based on statistical (vector autoregressive) models with the banks' total
lending and other variables (Bernanke and Blinder (1992)). The effect of a mon-
etary-policy change on total lending is examined. The models also include variables
for real activity, e.g. growth in the gross domestic product (GDP). A fall in lending
following a tightening of monetary policy may indicate that the banks have tight-
ened their credit policies. If GDP declines prior to or parallel with the fall in lending,
this is, however, an indication that the development may also reflect a fall in the
demand for loans. • Studies of corporate debt composition (Kashyap et al. (1993), Oliner and Rudebusch
(1996) and Nilsen (2002)). In addition to bank loans, corporate debt may comprise
e.g. bond debt and trade credit. It is examined how a monetary-policy change af-
fects the composition of corporate debt. If the proportion of bank loans falls fol-
lowing a tightening of monetary policy, this may indicate that the banks have tight-
ened their credit policies. If this proportion does not decline when total debt is
reduced, it is more likely to indicate a general fall in the demand for loans. In prin-
ciple, though, this could also reflect that all lenders (i.e. not only banks) have tight-
ened their credit policies. • Studies of business investments at enterprise level (Fazzari et al. (1988) and Carpen-
ter et al. (1994)). In these studies the significance of a cash-flow channel is exam-
ined. This is done by testing whether business enterprises' investments, in addition
to a number of other variables (e.g. turnover and a capital-cost measure), depend
on current profits or the cash flow (i.e. the difference between their ingoing and
outgoing payments). If that is the case, and the business enterprises' profits or cash
flow can be assumed to fall when interest rates increase, this indicates that a cash-
flow channel is relevant. Some studies specifically examine whether corporate
profits or cash flows decline when interest rates rise. • Studies of bank lending based on data on individual banks (Kashyap and Stein
(1995, 2000) and Kishan and Opiela (2000)). It is examined whether a monetary-
policy change have different effects on bank lending depending on a number of
characteristics of the individual banks. For instance, it is examined whether lending
by small banks, banks with relatively small capital reserves, or banks with a small
portfolio of liquid assets declines more than lending by other banks after a mone-
tary-policy tightening. Such differences between banks can hardly be explained by
changes in the demand for loans, but rather indicate a reaction on the supply side
in accordance with a credit channel.

12-12-2003 07:48 Antal sider: 17 Rev. nr. 2 H:\kvo\ENG\2003\4qtr\tiltryk\085-101.doc
Oprettet af Anders Mølgaard Pedersen
91
financing takes place via banks, this could also be expected to be the case in the euro area.
Empirical studies The most extensive study of a credit channel in the euro area was con-ducted by the Eurosystem (the ECB and the national central banks in the euro area member states) in 2001. It was part of a larger study of the monetary-policy transmission in the euro area member states and primar-ily comprised studies of business investments and bank lending based on data on individual enterprises and banks. The main conclusions from the study are outlined in Box 3.
The Eurosystem study showed that monetary policy primarily affects output in the euro area via the investment channel. The credit channel, on the other hand, may be less significant to monetary-policy transmis-sion in the entire euro area than previously expected. This may be due in part to the high degree of financial stability in the euro area banking sector and traditional close relations between banks and borrowers in some member states (ECB (2002a) and Angeloni et al. (2002)).
Other empirical studies of a credit channel have generally been limited to only one or a few euro area member states. The methods and data sets applied have differed across studies, which may explain the varia-tion in the results. However, several studies indicate that a credit chan-nel has some significance in Germany and Italy1. This is also in line with the results of the study conducted by the Eurosystem, cf. Box 3.
Indicators of financial structures The strength of a credit channel in the euro area member states can also be assessed by comparing indicators of financial structures. For instance, it may be relevant to look at conditions in the banking sector that may be of importance to a bank-lending channel. The same applies to indica-tors of households' and business enterprises' access to other sources of financing than banks. If there is access to a broad range of other sources of financing than bank loans, the strength of the credit channel will usually diminish.
Chart 1 shows a number of frequently observed indicators in this kind of studies. The assumed relationship between the indicators and the potential of a credit channel is also stated. For example, the strength of a bank-lending channel is often assumed to be greater in countries where the banking sector is dominated by many small banks (a low de-
1 For instance, Kakes and Sturm (2002) and De Bondt (1999) found indications of a credit channel in
Germany, and so did Angeloni et al. (1995) and Altunbas et al. (2002) as regards Italy. Some studies, however, show diverging results. Thus neither Guender and Moersch (1997) nor Kakes et al. (2001) found indications of a credit channel in Germany.

12-12-2003 07:48 Antal sider: 17 Rev. nr. 2 H:\kvo\ENG\2003\4qtr\tiltryk\085-101.doc
Oprettet af Anders Mølgaard Pedersen
92
gree of concentration). This reflects that small banks may find it more difficult to obtain other financing than deposits if the latter decrease as a result of a monetary-policy tightening.
A STUDY OF THE IMPACT OF MONETARY POLICY IN THE EURO AREA Box 3
In 2001 the Eurosystem conducted an comprehensive study of the monetary-policy
transmission in the euro area. It comprised three types of studies: (i) Studies based on
macroeconomic models and statistical (vector autoregressive) models for the individual
euro area member states and the entire euro area, (ii) studies of business investments at
enterprise level, and (iii) studies of bank lending based on data on individual banks.1
According to the macroeconomic and statistical models, changes in monetary policy
have a temporary impact on output in the euro area. The maximum effect is seen
around 1 year after the monetary-policy adjustment, after which output gradually
approaches its base scenario. Prices in the euro area are affected later than output,
but the impact is of longer duration. To some extent the size of these impacts on out-
put and prices depends on the specific model, but there are no signs of significant sys-
temic differences across countries.
Studies show that in most countries business investments depend on a measure of
capital costs. This reflects the normal investment channel. In addition, investments in
most countries depend on business enterprises' cash flows. If cash flows diminish
when interest rates go up, this indicates that a cash-flow channel is relevant. Several
studies demonstrated that cash flows do indeed diminish when interest rates increase.
The studies of banks' lending confirmed that a monetary-policy tightening normally
dampens lending activity. Furthermore, in most countries the lending reaction is
greater in banks with a relatively small portfolio of liquid assets than in other banks.
This difference indicates a reaction on the supply side. However, a greater lending re-
action in small banks or banks with relatively small capital reserves is only seen in a
few euro area member states. This is contrary to the findings of similar surveys in the
USA (Kashyap and Stein (1995) and Kishan and Opiela (2000)). Thus, these surveys
show clearer signs of a credit channel in the USA than in the euro area.
ECB (2002a) and Angeloni et al. (2002) include a summary of the studies and an as-
sessment of the significance of the various transmission channels. They conclude that
most of the monetary-policy impact on output in the euro area is related to the direct
effect of interest-rate changes on investments (the investment channel). On the other
hand, the effect of the credit channel on output in the euro area as whole may be
rather limited. The credit channel may have some significance in a few member states,
including Germany and Italy.
ECB (2002a) and Angeloni et al. (2002) also present a number of explanations of
why banks apparently play a smaller role in the monetary-policy transmission than
previously expected. These include the high degree of financial stability in the euro
area banking sector (illustrated by the relatively few cases where banks have col-
lapsed), as well as traditionally close relations between banks and borrowers in some
countries. The strength of the bank-lending channel may also be smaller in the euro
area than in e.g. the USA because bank deposits decrease less when monetary policy is
tightened, cf. Box 1.
1 The studies have been published in the ECB's Working Papers as nos. 91-112.

12-12-2003 07:48 Antal sider: 17 Rev. nr. 2 H:\kvo\ENG\2003\4qtr\tiltryk\085-101.doc
Oprettet af Anders Mølgaard Pedersen
93
Banks' portfolios of liquid assets and the proportion of short-term lend-ing are usually also assumed to affect the strength of a bank-lending channel. If the portfolio of liquid assets is relatively modest, the banks have limited options to reduce other assets than lending. If the loans have a relatively short term to maturity, the banks can reduce lending faster.
Access to other financing than bank loans can be assessed by looking at the composition of households' and business enterprises' debt. If there are a broad range of alternative borrowing options, other loans
SELECTED INDICATORS OF THE POTENTIAL FOR A CREDIT CHANNEL IN THE EURO AREA MEMBER STATES AND DENMARK, END-2000 Chart 1
Note: Source:
AT: Austria, BE: Belgium, DE: Germany, DK: Denmark, ES: Spain, FI: Finland, FR: France, GR: Greece, IE: Ireland, IT: Italy, LU: Luxembourg, NL: Netherlands, PT: Portugal. The degree of concentration in the MFI sector (Monetary Financial Institutions) is calculated as the sum of the balance sheets of the 5 largest MFIs as a percentage of the total balance sheet. Liquid assets as a percentage of the MFI balance sheet is calculated as the MFIs' cash, money-market lending and bonds as a percentage of the total balance sheet. MFI lending with a maturity of up to 1 year is calculated as the percentage of the MFIs' lending to households and non-financial corporations with a maturity of up to 1 year. Households' other loans are calculated as their loans from other sources than domestic MFIs as a percentage of their total borrowing. Enterprises' other loans is the sum of non-financial corporations' loans from other sources than domestic MFIs and issued bonds as a percentage of their total borrowing and issued bonds. Enterprises' issued shares, etc. are calculated as the value of non-financial corporations' total issued shares and other equity as a percentage of their total balance sheets. ECB (2002b), Statistics Denmark (2003) and Danmarks Nationalbank.
0102030405060708090
100
DE IT LU IE AT FR ES PT GR DK BE NL FI
Per cent
Higher potential
Degree of concentration
05
1015202530354045
PT FI DK IT NL ES IE AT BE DE LU FR GR
Per cent
Higher potential
Liquid assets
0
10
20
30
40
50
60
FI DK DE FR ES NL AT BE PT LU IE IT GR
Per cent
Higher potential
Lending with a maturity of up to 1 year
0
5
10
15
20
25
30
ES DE PT IT DK FI BE NL FR AT
Households' other loans
Higher potential
Per cent
0
10
20
30
40
50
60
70
80
90
AT IT ES DK DE PT FR BE NL FI
Enterprises' other loans
Higher potential
Per cent
0
10
20
30
40
50
60
70
80
AT PT DE NL IT ES FR DK BE FI
Enterprises' issued shares, etc.Per cent
Higher potential
12-12-2003 07:48 Antal sider: 17 Rev. nr. 2 H:\kvo\ENG\2003\4qtr\tiltryk\085-101.doc
Oprettet af Anders Mølgaard Pedersen
94
than bank loans will constitute a larger proportion of the debt, viewed in isolation. In addition to debt financing, business enterprises may also obtain financing by issuing shares. If access to this source is favourable, the value of issued shares will, other things being equal, constitute a larger proportion of the business enterprises' liabilities.
The indicators in Chart 1 point to a credit channel having a greater impact in Italy and Germany than in other euro area member states. In both member states the banking sector is dominated by many relatively small banks. Moreover, Italian banks' portfolios of liquid assets are rela-tively small, and a large proportion of their lending consists of short-term loans. In both Italy and Germany, bank loans constitute a relatively large proportion of households' and business enterprises' debt, and share financing is less prevalent than in several other member states.
The potential for a credit channel is lower in Belgium, France and the Netherlands. In these member states the banking sector is more concen-trated than in Italy and Germany, and loans have longer maturities than in Italy. Bank loans also constitute a relatively small proportion of households' and business enterprises' financing in these countries, which indicates fairly easy access to other sources of financing.
The ECB's bank-lending survey The significance of the credit channel may also be investigated by asking selected banks about their views on the development in the supply of and demand for loans. The ECB has introduced a quarterly survey in which euro area banks respond to a series of questions about their credit policies and customer demand for loans. Box 4 briefly describes the main content of the survey.
So far, the ECB's bank-lending survey has been conducted four times. Charts 2 and 3 show the development in the banks' credit standards and their perception of the development in the demand for loans. The net figure in the two Charts is the difference between the percentage of banks which have respectively tightened and eased their credit stand-ards (or believe that the demand for loans has increased and decreased, respectively). The two Charts also show the net figures for the banks' expectations for the 4th quarter of 2003.
The first results show that throughout the period of the survey the banks tightened their credit standards (the net figure is higher than 0). According to the banks the main reason is greater uncertainty as to the general economic situation and the prospects for specific industries and business enterprises. The banks' tightening of their credit standards is thus attributable to concerns as to the borrowers' ability to meet pay-ments, i.e. the balance-sheet-channel mechanisms.

12-12-2003 07:48 Antal sider: 17 Rev. nr. 2 H:\kvo\ENG\2003\4qtr\tiltryk\085-101.doc
Oprettet af Anders Mølgaard Pedersen
95
The banks also report that the demand for loans was declining through-out the period under review. This particularly applies to business enter-prises. However, the banks expect higher demand for loans from both households and business enterprises in the 4th quarter of 2003.
The combination of tighter credit policies and lower demand for loans is also reflected in actual growth in lending. During 2003 lending by euro area banks to the private sector has increased by around 5 per cent on an annual basis, which is somewhat below the level in the preceding years.
THE ECB'S BANK-LENDING SURVEY Box 4
In 2003 the ECB introduced a quarterly survey of bank lending in the euro area based
on a standard questionnaire1. The survey is inspired by a similar survey by the Federal
Reserve which has been conducted since 19672. The purpose of the new bank-lending
survey is to gain more knowledge of euro area lending conditions. For instance, the
survey may help to explain whether a given change in lending is attributable to a
change in the supply of or demand for loans.
Almost 90 euro area banks participate in the survey. All euro area member states
are represented by at least three banks each. In addition, the aim is for the relative
number of banks from each euro area member state to correspond more or less to
that member state's proportion of euro area lending. The participants in the survey
normally include the largest banks in each member state.
The questionnaire comprises 18 questions, 10 of which concern the banks' lending
policies (credit standards and conditions and terms for loans), while 7 questions con-
cern the banks' views on the development in the demand for loans. The last question
gives the banks an opportunity to describe any other issues which may have affected
lending during the preceding quarter.
All questions (except for the last one) offer a choice of five answers. For instance
the banks must state whether their credit standards have been "tightened consider-
ably" or "tightened somewhat", have "remained basically unchanged", or have been
"eased somewhat" or "eased considerably" over the past three months. Most of the
questions are retrospective, but there are also a few questions about the banks' ex-
pectations for the next three months.
The questionnaire is divided into questions on lending to business enterprises and
households. A distinction is made between large enterprises and small and medium-
sized enterprises, and between short-term and long-term loans to enterprises. Lend-
ing to households is divided into loans for house purchase and consumer credit.
In connection with some questions the banks must state the factors influencing
their credit standards. These questions can be used inter alia to distinguish between
the balance-sheet channel and the bank-lending channel. The banks must also state
the factors which may have affected the demand for loans.
The result of the survey is published quarterly (in February, May, August and No-
vember) in a separate report on the ECB's website (www.ecb.int).
1 The survey is described in ECB (2003), which includes the questionnaire in an annex. 2 The Senior Loan Officer Opinion Survey (published on the website of the Federal Reserve at
www.federalreserve.gov/boarddocs/SnloanSurvey).

12-12-2003 07:48 Antal sider: 17 Rev. nr. 2 H:\kvo\ENG\2003\4qtr\tiltryk\085-101.doc
Oprettet af Anders Mølgaard Pedersen
96
CREDIT STANDARDS FOR LENDING Chart 2
Note: Source:
The percentage balance indicates the percentage of banks which have tightened (expect to tighten) their credit standards less the percentage which have eased (expect to ease) their credit standards. Lending to households is for consumption. ECB.
DEMAND FOR LOANS Chart 3
Note: Source:
The percentage balance indicates the percentage of banks which state that demand has increased (expect it to increase) less the percentage which state that demand has fallen (expect it to fall). Lending to households is for consumption. ECB.
-10
0
10
20
30
40
50
60
70
To enterprises To enterprises, expected
To households To households, expected
Percentage balances
Q4 2002 Q1 2003 Q2 2003 Q3 2003 Q4 2003
-40
-30
-20
-10
0
10
20
30
From enterprises From enterprises, expected
From households From households, expected
Q4 2002 Q1 2003 Q2 2003 Q3 2003 Q4 2003
Percentage balances

12-12-2003 07:48 Antal sider: 17 Rev. nr. 2 H:\kvo\ENG\2003\4qtr\tiltryk\085-101.doc
Oprettet af Anders Mølgaard Pedersen
97
THE CREDIT CHANNEL IN DENMARK
This section briefly discusses the significance of a credit channel in Den-mark in connection with interest-rate changes. Generally, a credit chan-nel does not seem to play a significant role in Denmark.
Lending by mortgage-credit institutes and the balance-sheet channel Most loans of Danish households have been raised from mortgage-credit institutes against real property as collateral. The loans run for many years, and normally the mortgage-credit institutes do not tighten the loan conditions during the term of the loan, even though the value of the real property, i.e. the collateral, decreases. The Danish mortgage-credit system thereby tends to dampen the potential of a credit channel.
Borrowing from a mortgage-credit institute also differs from bank loans in other respects. A mortgage-credit institute may tighten its credit policies (vis-à-vis a new customer or in connection with a supplementary loan) by reducing the accepted loan-to-value ratio for the property in relation to the statutory maximum. On the other hand, the mortgage-credit institute only has limited options to tighten credit by changing its lending rate, which is mainly determined by the bond market1.
For a borrower considering raising a supplementary loan, a balance-sheet channel may in principle operate via a change in the net housing wealth2. If the latter falls after an increase in interest rates, the maxi-mum loan amount against the home as collateral is reduced. The bor-rower may be able to borrow the differential amount from a bank, but the loan costs are usually higher than for mortgage credit. From the borrower's point of view the effect of the original increase in interest rates is thus reinforced.
The relationship between changes in interest rates and net housing wealth is relatively complex. It depends on the effect of short-term and long-term interest rates on housing prices, and on the type of loan (adjustable-rate or fixed-rate loans). The widespread use of adjustable-rate loans in recent years may have amplified the effect of changes in both short-term and long-term interest rates on the households' net housing wealth3.
1 The mortgage-credit institute may adjust the contributions to cover e.g. its administration costs and
lending losses. The contribution is, however, usually fixed on a long-term basis and constitutes only a small part of the outstanding debt, e.g. 0.5 per cent per annum.
2 The net housing wealth can be calculated as the cash value of the home less the cash value of its
financing. 3 See Christensen and Kjeldsen (2002). If the more widespread use of adjustable-rate loans has in-
creased the significance of short-term interest rates to housing prices, this may have reinforced the effect of short-term interest rates on net housing wealth. The growing popularity of adjustable-rate loans may also have amplified the effect of long-term interest rates on net housing wealth, since the value of the outstanding debt on such loans is not affected by a change in long-term interest rates, while housing prices usually are.

12-12-2003 07:48 Antal sider: 17 Rev. nr. 2 H:\kvo\ENG\2003\4qtr\tiltryk\085-101.doc
Oprettet af Anders Mølgaard Pedersen
98
Bank lending and the bank-lending channel Under normal circumstances, a bank-lending channel is not believed to have any significant impact in Denmark.
The banks' capital reserves may decline when interest rates increase. If short-term interest rates go up, some banks will sustain capital losses on their short-term bonds. However, this is often offset in the slightly longer term by higher net interest income from deposits and lending. If long-term interest rates rise, the banks will also sustain capital loses on their long-term bonds. In a period with sound capital reserves and lim-ited lending losses, capital losses must, however, be large before they can be expected to affect the banks' supply of loans1.
The other explanation of a bank-lending channel – the "deposit ex-planation" – is not particularly relevant in Denmark. In practice, fluctua-tions in the Danish banks' deposit rates reflect changes in short-term interest rates fairly closely, inter alia because the banks are not required to hold non-interest-bearing reserves at Danmarks Nationalbank, and because deposit rates are not regulated. Consequently, bank deposits do not usually fall when short-term interest rates rise.
The potential for a bank-lending channel also depends on access to other financing than bank loans. In Denmark owners of real property may raise loans from mortgage-credit institutes as an alternative to bank loans. Owing to the balance principle mortgage-credit institutes are not affected by the mechanisms underlying a bank-lending channel to the same extent as banks. In this respect, too, the mortgage-credit system tends to dampen the potential for a credit channel in Denmark. Indicators of financial structures Chart 1 includes the same indicators for Denmark as for the euro area member states. In terms of these indicators, Denmark does not differ significantly from the euro area. The relatively small proportion of short-term lending in Denmark is attributable to the widespread use of long-term mortgage-credit loans. The relatively small portfolio of liquid assets is also a consequence of the importance of mortgage-credit loans in Denmark. Thus, it can be explained by the fact that mortgage-credit institutes do not have the same requirement for liquid assets as e.g. banks, since their financing is more stable.
1 The sensitivity to an increase in interest rates can be illustrated by calculations in Danmarks National-
bank (2003). On an upwards parallel displacement of the yield curve by 1 percentage point the num-ber of Danish banks (categories 1, 2 and 3) with negative results in 2002 would increase from 2 to 3. On a similar displacement by 3 percentage points, a further 17 banks would have negative results.

12-12-2003 07:48 Antal sider: 17 Rev. nr. 2 H:\kvo\ENG\2003\4qtr\tiltryk\085-101.doc
Oprettet af Anders Mølgaard Pedersen
99
LITERATURE
Altunbas, Y., Otabek Fazylov and Philip Molyneux (2002), Evidence on the bank lending channel in Europe, Journal of Banking & Finance, Vol. 26.
Angeloni, Ignazio, L. Buttiglioni, G. Ferri and E. Gaiotti (1995), The Credit Channel of Monetary Policy across Heterogenous Banks: The Case of Italy, Banca d'Italia, Temi di discussione, No. 256.
Angeloni, Ignazio, Anil Kashyap, Benoît Mojon and Daniele Terlizzese (2002), Monetary transmission in the euro area: where do we stand? ECB Working Paper No. 114.
Bernanke, Ben S. and Alan S. Blinder (1992), The Federal Funds Rate and the Channels of Monetary Transmission, The American Economic Review, Vol. 82, No. 4.
Bernanke, Ben S. and Mark Gertler (1995), Inside the Black Box: The Credit Channel of Monetary Policy Transmission, Journal of Economic Perspectives, Vol. 9, No. 4.
Borup, Lisbeth and Morten Lykke (2003), New Capital-Adequacy Rules for Credit Institutions, Danmarks Nationalbank, Monetary Review, 3rd Quarter.
Carpenter, Robert E., Steven M. Fazzari and Bruce Petersen (1994), Inventory Investment, Internal-Finance Fluctuations, and the Business Cycle, Brookings Papers on Economic Activity, No. 2. Cecchetti, Stephen G. (2001), Legal Structure, Financial Structure and the Monetary Policy Transmission Mechanism, in Deutsche Bundesbank (ed.), The Monetary Transmission Process – Recent Developments and Lessons for Europe, Palgrave.
Christensen, Anders Møller and Kristian Kjeldsen (2002), Adjustable-Rate Mortgages, Danmarks Nationalbank, Monetary Review, 2nd Quarter.
Danmarks Nationalbank (2003), Financial Stability 2003. De Bondt, Gabe J. (2002), Retail bank interest rate pass-through: new evidence at the euro area level, ECB Working Paper No. 136.

12-12-2003 07:48 Antal sider: 17 Rev. nr. 2 H:\kvo\ENG\2003\4qtr\tiltryk\085-101.doc
Oprettet af Anders Mølgaard Pedersen
100
De Bondt, Gabe J. (1999), Banks and monetary transmission in Europe: empirical evidence, Banca Nazionale del Lavoro, Quarterly Review, 52.
ECB (2002a), Recent findings on monetary policy transmission in the euro area, Monthly Bulletin, October.
ECB (2002b), Report on financial structures.
ECB (2003), A bank lending survey for the euro area, Monthly Bulletin, April.
Fazzari, Steven M., R. Glenn Hubbard and Bruce C. Petersen (1988), Financing Constraints and Corporate Investment, Brookings Papers on Economic Actvity, No. 1.
Guender, Alfred and Mathias Moersch (1997), On the Existence of a Credit Channel of Monetary Policy in Germany, Kredit und Kapital, No. 2.
Hubbard, R. Glenn (1995), Is there a "Credit Channel" for Monetary Policy?, Federal Reserve Bank of St. Louis, Review, May/June.
Kakes, Jan, Jan-Egbert Sturm and Philipp Maier (2001), Monetary trans-mission and bank lending in Germany, Kredit und Kapital, No. 4.
Kakes, Jan and Jan-Egbert Sturm (2002), Monetary policy and bank lending: Evidence from German banking groups, Journal of Banking & Finance, Vol. 26.
Kashyap, Anil K., Jeremy C. Stein and David W Wilcox (1993), Monetary Policy and Credit Conditions: Evidence from the Composition of External Finance, The American Economic Review, Vol. 83, No. 1.
Kashyap, Anil K. and Jeremy C. Stein (1995), The impact of monetary policy on bank balance sheets, Carnegie-Rochester Conference Series on Public Policy, 42.
Kashyap, Anil K. and Jeremy C. Stein (1997), The role of banks in mone-tary policy: a survey with implications for the European monetary un-ion, Federal Reserve Bank of Chicago, Economic Perspective, Vol. 21, No. 5.

12-12-2003 07:48 Antal sider: 17 Rev. nr. 2 H:\kvo\ENG\2003\4qtr\tiltryk\085-101.doc
Oprettet af Anders Mølgaard Pedersen
101
Kashyap, Anil K. and Jeremy C. Stein (2000), What Do a Million Observa-tions on Banks Say About the Transmission of Monetary Policy, The American Economic Review, Vol. 90, No. 3.
Kishan, Ruby P. and Timothy P. Opiela (2000), Bank Size, Bank Capital, and the Bank Lending Channel, Journal of Money, Credit, and Banking, Vol. 32, No. 1. Nilsen, Jeffrey H. (2002), Trade Credit and the Bank Lending Channel, Journal of Money, Credit, and Banking, Vol. 34, No. 1.
Oliner, Stephen D. and Glenn D. Rudebusch (1996), Monetary Policy and Credit Conditions: Evidence from the Composition of External Finance: Comment, The American Economic Review, Vol. 86, No. 1.
Statistics Denmark (2003), Financial Accounts 1995-2001, Statistical Reports. National Accounts and Balance of Payments, No. 2003:3, 31 January.


12-12-2003 07:49 Antal sider: 2 Rev. nr. 2 H:\kvo\ENG\2003\4qtr\tiltryk\103-104.doc
Oprettet af Josephine Rasmussen
103
Press releases
24 SEPTEMBER: NEW 500-KRONE BANKNOTE - NEW SECURITY FEATURES, BUT SAME MOTIFS
On 24 September 2003 Danmarks Nationalbank will issue a more secure 500-krone banknote with a hologram and fluorescent colours. The motifs remain unchanged, i.e. the portrait of the nuclear physicist Niels Bohr on the face of the banknote and a knight fighting a dragon on the reverse.
Hologram and fluorescent colours The motifs of the new hologram are the figure 500, an atom and a "D" (Roman numeral for 500). The face and reverse feature fluorescent col-ours which shine under ultraviolet light. The knight from the reverse also appears on the face of the banknote, but is only visible under ultra-violet light. The orange colour on the reverse also shines under ultravio-let light.
The new enhanced security features will make the Danish banknotes even harder to counterfeit.
Old banknotes still legal tender The old 500-krone banknotes are still legal tender, but will be with-drawn from circulation on an ongoing basis. For a period the two va-rieties of the 500-krone banknote will be in parallel circulation.
The upgrading continues Most of the banknotes in the series have now been upgraded with the new security features. The remaining two banknotes – 50- and 1,000-kroner – are expected to be upgraded within 1½ years.
Further information At Danmarks Nationalbank's website, www.nationalbanken.dk, under Notes and coins, you will find further information, including the folder "New security for banknotes". Pictures of the new security features are also provided under Press room/Photogallery/Banknotes.

12-12-2003 07:49 Antal sider: 2 Rev. nr. 2 H:\kvo\ENG\2003\4qtr\tiltryk\103-104.doc
Oprettet af Josephine Rasmussen
104
29 SEPTEMBER: NEW BALANCE OF PAYMENTS BENEFITS THE BUSINESS COMMUNITY
As from 2005 Statistics Denmark and Danmarks Nationalbank are to amend the method of collecting data for the compilation of Denmark’s balance of payments. The purpose is to ensure an up-to-date, reliable balance of payments, and to reduce the burdens on the business com-munity. It has become increasingly difficult to maintain quality as cross-border payments no longer fall into the patterns for funds transfers of previous times, but now to a high degree consist of complex transactions for trading of services, securities and investments.
"The current compilation method has become outdated. The restruc-turing will ease the burden on the business community considerably," states Governor Torben Nielsen of Danmarks Nationalbank.
The adjustment entails that the banks’ reporting of customers' inward and outward foreign payments will lapse. It is replaced by direct reports from companies that undertake large external transactions. After the restructuring only approximately 2,500 companies in total will report data, whereas currently the payments of 25,000 companies are reported via the banks.
Jan Plovsing, Director General, National Statistician, of Statistics Den-mark emphasises that: "It is important that we ensure the future quality of the balance of payments since it is a key statistical tool in analysing the course of the Danish economy".
The new compilation method is to be presented to the business com-munity during autumn and winter 2003 via e.g. letters and seminars. Most of the information to be collected is already available in the com-panies' accounting systems. Companies will be offered a wide range of options for reporting and automatic submission of information.
More details of the restructuring are available at: www.nationalbanken.dk overview, and at www.dst.dk/betalingsbalance.

15-12-2003 10:06 Antal sider: 15 Rev. nr. 2 H:\kvo\ENG\2003\4qtr\tiltryk\4-tab-till-
fuld.doc Oprettet af Palle Lorentzen
Tables
Interest rates and share-price index.......................................................... 1 Selected items from the Nationalbank's balance sheet .......................... 2 Factors affecting the banks' and the mortgage-credit institutes' net position with the Nationalbank ........................................ 3 Selected items from the consolidated balance sheet of the MFI sector and the money stock.................................................................................. 4 The banks' lending ..................................................................................... 5 Selected items from the balance sheet of the mortgage-credit institutes .................................................................. 6 Principal items of the balance of payments (net revenues) .................... 7 External financial payments (net payments from abroad)...................... 8 Denmark's international investment position.......................................... 9 GDP by type of expenditure ...................................................................... 10 Development in consumer prices and net retail pricyes.......................... 11 Selected monthly economic indicators ..................................................... 12 Selected quarterly economic indicators ................................................... 13 Exchange rates ........................................................................................... 14 Danmarks Nationalbank's Statistical Publications
Symbols and Sources 0 Magnitude nil or less than one half of unit employed. … Data not available or of negligible interest. Some of the most recent statistics may be provisional. Due to rounding-off there may be small differences between the sum of the individual figures and the totals stated. Date of going to press: 12 December 2003. The Tables section of this publication is thus based on more recent in-formation than the equivalent section of the Danish edition. Danmarks Nationalbank is the source for Tables 1-6, 8-9 and 14, while the Copenhagen Stock Exchange is the source for series of bond yields and the share-price index in Table 1. Statistics Denmark is the source for Tables 7 and 10-13. The calculations in Table 11 have been made by Dan-marks Nationalbank.

15-12-2003 10:06 Antal sider: 15 Rev. nr. 2 H:\kvo\ENG\2003\4qtr\tiltryk\4-tab-till-
fuld.doc Oprettet af Palle Lorentzen
INTEREST RATES AND SHARE-PRICE INDEX Table 1
The Nationalbank's interest rates Bond yields
Discount rate
Lending and
certifi-cates of deposit
The ECB'sminimumbid rate (in the main
refinanc-ing
opera-tions)
Inter-bank interest
rate, 3-months uncollat-eralized
10-year central- govern-
ment bond
30-year mort-gage-credit bond
The Copen-hagen Stock
Exchange share-price index KFX
Effective end-of-year/ from Per cent per annum End of period Per cent per annum
3.7.89 =100
1998 ............... 3.50 3.95 … 1998 ............. 4.05 4.35 7.10 219.34 1999 ............... 3.00 3.30 3.00 1999 ............. 3.57 5.64 7.45 255.69 2000 ............... 4.75 5.40 4.75 2000 ............. 5.33 5.20 7.30 313.90 2001 ............... 3.25 3.60 3.25 2001 ............. 3.54 5.15 6.55 272.45 2002 ............... 2.75 2.95 2.75 2002 ............. 3.00 4.45 5.47 199.49
2002 6 Dec. ... 2.75 2.95 2.75 2002 Nov..... 3.19 4.81 5.72 208.53
2003 7 Mar.... 2.50 2.70 2.50 2003 Jun ..... 2.11 4.03 5.29 214.90 23 May.... 2.50 2.65 2.50 Jul ...... 2.12 4.27 5.47 214.52 6 Jun. .... 2.00 2.15 2.00 Aug .... 2.14 4.39 5.56 242.16 Sep ..... 2.13 4.22 5.43 238.19 Oct ..... 2.16 4.51 5.58 258.01
12 Dec... 2.00 2.15 2.00 Nov..... 2.19 4.62 5.61 242.72
SELECTED ITEMS FROM THE NATIONALBANK'S BALANCE SHEET Table 2
The banks' and the mortgage-credit institutes' net position with the
Nationalbank The
foreign-exchange reserve
(net)
Notes and coin in circula-
tion
The central govern-ment's account with the National-
bank
Certifi-cates of deposit
Deposits (current account) Loans
Total net position
End of period Kr. billion
1998 .............................. 101.4 41.0 37.1 34.8 12.6 29.8 17.6 1999 .............................. 165.3 46.4 39.7 99.9 6.5 33.1 73.3 2000 .............................. 117.5 44.8 37.7 51.9 8.1 25.3 34.6 2001 .............................. 148.4 47.3 43.5 113.6 3.7 63.4 53.9 2002 .............................. 193.2 47.7 50.3 160.7 10.1 81.2 89.6
2002 Nov........................ 195.9 45.1 67.2 131.1 5.7 64.4 72.4
2003 Jun......................... 233.8 47.3 94.3 138.3 14.6 71.1 81.7 Jul.......................... 232.1 47.2 82.5 170.1 12.8 91.1 91.8 Aug ....................... 230.0 46.5 90.7 163.1 4.6 86.0 81.6 Sep ........................ 227.8 46.3 89.4 132.8 13.0 63.5 82.3 Oct......................... 228.5 46.5 84.3 142.7 3.9 59.4 87.2 Nov........................ 228.2 47.1 52.7 150.6 6.9 42.1 115.4

15-12-2003 10:06 Antal sider: 15 Rev. nr. 2 H:\kvo\ENG\2003\4qtr\tiltryk\4-tab-till-
fuld.doc Oprettet af Palle Lorentzen
FACTORS AFFECTING THE BANKS' AND THE MORTGAGE-CREDIT INSTITUTES' NET POSITION WITH THE NATIONALBANK Table 3
Central-government finance
The banks' and the mortgage-credit
institutes' net position with the
Nationalbank
Domestic gross
financing require-
ment
Sales of domestic central-govern-
ment securities
Liquidity effect
Net purchase
of foreign
exchange by the
National-bank
The National-
bank's net
bond purchases
Other factors
Change in net
position End of period
Kr. billion
1998 ................. 64.1 68.0 -3.8 -28.7 3.2 -4.5 -33.7 17.6 1999 ................. 67.9 68.8 -0.9 62.7 1.9 -7.9 55.7 73.3 2000 ................. 62.3 65.7 -3.4 -37.7 2.1 0.4 -38.7 34.6 2001 ................. 81.2 87.7 -6.5 28.4 1.0 -3.6 19.3 53.9 2002 ................. 115.5 121.9 -6.4 45.4 -0.9 -2.4 35.7 89.6
2002 Nov ........... 24.4 10.3 14.0 -0.1 1.4 -1.9 13.5 72.4
2003 Jun............ 7.0 11.6 -4.5 8.6 -0.3 -0.1 3.6 81.7 Jul ............. 16.8 7.0 9.8 0.3 0.0 0.0 10.0 91.8 Aug........... -11.8 -1.4 -10.4 0.1 0.1 0.1 -10.1 81.6 Sep............ 8.5 9.4 -1.0 0.0 1.0 0.6 0.6 82.3 Oct............ 13.4 8.3 5.1 0.7 -0.2 -0.7 4.9 87.2 Nov ........... 23.6 -8.1 31.6 -0.3 -1.3 -1.8 28.2 115.4

15-12-2003 10:06 Antal sider: 15 Rev. nr. 2 H:\kvo\ENG\2003\4qtr\tiltryk\4-tab-till-
fuld.doc Oprettet af Palle Lorentzen
SELECTED ITEMS FROM THE CONSOLIDATED BALANCE SHEET OF THE MFI SECTOR AND THE MONEY STOCK Table 4
of which:
Domestic lending
of which:
Total balance Total
House-holds
Non-financial
companies
Holdings of domestic securities
other than shares
Foreign assets, net 1
Money stock (M3)
End of period Kr. billion
1998 .................. 2,407.2 1,491.0 929.6 408.2 153.3 154.6 523.2 1999 .................. 2,612.8 1,578.2 1,001.8 420.0 125.8 163.7 523.2 2000 .................. 2,806.8 1,758.7 1,076.8 499.2 114.2 49.6 506.4 2001 .................. 2,932.1 1,925.9 1,168.6 573.2 133.1 -46.9 546.4 2002 .................. 3,201.5 2,024.5 1,249.3 578.3 142.8 -63.9 604.7
2002 Oct .............. 3,215.2 2,006.5 1,236.5 573.6 152.6 -46.8 604.6
2003 May ............. 3,461.8 2,076.0 1,287.8 594.1 156.9 -30.3 713.3 Jun ............ 3,482.1 2,107.4 1,301.8 605.1 161.6 -34.0 687.9 Jul ............ 3,403.4 2,098.1 1,305.3 593.6 160.1 -56.6 716.4 Aug ............. 3,403.3 2,100.7 1,312.9 597.0 157.2 -63.2 707.5 Sep ............. 3,445.2 2,126.2 1,327.8 602.0 157.5 -26.4 687.2
Oct ............ 3,383.7 2,120.6 1,329.0 594.0 151.7 -55.6 729.2
Change compared with previous year, per cent
1998 .................. 12.5 9.4 10.2 6.4 10.8 … 3.7 1999 .................. 8.5 5.8 7.8 2.9 -17.9 … 0.0 2000 .................. 7.4 11.4 7.5 18.9 -9.2 … -3.2 2001 .................. 4.5 9.5 8.5 14.8 16.5 … 7.9 2002 .................. 9.2 5.1 6.8 0.9 7.3 … 10.7
2002 Oct .............. 8.8 6.5 9.8 1.7 6.6 … 2.9
2003 May ............. 12.4 5.7 8.1 2.8 10.6 … 24.3 Jun ............ 10.5 6.4 8.3 3.7 8.3 … 21.9 Jul ............ 10.7 6.5 8.1 3.3 3.5 … 21.6 Aug ............. 8.9 5.1 6.8 3.5 2.8 … 20.1 Sep ............ 6.6 5.8 7.6 3.5 -3.4 … 16.3 Oct ............ 5.2 5.7 7.5 3.6 -0.6 … 20.6 Note: The MFI sector includes Danish Monetary Financial Institutions, i.e. banks and mortgage-credit institutes, other
credit institutions, money-market funds and Danmarks Nationalbank. 1 The net foreign assets of the MFI sector has been compiled as the difference between all assets and liabilities vis-
a-vis non-residents.

15-12-2003 10:06 Antal sider: 15 Rev. nr. 2 H:\kvo\ENG\2003\4qtr\tiltryk\4-tab-till-
fuld.doc Oprettet af Palle Lorentzen
THE BANKS LENDING Table 5
From banks in Denmark From Danish owned banks abroad
of which: of which:
To Danish resid- ents total
House-holds
Non-financial
com- panies
To non-
Danish residents Total
To Danish resid- ents
To non-
Danish residents
Total lending
End of period Kr. billion
1998 ................. 379.0 194.7 112.5 74.8 248.1 96.4 151.7 701.8 1999 ................. 399.8 203.4 117.2 105.0 345.4 123.2 222.1 850.2 2000 ................. 526.2 239.0 186.4 104.7 312.5 66.2 246.3 943.4 2001 ................. 588.0 253.3 228.8 112.7 288.1 34.6 253.5 988.8 2002 ................. 599.2 253.5 231.3 124.5 298.3 32.6 265.7 1.022.0
2002 Oct............ 589.2 251.2 223.2 146.6 … … … …
2003 May .......... . 639.6 245.5 282.7 138.9 … … … … Jun ........... 663.3 254.6 291.3 140.9 293.0 31.4 261.6 1.097.2 Jul ........... 645.0 251.1 278.9 120.5 … … … … Aug........... . 637.5 250.8 278.5 117.6 … … … … Sep ........... 656.9 261.4 282.8 137.5 326.8 30.0 296.8 1.121.2
Oct ........... 645.1 258.2 273.1 124.2 … … … …
Change compared with previous year, per cent
1998 ................. 13.4 9.2 16.7 -34.2 12.8 13.9 12.0 5.1 1999 ................. 5.5 4.5 4.2 40.4 39.2 27.8 46.4 21.1 2000 ................. 31.6 17.6 59.0 -0.3 -9.5 -46.3 10.9 11.0 2001 ................. 11.7 6.0 22.7 7.6 -7.8 -47.7 2.9 4.8 2002 ................. 1.9 0.1 1.1 10.5 3.5 -5.8 4.8 3.4
2002 Oct............ 2.8 4.1 0.3 33.8 … … … …
2003 May .......... . 8.1 -0.3 22.4 -1.6 … … … … Jun ........... 9.3 0.6 22.5 8.0 -1.0 0.6 1.5 6.2 Jul ........... 9.6 0.2 22.1 -7.6 … … … … Aug........... . 8.7 1.7 22.7 -4.9 … … … … Sep ........... 9.8 2.5 22.5 -1.3 15.2 -2.6 17.4 9.8 Oct ........... 9.5 2.8 22.4 -15.3 … … … … Note: As from 2003 the banks' lending is affected by the inclusion of an institution previously belonging to the category
"Other Credit Institutions". Lending to households includes lending to self-employed individuals.

15-12-2003 10:06 Antal sider: 15 Rev. nr. 2 H:\kvo\ENG\2003\4qtr\tiltryk\4-tab-till-
fuld.doc Oprettet af Palle Lorentzen
SELECTED ITEMS FROM THE BALANCE SHEET OF THE MORTGAGE-CREDIT INSTITUTES Table 6
of which:
Domestic lending 1
Debt securities
issued Total
balance Total
of which: Lending to
house- holds 2
of which:Interest adjusted lending
of which: Lending in
foreign currency
End of period Kr. billion
1998 .................. 1,172.2 987.8 731.0 … 1.4 1,122.4 1999 .................. 1,222.9 1,050.9 785.8 59.7 9.6 1,116.2 2000 .................. 1,341.1 1,095.4 830.2 99.8 15.5 1,212.9 2001 .................. 1,579.5 1,191.8 907.6 245.7 54.5 1,421.3 2002 .................. 1,721.8 1,284.6 988.0 365.0 82.5 1,584.2
2002 Oct ............ 1,455.6 1,275.5 979.1 342.8 81.1 1,370.0
2003 May ............. 1,562.9 1,343.0 1,034.5 416.3 87.5 1,488.0 Jun ............ 1,631.4 1,350.4 1,039.8 426.1 88.9 1,532.8 Jul ............ 1,572.0 1,359.1 1,046.8 434.2 88.8 1,484.1 Aug ............. 1,607.6 1,368.4 1,054.7 440.3 88.8 1,499.6 Sep ............ 1,642.3 1,374.3 1,058.9 452.3 90.3 1,533.2
Oct ............ 1,579.0 1,380.5 1,063.3 462.9 89.1 1,467.5
Change compared with previous year, per cent
1998 .................. 11.1 8.6 10.4 … … 8.1 1999 .................. 4.3 6.4 7.5 … … -0.6 2000 .................. 9.7 4.2 5.7 67.2 61.5 8.7 2001 .................. 17.8 8.8 9.3 146.2 251.6 17.2 2002 .................. 9.0 7.8 8.9 48.6 51.4 11.5
2002 Oct ............ 9.3 9.5 11.6 82.6 107.4 9.5
2003 May ............. 13.5 9.4 10.4 34.5 14.4 17.2 Jun ............ 16.3 9.7 10.4 34.3 13.7 18.5 Jul ............ 13.6 9.6 10.3 33.8 11.8 14.9 Aug ............. 11.4 7.8 8.2 34.1 11.6 11.3 Sep ............ 11.7 8.4 8.9 35.4 12.6 11.9 Oct ............ 8.5 8.2 8.6 35.0 9.9 7.1 1 The distribution of lending to households, interest adjusted lending and lending in foreign currency may coincide.
Therefore, some lending has been included in more than more than one of the above categories. 2 Lending to households includes lending to self-employed individuals.

15-12-2003 10:06 Antal sider: 15 Rev. nr. 2 H:\kvo\ENG\2003\4qtr\tiltryk\4-tab-till-
fuld.doc Oprettet af Palle Lorentzen
PRINCIPAL ITEMS OF THE BALANCE OF PAYMENTS (NET REVENUES) Table 7
Goods (fob) Services
Goods and services
Wages and property income
Current transfers
Total current account
Kr. billion
1998 .............................. 25.3 -2.0 23.3 -18.4 -15.2 -10.2 1999 .............................. 46.7 11.1 57.8 -17.4 -19.3 21.2 2000 .............................. 54.1 22.1 76.2 -32.8 -24.8 18.6 2001 .............................. 61.7 23.8 85.5 -24.8 -20.3 40.5 2002 .............................. 60.1 16.8 76.9 -27.2 -22.1 27.6
Oct 01 - Sep 02 ............... 58.5 17.2 75.7 -27.0 -22.2 26.5
Oct 02 - Sep 03 ............... 67.6 21.5 89.2 -28.5 -25.1 35.6
2002 Sep......................... 6.2 2.4 8.6 -1.5 -2.5 4.6
2003 Apr ........................ 5.4 1.3 6.7 -4.0 -2.4 0.4 May ....................... 6.3 1.5 7.8 0.0 -2.1 5.8 Jun......................... 7.7 1.4 9.1 -0.8 -2.3 6.0 Jul .......................... 3.4 3.0 6.4 -0.9 -2.9 2.6 Aug........................ 5.5 2.9 8.5 -1.7 -2.2 4.6 Sep......................... 6.6 2.6 9.1 -1.4 -2.4 5.3

15-12-2003 10:06 Antal sider: 15 Rev. nr. 2 H:\kvo\ENG\2003\4qtr\tiltryk\4-tab-till-
fuld.doc Oprettet af Palle Lorentzen
EXTERNAL FINANCIAL PAYMENTS (NET PAYMENTS FROM ABROAD) Table 8
Financial payments
of which:
Direct investments
Current payments
Capital transfers Total
Foreign in
DenmarkDanish abroad
Danish krone-
denomi-nated bonds
Errors and
omissions
Increase in the
foreign-exchange
reserve
Kr. billion
1999 .................. 21.2 0.9 61.4 116.9 -118.6 15.3 -19.3 64.2 2000 .................. 18.6 -0.1 -18.0 266.9 -202.7 -21.3 -43.4 -43.0 2001 .................. 40.5 -0.2 -44.5 92.5 -107.9 -17.7 31.9 27.5 2002 .................. 27.6 0.8 29.0 52.4 -44.6 8.5 -12.1 45.4
Nov 01 - Oct 02... 25.8 0.7 30.8 65.0 -45.4 12.0 -11.1 46.1
Nov 02 - Oct 03... … -0.3 -30.0 22.5 -25.7 -39.2 … 33.6
2002 Oct............. . 2.0 0.6 -16.9 -1.2 -1.1 5.7 9.4 -4.9
2003 May ............. 5.8 0.0 13.1 2.4 -2.5 -9.3 11.4 30.2 Jun ............ 6.0 0.0 -2.7 1.7 0.4 7.7 1.8 5.1 Jul ............ 2.6 0.0 -7.2 0.0 -2.6 -12.4 2.9 -1.6 Aug ............. 4.6 0.0 -11.2 0.9 1.6 -8.2 4.5 -2.1 Sep ............ 5.3 0.0 -3.9 1.3 0.5 17.3 -3.7 -2.2 Oct ............ … 0.1 -17.4 -0.7 -0.5 -35.5 … 0.7

15-12-2003 10:06 Antal sider: 15 Rev. nr. 2 H:\kvo\ENG\2003\4qtr\tiltryk\4-tab-till-
fuld.doc Oprettet af Palle Lorentzen
DENMARK'S INTERNATIONAL INVESTMENT POSITION Table 9
Direct investment
Portfolio investment
Other investment
Abroad In
Denmark Equity
securitiesDebt
securitiesTrade credits
Loans, currency
and deposits Other
The foreign
exchange
reserve Total End of period
Kr. billion
Assets
1998 .............. 235 16 208 122 44 441 57 103 1,227 1999 .............. 354 22 371 153 48 453 100 168 1,669 2000 ............... 556 29 453 229 51 472 143 121 2,054 2001 .............. 624 35 393 304 57 417 124 152 2,106 2002 .............. 572 30 243 343 57 451 249 197 2,142
2002 Q4 ........ 572 30 243 343 57 451 249 197 2,142 2003 Q1 ........ 579 30 215 404 57 549 222 202 2,259 Q2 ........ 585 30 236 422 57 570 267 240 2,407 Q3 ........ 585 30 263 405 57 519 268 234 2,361
Liabilities
1998 .............. 13 214 131 613 21 492 39 1 1,525 1999 .............. 22 327 153 625 24 598 79 2 1,831 2000 ............... 27 562 209 626 24 670 121 3 2,243 2001 .............. 33 601 192 747 30 626 106 4 2,340 2002 .............. 33 551 145 756 30 664 214 4 2,397
2002 Q4 ........ 33 551 145 756 30 664 214 4 2,397 2003 Q1 ........ 33 553 137 807 30 769 181 1 2,510 Q2 ........ 33 567 161 806 30 820 225 3 2,644 Q3 ........ 33 571 174 801 30 757 229 3 2,598
Net assets
1998 .............. 221 -198 77 -491 23 -50 18 101 -298 1999 .............. 332 -305 217 -472 25 -145 20 165 -162 2000 ............... 529 -533 244 -398 27 -198 22 117 -189 2001 .............. 591 -567 201 -443 27 -210 19 148 -234 2002 .............. 539 -521 98 -413 27 -213 36 193 -255
2002 Q4 ....... 539 -521 98 -413 27 -213 36 193 -255 2003 Q1 ........ 546 -523 78 -402 27 -220 41 202 -251 Q2 ........ 552 -536 75 -384 27 -250 42 238 -237
Q3 ........ 552 -541 89 -396 27 -238 40 231 -237
Note: As a key principle, the market value has been used for the compilation.

15-12-2003 10:06 Antal sider: 15 Rev. nr. 2 H:\kvo\ENG\2003\4qtr\tiltryk\4-tab-till-
fuld.doc Oprettet af Palle Lorentzen
GDP BY TYPE OF EXPENDITURE Table 10
Final domestic demand
GDP
Private consump-
tion
General-govern-
ment consump-
tion
Gross fixed
capital formation
Change in invent-ories Total
Exports of goods
and services
Imports of goods
and services
Kr. billion
1998 .................. 1,155.4 581.3 300.5 240.3 10.1 1,132.1 413.4 390.1 1999 .................. 1,207.7 599.5 312.1 240.9 -2.6 1,149.9 459.6 401.8 2000 .................. 1,280.8 608.7 323.8 266.4 5.4 1,204.2 567.3 490.7 2001 .................. 1,325.3 626.5 342.9 268.5 1.6 1,239.5 597.4 511.7 2002 .................. 1,365.2 653.9 358.7 268.9 2.8 1,284.2 613.3 532.3
2002 Q3 ............ 337.6 160.4 90.6 64.4 -0.2 315.3 154.3 132.0 Q4 ............ 354.8 170.4 92.2 70.7 -2.9 330.4 157.8 133.4
2003 Q1 ............ 337.1 165.1 89.8 63.2 0.9 319.0 150.9 132.8 Q2 ............ 348.6 167.2 93.3 64.4 0.1 324.9 151.6 127.9 Q3 ............ 342.1 165.3 93.4 65.5 -6.1 318.1 154.2 130.3
Real growth compared with previous year, per cent
1998 .................. 2.5 2.3 3.1 10.1 … 4.0 4.3 8.9 1999 .................. 2.6 0.7 2.0 1.5 … 0.1 12.3 5.5 2000 .................. 2.9 -1.9 1.1 8.6 … 1.9 13.0 11.3 2001 .................. 1.4 0.4 2.1 1.9 … 0.9 3.0 1.9 2002 .................. 2.1 1.9 2.1 0.3 … 1.2 5.8 4.2
2002 Q3 ............ 1.6 2.2 1.1 2.0 … 1.0 6.8 6.1 Q4 ............ 1.5 2.4 2.2 -0.9 … 0.7 4.7 3.3
2003 Q1 ............ 1.4 0.9 2.8 0.4 … 1.5 3.1 3.5 Q2 ............ -1.0 0.5 0.9 -7.2 … -1.6 -1.9 -3.4 Q3 ............ -0.8 1.6 0.3 1.8 … 0.7 -2.1 1.1
Real growth compared with previous quarter (seasonally adjusted),
per cent
2002 Q3 ............ -0.8 0.6 -0.5 -1.0 … -0.5 -0.5 0.2 Q4 ............ 0.0 0.4 0.8 0.2 … -0.5 -0.5 -1.6
2003 Q1 ............ 0.4 -0.3 0.4 -1.1 … 0.9 0.9 1.6 Q2 ............ -0.5 0.2 -0.1 -4.9 … -1.5 -0.3 -2.1 Q3 ............ -0.3 1.1 -0.4 7.3 … 1.6 -1.3 2.5

15-12-2003 10:06 Antal sider: 15 Rev. nr. 2 H:\kvo\ENG\2003\4qtr\tiltryk\4-tab-till-
fuld.doc Oprettet af Palle Lorentzen
DEVELOPMENT IN CONSUMER PRICES AND NET RETAIL PRICES Table 11
Domestic prices
Consumer-price
index
Index of
net retail prices Energy Imports Total
Food stuffs Rent
Public services IMI
Weights HICP CPI
1.000 0.080 0.157 0.764 0.128 0.232 0.034 0.370
Year-on-year growth, per cent
1998 .................. 1.3 1.8 1.5 -2.8 0.6 1.9 1.8 2.1 -0.9 2.3 1999 .................. 2.1 2.5 2.1 2.1 -0.3 2.5 0.6 2.7 3.5 2.9 2000 .................. 2.7 2.9 3.1 19.5 4.3 1.7 2.4 3.1 3.7 0.1 2001 .................. 2.3 2.4 2.4 -0.9 2.4 2.7 3.4 3.0 3.3 2.1 2002 .................. 2.4 2.4 2.5 0.9 0.5 3.0 2.0 2.9 4.5 3.2
2001 Q1 ............. 2.3 2.4 2.5 2.2 4.6 2.2 2.8 2.9 3.3 1.2 Q2 ............. 2.5 2.6 2.7 2.4 2.8 2.8 4.0 3.0 2.4 2.1 Q3 ............. 2.3 2.4 2.4 -1.3 1.9 2.9 3.7 3.0 3.5 2.2 Q4 ............. 2.0 2.1 2.0 -6.5 0.6 3.1 3.1 3.0 3.8 2.9
2002 Q1 ............. 2.5 2.5 2.7 -0.7 0.1 3.4 3.4 3.1 3.9 3.6 Q2 ............. 2.1 2.3 2.3 -0.3 0.5 2.8 1.6 3.1 4.5 2.9 Q3 ............. 2.4 2.3 2.5 -0.2 0.5 3.0 1.4 2.8 4.2 3.6 Q4 ............. 2.7 2.6 2.6 5.1 0.8 2.7 1.5 2.6 5.1 2.9
2003 Q1 ............. 2.8 2.8 2.8 10.6 1.3 2.4 1.6 2.7 8.1 1.8 Q2 ............. 2.2 2.3 2.4 -0.4 0.8 2.9 1.7 2.7 8.6 2.7 Q3 ............. 1.6 1.8 2.0 -1.0 0.0 2.5 1.8 2.7 8.3 1.9
Note: Weighting basis of December 2002. The index of net retail prices is the consumer price index adjusted for indirect taxes, duties and subsidies for
general price reductions. "IMI" is a measure of domestic market-determined inflation. "IMI" is normally larger than the increase in the
index of net retail prices due to an overweight of services, for which the price development is typically stronger than for other commodities.
HICP is the Harmonised Index of Consumer Prices.

15-12-2003 10:06 Antal sider: 15 Rev. nr. 2 H:\kvo\ENG\2003\4qtr\tiltryk\4-tab-till-
fuld.doc Oprettet af Palle Lorentzen
SELECTED MONTHLY ECONOMIC INDICATORS Table 12
Quantitative index for sales in sectors
of
Composite cyclical indicator for
Unem-ployment
Per cent of labour
force
New passen-ger car
registra-tions
Con-sumer confi-dence
indicator
Forced sales of
real property
Bank-ruptcies Industry
Building and
construc-tion
Extrac-tion of
raw materials
and manufac-
turing 2000=100
Retail trade
2000=100 Number Balance per cent
1998 .............. 6.6 94 98.2 2,426 1,652 162,708 2 -3 -2 1999 .............. 5.7 95 99.3 2,397 1,636 144,259 -2 -11 -8 2000............... 5.4 100 100.0 2,584 1,771 113,634 2 5 -1 2001 .............. 5.2 102 100.6 2,682 2,329 96,114 0 -3 -11 2002 .............. 5.2 103 103.9 3,041 2,469 111,598 1 -4 -14
Seasonally adjusted
2002 Nov....... 5.4 102 104.6 259 218 8,951 1 -4 -18
2003 Jun........ 6.2 101 106.9 236 164 7,698 0 -13 -20 Jul......... 6.0 103 107.0 247 216 8,294 0 -14 -18 Aug ...... 6.1 102 107.3 293 218 8,001 2 -9 -12 Sep ....... 6.3 102 104.0 283 198 8,459 -2 -7 -15 Oct........ 6.4 102 109.7 289 236 8,453 3 -5 -15 Nov....... … … … 257 217 8,895 3 8 -13

15-12-2003 10:06 Antal sider: 15 Rev. nr. 2 H:\kvo\ENG\2003\4qtr\tiltryk\4-tab-till-
fuld.doc Oprettet af Palle Lorentzen
SELECTED QUARTERLY ECONOMIC INDICATORS Table 13
Employment
Total Private
Hourly earnings
in manufactur-ing industry
1,000 persons Feb. 1996 =100
Real effective krone rate based on hourly earn-
ings
1980=100
Property prices (purchase sum,
one-family dwellings)
As a per-centage of property
value 1995
1998 ....................... 2,681 1,868 109.8 103.3 134.4 1999 ....................... 2,716 1,896 114.4 102.9 143.7 2000 ....................... 2,734 1,912 118.4 98.8 153.0 2001 ....................... 2,750 1,920 123.5 101.4 162.0 2002 ....................... 2,740 1,901 128.5 103.5 168.0
Seasonally adjusted
2002 Q3 ................. 2,734 1,895 128.9 104.1 169.3 Q4 ................. 2,729 1,892 130.7 104.8 169.3
2003 Q1 ................. 2,710 1,870 132.2 106.8 169.8 Q2 ................. 2,702 1,864 132.8 108.8 172.8 Q3 ................. 2,701 1,863 134.4 … …
Change compared with previous year, per cent
1998 ....................... 1.7 1.6 4.4 2.9 8.8 1999 ....................... 1.3 1.5 4.1 -0.4 6.9 2000 ....................... 0.7 0.9 3.5 -4.0 6.5 2001 ....................... 0.6 0.4 4.3 2.6 5.9 2002 ....................... -0.4 -1.0 4.0 2.1 3.7
2002 Q3 ................. -0.7 -1.5 3.8 2.3 3.4 Q4 ................. -0.9 -1.4 4.3 2.4 4.2
2003 Q1 ................. -1.4 -1.9 4.4 4.5 2.9 Q2 ................. -1.8 -2.5 4.0 5.9 2.7 Q3 ................. -1.2 -1.7 4.3 … …

15-12-2003 10:06 Antal sider: 15 Rev. nr. 2 H:\kvo\ENG\2003\4qtr\tiltryk\4-tab-till-
fuld.doc Oprettet af Palle Lorentzen
EXCHANGE RATES Table 14
EUR1 USD GBP SEK
Effective krone rate
Real effective
krone rate based on consumer
prices
Kroner per 100 units 1980=100
Average
1998 .............. 744.87 669.70 1,109.36 84.23 101.3 104.6 1999 .............. 743.56 698.34 1,129.49 84.46 99.6 104.3 2000 .............. 745.37 809.03 1,223.32 88.26 95.6 100.6 2001 .............. 745.21 831.88 1,197.73 80.58 96.9 101.8 2002 .............. 743.04 788.12 1,182.10 81.12 97.7 103.5
2002 Nov........ 742.80 741.82 1,165.94 81.79 98.4 104.6
2003 Jun......... 742.50 637.23 1,058.78 81.44 102.2 109.0 Jul.......... 743.32 653.70 1,061.33 80.92 101.8 108.0 Aug ....... 743.22 667.44 1,063.03 80.45 101.5 107.5 Sep ........ 742.73 662.17 1,065.77 81.91 101.2 107.6 Oct......... 743.01 635.51 1,065.15 82.46 101.5 107.5 Nov........ 743.70 635.69 1,073.59 82.69 101.4 …
1 In 1998 the euro rate has been calculated on the basis of the conversion rate between DEM and EUR fixed on 31December 1998.

15-12-2003 10:06 Antal sider: 15 Rev. nr. 2 H:\kvo\ENG\2003\4qtr\tiltryk\4-tab-till-
fuld.doc Oprettet af Palle Lorentzen
Danmarks Nationalbank's Statistical Publications
Periodical publications (electronic publications) Upon compilation of financial statistics, Danmarks Nationalbank releases these to the public in electronic publications. The publication of new statistics on a specific topic comprises 3 elements: ♦ E-mail with a brief summary, including selected key figures and links
to the below-mentioned publications on the Nationalbank's website. ♦ "Nyt" (News) with text and charts to illustrate key development
trends, as well as a 1-2 page tables section. The contents of the "Nyt" publications will also include in-depth commentary in order to give users greater scope to interpret and apply the statistics.
♦ Tabeltillæg (Tables Supplement) containing tables with detailed speci-fications and descriptions of the sources and methodologies applied in the compilation of the statistics.
The text of all tables and charts as well as the descriptions of the sources and methodologies is translated into English. Statistical database
A newly introduced database supplements the above statistical publi-cations, and in time the database will comprise all time series included in the financial statistics. When a topic is published the corresponding time series are updated, and they include data as far back in time as possible. Special Reports In Special Reports are published statistics of a thematic character that are not prepared on a regular basis. Release calendar A release calendar for the statistical publications, covering the current month and the following quarter, is shown on the website.