
MONETARY POLICYREPOR T - static.norges-bank.no · Contents This Monetary Policy Report is based on...
64
MONETARY POLICY REPORT WITH FINANCIAL STABILITY ASSESSMENT 2 | 19 JUNE
Transcript of MONETARY POLICYREPOR T - static.norges-bank.no · Contents This Monetary Policy Report is based on...

MONETARY POLICY REPORTWITH FINANCIAL STABILITY ASSESSMENT
2|19 JUNE

Monetary Policy Report with financial stability assessment is published four times a year, in March, June, September and December. The Report assesses the interest rate outlook and forms the basis for Norges Bank’s advice on the level of the countercyclical capital buffer. The Report includes projections of developments in the Norwegian and global economy.
Editor: Øystein Olsen
Key figures
INFLATION TARGET
2%Norges Bank’s objective is to ensure low
and stable inflation around the target of 2%, while contributing to high and stable output
and employment and to countering the build-up of financial imbalances
POLICY RATE
1.25%Norges Bank’s policy rate is raised
to 1.25% with effect from 21 June 2019.
POLICY RATE FORECAST
2001–2
0
2
4
6
8
10
2006 2011 2016 2021
COUNTERCYCLICAL CAPITAL BUFFER
2%The countercyclical capital buffer rate is 2%.
With effect from 31 December 2019, the rate will be raised to 2.5%

Contents
This Monetary Policy Report is based on information in the period to 14 June 2019 and was published on 20 June 2019, the day after the Executive Board’s monetary policy meeting.The Report is available at www.norges-bank.no.
EXECUTIVE BOARD’S ASSESSMENT 5
PART 1: MONETARY POLICY 7
1 OVERALL PICTURE 71.1 Global developments and outlook 81.2 The economic situation in Norway 81.3 Monetary policy and projections 9
2 THE GLOBAL ECONOMY 122.1 Growth, prices and interest rates 122.2 Countries and regions 14How does uncertainty affect economic developments? 18
3 FINANCIAL CONDITIONS 203.1 Lending rates and market rates 203.2 Krone exchange rate 21
4 THE NORWEGIAN ECONOMY 234.1 Output and demand 234.2 Labour market and output gap 274.3 Costs and prices 30Potential employment 37
5 MONETARY POLICY ANALYSIS 395.1 Objectives and recent developments 395.2 New information and assessments 40
PART 2: FINANCIAL STABILITY 46
6 FINANCIAL STABILITY ASSESSMENT – DECISION BASIS FOR THE COUNTERCYCLICAL CAPITAL BUFFER 466.1 Financial imbalances 466.2 Global financial stability 466.3 Credit market 476.4 Housing market 496.5 Commercial real estate market 526.6 Banks 53Banks’ risk from acquisition, development and construction exposures 56
ANNEX 59Monetary policy meetings in Norges Bank 60Tables and detailed projections 61

NORGES BANK MONETARY POLICY REPORT 2/2019
DECISION PROCESS FOR MONETARY POLICY REPORT 2/19At its meeting on 12 June 2019, the Executive Board discussed the economic outlook, the monetary policy stance and the need for a countercyclical capital buffer for banks. On the basis of this discussion and a recommendation from Norges Bank’s management, the Executive Board made its decision on the policy rate at its meeting on 19 June 2019. The Executive Board also approved Norges Bank’s advice to the Ministry of Finance on the level of the countercyclical capital buffer.
MONETARY POLICY IN NORWAYOBJECTIVEMonetary policy shall maintain monetary stability by keeping inflation low and stable. The operational target of monetary policy shall be annual consumer price inflation of close to 2% over time. Inflation targeting shall be forward-looking and flexible so that it can contribute to high and stable output and employment and to countering the build-up of financial imbalances.
IMPLEMENTATIONNorges Bank sets its policy rate with the aim of stabilising inflation around the target in the medium term. The horizon will depend on the disturbances to which the economy is exposed and the effects on the outlook for inflation and the real economy. In its conduct of monetary policy, Norges Bank takes into account indicators of underlying consumer price inflation.
DECISION PROCESSThe policy rate is set by Norges Bank’s Executive Board. Policy rate decisions are normally taken at the Executive Board’s monetary policy meetings. The Executive Board holds eight monetary policy meetings per year. The Monetary Policy Report is published four times a year in connection with four of the monetary policy meetings. At a meeting one to two weeks before the publication of the Report, the background for the monetary policy assessment is presented to and discussed by the Executive Board. On the basis of the analysis and discussion, the Executive Board assesses the consequences for future interest rate develop-ments. The final policy rate decision is made on the day prior to the publication of the Report. In the Report, the Board s assessment of the economic outlook and monetary policy is presented in “Executive Board’s assessment”.
REPORTINGNorges Bank places emphasis on transparency in its monetary policy communication. The Bank reports on the conduct of monetary policy in its Annual Report. The assessments on which interest rate setting is based are published regularly in the Monetary Policy Report and elsewhere.
COUNTERCYCLICAL CAPITAL BUFFERThe objective of the countercyclical capital buffer is to bolster banks’ resilience and to lessen the amplifying effects of bank lending during downturns.
The Ministry of Finance sets the level of the buffer four times a year. Norges Bank draws up a decision basis and provides advice to the Ministry regarding the level of the buffer. The advice is submitted to the Ministry of Finance in connection with the publication of Norges Bank’s Monetary Policy Report. The advice is published when the Ministry of Finance has made its decision.
Norges Bank will recommend that the buffer rate should be increased when financial imbalances are building up or have built up. The buffer rate may be reduced in the event of an economic downturn and large bank losses, with a view to mitigating the procyclical effects of tighter bank lending. The buffer rate shall ordinarily be between 0% and 2.5% of banks’ risk-weighted assets, but in special circumstances may be set higher.
4

Executive Board’s assessmentNorges Bank’s Executive Board has decided to raise the policy rate by 0.25 percentage point to 1.25%. The Executive Board’s current assessment of the outlook and balance of risks suggests that the policy rate will most likely be increased further in the course of 2019.
Growth among Norway’s trading partners slowed after having been on the rise for several years. So far in 2019, growth has been a little higher than expected, but the growth outlook has weakened somewhat since the March 2019 Monetary Policy Report. The UK’s relations with the EU are yet to be clarified, and trade tensions between the US and China have deepened. This has led to a broad-based fall in foreign interest rates. Both oil spot and futures prices have fallen and are somewhat lower than in March. Higher capacity utilisation has contributed to a pick-up in wage growth among trading partners over the past year. Price and wage inflation are expected to move up slightly ahead, broadly as projected in the March Report.
The upswing in the Norwegian economy has continued since autumn 2016. Employ-ment has risen, and unemployment has fallen. There are prospects that the upswing will continue into 2020, owing in part to higher activity in oil services. Further out, a decline in investment on the Norwegian shelf is likely to dampen growth.
Growth in the mainland economy was somewhat lower than expected in 2019 Q1, weighed down by lower production in the power sector and fisheries. The enterprises in Norges Bank’s Regional Network report solid growth and expect growth to remain firm ahead. Employment has risen more than expected. Unemployment has fallen a little, broadly as projected in the March Report.
Consumer price inflation picked up through 2018, in part reflecting a rise in electricity prices. So far in 2019, consumer price inflation has edged down. Underlying inflation also picked up in 2018, partly reflecting higher wage growth.
Since the March Report, inflation has been broadly as projected. The 12-month rise in the consumer price index (CPI) was 2.5% in May. Adjusted for tax changes and exclud-ing energy products (CPI-ATE), inflation was 2.3%. The spring wage settlement indicates a pick-up in wage growth in 2019 in line with the projection in the March Report. Tighter labour market conditions suggest a further rise in wage growth, but lower oil prices and continued weak profitability in some business sectors will likely dampen the rise. The krone is weaker than expected.
Persistently high debt growth has increased household vulnerability. Household debt growth has abated somewhat in recent years, but remains higher than growth in dis-posable income. House price inflation has been low recently.
In its discussion of the risk outlook, the Executive Board focused in particular on global developments. If trade tensions deepen further, growth among trading partners and oil prices may be lower than projected. This may weigh on domestic growth. At the same time, the krone may remain weak, if uncertainty persists. The Executive Board
5

NORGES BANK MONETARY POLICY REPORT 2/2019
also noted that the upswing in the oil industry and spillovers into the Norwegian economy may prove to be stronger than envisaged.
The operational target of monetary policy is annual consumer price inflation of close to 2% over time. Inflation targeting shall be forward-looking and flexible, so that it can contribute to high and stable output and employment and to countering the build-up of financial imbalances.
In its assessment, the Executive Board notes that the monetary stance remains accom-modative. Growth in the Norwegian economy is solid, and capacity utilisation is esti-mated to be somewhat above a normal level. Underlying inflation is a little higher than the inflation target. At the same time, trade tensions are a source of substantial global uncertainty. Uncertainty surrounding the effects of monetary policy suggests a cau-tious approach to interest rate setting. The overall outlook and balance of risks suggest that the policy rate be increased somewhat further.
The upturn in the Norwegian economy appears to be a little stronger the coming year than projected earlier. On the other hand, there are prospects for weaker external growth and lower foreign interest rates. The policy rate forecast indicates a slightly faster rate rise in the coming year than projected in the March Report, but the policy rate path is little changed further out. With a policy rate in line with the forecast, inflation is projected to remain close to the inflation target in the years ahead, at the same time as unemploy-ment remains low. The policy rate path will be adjusted in response to a change in economic prospects.
The Executive Board decided to raise the policy rate by 0.25 percentage point to 1.25%. The Executive Board’s current assessment of the outlook and balance of risks suggests that the policy rate will most likely be increased further in the course of 2019. The deci-sion was unanimous.
Øystein Olsen19 June 2019
2013 2014 2015 2016 2017 2018 2019 2020 2021 2022
–2
–1
0
1
2
3
4
5
–2
–1
0
1
2
3
4
530% 50% 70% 90%
Chart 1.1c Consumer price index (CPI) with fan chart1)
.
Four-quarter change. Percent. 2013 Q1 – 2022 Q4 2)
1) The fan chart is based on historical experience and stochastic simulations in Norges Bank’s mainmacroeconomic model, NEMO. 2) Projections for 2019 Q2 – 2022 Q4. Sources: Statistics Norway and Norges Bank
Projections MPR 2/19
Projections MPR 1/19
Inflation target
2013 2014 2015 2016 2017 2018 2019 2020 2021 2022
–2
–1
0
1
2
3
4
5
–2
–1
0
1
2
3
4
530% 50% 70% 90%
Chart 1.1a Policy rate with fan chart1)
.
Percent. 2013 Q1 – 2022 Q4 2)
1) The fan chart is based on historical experience and stochastic simulations in Norges Bank’s main macroeconomic model, NEMO. It does not take into account that a lower bound for the interest rate exists.2) Projections for 2019 Q2 – 2022 Q4. Source: Norges Bank
Projections MPR 2/19
Projections MPR 1/19
6

1 Overall picture
2013 2014 2015 2016 2017 2018 2019 2020 2021 2022
–2
–1
0
1
2
3
4
5
–2
–1
0
1
2
3
4
530% 50% 70% 90%
Chart 1.1c Consumer price index (CPI) with fan chart1)
.
Four-quarter change. Percent. 2013 Q1 – 2022 Q4 2)
1) The fan chart is based on historical experience and stochastic simulations in Norges Bank’s mainmacroeconomic model, NEMO. 2) Projections for 2019 Q2 – 2022 Q4. Sources: Statistics Norway and Norges Bank
Projections MPR 2/19
Projections MPR 1/19
Inflation target
2013 2014 2015 2016 2017 2018 2019 2020 2021 2022
–2
–1
0
1
2
3
4
5
–2
–1
0
1
2
3
4
530% 50% 70% 90%
Chart 1.1d CPI-ATE1)
with fan chart2)
.
Four-quarter change. Percent. 2013 Q1 – 2022 Q4 3)
1) CPI adjusted for tax changes and excluding energy products. 2) The fan chart is based on historicalexperience and stochastic simulations in Norges Bank’s main macroeconomic model, NEMO. 3) Projections for 2019 Q2 – 2022 Q4. Sources: Statistics Norway and Norges Bank
Projections MPR 2/19
Projections MPR 1/19
Inflation target
2013 2014 2015 2016 2017 2018 2019 2020 2021 2022
–2
–1
0
1
2
3
4
5
–2
–1
0
1
2
3
4
530% 50% 70% 90%
Chart 1.1a Policy rate with fan chart1)
.
Percent. 2013 Q1 – 2022 Q4 2)
1) The fan chart is based on historical experience and stochastic simulations in Norges Bank’s main macroeconomic model, NEMO. It does not take into account that a lower bound for the interest rate exists.2) Projections for 2019 Q2 – 2022 Q4. Source: Norges Bank
Projections MPR 2/19
Projections MPR 1/19
2013 2014 2015 2016 2017 2018 2019 2020 2021 2022
–5
–4
–3
–2
–1
0
1
2
3
4
5
–5
–4
–3
–2
–1
0
1
2
3
4
530% 50% 70% 90%
Chart 1.1b Estimated output gap1)
with fan chart2)
.Percent. 2013 Q1 – 2022 Q4
1) The output gap measures the percentage deviation between mainland GDP and estimated potentialmainland GDP. 2) The fan chart is based on historical experience and stochastic simulations in NorgesBank’s main macroeconomic model, NEMO. Source: Norges Bank
Projections MPR 2/19
Projections MPR 1/19
The upturn in the Norwegian economy continues. Employment is rising, and capacity utilisation appears to be somewhat above a normal level. Underlying inflation is a little higher than the inflation target.
The policy rate has been raised from 1% to 1.25%, and the forecast indicates a further rate increase in the course of 2019. At the end of 2022, the policy rate path is slightly below 1.75%. The policy rate forecast implies a slightly faster rate rise in the coming year than projected in the March 2019 Monetary Policy Report, but the forecast is little changed further out. The upward revision of the policy rate forecast reflects a stronger upswing in oil services and a weaker krone. Prospects for lower oil prices, weaker growth among trading partners and lower foreign interest rates pull in the opposite direction.
With a policy rate in line with the forecast, inflation is projected to remain close to the inflation target in the years ahead, at the same time as unemployment remains low. The projections are uncertain, and uncertainty increases through the projection period.
PART 1: MONETARY POLICY
7

NORGES BANK MONETARY POLICY REPORT 2/2019
1.1 GLOBAL DEVELOPMENTS AND OUTLOOKSlowdown in growthGDP growth among Norway’s trading partners slowed somewhat between 2017 and 2018 and appears to be softening further in 2019 (Chart 1.2). The slowdown likely reflects the uncertainty surrounding trade ten-sions and the UK’s exit from the EU. Further out in the projection period, growth is expected to hold steady, but to be lower than in recent years. At the same time, global offshore investment is expected to grow after falling over several years. This will likely lift Norwegian exports.
Capacity utilisation among Norway’s trading partners is close to a normal level, and unemployment is low. Wage growth has moved up over the past year. Underlying inflation has remained stable at somewhat below 1.5% since the beginning of 2017. Wage growth is expected to rise further, and inflation is also expected to pick up further out. The projections are little changed from Monetary Policy Report (MPR) 1/19, which was published on 21 March.
The UK’s relations with the EU are yet to be clarified, and trade tensions between the US and China have deepened. This has led to a broad-based fall in foreign interest rates. Market policy rate expectations are considerably lower than in March (Chart 1.3), and long-term interest rates are very low.
Oil prices have been volatile in recent months. Spot and futures prices up to 2022 are now somewhat lower than in the March Report (Chart 1.4).
1.2 THE ECONOMIC SITUATION IN NORWAYThe upturn continuesMainland economic growth has picked up over the past few years. Solid growth among trading partners and higher oil prices have helped lift activity, as have low interest rates.
In 2019 Q1, mainland GDP growth was dampened by temporary production declines in the power sector and fisheries. Growth is expected to pick up in the current and following quarters, in line with the expectations of enterprises in Norges Bank’s Regional Network and the projections from Norges Bank’s System for Averaging short-term Models (SAM) (Chart 1.5). The projections are a little higher than in the March Report.
2013 2014 2015 2016 2017 2018 2019 2020 2021 2022
0
20
40
60
80
100
120
140
0
20
40
60
80
100
120
140
Chart 1.4 Oil price.1)
USD/barrel. January 2013 – December 2022 2)
1) Brent Blend. 2) Futures prices on 15 March 2018 (MPR 1/19) and on 14 June 2019 (MPR 2/19). Sources: Thomson Reuters and Norges Bank
Spot price
Futures prices MPR 2/19
Futures prices MPR 1/19
2013 2014 2015 2016 2017 2018 2019 2020 2021 2022
0
1
2
3
4
0
1
2
3
4
Chart 1.2 GDP for Norway’s trading partners.1)
Annual change. Percent. 2013 – 2022 2)
1) Export weights. Twenty-five main trading partners. 2) Projections for 2019 – 2022. Sources: Thomson Reuters and Norges Bank
Projections MPR 2/19
Projections MPR 1/19
2013 2014 2015 2016 2017 2018 2019 2020 2021 2022
–1
0
1
2
3
–1
0
1
2
3
Chart 1.3 Policy rates and estimated forward rates1)
in selected countries.
Percent. 1 January 2013 – 31 December 2022 2)
1) Forward rates at 15 March 2018 for MPR 1/19 and 14 June 2019 for MPR 2/19. Forward rates areestimated based on Overnight Index Swap (OIS) rates. 2) Daily data through 14 June 2019. Quarterly datafrom 2019 Q3. 3) ECB deposit facility rate. Sources: Bloomberg, Thomson Reuters and Norges Bank
US
Euro area 3)
UK
Sweden
Forward rates MPR 2/19
Forward rates MPR 1/19
8

PART 1 MONETARY POLICY / SECTION 1
Employment continues to rise, and the increase has been stronger than projected in March. Employment is projected to continue to rise in the coming period, but at a slightly slower pace than in recent quarters (Chart 1.6). Capacity utilisation is expected to continue to rise, with unemployment edging down further over the coming half-year.
Household debt growth has abated in recent quarters, but debt is still rising faster than income. House price inflation has been low recently.
Above-target inflationConsumer price inflation picked up through 2018 and has remained high into 2019. In May, inflation slowed. The 12-month rise in the consumer price index (CPI) was 2.5% in May (Chart 1.7). Adjusted for tax changes and excluding energy products (CPI-ATE), inflation was 2.3%. Underlying inflation is expected to remain broadly unchanged in the coming months, moderat-ing gradually thereafter.
Wage growth has risen over the past few years and is also expected to rise in 2019. Annual wage growth of 3.3% is projected for 2019, close to the wage norm and in line with the March projection.
The krone exchange rate is little changed since March, and is weaker than projected in the March Report.
1.3 MONETARY POLICY AND PROJECTIONSPolicy rate rises somewhatThe operational target of monetary policy is annual consumer price inflation of close to 2% over time. Inflation targeting shall be forward-looking and flex-ible so that it can contribute to high and stable output and employment and to countering the build-up of financial imbalances.
Monetary policy remains expansionary. A policy rate that is too low over time may increase pressures in the economy, triggering an acceleration in wage and price inflation and a further build-up of financial imbal-ances. However, raising the policy rate too rapidly may stifle the upturn, resulting in higher unemploy-ment and below-target inflation. Trade tensions are a source of substantial global uncertainty. Uncertainty surrounding the effects of monetary policy suggests a cautious approach to interest rate setting. The
2013 2014 2015 2016 2017 2018 2019
–0.4
0
0.4
0.8
1.2
–0.4
0
0.4
0.8
1.2
Chart 1.5 GDP for mainland Norway1)
and the Regional Network’s indicator
of output growth 2)
. Quarterly change. Percent. 2013 Q1 – 2019 Q3 3)
1) Seasonally adjusted. 2) Reported output growth past three months and next six months converted to quarterlyfigures. For 2019 Q2, a weighting of historical and expected growth is used, while for Q3 2019 only expectedgrowth is used. 3) Projections for 2019 Q2 – 2019 Q3. 4) System for Averaging short-term Models. Sources: Statistics Norway and Norges Bank
GDP mainland Norway
Regional Network
GDP forecasts from SAM 4)
2013 2014 2015 2016 2017 2018 2019
–0.3
0
0.3
0.6
0.9
–0.3
0
0.3
0.6
0.9
Chart 1.6 Employment according to the quarterly national accounts1)
.
Quarterly change. Percent. 2013 Q1 – 2019 Q3 2)
1) Seasonally adjusted. 2) Projections for 2019 Q2 – 2019 Q3. Sources: Statistics Norway and Norges Bank
2013 2014 2015 2016 2017 2018 2019
0
1
2
3
4
5
0
1
2
3
4
5
Chart 1.7 CPI and CPI-ATE1)
.
Twelve−month change. Percent. January 2013 – September 2019 2)
1) CPI adjusted for tax changes and excluding energy products. 2) Projections for June 2019 –September 2019. Sources: Statistics Norway and Norges Bank
CPI
CPI-ATE
9

NORGES BANK MONETARY POLICY REPORT 2/2019
2013 2014 2015 2016 2017 2018 2019 2020 2021 2022
85
90
95
100
105
110
85
90
95
100
105
110
Chart 1.9 Import-weighted exchange rate index (I-44)1)
. 2013 Q1 – 2022 Q4 2)
1) A positive slope denotes a weaker krone exchange rate. 2) Projections for 2019 Q2 – 2022 Q4. Sources: Thomson Reuters and Norges Bank
Projections MPR 2/19
Projections MPR 1/19
2013 2014 2015 2016 2017 2018 2019 2020 2021 2022
0
1
2
3
4
5
6
0
1
2
3
4
5
6
Chart 1.8 Interest rates. Percent. 2013 Q1 – 2022 Q4 1)
1) Projections for 2019 Q2 – 2022 Q3 (mortgage lending rate and three-month money market rate) /2022 Q4 (key policy rate). 2) Average interest rate on outstanding housing loans to households, for thesample of banks and mortgage companies included in Statistics Norway’s monthly interest ratestatistics. 3) Projections are calculated as an average of the policy rate in the current and subsequentquarter plus an estimate of the money market premium. Sources: Statistics Norway, Thomson Reuters and Norges Bank
Mortgage lending rate 2) Projections MPR 2/19
Three-month money market rate3) Projections MPR 1/19
Policy rate
overall outlook and balance of risks suggest that the policy rate be increased somewhat further.
The policy rate has been raised from 1% to 1.25%, effective from 21 June 2019, and the forecast indicates a further rate increase in the course of 2019. At the end of 2022, the policy rate path is slightly below 1.75%. The policy rate path is a little higher in the coming year, but little changed further out compared with the March Report (Chart 1.1a). The upward revi-sion of the policy rate forecast reflects a stronger upswing in oil services and a weaker krone. Prospects for lower oil prices, weaker growth among trading partners and lower foreign interest rates pull in the opposite direction.
The policy rate increase in March does not appear to have passed through fully to banks’ mortgage rates. Looking ahead, bank lending rates are expected to rise in tandem with the policy rate, albeit with a lag. The policy rate forecast implies an increase in resi-dential mortgage rates from 2.6% in 2019 Q1 to 3.4% in 2022 (Chart 1.8).
The projections are uncertain, and uncertainty increases through the projection period. The forecast shows the policy rate path given economic develop-ments in line with current projections. If develop-ments take a different course, the rate path will be adjusted.
2013 2014 2015 2016 2017 2018 2019 2020 2021 2022
0
1
2
3
0
1
2
3
Chart 1.10 GDP for mainland Norway.1)
Annual change. Percent. 2013 – 2022 2)
1) Working-day adjusted. 2) Projections for 2019 – 2022. Sources: Statistics Norway and Norges Bank
Projections MPR 2/19
Projections MPR 1/19
2013 2014 2015 2016 2017 2018 2019 2020 2021 2022
–20
–10
0
10
20
–20
–10
0
10
20
Chart 1.11 Petroleum investment. 1)
Annual change. Percent. 2013 – 2022 2)
1) Working−day adjusted. 2) Projections for 2019 – 2022. Sources: Statistics Norway and Norges Bank
Projections MPR 2/19
Projections MPR 1/19
10

PART 1 MONETARY POLICY / SECTION 1
2013 2014 2015 2016 2017 2018 2019 2020 2021 2022
85
90
95
100
105
110
85
90
95
100
105
110
Chart 1.9 Import-weighted exchange rate index (I-44)1)
. 2013 Q1 – 2022 Q4 2)
1) A positive slope denotes a weaker krone exchange rate. 2) Projections for 2019 Q2 – 2022 Q4. Sources: Thomson Reuters and Norges Bank
Projections MPR 2/19
Projections MPR 1/19
2013 2014 2015 2016 2017 2018 2019 2020 2021 2022
–20
–10
0
10
20
–20
–10
0
10
20
Chart 1.11 Petroleum investment. 1)
Annual change. Percent. 2013 – 2022 2)
1) Working−day adjusted. 2) Projections for 2019 – 2022. Sources: Statistics Norway and Norges Bank
Projections MPR 2/19
Projections MPR 1/19
Higher capacity utilisation and inflation close to the targetWith a policy rate in line with the forecast, capacity utilisation is likely to continue to rise until the end of 2019, gradually declining thereafter (Chart 1.1b). Com-pared with the March Report, the projections for capacity utilisation have been revised up slightly for the coming period, but show little change thereafter. The krone is expected to appreciate somewhat ahead but remains a little weaker than projected in March throughout the projection period (Chart 1.9).
Inflation is projected to moderate to 2% (Chart 1.1c-d). A stronger krone is likely to restrain the rise in prices.
Mainland GDP growth is projected at 2.6% in 2019 (Chart 1.10). In the years ahead, higher interest rates and a gradual appreciation of the krone are expected to lead to slower growth. Investment on the Norwe-gian shelf is expected to rise sharply in 2019, followed by a further small rise in 2020, before falling back somewhat in the following years (Chart 1.11). Growth in public demand is also expected to slow ahead, and somewhat lower foreign import growth is expected to pull down export growth. The projection for GDP growth in the coming years has been revised up slightly compared with the March Report.
Tighter labour market conditions and higher wage growthIn the years ahead, continued growth in the Norwe-gian economy is projected to contribute to a further rise in employment. As mainland GDP growth softens, employment growth is also likely to slow. The employ-ment projections have been revised up slightly com-pared with the March Report. A slight decrease in unemployment is expected ahead (Chart 1.12). Wage growth is projected to rise further on the back of improved labour market conditions (Chart 1.13). Lower oil prices and continued weak profitability in some business sectors will likely dampen the rise.
2013 2014 2015 2016 2017 2018 2019 2020 2021 2022
0
1
2
3
4
5
6
0
1
2
3
4
5
6
Chart 1.12 Unemployment according to LFS 1)
and NAV 2)
.
Share of the labour force. Seasonally adjusted. Percent. 2013 Q1 – 2022 Q4 3)
1) Labour Force Survey. 2) Registered unemployment. 3) Projections for 2019 Q1 (LFS) / 2019 Q2(NAV) – 2022 Q4. Sources: Norwegian Labour and Welfare Administration (NAV), Statistics Norway and Norges Bank
LFS
NAV
Projections MPR 2/19
Projections MPR 1/19
2013 2014 2015 2016 2017 2018 2019 2020 2021 2022
–3
–2
–1
0
1
2
3
4
5
–3
–2
–1
0
1
2
3
4
5
Chart 1.13 Wages. Annual change. Percent. 2013 – 2022 1)
1) Projections for 2019 – 2022. 2) Nominal wage growth deflated by the CPI. Sources: Statistics Norway and Norges Bank
Nominal wages
Real wages 2)
Projections MPR 2/19
Projections MPR 1/19
11

NORGES BANK MONETARY POLICY REPORT 2/2019
2012 2013 2014 2015 2016 2017 2018 2019
46
48
50
52
54
56
58
46
48
50
52
54
56
58
Chart 2.1 PMI for Norway’s trading partners.1)
Seasonally adjusted. Index.2)
January 2012 – May 2019
1) Export weights. 25 main trading partners. 2) Survey of purchasing managers. Diffusion indexcentred around 50. Sources: Thomson Reuters and Norges Bank
Manufacturing PMI
Services PMI
2001 2004 2007 2010 2013 2016 2019
3
5
7
9
11
13
3
5
7
9
11
13
Chart 2.2 Unemployment1)
in selected countries.
Seasonally adjusted. Percent. January 2001 – May 2019 2)
1) Unemployed as a share of the labour force. 2) Latest observation is May 2019 for the US,April 2019 for the euro area and Sweden, and March 2019 for the UK. Source: Thomson Reuters
US
Euro area
UK
Sweden
2.1 GROWTH, PRICES AND INTEREST RATESSlightly weaker growth prospectsTighter financial conditions and uncertainty associated with trade tensions and the UK’s exit from the EU led to a gradual slowing of growth among Norway’s trading partners through 2018. Since the turn of the year, GDP growth has picked up in both the US and Europe. Growth has been slightly stronger than pro-jected, but activity indicators for the manufacturing sector are declining and are now at their lowest level since 2013 (Chart 2.1). It appears that the decline for the service sector may have come to a halt. Labour markets are tight in a number of countries, with high employment rates and low unemployment (Chart 2.2).
Trade tensions between the US and China have inten-sified since the March Report. Tariffs on a range of Chinese export goods have increased from 10% to 25%, and new restrictions have been imposed on trade with Chinese companies. The Chinese authorities have retaliated by raising tariffs on several products, includ-ing gas imports. In Europe, there is still uncertainty about the UK’s exit from the EU. Together with signals from a number of central banks of a continued expan-sionary monetary stance, these factors have pushed down both short-term and long-term interest rates. Long-term interest rates are now at very low levels, particularly in Europe (Chart 2.3). Expected money market rates among Norway’s main trading partners now indicate falling rates in the coming years (Chart 2.4). Global equity indexes are broadly at the same level as at the time of the March Report (Chart 2.5).
The projections are based on the assumption of unchanged tariff rates and other restrictions. Never-
2 The global economy
Capacity utilisation among Norway’s main trading partners is close to a normal level and unemployment is low. Growth slowed through 2018 on the back of tighter financial conditions and uncertainty, primarily owing to trade tensions. Underlying inflation is stable and somewhat below inflation targets.
So far in 2019, GDP growth among trading partners has been higher than projected, but growth prospects are slightly lower than in the March Report. The projections for wage growth and underlying inflation abroad are about the same as in March, while the rise in prices for consumer goods imported to Norway appears to be higher than projected earlier. Oil spot and futures prices are somewhat lower than in March. Expected money market rates and long-term rates among trading partners have declined.
12

PART 1 MONETARY POLICY / SECTION 2
2014 2015 2016 2017 2018 2019
–1
0
1
2
3
4
5
–1
0
1
2
3
4
5
Chart 2.3 Yields on 10-year government bonds in selected countries.
Percent. 2 January 2014 – 14 June 2019 1)
1) MPR 1/19 was based on information in the period up to 15 March 2019, indicated by the vertical line.Source: Bloomberg
US Germany UK
Sweden Norway
2012 2014 2016 2018 2020 2022
0
0.5
1
1.5
2
0
0.5
1
1.5
2
Chart 2.4 Three-month money market rates for Norway’s trading partners.1)
Percent. 2012 Q1 – 2022 Q4 2)
1) Based on money market rates and interest rate swaps. See Norges Bank (2015) "Calculation of theaggregate for trading partner interest rates". Norges Bank Papers 2/2015. 2) Forward rates at 15 March 2019 for MPR 1/19 and 14 June 2019 for MPR 2/19. Sources: Thomson Reuters and Norges Bank
Forward rates MPR 2/19
Forward rates MPR 1/19
theless, the uncertainty associated with trade ten-sions is expected to weigh on growth in the coming years, particularly as a result of reduced business investment willingness (Chart 2.6). It is also assumed that the UK’s relationship with the EU will be clarified in the course of 2019 and that the exit will be orderly. Expansionary monetary policy is underpinning growth in a number of countries, while fiscal policy is assumed to be neutral from 2020. GDP growth among trading partners is projected to remain at current levels and capacity utilisation is projected to remain close to a normal level in the coming years. The pro-jections for GDP growth are slightly lower than in March. In a number of emerging economies, the import content of goods production has been reduced in recent years. In addition, low investment growth in advanced economies is restraining import growth more than previously expected. The projec-tions for import growth among trading partners have therefore been revised down more than the projec-tions for GDP growth (Annex Table 1 and Chart 2.7). The outlook for global petroleum investment, par-ticularly for offshore investment, has brightened. After several years of decline, the International Energy Agency (IEA) expects increased investment in 2019.
Higher rise in prices for consumer goods imported to NorwayUnderlying inflation has remained stable at somewhat below 1.5% since the beginning of 2017 (Chart 2.8), and has been approximately as expected since March. Wage growth among trading partners was low for a long time despite a marked fall in unemployment. Since spring 2018, wage growth has picked up, but the passthrough to inflation appears to be taking somewhat longer than in previous years. Neverthe-less, overall inflation among trading partners has risen slightly more than projected, primarily reflecting higher energy price inflation following the rise in oil prices since the turn of the year. Wage growth and underlying price inflation are both projected to show a small increase over the next few years as a result of the rise in capacity utilisation (Annex Table 2). The projections for price and wage inflation are little changed from March. Oil spot prices are now USD 63 per barrel, somewhat lower than at the time of the March Report. Futures prices up to 2022 have also fallen (Chart 1.4). Oil prices are discussed in a box on page 17.
2014 2015 2016 2017 2018 2019
60
100
140
180
60
100
140
180
Chart 2.5 Equity price indexes in selected countries.1)
Index. 2 January 2014 = 100. 2 January 2014 – 14 June 2019 2)
1) Standard and Poor’s 500 Index (US). Euro Stoxx 50 Index (Europe). Financial Times Stock Exchange 100 Index (UK). MSCI Emerging Markets Index (emerging economies).Oslo Børs Benchmark Index (Norway). 2) MPR 1/19 was based on information in the period up to 15 March 2019, indicated by the vertical line. Source: Bloomberg
US
Europe
UK
Emerging economies
Norway
13

NORGES BANK MONETARY POLICY REPORT 2/2019
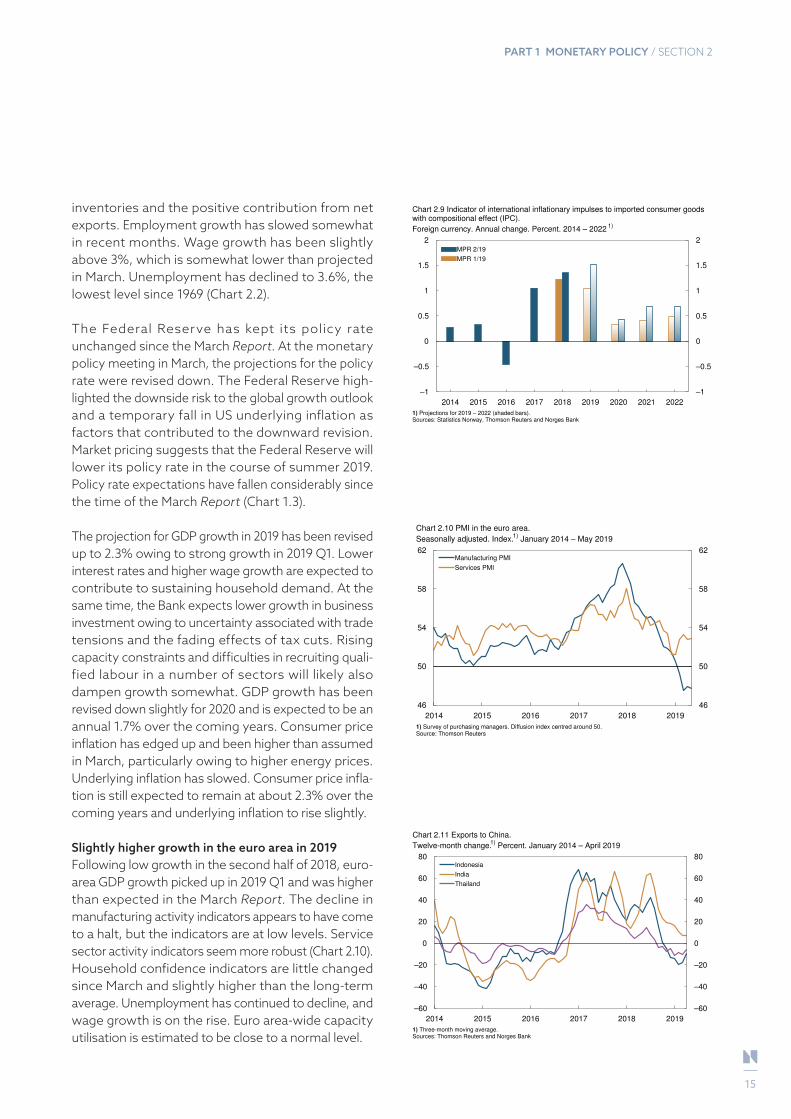
The rise in prices for consumer goods imported to Norway, measured in foreign currency terms, acceler-ated appreciably through 2018. Price inflation has remained elevated so far in 2019 and has been higher than projected in March for most goods components, particularly for clothing and footwear. In the past few years, the rise in prices for consumer goods imported to Norway has not been restrained to the same extent as in previous years by the shift in Norwegian imports towards low-cost countries such as China and other emerging economies. This applies in particular to clothing and footwear and audio-visual equipment. Weaker compositional effects are assumed also in the period ahead. The projections for consumer goods inflation have been revised up throughout the projection period (Chart 2.9).
Uncertainty remains substantialThere is considerable uncertainty surrounding global economic developments. The deterioration of relations between the US and China is likely the main reason why a number of uncertainty indicators, particularly in financial markets, have risen since March. Develop-ments in various uncertainty indicators and possible effects of uncertainty on economic developments are discussed in a box on page 18. If trade tensions inten-sify further, growth among Norway’s trading partners could be lower than expected. If the UK leaves the EU without a withdrawal agreement, or uncertainty about the relationship with the EU persists, growth may be lower than expected. On the other hand, economic growth may prove stronger than projected if, for example, the US and China sign a trade agreement or solutions are rapidly found to the political processes in Europe. A marked decline in global growth expecta-tions or a further upward revision of US oil production may pull down oil prices more than indicated by futures prices. On the other hand, US sanctions on Iran and Venezuela may pull up oil prices.
2.2 COUNTRIES AND REGIONSHigher growth in the USThe US economy expanded at a fast pace in 2018. Tax cuts and increases in public spending boosted private and public demand, but in recent quarters, growth in domestic demand has slowed down somewhat, partly because of tightening financial conditions and the government shutdown. Nevertheless, growth in 2019 Q1 was higher than assumed in March owing to high
2014 2015 2016 2017 2018 2019 2020 2021 2022
0
2
4
6
0
2
4
6
Chart 2.7 Imports for Norway’s trading partners.1)
Annual change. Percent. 2014 – 2022 2)
1) Export weights. 25 main trading partners. 2) Projections for 2019 – 2022 (shaded bars).Sources: Thomson Reuters and Norges Bank
MPR 2/19
MPR 1/19
2005 2007 2009 2011 2013 2015 2017 2019
–1
0
1
2
3
4
5
–1
0
1
2
3
4
5
Chart 2.8 Headline and core inflation in selected countries.1)
Twelve-month change. Percent. January 2005 – April 2019
1) Import weights. US, euro area, UK and Sweden. 2) US: excluding food and energy.UK and euro area: excluding food, tobacco, alcohol and energy. Sweden: excluding energy. Sources: Thomson Reuters and Norges Bank
Headline CPI
Core CPI 2)
2004 2007 2010 2013 2016 2019
–2.5
–2
–1.5
–1
–0.5
0
0.5
1
–20
–15
–10
–5
0
5
10
Chart 2.6 Planned investment1)
and investment in production equipment 2)
in selected countries3)
. 2004 Q1 – 2019 Q2
1) Survey data from respective countries. Normalised. Three-quarter moving average. 2) Growththree-quarters over previous three-quarters. Percent. 3) GDP weights. US, euro area and Japan. Sources: Thomson Reuters and Norges Bank
Planned investment (l.h.s.)
Investment in production equipment (r.h.s.)
14
PART 1 MONETARY POLICY / SECTION 2
inventories and the positive contribution from net exports. Employment growth has slowed somewhat in recent months. Wage growth has been slightly above 3%, which is somewhat lower than projected in March. Unemployment has declined to 3.6%, the lowest level since 1969 (Chart 2.2).
The Federal Reserve has kept its policy rate unchanged since the March Report. At the monetary policy meeting in March, the projections for the policy rate were revised down. The Federal Reserve high-lighted the downside risk to the global growth outlook and a temporary fall in US underlying inflation as factors that contributed to the downward revision. Market pricing suggests that the Federal Reserve will lower its policy rate in the course of summer 2019. Policy rate expectations have fallen considerably since the time of the March Report (Chart 1.3).
The projection for GDP growth in 2019 has been revised up to 2.3% owing to strong growth in 2019 Q1. Lower interest rates and higher wage growth are expected to contribute to sustaining household demand. At the same time, the Bank expects lower growth in business investment owing to uncertainty associated with trade tensions and the fading effects of tax cuts. Rising capacity constraints and difficulties in recruiting quali-fied labour in a number of sectors will likely also dampen growth somewhat. GDP growth has been revised down slightly for 2020 and is expected to be an annual 1.7% over the coming years. Consumer price inflation has edged up and been higher than assumed in March, particularly owing to higher energy prices. Underlying inflation has slowed. Consumer price infla-tion is still expected to remain at about 2.3% over the coming years and underlying inflation to rise slightly.
Slightly higher growth in the euro area in 2019Following low growth in the second half of 2018, euro-area GDP growth picked up in 2019 Q1 and was higher than expected in the March Report. The decline in manufacturing activity indicators appears to have come to a halt, but the indicators are at low levels. Service sector activity indicators seem more robust (Chart 2.10). Household confidence indicators are little changed since March and slightly higher than the long-term average. Unemployment has continued to decline, and wage growth is on the rise. Euro area-wide capacity utilisation is estimated to be close to a normal level.
2014 2015 2016 2017 2018 2019 2020 2021 2022
–1
–0.5
0
0.5
1
1.5
2
–1
–0.5
0
0.5
1
1.5
2
Chart 2.9 Indicator of international inflationary impulses to imported consumer goodswith compositional effect (IPC).
Foreign currency. Annual change. Percent. 2014 – 2022 1)
1) Projections for 2019 – 2022 (shaded bars). Sources: Statistics Norway, Thomson Reuters and Norges Bank
MPR 2/19
MPR 1/19
2014 2015 2016 2017 2018 2019
46
50
54
58
62
46
50
54
58
62
Chart 2.10 PMI in the euro area.
Seasonally adjusted. Index.1)
January 2014 – May 2019
1) Survey of purchasing managers. Diffusion index centred around 50.Source: Thomson Reuters
Manufacturing PMI
Services PMI
2014 2015 2016 2017 2018 2019
–60
–40
–20
0
20
40
60
80
–60
–40
–20
0
20
40
60
80
Chart 2.11 Exports to China.
Twelve-month change.1)
Percent. January 2014 – April 2019
1) Three-month moving average. Sources: Thomson Reuters and Norges Bank
Indonesia
India
Thailand
15

NORGES BANK MONETARY POLICY REPORT 2/2019
the projections for the next few years have been revised down. Inflation has been broadly in line with the March projection and is expected to remain at around 2% in the coming years.
Lower growth in SwedenFollowing high growth in 2018 Q4, growth slowed in 2019 Q1. Household confidence indicators have fallen, while business activity indicators are broadly at the same level as at the time of the March Report. Capac-ity utilisation in the Swedish economy remains higher than normal. Inflation, as measured by the consumer price index with a fixed interest rate (CPIF), is close to the inflation target of 2%. In April, the Riksbank revised down its projections for the policy rate and inflation. Forward rates indicate a rate hike in the course of autumn 2021.
The negative impulses from lower housing investment are expected to fade, with stronger wage growth fuel-ling higher consumption growth. GDP growth is pro-jected to remain slightly below 2% throughout the projection period. The projections are a little lower than in the March Report. Inflation is projected to remain close to target in the coming years.
Trade tensions drag down Asian growthAs expected, Chinese GDP growth slowed in 2019 Q1, dragged down by trade tensions with the US. On the other hand, Chinese policy measures have helped to underpin investment and private consumption. The strained US-China relations are contributing to height-ened uncertainty surrounding the outlook, and a number of manufacturing firms have announced intentions to shift production out of China. The Chinese government is expected to implement further stimulus measures ahead. Growth is projected to drift down to 6% in 2019 and then to 5.7% from 2021. The projections towards the end of the projec-tion period are a little lower than in the March Report.
The effects of trade tensions have spilled over into other emerging economies, especially those with extensive trade with China, such as Thailand. Weak export growth has also weighed on domestic demand in a number of countries (Chart 2.11). A fall in equity prices has contributed to tighter financial conditions in a number of emerging economies, despite a more expansionary monetary policy in a number of coun-tries. Turkey is still in the midst of a pronounced downturn. Overall, the growth projections for emerg-ing economies excluding China are slightly lower than in the March Report.
At the monetary policy meeting in June, the European Central Bank (ECB) revised its forward guidance on policy rates and is now signalling that it will keep rates unchanged until summer 2020. Policy rate expecta-tions have fallen since the March Report, and forward rates now indicate that the ECB will lower its policy rates in 2020 Q1.
GDP growth is projected to increase from 1.2% in 2019 to 1.5% in 2022. Lower oil futures prices and rising wage growth are expected to boost household pur-chasing power, while uncertainty surrounding trade tensions and the UK’s exit from the EU will also likely restrain business investment willingness ahead. The projections for 2019 are a little higher than in the March Report. Underlying inflation is expected to rise gradually in the coming years as a result of higher capacity utilisation and rising wage growth. The infla-tion projection for 2019 has been revised up to reflect a recent stronger-than-expected rise in prices. Overall annual price inflation is expected to remain below 2% to the end of the projection period.
Uncertainty in the UK persistsUK growth in 2018 was at its lowest level since the financial crisis. The weakness reflects persistent uncertainty about the UK’s future relationship with the EU, and business investment fell throughout 2018. In recent quarters, growth has rebounded somewhat, partly owing to high stockbuilding activity and adjust-ments ahead of the original EU exit deadline in March. In 2019 Q1, growth was higher than expected in the March Report. Labour market conditions have tight-ened further, and unemployment is at its lowest level since 1974. The Bank of England has not made any changes to the monetary policy stance since March and continues to signal that a gradual tightening of monetary policy is necessary to stabilise inflation around target. Forward rates indicate no change in the policy rate in the projection period.
The deadline for a withdrawal agreement with the EU has now been postponed until October 2019, with the likely result that uncertainty and weak investment willingness will persist for longer than assumed earlier. Further ahead, the UK’s exit from the EU is expected to be orderly, with business investment rebounding as future trade relations are clarified. A more expan-sionary fiscal policy and prospects for higher real wage growth are also likely to underpin growth. GDP growth of 1.3% is expected in 2019 and 2020, picking up slightly again thereafter. The projection for 2019 has been revised up since the March Report, while
16

PART 1 MONETARY POLICY / SECTION 2
January March May July September November
54
56
58
60
62
64
66
68
54
56
58
60
62
64
66
68
Chart 2.A Total OECD oil inventories.
In days of consumption.1)
January 2018 – April 2019
1) Days of consumption is calculated using the average expected demand over the next three months.2) Interval between the highest and lowest level for a given month in the period 2014 – 2018. Sources: International Energy Agency and Norges Bank
Interval 2014 – 2018 2) 2019
2018 Average 2014 – 2018
2010 2012 2014 2016 2018 2020 2022
0
20
40
60
80
100
120
140
0
2
4
6
8
10
12
14
Chart 2.B Oil and natural gas prices1)
.
Oil, USD/barrel. Natural gas, USD/MMBtu. January 2010 – December 2022 2)
1) Average of prices on natural gas in the Netherlands and the UK. 2) Futures prices on 15 March 2019for MPR 1/19 and on 14 June 2019 for MPR 2/19. Sources: Norwegian Petroleum, Thomson Reuters and Norges Bank
Oil (l.h.s.)
Natural gas (r.h.s.)
Futures prices MPR 2/19
Futures prices MPR 1/19
DEVELOPMENTS IN OIL AND NATURAL GAS PRICES
Oil spot prices are now USD 63 per barrel, somewhat lower than in March. Prices rose to close to USD 75 per barrel up to mid-May, primarily related to supply-side conditions in the oil market. OPEC+ has more than carried out the production cuts that were agreed on in December 2018.1 In addition, production declined even further in Iran and Venezuela, partly as a result of US sanctions against these countries. This led to a fall in OECD oil inventories up to end-April 2019 (Chart 2.A). Contamination problems also led to a reduction in oil exports from Russia. Political tensions in the Middle East – particularly rising tensions between the US and Iran – also contributed to the rise in prices.
However, since mid-May prices have fallen by a good USD 10. Escalating trade conflicts between the US and a number of other countries have again come to the fore. As the outlook for the global economy is deterio-rating, global oil consumption growth will likely slow. In addition, US oil production has continued to rise.
Oil prices are assumed to move in line with futures prices (Chart 1.4). Futures prices at end-2022 have fallen to USD 58, which is a somewhat lower than assumed in March.
Oil prices may turn out to be higher or lower than currently envisaged. Prices may fall more than suggested by futures prices if growth in the global economy is lower than expected, particularly if growth in emerging economies such as China and India slows more than anticipated. Global consumption growth may also decline over time as a result of energy efficiency measures and a shift towards new energy sources in order to meet long-term climate goals. A renewed upward revision of the projections for US oil production could also depress oil prices further.
On the other hand, oil prices could rise if US sanctions against Iran and Venezuela lead to a further decrease in oil exports from these countries. Tensions in the Middle East could also flare up again.
OPEC+ is set to meet at the end of June to decide whether to extend the production cuts until the end of 2019.
European natural gas prices have declined further since the March Monetary Policy Report (Chart 2.B), reflecting an ample supply of liquefied natural gas (LNG) to Europe and high gas exports from Russia. Gas inventories in Northwest Europe are now substantially larger than at the same time in 2018. Gas prices are assumed to move in line with futures prices. Futures prices for European gas and for LNG in Asia indicate higher prices ahead, as in March.
1 Twelve OPEC countries and 10 non-OPEC countries agreed to cut back production at the meetings in December 2018 (see press release).
17

NORGES BANK MONETARY POLICY REPORT 2/2019
HOW DOES UNCERTAINTY AFFECT ECONOMIC DEVELOPMENTS?
Over the past year, the IMF, OECD and several central banks have revised down their projections for global economic growth. All point to heightened uncertainty as one of the reasons for weaker growth. Many economic and political factors can contribute to this uncertainty. Examples from the past year include the process around the UK’s withdrawal from the EU and the ongoing trade conflicts between the US and a number of other countries.
Uncertainty can be associated with macroeconomic variables, such as growth and inflation, and with financial variables such as interest rates, share prices and exchange rates, but also with framework condi-tions, such as economic policy and various types of regulation. Uncertainty can affect economic develop-ments when economic agents take account of uncertainty in their decisions. Some uncertainty must be expected as agents’ knowledge about the current economic situation and developments ahead is, as a rule, limited. However, uncertainty that is greater than normal can have a negative impact on the economy.1
Empirical studies show that heightened uncertainty can lead to a decline in economic activity.2 Aastveit et al. (2017) also shows that monetary and fiscal policy are less effective when uncertainty is high.3 The impact of uncertainty also depends on the type of uncertainty. Larsen (2017) finds that different types of uncer-tainty can have different effects on the Norwegian economy: while heightened uncertainty about macro-economic conditions can reduce economic activity, increased uncertainty related to technological innova-tion and organisational changes can boost activity.4
There are several reasons why uncertainty can have a negative effect on economic activity. A rise in uncer-tainty can induce households to increase precautionary saving, thereby reducing current consumption. Purchases of durable consumer goods can also be postponed. Firms can postpone projects, thereby reducing investment, particularly if the projects are costly to reverse. Similarly, firms can delay hiring and strategic decisions, while workers can be more reluctant to change jobs. As a result, economic activity can decline in the short and the long run.
Banks and other financial institutions can amplify the effects of uncertainty partly by reducing lending and partly by increasing the price of loans, as expected losses rise and collateral valuation becomes more dif-ficult. In addition, heightened uncertainty often leads to a fall in share prices and thus an increase in firms’ equity funding costs.
Uncertainty is difficult to measure. Volatility measures derived from option prices for stocks, interest rates, exchange rates and oil prices are often used for financial market uncertainty. These measures express uncertainty about prices for the underlying assets typically three months ahead. For macroeconomic developments, the variance in different institutions’ projections for growth and inflation is often used.
Uncertainty about factors such as economic policy and various types of regulation are more difficult to measure.5 One approach that has attracted considerable attention in recent years is the use of indicators
1 See Black, J., N. Hashimzade and G. A. Myles (2013) Dictionary of Economics (4th Ed.). Oxford University Press2 See Bloom, N. (2014) “Fluctuations in uncertainty”. Journal of Economic Perspectives 28 2, 153-76.3 Aastveit, K. A., G. J. Natvik and S. Sola (2017) “Economic uncertainty and the influence of monetary policy”. Journal of International Money and Finance
76, pp. 50–67.4 See Larsen, V. H. (2017) “Components of uncertainty”. Working Papers 5/2017. Norges Bank.5 This kind of uncertainty has been defined as economic agents’ inability to predict the outcome not only of fiscal, monetary and trade policy measures,
but also regulatory measures related to the financial sector and competition.
18
PART 1 MONETARY POLICY / SECTION 2
based on the frequency of the word “uncertainty” and related forms of the word in selected newspapers or on websites.6 Uncertainty related to specific topics is identified by the frequency of the word “uncertainty” in the same context as other words such as “economy”, “regulation” or “trade”.7
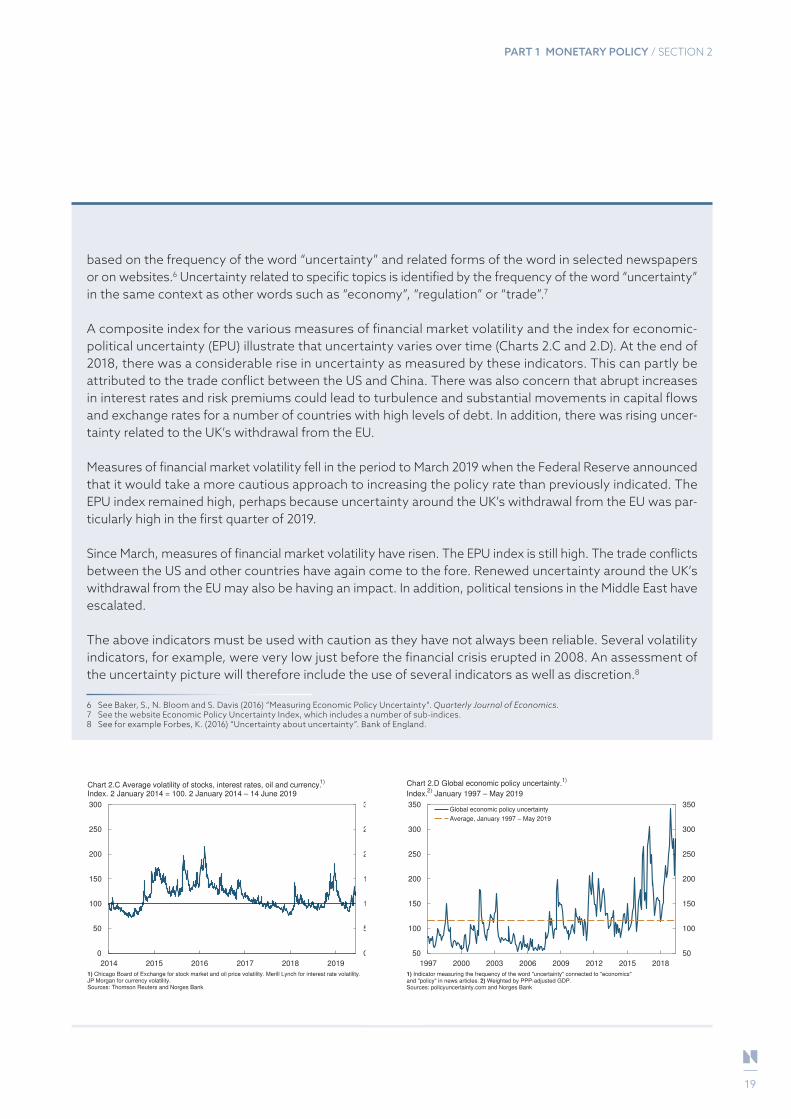
A composite index for the various measures of financial market volatility and the index for economic-political uncertainty (EPU) illustrate that uncertainty varies over time (Charts 2.C and 2.D). At the end of 2018, there was a considerable rise in uncertainty as measured by these indicators. This can partly be attributed to the trade conflict between the US and China. There was also concern that abrupt increases in interest rates and risk premiums could lead to turbulence and substantial movements in capital flows and exchange rates for a number of countries with high levels of debt. In addition, there was rising uncer-tainty related to the UK’s withdrawal from the EU.
Measures of financial market volatility fell in the period to March 2019 when the Federal Reserve announced that it would take a more cautious approach to increasing the policy rate than previously indicated. The EPU index remained high, perhaps because uncertainty around the UK’s withdrawal from the EU was par-ticularly high in the first quarter of 2019.
Since March, measures of financial market volatility have risen. The EPU index is still high. The trade conflicts between the US and other countries have again come to the fore. Renewed uncertainty around the UK’s withdrawal from the EU may also be having an impact. In addition, political tensions in the Middle East have escalated.
The above indicators must be used with caution as they have not always been reliable. Several volatility indicators, for example, were very low just before the financial crisis erupted in 2008. An assessment of the uncertainty picture will therefore include the use of several indicators as well as discretion.8
6 See Baker, S., N. Bloom and S. Davis (2016) “Measuring Economic Policy Uncertainty”. Quarterly Journal of Economics.7 See the website Economic Policy Uncertainty Index, which includes a number of sub-indices.8 See for example Forbes, K. (2016) “Uncertainty about uncertainty”. Bank of England.
2014 2015 2016 2017 2018 2019
0
50
100
150
200
250
300
0
50
100
150
200
250
300
Chart 2.C Average volatility of stocks, interest rates, oil and currency.1)
Index. 2 January 2014 = 100. 2 January 2014 – 14 June 2019
1) Chicago Board of Exchange for stock market and oil price volatility. Merill Lynch for interest rate volatility.JP Morgan for currency volatility. Sources: Thomson Reuters and Norges Bank
1997 2000 2003 2006 2009 2012 2015 2018
50
100
150
200
250
300
350
50
100
150
200
250
300
350
Chart 2.D Global economic policy uncertainty.1)
Index.2)
January 1997 – May 2019
1) Indicator measuring the frequency of the word "uncertainty" connected to "economics"and "policy" in news articles. 2) Weighted by PPP-adjusted GDP. Sources: policyuncertainty.com and Norges Bank
Global economic policy uncertainty
Average, January 1997 − May 2019
19

NORGES BANK MONETARY POLICY REPORT 2/2019
Residential mortgage rates have risen in response to the policy rate hike in March, but the rise appears to be smaller than the increase in the policy rate. Lending rates are expected to continue to move up in response to a further rise in the policy rate. The average mortgage rate is expected to reach 3.4% in 2022.
The krone exchange rate has shown little change since the March Report and is weaker than expected. A higher interest rate level in Norway relative to other countries will likely lead to an appreciation of the krone ahead. The krone is nevertheless projected to be a little weaker than in the March Report throughout the projection period.
3.1 LENDING RATES AND MARKET RATESGradual rise in bank lending ratesThe average residential mortgage rate was 2.6% at the end of Q1. The mortgage rate rose less than the money market rate in Q1 so that the lending margin fell slightly through the quarter. At the same time, the deposit rate rose somewhat less than the money market rate so that the total spread between mort-gage rates and the rates on deposits from households showed little change in Q1.
Changes in the mortgage rates offered by banks through April and May indicate that the mortgage rate will be a good 2.7% at the end of Q2, which is around 0.3 percentage point higher than in 2018 Q3. The policy rate hikes of 0.25 percentage point in Septem-ber and 0.25 percentage point in March have thus not passed through fully to the mortgage rate.
The projection for the mortgage rate in Q2 has been revised down a little (Chart 3.1). Bank lending rates are expected to fully reflect the increases in the policy rate ahead, albeit with a lag. In 2022, bank lending rates are estimated to reach 3.4%, which is a little lower than expected in March, and is consistent with the recent fall in banks’ lending margins and a slightly lower policy rate path than in the March Report.
Increase in bank funding costsLending rates facing households and enterprises depend over time on banks’ funding conditions, and are determined by both deposit rates and wholesale market funding rates. In the market, banks pay the money market rate Nibor plus a risk premium set at bond issue. Since the March Report, there have only been small changes in the risk premiums paid by banks. At the same time, the increase in Nibor has pushed up the price of market funding.
Three-month Nibor is determined by market expecta-tions of the average policy rate over the next three months plus a risk premium, generally referred to as the money market premium. The policy rate hike in March was expected by the market and had little impact on Nibor. Nibor has increased by about 0.20 percentage point since the March Report, reflecting an increase in market expectations of the policy rate.
3 Financial conditions
MONETARY POLICY SINCE MARCHAt the monetary policy meeting on 20 March, the policy rate was raised from 0.75% to 1%. The analyses in the March Report implied a further rate rise in the course of the next half-year, reach-ing 1.75% at the end of 2022. Under that policy rate path, inflation was projected to stay near the target while unemployment remained low.
At the monetary policy meeting on 8 May, new information was assessed against the projec-tions in the March Report. The uncertainty about global developments had persisted. Domestic capacity utilisation was broadly as projected, while price inflation had been a little higher than projected. The Executive Board’s assessment was that near-term interest rate prospects had shown little change since March. The Executive Board decided to leave the policy rate unchanged at 1%. The Executive Board’s assessment of the outlook and balance of risks suggested that the policy rate would most likely be increased in June.
20

PART 1 MONETARY POLICY / SECTION 3
In the same period, the money market premium, as estimated by the Bank, has declined slightly (Chart 3.2). So far this quarter, the premium has averaged around 0.35 percentage point and is expected to stay close to that level over the next quarter, while hover-ing around 0.4 percentage point in the following years.
While market interest rates among trading partners have fallen in recent months, the shortest forward money market rates in Norway have edged up since the March Report. The market is nevertheless pricing in fewer rate hikes than our forecast (Chart 3.3).
Increase in corporate funding costsThe interest rate on bank loans to enterprises is often directly linked to Nibor. The rate facing enterprises has therefore likely increased a little since March, following a small rise in 2019 Q1. Large enterprises can also procure financing directly in the bond market. Since the March Report, bond risk premiums have shown little change, while Nibor has increased. Overall, enter-prises are facing somewhat higher funding costs.
For households and enterprises that prefer fixed-rate loans, fixed rates in the swap market matter. Those rates reflect expected average money market rates. In line with developments in foreign funding markets, 5- and 10-year swap rates have fallen since the March Report (Chart 3.4).
3.2 KRONE EXCHANGE RATEWeaker-than-projected kroneDevelopments in the krone, as measured by the import-weighted exchange rate index I-441, were weaker than projected in the March Report. In the first part of the period, the krone appreciated at the same time as oil prices edged up and the interest rate dif-ferential against main trading partners widened. In the latter part of the period, the krone weakened, likely reflecting heightened financial market uncer-tainty and lower oil prices. Overall, the krone is little changed since the March Report.
A weaker-than-expected krone strengthens the cost competitiveness of Norwegian companies and implies an increase in net exports. A weaker krone will also
1 I-44 includes the currencies of 44 of Norway’s trading partners and is cal-culated as a geometric weighted average. The weight of each currency reflect the share of imports to Norway.
2013 2014 2015 2016 2017 2018 2019 2020 2021 2022
0
1
2
3
4
5
6
0
1
2
3
4
5
6
Chart 3.1 Interest rates. Percent. 2013 Q1 – 2022 Q3 1)
1) Projections for 2019 Q2 – 2022 Q3. 2) Average interest rate on outstanding mortgage loans tohouseholds from the sample of banks included in Statistics Norway’s monthly interest rate statistics. 3)
Difference between the mortgage lending rate and the three-month money market rate. 4) Projectionsare calculated as an average of the policy rate in the current and subsequent quarter plus an estimate ofthe money market premium. Source: Statistics Norway, Thomson Reuters and Norges Bank
Mortage rate 2)
Mortage margin 3)
Three-month money market rate 4)
Projections MPR 2/19
Projections MPR 1/19
2013 2014 2015 2016 2017 2018 2019 2020 2021 2022
0
0.25
0.5
0.75
1
0
0.25
0.5
0.75
1
Chart 3.2 Norwegian three-month money market premium.1)
Five-day moving
average. Percentage points. 1 January 2013 – 31 December 2022 2)
1) Norges Bank estimates of the difference between the three-month money market rate and the expected policyrate. 2) Projections for 2019 Q2 – 2022 Q4. Sources: Thomson Reuters and Norges Bank
Projections MPR 2/19
Projections MPR 1/19
2013 2014 2015 2016 2017 2018 2019 2020 2021 2022
0
1
2
3
4
5
0
1
2
3
4
5
Chart 3.3 Three-month money market rate 1)
and estimated forward rates 2)
.
Percent. 2013 Q1 – 2022 Q4 3)
1) Projections for the money market rate are calculated as an average of the policy rate in the currentand subsequent quarter plus an estimate of the money market premium. 2) Forward rates are based onmoney market rates and interest rate swaps. The orange and blue bands show the highest and lowestrates in the period 4 March – 15 March in 2019 (MPR 1/19) and in the period 3 June – 14 June in 2019(MPR 2/19). 3) Projections for 2019 Q2 – 2022 Q3 (money market rate) / 2022 Q4 (forward rates). Sources: Thomson Reuters and Norges Bank
Three-month money market rate, MPR 2/19
Three-month money market rate, MPR 1/19
Estimated forward rates, MPR 2/19
Estimated forward rates, MPR 1/19
21

NORGES BANK MONETARY POLICY REPORT 2/2019
push up inflation as a result of increases in prices for goods and services imports.
Historically, there has been a close relationship between the krone and movements in oil prices and the interest rate differential against other countries (Chart 3.5). Over a period, however, the krone has been weaker than implied by the historical relationship.
A change in the long-term level of the real exchange rate, generally referred to as the equilibrium rate, can change the relationship between the nominal krone exchange rate and movements in the interest rate dif-ferential and oil prices. The equilibrium exchange rate is the rate that is consistent with both external and inter-nal balance over time. The pronounced weakening of the krone after the oil price fall in 2014 while wage growth remained low can be interpreted as a weakening of the equilibrium rate. The projections in the March Report were therefore based on a weaker long-term real exchange rate level. We have not changed our assess-ment of the equilibrium exchange rate in this Report.
A weaker-than-expected krone can be interpreted as a higher risk premium on the Norwegian krone owing to increased financial market uncertainty. Such a risk premium is likely to fade over time, but how long it will take is uncertain.
The interest rate differential against trading partners is assumed to widen through the projection period (Chart 3.6). That implies an appreciation of the krone, as does a gradual phasing-out of the risk premium on the Norwegian krone. Lower oil prices imply in isola-tion a weaker krone. The krone is projected to appre-ciate somewhat ahead. Consistent with lower oil futures prices, the krone is projected to be slightly weaker throughout the projection period than envis-aged in March, despite the projection of a wider inter-est rate differential against other countries.
The krone exchange rate may differ from that pro-jected. A rising interest rate level relative to our trading partners may result in a stronger krone than projected in this Report. The krone may also appreci-ate more than projected if global uncertainty dimin-ishes. On the other hand, the krone depreciation may be more persistent than assumed, and hence the krone may remain weaker longer than anticipated.
2013 2014 2015 2016 2017 2018 2019 2020 2021 2022
–1
0
1
2
3
110
105
100
95
90
85
80
Chart 3.6 Three-month money market rate differential between Norway1)
and
trading partners2)
. Percentage points. Import-weighted exchange rate index
(I-44) 3)
. 2013 Q1 – 2022 Q4 4)
1) Projections for the money market rate are calculated as an average of the policy rate in the current andsubsequent quarter plus an estimate of the money market premium. 2) Forward rates for trading partners at15 March 2019 (MPR 1/19) and 14 June 2019 (MPR 2/19). See Norges Bank (2015) "Calculation of theaggregate for trading partner interest rates". Norges Bank Papers 2/2015. 3) A positive slope denotes astronger krone exchange rate. 4) Projections for 2019 Q2 – 2022 Q3 (money market rate) / 2022 Q4 (I-44). Sources: Thomson Reuters and Norges Bank
Three-month rate differential (l.h.s.)
I-44 (r.h.s.)
Projections MPR 2/19
Projections MPR 1/19
2013 2014 2015 2016 2017 2018 2019
0
0.5
1
1.5
2
2.5
3
3.5
4
0
0.5
1
1.5
2
2.5
3
3.5
4
Chart 3.4 Five- and 10-year swap rates. Percent. 2 January 2013 – 14 June 2019
Source: Bloomberg
Five-year
Ten-year
2013 2014 2015 2016 2017 2018 2019
115
110
105
100
95
90
85
80
115
110
105
100
95
90
85
80
Chart 3.5 Empirical model for import-weighted krone exchange rate (I-44).1)
2)
Week 1 2013 – week 24 2019
1) Oil price and one-year and 10-year interest swap rate differential against trading partners are incorporatedas explanatory variables. The model is estimated using data from week 1 of 2009 to week 38 of 2018. Thechart shows the fitted values up to week 38 of 2018 and the model-predicted values from week 39 of 2018 toweek 24 of 2019. 2) A rising value in the chart denotes a stronger krone. Sources: Bloomberg, Thomson Reuters and Norges Bank
I-44
Model values
22
2013 2014 2015 2016 2017 2018 2019
–1
0
1
2
–1
0
1
2
Chart 4.1 GDP for mainland Norway. Market value. Contribution to four-quartergrowth. Seasonally adjusted. Percentage points. 2013 Q1 – 2019 Q1
Sources: Statistics Norway and Norges Bank
Private services Manufacturing
Other goods production Electricity production
Agriculture Public sector
Product taxes and subsidies GDP mainland Norway
The upturn in the Norwegian economy continues. Employment is rising and unemployment is falling. Capacity utilisation appears to be somewhat above a normal level. Underlying inflation is a little higher than the inflation target.
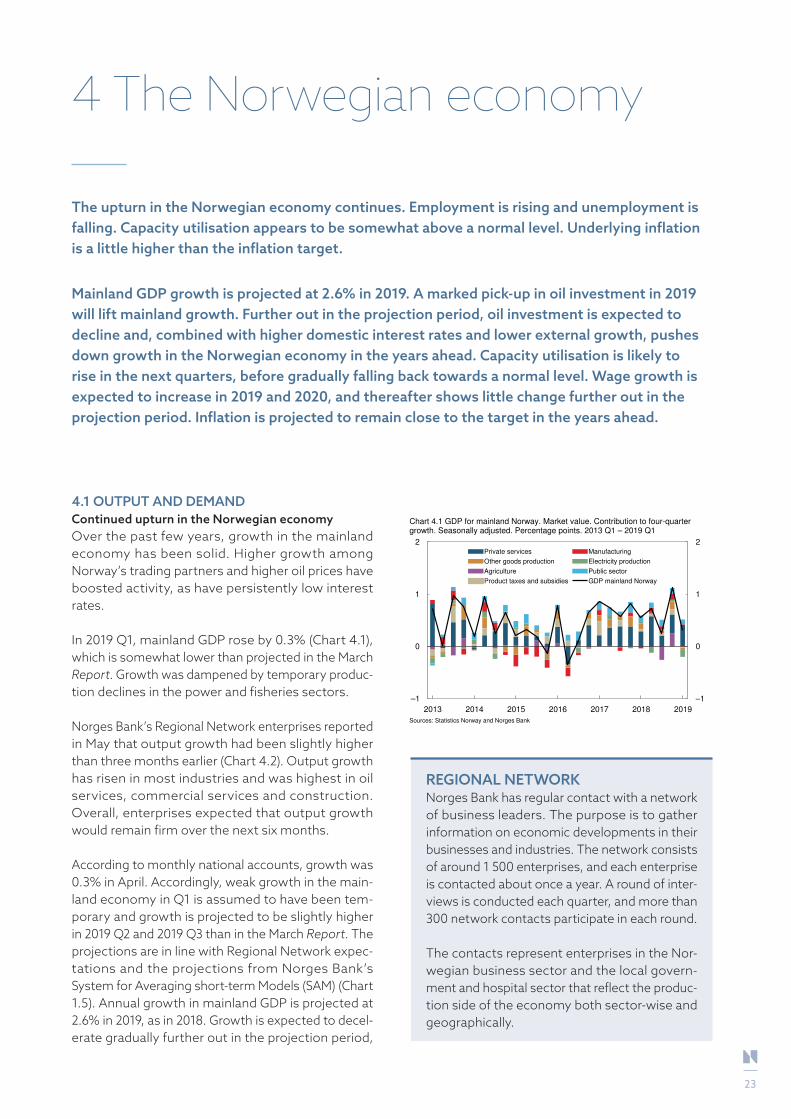
Mainland GDP growth is projected at 2.6% in 2019. A marked pick-up in oil investment in 2019 will lift mainland growth. Further out in the projection period, oil investment is expected to decline and, combined with higher domestic interest rates and lower external growth, pushes down growth in the Norwegian economy in the years ahead. Capacity utilisation is likely to rise in the next quarters, before gradually falling back towards a normal level. Wage growth is expected to increase in 2019 and 2020, and thereafter shows little change further out in the projection period. Inflation is projected to remain close to the target in the years ahead.
4.1 OUTPUT AND DEMANDContinued upturn in the Norwegian economyOver the past few years, growth in the mainland economy has been solid. Higher growth among Norway’s trading partners and higher oil prices have boosted activity, as have persistently low interest rates.
In 2019 Q1, mainland GDP rose by 0.3% (Chart 4.1), which is somewhat lower than projected in the March Report. Growth was dampened by temporary produc-tion declines in the power and fisheries sectors.
Norges Bank’s Regional Network enterprises reported in May that output growth had been slightly higher than three months earlier (Chart 4.2). Output growth has risen in most industries and was highest in oil services, commercial services and construction. Overall, enterprises expected that output growth would remain firm over the next six months.
According to monthly national accounts, growth was 0.3% in April. Accordingly, weak growth in the main-land economy in Q1 is assumed to have been tem-porary and growth is projected to be slightly higher in 2019 Q2 and 2019 Q3 than in the March Report. The projections are in line with Regional Network expec-tations and the projections from Norges Bank’s System for Averaging short-term Models (SAM) (Chart 1.5). Annual growth in mainland GDP is projected at 2.6% in 2019, as in 2018. Growth is expected to decel-erate gradually further out in the projection period,
4 The Norwegian economy
REGIONAL NETWORKNorges Bank has regular contact with a network of business leaders. The purpose is to gather information on economic developments in their businesses and industries. The network consists of around 1 500 enterprises, and each enterprise is contacted about once a year. A round of inter-views is conducted each quarter, and more than 300 network contacts participate in each round.
The contacts represent enterprises in the Nor-wegian business sector and the local govern-ment and hospital sector that reflect the produc-tion side of the economy both sector-wise and geographically.
23

NORGES BANK MONETARY POLICY REPORT 2/2019
but the projections are slightly higher than in the March Report (Chart 1.10).
The growth picture is influenced by developments in oil investment. After falling sharply between 2013 and 2017, oil investment has picked up and is expected to expand rapidly in 2019 (Chart 1.11). A further slight increase in investment is likely in 2020, followed by a decline in the years thereafter (see box on page 36).
In addition, higher interest rates are expected to weigh on consumption and investment throughout the projection period. In line with the projections in the Revised National Budget for 2019, growth in public demand is projected to be lower in 2019 than in pre-vious years (see box on page 35). For the years ahead, it is assumed that fiscal policy will be slightly expan-sionary. The fiscal policy assumptions imply that growth in public demand will slow further. Export growth is also expected to decline ahead owing to a somewhat stronger krone and slightly lower growth in Norwegian export markets (Chart 2.7).
Continued growth in private consumptionFor 2019, consumption is expected to grow at about the same rate as in 2018 (Chart 4.3). In 2019 Q1, increased car sales pulled up growth in goods con-sumption. Car sales are influenced by manufacturers’ delivery dates and are volatile. At the same time growth in services consumption continued. Con-sumption growth was slightly higher than projected in the March Report. Consumer confidence indicators are slightly below their historical averages and are little changed since March (Chart 4.4).
Consumption is expected to grow approximately in pace with real household disposable income. Higher wage growth and continued employment growth will push up income growth while inflation is expected to slow. On the other hand, higher interest rates will have a dampening impact on disposable income. As household debt is high, a given interest rate change will have a stronger impact on disposable income than previously. Income growth is expected to be somewhat higher in 2019 and 2020 than projected in March, but a little lower further out in the projection period (Chart 4.5).
2013 2014 2015 2016 2017 2018 2019 2020 2021 2022
0
1
2
3
4
0
1
2
3
4
Chart 4.3 Household consumption1)
. Annual change. Percent. 2013 – 2022 2)
1) Includes consumption for non-profit organisations. Working-day adjusted. 2) Projections for 2019 –2022. Sources: Statistics Norway and Norges Bank
Projections MPR 2/19
Projections MPR 1/19
2013 2014 2015 2016 2017 2018 2019
–30
–20
–10
0
10
20
30
40
50
–15
–10
–5
0
5
10
15
20
25
Chart 4.4 Consumer confidence. Net values. Kantar TNS trend indicator forhouseholds. 2013 Q1 – 2019 Q2. Opinion consumer confidence index (CCI). January 2013 – May 2019
Sources: ForbrukerMeteret™ from Opinion, Kantar TNS and Norges Bank
Kantar TNS trend indicator (l.h.s.)
Consumer confidence index (r.h.s.)
Average 2007 – 2019
Total Manufacturing Oil services
Construction Retail trade
Services
0
1
2
3
4
5
0
1
2
3
4
5
Chart 4.2 Output growth by sector as reported by the Regional Network.Annualised. Percent
Source: Norges Bank
February 2019 − Previous 3 months
May 2019 − Previous 3 months
May 2019 − Next 6 months
24

PART 1 MONETARY POLICY / SECTION 4
2013 2014 2015 2016 2017 2018 2019 2020 2021 2022
0
1
2
3
4
0
1
2
3
4
Chart 4.5 Household real disposable income 1)
.
Annual change. Percent. 2013 – 2022 2)
1) Excluding dividend income. Including income for non−profit organisations. 2) Projections for 2019 –2022. Sources: Statistics Norway and Norges Bank
Projections MPR 2/19
Projections MPR 1/19
Overall, growth in private consumption is projected at 2.0% in 2019, with somewhat higher growth further out in the projection period. The projections for the years ahead are somewhat lower than in the March Report.
Household savings, which declined slightly after the oil price fall, are expected to remain fairly stable in the years ahead (Chart 4.6).
Moderate house price inflation aheadFollowing a period of rapidly rising house prices, house price inflation has slowed markedly in the past couple of years (Chart 4.7). House price inflation has been broadly in line with that projected in March. In May, twelve-month house price inflation was 1.8%, which is lower than the rise in the consumer price index and lower than growth in household disposable income.
House price inflation is projected to be moderate ahead. Turnover in the market for existing homes remains at a high level. At the same time, the stock of unsold homes is high and a large number of new dwellings are nearing completion. Combined with higher residential mortgage rates, that will pull down on house price inflation ahead. Because of the high level of household debt, a rise in mortgage rates may dampen house prices more than previously. On the other hand, prospects for increased employment and higher wage growth pull up house prices. Compared with the March Report, the projections for house price inflation are little changed. A further discussion of the housing market is provided in Section 6.
Stable housing investmentThe fall in housing investment towards the end of 2017 and through 2018 has now come to a halt. New home sales have been relatively stable in the past year, indicating little change in housing investment in the coming quarters. The level of investment is expected to show little change between 2018 and 2019.
Further out in the projection period, higher real house prices pull up housing investment (Chart 4.8). The projections for housing investment are little changed since the March Report.
1980 1985 1990 1995 2000 2005 2010 2015 2020
–15
–10
–5
0
5
10
15
–15
–10
–5
0
5
10
15
Chart 4.6 Household saving and net lending.
Share of disposable income. Percent. 1980 – 2022 1)
1) Projections for 2019 – 2022. Sources: Statistics Norway and Norges Bank
Saving ratio
Saving ratio excl. dividend income
Net lending ratio excl. dividend income
2005 2008 2011 2014 2017 2020
–10
–5
0
5
10
15
20
160
170
180
190
200
210
220
230
240
250
Chart 4.7 House prices. Four-quarter change. Percent.
Household debt ratio 1)
. Percent. 2005 Q1 – 2022 Q4 2)
1) Loan debt as a percentage of disposable income. 2) Projections for 2019 Q2 – 2022 Q4. Sources: Eiendomsverdi, Finn.no, Real Estate Norway, Statistics Norway and Norges Bank
House prices (l.h.s.)
Household debt ratio (r.h.s.)
Projections MPR 2/19
Projections MPR 1/19
25

NORGES BANK MONETARY POLICY REPORT 2/2019
Higher growth in business investmentBusiness investment has grown rapidly since 2015, and investment as a share of mainland GDP has reached a high level compared with its historical average (Chart 4.9).
Brisk growth in investment in manufacturing and mining and quarrying is expected to result in higher annual growth in business investment in 2019 com-pared with 2018 (Chart 4.10). Statistics Norway’s investment intentions survey for 2019 Q2 indicates that investment growth in manufacturing and mining and quarrying will be slightly higher than assumed in the March Report and the decline in the power sector will be somewhat smaller. As a result, the projection for investment growth for 2019 is the same as in March, even though developments in 2019 Q1 were slightly weaker than projected.
In the years ahead, higher-than-normal capacity uti-lisation in the business sector is expected to continue to push up business investment. On the other hand, higher interest rates and slightly weaker import growth among trading partners may dampen invest-ment growth. Substantial business investment in recent years may also reduce investment demand ahead. Overall, business investment is expected to increase somewhat in the years ahead. The invest-ment projections are little changed from the March Report.
Solid export growth in 2019After having declined in 2016 and 2017, exports increased in 2018 (Chart 4.11). Export growth is expected to be appreciably higher in 2019 than in 2018 and higher than projected in March. Export growth is expected to moderate further ahead consistent with a projected stronger krone and lower growth in Norwegian export markets. Export growth is revised down slightly after 2019 compared with the March Report.
Import growth has also been low in recent years, par-ticularly reflecting the impact of declining petroleum investment. In 2019, increased petroleum investment is expected to lift import growth before oil investment falls back, dampening import growth again further out in the projection period. The projections for
1980 1985 1990 1995 2000 2005 2010 2015 2020
–20
–15
–10
–5
0
5
10
15
20
25
–20
–15
–10
–5
0
5
10
15
20
25
Chart 4.8 Housing investment1)
and real house prices2)
.
Annual change. Percent. 1980 – 2022 3)
1) Working-day adjusted. 2) Deflated by the CPI. 3) Projections for 2019 – 2022. Sources: Eiendomsverdi, Finn.no, Norwegian Association of Real Estate Agents (NEF), Real Estate Norway,Statistics Norway and Norges Bank
Housing investment
Real house prices
2013 2014 2015 2016 2017 2018 2019
–10
–5
0
5
10
15
20
–10
–5
0
5
10
15
20
Chart 4.10 Mainland business investment by sector.1)
Contribution to annual change. Percentage points. 2013 – 2019 2)
1) Working-day adjusted. 2) Projection for 2019. Sources: Statistics Norway and Norges Bank
Oil service industry
Manufacturing and mining
Other goods production
Other services
Power sector
Business investment
1980 1985 1990 1995 2000 2005 2010 2015 2020
6
7
8
9
10
11
12
13
6
7
8
9
10
11
12
13
Chart 4.9 Business investment1)
.
Share of GDP for mainland Norway. Percent. 1980 – 2022 2)
1) Working-day adjusted. 2) Projections for 2019 – 2022. Sources: Statistics Norway and Norges Bank
Share
Average 1980 – 2018
26
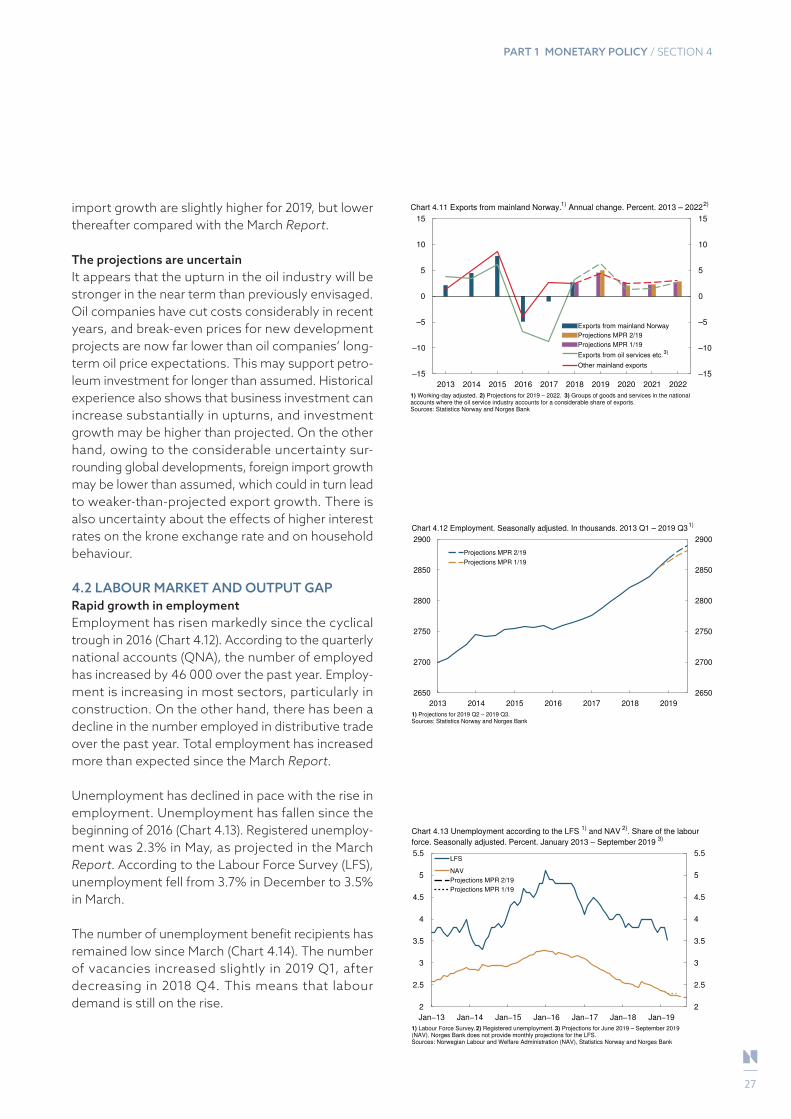
PART 1 MONETARY POLICY / SECTION 4
import growth are slightly higher for 2019, but lower thereafter compared with the March Report.
The projections are uncertainIt appears that the upturn in the oil industry will be stronger in the near term than previously envisaged. Oil companies have cut costs considerably in recent years, and break-even prices for new development projects are now far lower than oil companies’ long-term oil price expectations. This may support petro-leum investment for longer than assumed. Historical experience also shows that business investment can increase substantially in upturns, and investment growth may be higher than projected. On the other hand, owing to the considerable uncertainty sur-rounding global developments, foreign import growth may be lower than assumed, which could in turn lead to weaker-than-projected export growth. There is also uncertainty about the effects of higher interest rates on the krone exchange rate and on household behaviour.
4.2 LABOUR MARKET AND OUTPUT GAPRapid growth in employmentEmployment has risen markedly since the cyclical trough in 2016 (Chart 4.12). According to the quarterly national accounts (QNA), the number of employed has increased by 46 000 over the past year. Employ-ment is increasing in most sectors, particularly in construction. On the other hand, there has been a decline in the number employed in distributive trade over the past year. Total employment has increased more than expected since the March Report.
Unemployment has declined in pace with the rise in employment. Unemployment has fallen since the beginning of 2016 (Chart 4.13). Registered unemploy-ment was 2.3% in May, as projected in the March Report. According to the Labour Force Survey (LFS), unemployment fell from 3.7% in December to 3.5% in March.
The number of unemployment benefit recipients has remained low since March (Chart 4.14). The number of vacancies increased slightly in 2019 Q1, after decreasing in 2018 Q4. This means that labour demand is still on the rise.
2013 2014 2015 2016 2017 2018 2019 2020 2021 2022
–15
–10
–5
0
5
10
15
–15
–10
–5
0
5
10
15
Chart 4.11 Exports from mainland Norway.1)
Annual change. Percent. 2013 – 2022 2)
1) Working-day adjusted. 2) Projections for 2019 – 2022. 3) Groups of goods and services in the nationalaccounts where the oil service industry accounts for a considerable share of exports. Sources: Statistics Norway and Norges Bank
Exports from mainland Norway
Projections MPR 2/19
Projections MPR 1/19
Exports from oil services etc.3)
Other mainland exports
2013 2014 2015 2016 2017 2018 2019
2650
2700
2750
2800
2850
2900
2650
2700
2750
2800
2850
2900
Chart 4.12 Employment. Seasonally adjusted. In thousands. 2013 Q1 – 2019 Q3 1)
1) Projections for 2019 Q2 – 2019 Q3.Sources: Statistics Norway and Norges Bank
Projections MPR 2/19
Projections MPR 1/19
Jan−13 Jan−14 Jan−15 Jan−16 Jan−17 Jan−18 Jan−19
2
2.5
3
3.5
4
4.5
5
5.5
2
2.5
3
3.5
4
4.5
5
5.5
Chart 4.13 Unemployment according to the LFS 1)
and NAV 2)
. Share of the labour
force. Seasonally adjusted. Percent. January 2013 – September 2019 3)
1) Labour Force Survey. 2) Registered unemployment. 3) Projections for June 2019 – September 2019(NAV). Norges Bank does not provide monthly projections for the LFS. Sources: Norwegian Labour and Welfare Administration (NAV), Statistics Norway and Norges Bank
LFS
NAV
Projections MPR 2/19
Projections MPR 1/19
27

NORGES BANK MONETARY POLICY REPORT 2/2019
Further improvement in the labour marketRegional Network contacts expect that employment growth will remain high over the next three months (Chart 4.15), while Norges Bank’s expectations survey suggests that employment growth is slowing some-what.
Prospects for continued growth in the Norwegian economy imply a continued rise in employment in the years ahead. Employment growth is projected to remain broadly unchanged between 2018 and 2019 and to gradually slow in the years ahead in pace with slowing mainland GDP growth. The projections for employment growth for 2019 are slightly higher than in March and little changed further out in the projec-tion period. The number of employed is projected to increase by around 70 000 between the end of 2018 and the end of 2022.
Unemployment is expected to decline further, but less than implied by the rise in employment alone. This is because more people will likely enter the labour market in response to higher labour demand. Unemployment is projected to decline in 2019 and 2020, before rising slightly towards the end of the projection period (Chart 1.12). The projections for unemployment are lower than in March throughout the projection period.
In Norges Bank’s previous analyses, registered unem-ployment of around 2½% was assumed consistent with normal capacity utilisation in the economy. Actual unemployment has fallen below this level and more than would be implied by the Bank’s overall assessment of capacity utilisation. This may mean that the unemployment rate consistent with normal capacity utilisation is lower than previously assumed. In the analyses in this Report, the projections for unemployment have been revised down somewhat more than implied by the changes in capacity utilisa-tion in isolation.
Capacity utilisation above normalCapacity utilisation has been rising since 2016 (Chart 1.1b) and spare capacity in the Norwegian economy has gradually diminished. In the March Report, capac-ity utilisation was estimated at close to a normal level at the end of 2018 and to have risen further into 2019.
2003 2005 2007 2009 2011 2013 2015 2017 2019
0
1
2
3
4
5
0
1
2
3
4
5
Chart 4.14 Unemployment benefit recipients1)
and registered unemployment. Share of labour force. Seasonally adjusted. Percent. January 2003 – May 2019
1) Approximately half of the fully unemployed receive unemployment benefits. Some partly unemployedpersons and labour market programme participants are also eligible for unemployment benefits. Sources: Norwegian Labour and Welfare Administration (NAV) and Norges Bank
Recipients of unemployment benefits
Fully unemployed
2013 2014 2015 2016 2017 2018 2019
–0.2
0
0.2
0.4
0.6
0.8
45
50
55
60
65
70
Chart 4.15 Expected employment. Regional Network.1)
Quarterly change. Seasonally
adjusted. Percent. Norges Bank’s expectations survey. Diffusion index. 2)
2013 Q1 –2019 Q2
1) Expected change in employment next three months. 2) Share of business leaders expecting "moreemployees" in their own firm in the following 12 months + 1/2 * share expecting "unchanged number ofemployees". Sources: Epinion and Norges Bank
Regional Network (l.h.s.)
Expectations survey (r.h.s.)
2005 2007 2009 2011 2013 2015 2017 2019
0
20
40
60
80
0
20
40
60
80
Chart 4.16 Capacity utilisation1)
and labour supply constraints2)
as reported by theRegional Network. Percent. January 2005 – May 2019
1) Share of contacts that will have some or considerable problems accommodating an increase indemand. 2) Share of contacts reporting that output is being constrained by labour supply. Only enterprisesreporting full capacity utilisation are asked about labour supply, but the series shows the share of all theenterprises in the interview round. Source: Norges Bank
Capacity utilisation
Labour supply constraints
Average 2005 – 2019
28

PART 1 MONETARY POLICY / SECTION 4
A number of signs indicate that capacity utilisation has continued to increase since March (Table 4.1). Unemployment has continued to drift down and wage growth is on the rise. An increasing share of Regional Network enterprises report that they are unable to increase output without modifying equipment or making workforce adjustments (Chart 4.16). More enterprises than previously report recruitment diffi-culties. Model estimates based on various labour market indicators suggest that capacity utilisation increased between 2018 Q4 and 2019 Q1 and is now slightly above a normal level (Chart 4.17). Model esti-mates that also include indicators for other sectors of the economy suggest that capacity utilisation showed little change in 2019 Q1 and is close to a normal level.
The assessment in this Report is that capacity utilisa-tion is now above a normal level. Capacity utilisation is projected to increase further through 2019 and then decrease gradually (Chart 1.1b). The projections for the output gap in the coming year are slightly higher than in March and are little changed further out.
The employment rate appears to be close to the highest level that is consistent with price stability over time (see box on page 37).
Increase in non-resident workersThe output potential of the economy is projected to increase by an annual average of 1.6% in the years 2020–2022. The projection is based on trend produc-
MainlandNorway
Manufacturing Distributive trade
Other privateservices
Public
0
1
2
3
4
5
0
1
2
3
4
5
Chart 4.18 Productivity by sector. Average four−quarter change. Percent
Sources: Statistics Norway and Norges Bank
1997 Q4 – 2007 Q4
2009 Q1 – 2019 Q1
2005 2007 2009 2011 2013 2015 2017 2019
–2
–1
0
1
2
3
4
5
–2
–1
0
1
2
3
4
5
Chart 4.17 Output gap estimates1)
. Percent. 2005 Q1 – 2019 Q1
1) The output gap measures the percentage difference between mainland GDP and estimated potentialmainland GDP. 2) See box on page 34 in Monetary Policy Report 4/17. 3) An indicator of the output gapbased on the labour market. See Hagelund, K., F. Hansen and Ø. Robstad (2018) "Model estimates of theoutput gap". Staff Memo 4/2018. Norges Bank, for more detail. Source: Norges Bank
Norges Bank’s estimate
Model estimate 2)
Labour market indicator 3)
Table 4.1 Capacity utilisation indicators1
Indicator type Low Close to normal High
Employment and unemployment
Employment, aged 25–54, LFSUnemployment, LFS
Registered unemployment
Labour force, LFS QNA employment
Prices and wages Wage growth Domestic inflation2
Business surveysLabour supply, RN3
Capacity utilisation, RN3
Capacity utilisation, SSB4
Other Job vacancies, SSB
1 The indicators are placed in columns according to whether they signal low, close to normal or high capacity utilisation. The colour indicates the change since the March Report. Red indicates lower capacity utilisation. Green indicates higher capacity utilisation.
2 Domestically produced goods and services in the CPI-ATE.3 Regional Network.4 Statistics Norway’s business sentiment survey for manufacturing and mining and quarrying.
29

NORGES BANK MONETARY POLICY REPORT 2/2019
tivity growth of 1% and trend growth in employment of 0.6%.
Trend employment growth is estimated based on demographic projections. Lower immigration and an ageing population have pulled down trend growth in employment in recent years. Labour immigration has increased less than expected the past year, and the projections for immigration have been revised down for the years ahead. The updated projections still imply a slight increase in labour immigration going forward. While the number of immigrants to Norway has been lower than expected, there has been a sub-stantial increase in recent years in the number of non-resident workers in Norway. The number of non-resident workers is expected to continue to increase in the years ahead. Overall, the estimates for trend employment growth are slightly higher than in March.
Stable productivity growthThe estimate of trend productivity is based on devel-opments in actual productivity. Over the past decade, mainland productivity growth has been around 1%, and about 1 percentage point lower than in the previ-ous decade. Productivity growth in distributive trade has remained relatively high, while growth in other private services has been low (Chart 4.18). Productiv-ity growth in manufacturing has also been lower than in previous periods. The estimate of trend productiv-ity growth ahead is unchanged from March.
Uncertainty about potential output aheadActual productivity normally rises faster than trend in the early stages of a cyclical upturn. Compared with previous upturns, productivity growth has remained low in recent years, which may indicate that underly-ing productivity growth is lower than assumed. On the other hand, growth in business investment and increased digitalisation may lead to higher trend pro-ductivity than currently assumed. The potential increase in employment in the years ahead is also uncertain. In the past few years, employment has increased more than expected. The estimate of trend employment growth ahead has been revised up, but the rate of growth is uncertain.
2013 2014 2015 2016 2017 2018 2019
0
1
2
3
4
5
–25
–15
–5
5
15
25
Chart 4.19 CPI, CPI-ATE1)
and energy prices in the CPI2)
.Twelve-month change. Percent. January 2013 – May 2019
1) CPI adjusted for tax changes and excluding energy products. 2) Measured by the groups transport fuelsand lubricants and electricity and other fuels. Sources: Statistics Norway and Norges Bank
CPI (l.h.s.)
CPI-ATE (l.h.s.)
Energy prices in the CPI (r.h.s.)
OUTPUT GAPThe output gap, also referred to as capacity uti-lisation, captures resource utilisation in the economy. The output gap is defined as the dif-ference between actual output (GDP) and poten-tial output. Potential output is the highest pos-sible level of output that is consistent with stable price and wage inflation. Over time, potential output growth is determined by trend employ-ment growth and productivity.
The output gap is a key monetary policy varia-ble. In interest rate setting, weight is given to smoothing fluctuations in output and employ-ment. To achieve this, the aim is to keep the output gap close to zero. This is referred to as normal capacity utilisation.
If we attempt to keep output and employment above that level, wage and price inflation could become too high. The output gap is therefore also an important indicator of future inflation and is related to Norges Bank’s objective of low and stable inflation.
Potential output and the output gap cannot be observed and must be estimated. Norges Bank’s current output gap estimates are the result of an overall assessment of a number of indicators and models. In this assessment, particular weight is given to labour market developments.
30

PART 1 MONETARY POLICY / SECTION 4
2016 2017 2018 2019
–1
0
1
2
3
4
5
–1
0
1
2
3
4
5
Chart 4.20 CPI-ATE1)
by supplier sector.
Twelve-month change. Percent. January 2016 – September 2019 2)
1) CPI adjusted for tax changes and excluding energy products. 2) Projections for June 2019 – September2019. 3) Norges Bank’s estimates. Sources: Statistics Norway and Norges Bank
Domestically produced goods and services3)
Imported consumer goods
Projections MPR 2/19
Projections MPR 1/19
4.3 COSTS AND PRICESInflation above targetInflation picked up markedly through 2018 (Chart 4.19), reflecting both higher wage growth and increased electricity prices. The rise in consumer price inflation adjusted for tax changes and excluding energy prod-ucts (CPI-ATE) continued into 2019, while lower elec-tricity prices dampened CPI inflation. Until March 2019, other underlying inflation indicators rose appreciably, but have since declined (see box on page 34).
Twelve-month CPI-ATE inflation fell to 2.3% in May, down 0.3 percentage point from April. Inflation remains slightly above the inflation target. Twelve-month CPI inflation was 2.5% in May. Overall, long-term inflation expectations were unchanged from 2019 Q1 to Q2 and are still somewhat above target (see box on page 34).
Inflation broadly as expectedThe rise in prices for domestically produced goods and services has picked up since summer 2018 (Chart 4.20), partly reflecting higher wage growth, but the rise in prices has been higher than the rise in unit labour costs (see Chart 4.21). This may be because the depreciation of the krone, following the oil price decline in 2014, has pushed up import prices and hence other costs facing enterprises.
Overall, the rise in prices for domestically produced goods and services has been broadly in line with expectations since March. The rise in prices for imported goods has been somewhat lower than pro-jected in the March Report. Twelve-month CPI and CPI-ATE inflation have been approximately as pro-jected.
Wage growth is on the riseWage growth has risen in the past few years and is likely to continue to rise in 2019 (Chart 4.22). Annual wage growth is projected at 3.3% in 2019, as in the March Report. The projection is close to the expecta-tions in both Norges Bank’s expectations survey and among the enterprises in Norges Bank’s Regional Network and is also consistent with the wage norm in this year’s wage settlement.
With capacity utilisation somewhat above a normal level and an improving labour market, wage growth
2005 2007 2009 2011 2013 2015 2017 2019
0
1
2
3
4
5
6
7
0
1
2
3
4
5
6
7
Chart 4.22 Wages, wage norm and wage expectations.Annual change. Percent. 2005 – 2020
1) Actual annual wage growth from Statistics Norway. Norges Bank’s projections for 2019 and 2020. 2) Social partners’ wage growth expectations for the current year as measured by Norges Bank’sexpectations survey in Q2 each year and expected annual wage growth for 2020 measured in 2019 Q2.3) Expected wage growth for the current year as reported by the Regional Network in Q2 each year. 4) Before 2014: for manufacturing as projected by the National Mediator or NHO. From 2014: for theoverall industry, based on an assement by NHO, done in cooperation with LO. Sources: Epinion, Kantar TNS, LO, NHO, Opinion, Statistics Norway and Norges Bank
Annual wage growth1)
Expectations survey 2)
Regional Network3)
Wage norm4)
1993 1996 1999 2002 2005 2008 2011 2014 2017
0
1
2
3
4
5
6
0
1
2
3
4
5
6
Chart 4.21 Domestically produced goods and services in the CPI-ATE 1)
and
ULCs2)
.3)
Four-quarter change. Percent. 1993 Q1 – 2019 Q3
1) CPI adjusted for tax changes and excluding energy products. 2) Unit labour costs lagged forwardthree quarters. ULC measured as the difference between annual wage growth and trend productivitygrowth for mainland Norway. Trend estimated using a two−sided, extended HP filter wherelambda=20000. 3) Norges Bank’s estimates. 1996 Q1 – 2019 Q1. Projections for 2019 Q2 – 2019 Q3. Sources: Statistics Norway and Norges Bank
Domestically produced goods and services in the CPI-ATE
ULCs
31

NORGES BANK MONETARY POLICY REPORT 2/2019
is expected to increase further in 2020 and then remain fairly stable through the remainder of the pro-jection period. Combined with prospects for lower inflation, this implies an increase in real wage growth in 2020. Norges Bank’s expectations survey also shows higher wage expectations for 2020, but a little lower than the Bank’s projections. Historically, the expectations survey has tended to underestimate wage growth in upturns.
The labour cost share in mainland Norway has reached a high level compared with its historical average (Chart 4.23). The rise in oil prices from their low levels in 2016 has so far not improved profitability in mainland Norway as calculated in the national accounts. The high labour cost share is expected to weigh on wage growth ahead.
The wage projections imply somewhat higher wage growth than among trading partners throughout the projection period (Chart 4.24).
Inflation will move close to the targetUnderlying inflation is expected to remain broadly unchanged in the coming months and then decline gradually. Annual CPI-ATE inflation is projected at 2.4% in 2019, which is 0.1 percentage point higher than projected in March. The CPI-ATE projections are closely in line with the SAM-based projections for the coming two quarters (Chart 4.25).
Further out in the projection period, a somewhat stronger krone and weaker external price impulses are expected to push down import price inflation. At the same time, capacity utilisation above a normal level and rising wage growth will in isolation support the rise in prices for domestically produced goods and services. Overall, CPI-ATE inflation is projected to decline to 2% (Chart 4.26).
The projections for the next few years are slightly higher than in the March Report. The projections for the rise in prices for domestically produced goods and services are little changed from March, while the rise in prices for imported goods appears to be some-what higher, reflecting expectations of a slightly weaker krone than projected in March and a slightly stronger rise in imported consumer goods prices (Chart 2.9).
2005 2007 2009 2011 2013 2015 2017 2019 2021
0
1
2
3
4
5
6
7
0
1
2
3
4
5
6
7
Chart 4.24 Wage growth in Norway and for main trading partners1)
.
Annual change. Percent. 2005 – 2022 2)
1) The aggregate for wage growth for trading partners is based on labour costs per employee in the euro area,Sweden, the UK and the US. 2) Projections for 2019 – 2022. Sources: Statistics Norway, Thomson Reuters and Norges Bank
Norway
Trading partners
2016Q1 2016Q3 2017Q1 2017Q3 2018Q1 2018Q3 2019Q1 2019Q3
0
1
2
3
4
5
0
1
2
3
4
530% 50% 70% 90%
Chart 4.25 CPI-ATE1)
with fan chart from SAM 2)
.
Four-quarter change. Percent. 2016 Q1 – 2019 Q3 3)
1) CPI adjusted for tax changes and excluding energy products. 2) System for Averaging short-term Models.3) Projections for 2019 Q2 – 2019 Q3. Sources: Statistics Norway and Norges Bank
Forecasts from SAM
Projections MPR 2/19
1980 1985 1990 1995 2000 2005 2010 2015 2020
68
70
72
74
76
78
68
70
72
74
76
78
Chart 4.23 Labour cost share for mainland Norway.1)
Percent. 1980 – 2022 2)
1) Labour costs as a proportion of factor income. 2) Projections for 2019 – 2022.Sources: Statistics Norway and Norges Bank
Projections MPR 2/19
Projections MPR 1/19
Average 1980 – 2018
32

PART 1 MONETARY POLICY / SECTION 4
2013 2014 2015 2016 2017 2018 2019 2020 2021 2022
0
1
2
3
4
0
1
2
3
4
Chart 4.26 CPI and CPI-ATE1)
. Annual change. Percent. 2013 – 2022 2)
1) CPI adjusted for tax changes and excluding energy products. 2) Projections for 2019 – 2022.Sources: Statistics Norway and Norges Bank
CPI
CPI-ATE
Inflation target
Projections MPR 2/19
Projections MPR 1/19
Energy price inflation has slowed over the past half-year, and futures prices for electricity and fuel indicate a further decline through 2019. At the same time, futures prices for the next years are somewhat higher than in March (Chart 4.27). CPI inflation is projected at 2.2% in 2019, little changed from March. Given the energy price projections, CPI inflation declines at a slightly faster pace than CPI-ATE inflation. The projec-tions for CPI inflation in the coming years are a little higher than in March.
Overall, the projections for CPI inflation and wage growth are consistent with a rise in real wage growth between 2019 and 2020, with growth remaining stable further out in the projection period (Chart 1.13). Real wage growth is projected to be slightly lower than in March. The downward revision of real wage growth ahead reflects that the labour cost share for mainland Norway will be slightly higher in 2019 and 2020 than expected in March, partly owing to lower oil price expectations.
The projections are uncertainInflation is projected to continue to edge lower ahead. At the same time, a tighter labour market and higher activity in oil services could result in stronger-than-projected wage growth. It is also assumed that prof-itability in the business sector will improve somewhat. Failing that, or if improvement takes longer than envisaged, wage growth may turn out to be lower than currently projected.
2013 2014 2015 2016 2017 2018 2019 2020 2021 2022
80
100
120
140
160
80
100
120
140
160
Chart 4.27 Energy prices in the CPI.1)
Index. 2013 = 100. 2013 – 2022 2)
1) Weighted average of prices for transport fuels and lubricants and for electricity and other fuels in the CPI. Theprojections are based on futures prices for electricity, petrol and fuel. 2) Projections for 2019 − 2022. Sources: Nord Pool, Norwegian Water Resources and Energy Directorate, Statistics Norway, Thomson Reuters and Norges Bank
Projections MPR 2/19
Projections MPR 1/19
33

NORGES BANK MONETARY POLICY REPORT 2/2019
2013 2015 2017 2019 2021
0
2
4
6
8
10
12
0
2
4
6
8
10
12
Chart 4.C Structural non-oil deficit and 3% of the GPFG1)
.
Share of trend GDP for mainland Norway. Percent. 2013 – 2022 2)
1) Government Pension Fund Global. 2) Projections for 2019 – 2022.Sources: Ministry of Finance and Norges Bank
3% of the GPFG
Structural non-oil deficit MPR 2/19
Structural non-oil deficit MPR 1/19
INDICATORS OF UNDERLYING INFLATIONInflation targeting should be forward-looking and flexible. Norges Bank sets the policy rate with a view to stabilising annual consumer price inflation (CPI) in the medium term. Temporary conditions can lead to substantial short-term fluctuations in CPI inflation. Indicators of underlying inflation can be useful in order to see through such fluctuations.1
The most important indicator of underlying infla-tion in Norges Bank’s analyses is the CPI adjusted for tax changes and excluding energy products (CPI-ATE), but supplementing this index with other indicators may be useful. The 12-month rise in the other indicators the Bank looks at ranged between 1.7% and 2.5% in May (Chart 4.A). The 12-month average rise in these indicators was 2.2%, up from 1.7% in May 2018. The underlying inflation indica-tors showed a clear increase in the period to March 2019, but have since edged down slightly.
1 See Husabø, E. (2017) “Indicators of underlying inflation in Norway”. Staff Memo 13/2017, Norges Bank, for a more detailed review of various indicators.
2005 2007 2009 2011 2013 2015 2017 2019
–1
0
1
2
3
4
5
6
–1
0
1
2
3
4
5
6
Chart 4.A CPI and indicators of underlying inflation.Twelve-month change. Percent. January 2005 – May 2019
1) The CPI adjusted for tax changes and excluding energy products. 2) Median of the CPIM, CPIXE, 20%trimmed mean, weighted median, CPI-XV and CPI common. 3) The band shows the highest and lowestvalues for the CPIM, CPIXE, 20% trimmed mean, weighted median, CPI-XV and CPI common. Sources: Statistics Norway and Norges Bank
CPI Indicators3)
CPI-ATE1) Inflation target
Median2)
INFLATION EXPECTATIONSExpectations of future inflation have a bearing on many economic decisions, such as price setting and wage formation. Inflation expectations are often referred to as anchored when medium-term and long-term inflation expectations show little response to new information and remain at a stable level close to the inflation target. Anchored inflation expectations can make it easier for monetary policy to achieve the objective of price stability and contribute to smoothing fluctuations in output and employment.
In recent years, longer-term inflation expectations, as measured in Norges Bank’s expectations survey, have overall remained close to 2.5% (Chart 4.B).1 The inflation target for monetary policy was lowered from 2.5% to 2% in March 2018. In the monetary policy reports published after the revi-sion of the inflation target, it is assumed that it will take some time for inflation expectations to adjust to the new target. The expectations survey for 2019 Q22 showed that long-term inflation expectations were unchanged from Q1 and are still above the target. Financial industry economists report the lowest expectations at 2.2%.
1 See Erlandsen, S. K. and P.B. Ulvedal (2017) “Are inflation expectations anchored in Norway?”. Staff Memo 12/2017. Norges Bank, for a more detailed review.
2 The expectations survey was conducted in the period 29 April-19 May 2019.
2005 2007 2009 2011 2013 2015 2017 2019
0
1
2
3
4
0
1
2
3
4
Chart 4.B Expected twelve-month change in consumer prices five years ahead.Percent. 2005 Q1 – 2019 Q2
Sources: Epinion, Kantar TNS and Opinion
Employee organisations
Employer organisations
Economists, academia
Economists, financial industry
Inflation target
34

PART 1 MONETARY POLICY / SECTION 4
2013 2015 2017 2019 2021
0
2
4
6
8
10
12
0
2
4
6
8
10
12
Chart 4.C Structural non-oil deficit and 3% of the GPFG1)
.
Share of trend GDP for mainland Norway. Percent. 2013 – 2022 2)
1) Government Pension Fund Global. 2) Projections for 2019 – 2022.Sources: Ministry of Finance and Norges Bank
3% of the GPFG
Structural non-oil deficit MPR 2/19
Structural non-oil deficit MPR 1/19
2013 2014 2015 2016 2017 2018 2019 2020 2021 2022
0
1
2
3
4
5
0
1
2
3
4
5
Chart 4.D Public sector demand 1)
. Annual change. Percent. 2013 – 2022 2)
1) Working-day adjusted. 2) Projections for 2019 – 2022.Sources: Statistics Norway and Norges Bank
Projections MPR 2/19
Projections MPR 1/19
ASSUMPTIONS CONCERNING FISCAL POLICY
The fiscal policy assumptions in this Report are based on the Revised National Budget for 2019 and other available information. Petroleum revenue spending, as measured by the structural non-oil deficit, is esti-mated at 7.7% of trend mainland GDP in 2019 (Chart 4.C), which is 0.3 percentage point higher than assumed in the March Report. The upward adjustment may be attributable to lower indirect tax revenues related to the increase in electric car sales, partial postponement of the sale of emission quotas and higher public spending in the revised budget.
The change in the deficit as a share of trend GDP is used as a simple measure of the effect of the budget on demand for goods and services. In the Revised National Budget, this fiscal impulse is assumed to be 0.5 percentage point for 2019, which is somewhat above the average for the period since the introduction of the fiscal rule for petroleum revenue spending in 2001. An expected fall in government dividend income from mainland enterprises from a particularly high level in 2018 will contribute to the considerable fiscal impulse in 2019. The projected deficit in 2019 is 0.1 percentage point above the level in 2017.
Real underlying growth in government expenditure also provides an indication of the fiscal stance, with growth estimated at 2.0% in 2019 in the Revised National Budget, ie slightly below the average for the period since 2001.
As in the March Report, the technical assumption is applied that the structural deficit will increase by 0.1 percentage point annually as a share of trend GDP as from 2020.
Petroleum revenue spending in 2019 is projected to be equivalent to 2.9% of the value of the Government Pension Fund Global (GPFG) at the beginning of the year, but it may be somewhat lower through the remainder of the projection period as the value of the GPFG has increased substantially since the beginning of the year.
Since 2013, public demand has increased by 2%-3% annually (Chart 4.D). In line with the projections in the Revised National Budget for 2019, growth in public demand is assumed to be lower in 2019, but the growth projection is somewhat higher than in the March Report. Growth in public sector demand is expected to slow further in the period ahead. The projections for the coming years are little changed since March.
2005 2007 2009 2011 2013 2015 2017 2019
–1
0
1
2
3
4
5
6
–1
0
1
2
3
4
5
6
Chart 4.A CPI and indicators of underlying inflation.Twelve-month change. Percent. January 2005 – May 2019
1) The CPI adjusted for tax changes and excluding energy products. 2) Median of the CPIM, CPIXE, 20%trimmed mean, weighted median, CPI-XV and CPI common. 3) The band shows the highest and lowestvalues for the CPIM, CPIXE, 20% trimmed mean, weighted median, CPI-XV and CPI common. Sources: Statistics Norway and Norges Bank
CPI Indicators3)
CPI-ATE1) Inflation target
Median2)
2005 2007 2009 2011 2013 2015 2017 2019
0
1
2
3
4
0
1
2
3
4
Chart 4.B Expected twelve-month change in consumer prices five years ahead.Percent. 2005 Q1 – 2019 Q2
Sources: Epinion, Kantar TNS and Opinion
Employee organisations
Employer organisations
Economists, academia
Economists, financial industry
Inflation target
35

NORGES BANK MONETARY POLICY REPORT 2/2019
2013 2014 2015 2016 2017 2018 2019 2020 2021 2022
0
50
100
150
200
250
300
350
0
50
100
150
200
250
300
350
Chart 4.E Petroleum investment.
Constant 2019 prices. In billions of NOK. 2013 – 2022 1)
1) Projections for 2019 – 2022. Figures for 2013 – 2018 are from Statistics Norway’s investment intentionssurvey and are deflated by the price index for petroleum investment in the national accounts. The index is projected to rise by 2% per year in 2019 and 2020. Sources: Statistics Norway and Norges Bank
Fields in production excluding new development projects
Field developments and new development projects on fields in production
Exploration
Shutdown and removal
Pipeline transport and onshore activities
2013 2014 2015 2016 2017 2018 2019 2020 2021 2022
0
50
100
150
200
250
0
50
100
150
200
250
Chart 4.F Investment in field development and fields in production.
Constant 2019 prices. In billions of NOK. 2013 – 2022 1)
1) Projections for 2019 – 2022. Figures for 2013 – 2018 are from Statistics Norway’s investment intentionssurvey and are deflated by the price index for petroleum investment in the national accounts. The projections are based on Reports to the Storting, impact analyses, forecasts from the Norwegian Petroleum Directorate,Statistics Norway’s investment intentions survey and current information about development projects. Sources: Statistics Norway and Norges Bank
Fields in production excluding new development projects
Development projects initiated before 20 June 2019
Tor 2, Fogelberg, Grevling, Brasse, Grand and Hod redevelopment
Peon, Garantiana, Ormen Lange Phase 3, Heidrun Extension and Noaka/Krafla
Wisting, Alta−Gohta, Snøhvit Future and other new development projects
PROJECTIONS FOR PETROLEUM INVESTMENT
After falling markedly between 2013 and 2017, petroleum investment has risen over the past year. Investment is expected to increase substantially in 2019 (Chart 4.E). The increased activity reflects the substantial cost-cutting measures by oil companies in recent years and the pronounced rise in oil and gas prices since the beginning of 2016. As a result of the cost cuts, break-even prices for new development projects are now USD 10–35 per barrel of oil, which is far lower than the long-term oil prices expected by oil companies. Oil companies have therefore started a number of development projects in new and existing fields since 2016. If oil and gas price developments are approximately as projected in this Report, oil companies are expected to launch more than 20 development projects during the projection period (see box on page 17).
Investment in ongoing development projects increased by almost NOK 10bn in 2018. Investment is pro-jected to increase by a further NOK 14bn in 2019, falling in the period to 2022 as the development projects are completed. This decrease will to some extent be offset by new development projects scheduled to start ahead (Chart 4.F). However, most of these new projects are small compared with ongoing projects1 as there have been few large discoveries in recent years. Investment in development projects is therefore projected to fall between 2019 and 2022, particularly towards the end of the period. Well and operating investment in fields in production is expected to increase appreciably in 2019, in line with the investment intentions survey for Q2, and then rise moderately through the projection period.
Spending on exploration rose by NOK 4bn in 2018, after decreasing by almost half between 2013 and 2017. Exploration investment is projected to increase further ahead, driven by the fall in drilling costs since 2013 and the prospects for oil and gas prices.
Overall petroleum investment is projected to increase by 14% in 2019 and by a further 1% in 2020. Invest-ment is thereafter expected to fall by 3% in 2021 and by 6% in 2022. The investment projections for 2019 and 2020 are somewhat higher than in the March Report, while the projections for 2021 and 2022 are lower. The projections for 2019 and 2020 have been revised up in the light of the latest investment intentions survey, particularly for fields in production. The downward revision for 2021 and 2022 reflects the fall in oil and gas prices since March and the fact that some projects appear to be scheduled to start later than pro-jected in the March Report.2
1 Development of the Wisting and Alta-Gohta discoveries may result in investment totalling NOK 80bn-NOK 100bn over five to six years. These develop-ments are expected to commence towards the end of the projection period.
2 The Fogelberg, Garantiana and Noaka/Krafla projects.
36

PART 1 MONETARY POLICY / SECTION 4
POTENTIAL EMPLOYMENT
The objective of monetary policy is to contribute to stabilising employment at the highest level consistent with price stability over time.1 The level will rise over time owing to population growth, but is also influenced by the demographic composition of the population and by factors related to wage formation and the tax and social security system. The level, which we refer to as potential employment, is not observable.
Potential employment is estimated using the actual employment rate, ie the number of people employed as a percentage of the working age population. However, different data sources yield different estimates of the number employed and changes in the employment rate in recent years.
According to the quarterly national accounts (QNA), which include all employed persons in Norway, employ-ment has risen gradually since the cyclical trough in 2016. The total number employed has increased faster than the population, entailing a rise in the employment rate (blue line in Chart 4.G).
Increase in non-resident workersSome of the rise in employment reflects the growing number of non-resident workers in Norway (Chart 4.H). These workers expect to stay in Norway for less than six months. There are now about 90 000 non-resident wage earners in Norway, or 3% of all employed persons in the country. Around 60% are resident in EU countries in Central and Eastern Europe. About 30% are employed in the construction industry. In addition, around 20% are registered with employment agencies, and many of these probably also work in construction.
The number of non-resident workers in Norway has increased over time. In addition, it appears that the inflow of workers varies with job prospects in Norway. In the years 2006–2008, amid a marked upturn in the Norwegian economy, the number of non-resident workers rose sharply. In 2009, in the wake of the financial crisis, the number fell.
Higher employment rate for residentsThe Labour Force Survey (LFS) only covers persons resident in Norway and does not capture non-resident workers. Like the QNA, the LFS shows a rise in the employment rate since 2016, but the employment rate in the LFS has shown little change since autumn 2018 (purple line in Chart 4.G). The LFS is a sample survey and therefore the figures are subject to considerable uncertainty.
Another measure of employment among the resident labour force can be obtained by removing non-resident workers from the employment figures in the QNA. This measure shows that employment among the resident labour force has continued to increase since autumn 2018 (yellow line in Chart 4.G).
An ageing labour forceIn recent years, a growing share of the population aged between 15 and 74 has entered age groups where labour force participation rates are low. The ageing of the population points toward a falling employment rate over time. To illustrate the effect of the ageing of the population, a trend employment rate has been estimated assuming that employment rates for all five-year age cohorts between 15 and 74 are held con-stant at the 2013 level (broken lines in Chart 4.H). In 2013, capacity utilisation was, in the Bank’s assessment, at close to a normal level. According to the QNA, the employment rate is now appreciably higher than the 2013 trend. This could imply higher employment than that consistent with normal capacity utilisation in
1 See box in Monetary Policy Report 2/18 “How can monetary policy contribute to high and stable output and employment?”.
37

NORGES BANK MONETARY POLICY REPORT 2/2019
the economy. The estimated employment rate for the resident labour force is also higher than the 2013 trend, but the gap is smaller than for overall employment in the QNA.
However, more factors than the ageing of the population may have influenced trend employment growth. The pension reform, which entered into force in 2011, and a rising level of education in the population may have contributed to a rise in the employment rate. The apparent decline in recent years in the registered unemployment rate consistent with normal capacity utilisation pulls in the same direction. On the other hand, there has been a decline over time in the youth employment rate.
The gap between the employment rate for residents and the 2013 trend can be a measure of the difference between the actual and potential employment rate. Until the cyclical trough in 2016, there was a close cor-relation between this employment gap and the Bank’s assessment of capacity utilisation in the Norwegian economy. However, in recent years this gap has closed faster than implied by other capacity utilisation indicators as a whole.
The Bank’s assessment is that the trend employment rate has not declined as much as implied by the ageing of the population in isolation in recent years and that employment rate now seems to be near its potential.
Continued growth in potential employmentLooking ahead, the pension reform will likely continue to push up the employment rate. On the other hand, the youth employment rate may continue to decline, partly because more people remain in education for longer. The employment rate for residents is assumed to remain stable ahead. The ageing effect is fading as the large post-war cohorts are exiting the labour force.
At the same time, the number of non-resident workers is assumed to continue to increase ahead, so that overall trend employment growth is a little higher than population growth.
2007Q1 2008Q3 2010Q1 2011Q3 2013Q1 2014Q3 2016Q1 2017Q3 2019Q1
66
68
70
72
74
76
66
68
70
72
74
76
Chart 4.G Employed as a share of the population aged 15-74. Percent. 2007 Q1 – 2019 Q1
1) Quarterly national accounts. 2) Employment according to the QNA minus register data for non−residentworkers. The series for non−resident workers has been adjusted back in time owing to breaks in the seriesin 2015. 3) Labour Force Survey. 4) Employment share if the employment share for each five-year agecohort had remained unchanged at 2013-levels. The curve slopes downward owing to ageing of thepopulation aged 15-74. The year 2013 was selected because capacity utilisation was, in Norges Bank’sopinion, close to a normal level in that year. Sources: Statistics Norway and Norges Bank
QNA1)
Residents2)
LFS 3)
Ageing effect 4)
2003 2005 2007 2009 2011 2013 2015 2017
0.5
1
1.5
2
2.5
3
3.5
0.5
1
1.5
2
2.5
3
3.5
Chart 4.H Non−resident workers as a share of all employees1)
.2)
Percent. 2003 – 2018
1) According to the quarterly national accounts. 2) The series for non−resident workers has been adjustedback in time owing to breaks in the series in 2015. Changes from 2014 to 2015 are assumed to be the sameas in the quarterly national accounts. The series is relayed backwards by using the series’ own growth ratesfor the years before 2015. Sources: Statistics Norway and Norges Bank
38

5.1 OBJECTIVES AND RECENT DEVELOPMENTSLow and stable inflationThe primary objective of monetary policy is low and stable inflation. When the inflation target was intro-duced in 2001, the operational target of monetary policy was annual consumer price inflation of 2.5%. In March 2018, the target was changed to 2%. Average annual consumer price inflation has been around 2% since 2001 (Chart 5.1).
Inflation targeting shall be forward-looking and flex-ible so that it can contribute to high and stable output and employment and to countering the build-up of financial imbalances. Over the past decade, output and employment volatility has been relatively limited despite large shocks to the Norwegian economy. A flexible inflation targeting regime has helped to dampen the impact on the real economy. Monetary policy objectives and trade-offs are described further in a box on page 45.
Continued expansionary monetary policyThe interest rate level in recent years has been his-torically low, both globally and in Norway. This is because there has been a need for an expansionary monetary policy, and because the level of the neutral real interest rate has declined over time. The neutral real interest rate is the rate that is neither expansion-ary nor contractionary and cannot be observed. Model estimates indicate that the neutral real interest
5 Monetary policy analysis
The policy rate has been raised from 1% to 1.25%, and the forecast indicates a further rate increase in the course of 2019. At the end of 2022, the policy rate path is slightly below 1.75%.
The policy rate forecast implies a slightly faster rate rise in the coming year than projected in the March 2019 Monetary Policy Report, but the policy rate forecast is little changed further out. The upward revision of the policy rate forecast reflects a stronger upswing in oil services and a weaker krone. Lower oil prices and prospects for weaker external growth and lower foreign interest rates in isolation pull down the policy rate path.
The projections are uncertain, and the uncertainty increases through the projection period. If the outlook or the Bank’s assessment of economic relationships changes, the policy rate forecast will be adjusted.
1982 1988 1994 2000 2006 2012 2018
–2
0
2
4
6
8
10
12
–2
0
2
4
6
8
10
12
Chart 5.1 Consumer price index (CPI). Four-quarter change. Percent. 1982 Q1 – 2019 Q1
Sources: Statistics Norway and Norges Bank
CPI
CPI, five-year moving average
Inflation target
2003 2005 2007 2009 2011 2013 2015 2017
0.5
1
1.5
2
2.5
3
3.5
0.5
1
1.5
2
2.5
3
3.5
Chart 4.H Non−resident workers as a share of all employees1)
.2)
Percent. 2003 – 2018
1) According to the quarterly national accounts. 2) The series for non−resident workers has been adjustedback in time owing to breaks in the series in 2015. Changes from 2014 to 2015 are assumed to be the sameas in the quarterly national accounts. The series is relayed backwards by using the series’ own growth ratesfor the years before 2015. Sources: Statistics Norway and Norges Bank
39

NORGES BANK MONETARY POLICY REPORT 2/2019
rate has remained low in the past few years (Chart 5.2). The neutral real interest rate in Norway, meas-ured as the three-month money market rate less infla-tion, is estimated to be close to 0%, but the estimate is shrouded in considerable uncertainty.
The money market rate has edged up recently (Chart 5.3) in line with the increase in the policy rate. The real interest rate has fallen in response to higher infla-tion and is lower than the Bank’s estimate of the neutral real interest rate.
5.2 NEW INFORMATION AND ASSESSMENTSFurther rate riseGrowth in the Norwegian economy is solid. Spare capacity is gradually diminishing, and capacity utilisa-tion appears to be somewhat higher than a normal level. Wage growth has risen, and the improvements in labour market conditions suggest a further rise. Underlying inflation is a little above the inflation target.
Monetary policy remains expansionary. A policy rate that is too low over time may increase pressures in the economy, triggering an acceleration in wage and price inflation. Persistently high debt growth has increased household vulnerability. Household debt growth has edged lower in recent years, but remains somewhat higher than growth in household dispos-able income. Keeping the policy rate low for a long time amplifies the risk of a renewed acceleration in debt growth and house price inflation. A further build-up of financial imbalances increases the risk of a sharp economic downturn further out.
A gradual rate rise may contribute to keeping house price inflation moderate and to a further dampening of household debt growth. On the other hand, raising the policy rate too rapidly may stifle the upturn, result-ing in higher unemployment and below-target infla-tion. Moreover, the past decline in the neutral real interest rate suggests that the policy rate should be increased less than in previous upturns.
The risk outlook primarily reflects global develop-ments. Trade tensions between the US and China have deepened. This has led to a broad-based fall in
2005 2007 2009 2011 2013 2015 2017 2019
–4
–2
0
2
4
6
8
–4
–2
0
2
4
6
8
Chart 5.3 Three-month money market rate and real interest rates 1)
.
Percent. 2005 Q1 – 2019 Q1 2)
1) Three-month money market rate deflated by a three-quarter centred moving average of four−quarterinflation. 2) Projections for 2019 Q1. Sources: Statistics Norway and Norges Bank
Three-month money market rate
Real interest rate, deflated by CPI
Real interest rate, deflated by CPI-ATE
2001 2003 2005 2007 2009 2011 2013 2015 2017
–2
0
2
4
6
8
–2
0
2
4
6
8
Chart 5.2 Models for neutral real rates in Norway.1)
Percent. 2001 – 2018
1) For further reading see Brubakk, L., J. Ellingsen, Ø. Robstad (2018) "Estimates of the neutral rate ofinterest in Norway". Staff Memo 7/2018. Norges Bank. 2) Implicit five-year forward rates five years aheadbased on interest rate swaps with 5- and 10-year maturity for Norway. 3) The underlying trend in interestrates in a Bayesian vector autoregressive model. Source: Norges Bank
Market-based 2)
VAR model with time-varying parameters
BVAR 3)
State-space model (domestic inflation)
State-space model (wage growth)
State-space model (nominal interest rate)
40

PART 1 MONETARY POLICY / SECTION 5
foreign interest rates. If trade tensions deepen further, growth among trading partners and oil prices may be lower than projected. This may weigh on domestic growth. At the same time, the krone may remain weak, if global uncertainty persists. The UK’s relations with the EU are yet to be clarified. This Report applies the assumption that these relations will be clarified in the course of 2019 and that the UK’s exit from the EU will be orderly. If the UK exits the EU without a Withdrawal Agreement or the uncertainty about the UK’s relations with the EU persists, growth in Europe may turn out lower than anticipated.
The strength of the upturn in Norway is also uncer-tain. Oil companies have cut costs substantially in recent years, and break-even prices for new develop-ments are now far lower than the long-term oil prices expected by oil companies. The upswing in the oil industry may persist for a longer period, and spillovers into the wider Norwegian economy may end up being larger than anticipated. Employment prospects are also uncertain. Over the past few years, employment has risen more than expected and more than other indicators of labour market tightness would suggest. The projection for trend employment growth has been revised up, but the rate is uncertain.
The effects of monetary policy are uncertain. A wider interest rate differential ahead is expected to result in an appreciation of the krone, but the strength of the effect is uncertain. The policy rate hikes since autumn 2018 have not so far passed through fully to interest rates facing households. Owing to high household debt burdens, higher interest rates will likely dampen household demand more than his-torical experience indicates. The long period of low interest rates and rising debt burdens has increased the uncertainty surrounding the effects of higher interest rates. The uncertainty surrounding the effects of monetary policy suggests a cautious approach to interest rate setting.
The overall outlook and balance of risks suggest that the policy rate be increased somewhat further.
2013 2014 2015 2016 2017 2018 2019 2020 2021 2022
–3
–2
–1
0
1
2
–3
–2
–1
0
1
2
Chart 5.5 Real interest rate.1)
Percent. 2013 Q1 – 2022 Q3 2)
1) Three-month money market rate deflated by a three-quarter centred moving average of four−quarterinflation as measured by the CPI-ATE. 2) Projections for 2019 Q1 – 2022 Q3. Sources: Statistics Norway and Norges Bank
Projections MPR 2/19
Projections MPR 1/19
2013 2014 2015 2016 2017 2018 2019 2020 2021 2022
–1
0
1
2
3
–1
0
1
2
3
Chart 5.4 Policy rate. Percent. 2013 Q1 – 2022 Q4 1)
1) Projections for 2019 Q2 – 2022 Q4.Source: Norges Bank
Projections MPR 2/19
Projections MPR 1/19
41

NORGES BANK MONETARY POLICY REPORT 2/2019
2013 2014 2015 2016 2017 2018 2019 2020 2021 2022
–1
0
1
2
3
4
–1
0
1
2
3
4
Chart 5.A CPI-ATE.1)
Projections conditional on new information and policy
rate forecast in MPR 1/19. Four-quarter change. Percent. 2013 Q1 – 2022 Q4 2)
1) CPI adjusted for tax changes and excluding energy products. 2) Projections for 2019 Q2 – 2022 Q4. Sources: Statistics Norway and Norges Bank
Projections MPR 1/19
New information
Inflation target
Both the real and nominal interest rate can influence how monetary policy affects the Norwegian economy. In the analysis, the money market rate is assumed to rise in tandem with the rise in the policy rate (Chart 1.8). In the projection, the real interest rate rises in the next few years and shows little change thereafter (Chart 5.5).
With a policy rate in line with the forecast in this Report, the output gap is projected to be positive throughout the projection period. Capacity utilisation is projected to peak towards the end of 2019, declin-ing thereafter (Chart 1.1b). The projections for capac-ity utilisation are a little higher than in March in the coming period and little changed thereafter.
Inflation is projected to be close to 2% at the end of 2022 (Chart 1.1c-d). The projections for both CPI and CPI-ATE inflation are a little higher than in the March Report.
The projections in this Report are based on Norges Bank’s assessment of the economic situation, the functioning of the economy and the effects of mon-etary policy. The projections are uncertain and the uncertainty increases through the projection period. When the economic outlook changes, or if our under-standing of the relationship between the interest rate level, inflation and the real economy changes, the policy rate forecast will be adjusted.
Higher capacity utilisationCapacity utilisation in the Norwegian economy appears to be rising a little faster than projected in the March Report. This partly reflects prospects for higher petroleum investment and oil service exports than envisaged in March and a slightly more expan-sionary fiscal policy than expected. The krone has been weaker than expected. There are prospects for weaker external growth and lower foreign interest rates than envisaged in March.
A model-based analysis of new information suggests that with a policy rate forecast unchanged since March, both capacity utilisation and inflation will be a little higher than projected throughout the projec-tion period (see box on page 43). New information thus implies a slightly faster rate rise ahead than indi-cated by the policy rate forecast in the March Report.
The policy rate has been raisedThe policy rate has been raised from 1% to 1.25% effective from 21 June 2019, and the forecast indicates a further rate increase in the course of 2019 (Chart 5.4). At the end of 2022, the policy rate path is slightly below 1.75%. The policy rate path is slightly higher than in the March Report for the coming year and a little lower further out. The box on page 44 describes the factors behind the changes in the policy rate path.
42

PART 1 MONETARY POLICY / SECTION 5
2013 2014 2015 2016 2017 2018 2019 2020 2021 2022
–1
0
1
2
3
4
–1
0
1
2
3
4
Chart 5.A CPI-ATE.1)
Projections conditional on new information and policy
rate forecast in MPR 1/19. Four-quarter change. Percent. 2013 Q1 – 2022 Q4 2)
1) CPI adjusted for tax changes and excluding energy products. 2) Projections for 2019 Q2 – 2022 Q4. Sources: Statistics Norway and Norges Bank
Projections MPR 1/19
New information
Inflation target
2013 2014 2015 2016 2017 2018 2019 2020 2021 2022
–2
–1
0
1
2
–2
–1
0
1
2
Chart 5.B Estimated output gap1)
. Conditional on new information and policy rateforecast in MPR 1/19. Percent. 2013 Q1 – 2022 Q4
1) The output gap measures the percentage deviation between mainland GDP and estimated potentialmainland GDP. Source: Norges Bank
Projections MPR 1/19
New information
MODEL-BASED INTERPRETATION OF NEW INFORMATION
In assessing the effects of new information and new assessments on the outlook for inflation and the output gap, a model-based exercise is performed where the policy rate forecast from the previous Report is held constant. Norges Bank’s macroeconomic model NEMO1 is used in this exercise, where updated projections for the current and next quarter are applied. For exogenous variables, updated projections for the entire projection period are used and comprise the following variables: foreign import growth, external inflation, foreign interest rates, oil prices, domestic money market premiums, domestic public demand and domestic petroleum investment.
The model-based analysis suggests that with a policy rate forecast unchanged since March, CPI-ATE infla-tion will be a little higher than projected in the March Report until the end of the projection period (Chart 5.A), reflecting slightly higher-than-projected inflation in the near term and a weaker krone. With an unchanged rate path, the krone is weaker than projected in March throughout the projection period, despite a widening of the interest rate differential against other countries compared with the March Report. This reflects a weaker-than-expected krone and lower oil futures prices than in March.
Capacity utilisation is rising a little faster and reaches a slightly higher level than projected in the March Report (Chart 5.B), mainly reflecting an upward adjustment of the projections for the oil service sector and public demand since March. Consistent with an unchanged policy rate forecast and slightly higher inflation, the real interest rate will be a little lower than projected in March throughout the projection period, result-ing in slightly higher demand and capacity utilisation. On the other hand, lower oil prices, lower growth abroad and lower foreign interest rates will in isolation pull down capacity utilisation.
Higher inflation and higher capacity utilisation in the coming period suggest a slightly faster rise in the policy rate than indicated by the policy rate forecast in the March Report.
1 NEMO is described in Kravik, E.M and Y. Mimir (2019) “Navigating with NEMO”. Staff Memo 5/2019. Norges Bank.
43

NORGES BANK MONETARY POLICY REPORT 2/2019
FACTORS BEHIND CHANGES IN THE POLICY RATE PATH
The main factors behind the changes in the rate path since the March Report are illustrated in Chart 5.C.
The bars show the various factors’ contributions. The black line shows the overall change in the policy rate forecast. The macroeconomic model NEMO is used as a tool for interpreting the driving forces in the economy, but there is no mechanical relationship between news that deviates from the Bank’s forecasts in the March Report and the effect on the new rate path.
Prospects for import growth among trading partners appear to be a little weaker than assumed in March, and foreign forward rates are lower. Both factors pull down the rate path (green bars).
The krone is weaker than projected and weaker than developments in the interest rate differential and oil prices would suggest. A weaker krone pulls up the rate path (orange bars).
Oil futures prices are lower than in March, implying lower petroleum investment and lower growth in oil-related exports. At the same time, lower oil prices contribute in isolation to lifting growth among trading partners. On balance, lower oil prices pull down the rate path (beige bars).
Despite lower oil prices, the near-term prospects for oil services have improved. This is because petroleum investment on the Norwegian shelf appears to be a little higher than assumed earlier and because oil service exports appear to be growing faster than projected. In the longer term, petroleum investment and oil service exports have been revised down, but less than the fall in oil prices would suggest. Increased demand from oil services in isolation pulls up the rate path (red bars).
Changes in other domestic demand factors pull the rate path up slightly, reflecting in part slightly stronger fiscal policy impulses, but also a weak passthrough from the policy rate increases to bank lending rates. The effect on the rate path of changes in domestic demand factors are illustrated by the dark blue bars.
Overall, new information since the March Report suggests an upward adjustment in the rate path in the near term and a slight downward adjustment further out in the projection period. Trade tensions are a source of substantial global uncertainty. The uncertainty surrounding the effects of monetary policy suggests a cau-tious approach to interest rate setting. Our judgement implies a somewhat smaller upward adjustment of the interest rate path than new information in isolation would indicate, as expressed by the light blue bars.
2019Q3 2020Q1 2020Q3 2021Q1 2021Q3 2022Q1 2022Q3
–1
–0.5
0
0.5
1
–1
–0.5
0
0.5
1
Chart 5.C Factors behind changes in policy rate forecast since MPR 1/19.Cumulative contribution. Percentage points. 2019 Q3 – 2022 Q4
Source: Norges Bank
Other demand Oil services
Exchange rate Oil price
Judgement Foreign growth and interest rates
Change in policy rate forecast
44

PART 1 MONETARY POLICY / SECTION 5
MONETARY POLICY OBJECTIVES AND TRADE-OFFS
The operational target of monetary policy is annual consumer price inflation of close to 2% over time. Infla-tion targeting shall be forward-looking and flexible so that it can contribute to high and stable output and employment and to counteracting the build-up of financial imbalances. The various considerations are weighed against each other.
The policy rate is set with a view to stabilising inflation around the target in the medium term. The horizon will depend on the disturbances to which the economy is exposed and the effects on the outlook for infla-tion and for output and employment.
Monetary policy can contribute to stabilising output and employment at around the highest possible level consistent with price stability over time. This level is determined by structural conditions such as the tax and social security system, the system of wage formation and the composition of the labour force.
When shocks occur, a short-term trade-off may arise between reaching the inflation target and supporting high and stable output and employment. Monetary policy should achieve a reasonable trade-off between these considerations.
A flexible inflation targeting regime, in which sufficient weight is given to the real economy, can prevent downturns from becoming deep and protracted. This can reduce the risk of unemployment becoming entrenched at a high level following an economic downturn.
If there are signs that financial imbalances are building up, the consideration of high and stable output and employment may in some situations suggest keeping the policy rate somewhat higher than would other-wise be the case. To some extent, this can contribute to reducing the risk of sharp economic downturns further ahead. Nevertheless, the regulation and supervision of financial institutions are the primary means of addressing shocks to the financial system.
The conduct of monetary policy takes account of uncertainty regarding the functioning of the economy. Uncertainty surrounding the effects of monetary policy normally suggests a cautious approach to interest rate setting. This may reduce the risk that monetary policy will have unintended consequences. The policy rate will normally be changed gradually so that the effects of interest rate changes and other new informa-tion about economic developments can be assessed.
In situations where the risk of particularly adverse outcomes is pronounced, or if there is no longer confi-dence that inflation will remain low and stable, it may in some cases be appropriate to react more strongly in interest rate setting than normal.
45

NORGES BANK MONETARY POLICY REPORT 2/2019
Growth in credit to Norwegian households has decelerated in recent years, but debt ratios are high. Corporate credit growth is being sustained. Over the past two years, the housing market has been characterised by moderate house price inflation and high turnover. House prices relative to household disposable income have declined. The rise in commercial real estate (CRE) prices has slowed somewhat. Bank profitability is solid and losses are low, and banks have ample access to wholesale funding. Norges Bank’s assessment of financial imbalances has not changed substantially since the preceding quarter.
6.1 FINANCIAL IMBALANCESFinancial imbalances have built up over a long period. Household debt ratios are high and have increased substantially over many years. After rising rapidly for a long period, both residential and commercial prop-erty prices are at very high levels.
Household debt is still growing faster than income, but the pace of growth has slowed somewhat in recent quarters. Corporate credit growth is being sustained and is higher than the rate of growth in the economy. Enterprises have ample access to credit.
House prices relative to household disposable income have decreased over the past two years. House price inflation has recently been clearly lower than growth in disposable income. The sharp rise in CRE prices has slowed somewhat in recent quarters.
Norges Bank’s assessment of financial imbalances has not changed substantially since the preceding quarter. Looking ahead, rising interest rates and mod-erate house price inflation are expected to dampen household debt growth. In the CRE market, the mod-erate rise in prices seen in recent quarters is expected to continue. Against this background, the build-up of financial imbalances is likely to moderate, which enhances financial stability. After a period, this may curb a further build-up of financial imbalances and mitigate the risk of a sharp and more pronounced economic downturn further out.
6.2 GLOBAL FINANCIAL STABILITYOwing to high debt levels in many countries, the global economy is vulnerable to abrupt declines in asset prices and higher debt servicing costs. Risk pricing in global financial markets has long been fairly low, despite the uncertainty associated with global trade tensions and the UK’s exit from the EU. However, there have been sharp movements in market prices over the past half-year. Turbulence in global financial markets may lead to shocks to the Norwegian financial system, first through a rise in wholesale funding costs, which could feed through to the supply of credit to households and enterprises and in turn hamper growth in the Norwegian economy.
Risk-taking in global financial markets remains high. Bond market risk premiums are now somewhat higher than before market turbulence heightened at the end of 2018 (Chart 6.1). In the global equity market, cor-porate valuations have been approximately unchanged since the March 2019 Monetary Policy Report, despite a substantial downward revision of expectations regarding growth in corporate earnings and persistent uncertainty surrounding economic and political developments (see further discussion in Section 2). In the US, growth in leveraged loans con-tinued in 2019 Q1. Reduced international interest rate expectations and high risk-taking may give rise to increased global financial imbalances.
In the EU, banks continue to reduce their stock of non-performing loans, freeing up capital and improv-
6 Financial stability assessment– decision basis for the countercyclical capital buffer
2013 2014 2015 2016 2017 2018 2019
0
2
4
6
8
10
0
2
4
6
8
10
Chart 6.1 Corporate bond risk premiums. Premiums above government bond yields.
Source: Bloomberg
US - high-yield
Europe - high-yield
US - low-yield
Europe - low-yield
PART 2: FINANCIAL STABILITY
46

PART 2 FINANCIAL STABILITY / SECTION 6
2013 2014 2015 2016 2017 2018 2019
0
2
4
6
8
10
0
2
4
6
8
10
Chart 6.1 Corporate bond risk premiums. Premiums above government bond yields.
Source: Bloomberg
US - high-yield
Europe - high-yield
US - low-yield
Europe - low-yield
ing banks’ capacity to extend new loans. Neverthe-less, profitability among European banks remains low. Several Nordic banks with activities in the Baltic coun-tries are under investigation for deficiencies in their routines for combating money laundering. This has had a considerable impact on wholesale funding costs for the implicated banks (Chart 6.2). There does not appear to have been any contagion to Norwegian banks or other Nordic banks that have had activities in the Baltic countries.
6.3 CREDIT MARKETIn Norway, credit has long risen faster than mainland GDP (Chart 6.3). Over the past couple of years, this credit indicator has remained approximately
unchanged. The credit gap, which shows the differ-ence between the indicator and an estimated trend, is steadily becoming less positive (Chart 6.4).
Household debt is still growing faster than incomeHousehold debt-to-income ratios are high and have risen substantially over a long period (Chart 6.5). A high debt ratio entails a risk that households will have to tighten consumption in response to a sharp fall in income or a marked rise in interest rates.
Growth in credit to households has slowed in recent years and is now at its lowest level since 1997 (Chart 6.6). The 12-month rise has remained unchanged at 5.6% since January. In the period ahead, household
1983 1990 1997 2004 2011 2018
0
50
100
150
200
250
0
50
100
150
200
250
Chart 6.3 Credit as a share of GDP. Mainland Norway.
Sources: IMF, Statistics Norway and Norges Bank
Domestic debt, households (C2)
Domestic debt, non-financial enterprises (C2)
Foreign debt, non-financial enterprises
Total credit
Crises
1983 1990 1997 2004 2011 2018
0
10
20
0
10
20
Chart 6.4 Decomposed credit gap. Credit as a share of GDP. Mainland Norway.
Sources: IMF, Statistics Norway and Norges Bank
Domestic debt, households (C2)
Domestic debt, non-financial enterprises (C2)
Foreign debt, non-financial enterprises
Total credit
Crises
2015 2016 2017 2018 2019
0
40
80
120
0
40
80
120
Chart 6.2 CDS prices for Nordic banks' senior bonds.
Five-year maturity. Five-day moving average. Basis points.
Source: Bloomberg
DNB
Danske Bank
Nordea
Handelsbanken
Swedbank
47

NORGES BANK MONETARY POLICY REPORT 2/2019
credit growth is expected to edge down further (Annex Table 4). Debt ratios are expected to continue to rise (Chart 4.7), but at a somewhat slower pace.
The debt service ratio, ie the ratio of interest and normal principal payments to income, is high and at the same level as during the financial crisis in 2008 and the banking crisis at the beginning of the 1990s (Chart 6.5). The interest burden, ie the ratio of interest payments to income, is likely to have increased further following the policy rate increase in March. Nevertheless, from a historical perspective, the inter-est burden is low (Chart 6.5). Most households have ample capacity to service debt at somewhat higher interest rates. For households with large consumer loans, the high interest rates on such loans contribute to a heavy interest burden. Household debt service signals high risk in the heatmap (Chart 6.A).
Unsecured loans, such as consumer loans, account for just below 4% of total household debt. New requirements for banks’ consumer credit standards will likely entail a tightening in this lending segment. The requirements may restrain the build-up of vulner-abilities among highly indebted households. Analyses conducted by Norges Bank show that close to one-fourth of households with consumer debt in 2016 would have been limited by at least one of the require-ments (see the 2018 Financial Stability Report). Banks were required to comply with the new requirements by 15 May 2019.
The banks included in Norges Bank’s lending survey expect somewhat higher residential mortgage demand in 2019 Q2. They also report increased com-petition in the residential mortgage market. Banks expect credit standards for households to remain unchanged.
Sustained corporate debt growthEnterprises have ample access to credit. Growth in corporate credit from domestic sources increased through 2017 and was around 6% to 7% in 2018 (Chart 6.6). During the past months, growth has been sus-tained. Developments in corporate debt signal low risk in the heatmap (Chart 6.A).
In the years leading up to the banking and financial crises, corporate credit grew markedly faster than
2011 2013 2015 2017 2019
0
2
4
6
8
0
2
4
6
8
Chart 6.6 Domestic credit to households and non-financial enterprises in mainland
Sources: Statistics Norway and Norges Bank
Households
Non-financial enterprises
1983 1990 1997 2004 2011 2018
0
100
200
300
0
10
20
30
Chart 6.5 Household debt ratio1)
, debt service ratio2)
and interest burden3)
.
1) Loan debt as a percentage of disposable income. 2) Ratio of interest payments and estimatedprincipal payments to the sum of disposable income and interest payments. 3) Interest expenses as apercentage of disposable income plus interest expenses. Sources: Statistics Norway and Norges Bank
Debt ratio (left-hand scale)
Debt service ratio (right-hand scale)
Interest burden (right-hand scale)
48

PART 2 FINANCIAL STABILITY / SECTION 6
2014 2015 2016 2017 2018 2019
0
5
10
0
5
10
Chart 6.7 Bank and mortgage company lending to Norwegian non-financial
enterprises by industry. Contribution to twelve-month change in stock. Percent.
Sources: Statistics Norway and Norges Bank
Commercial real estate Construction
Manufacturing Services
Other industries Total
GDP (Chart 6.3). After the financial crisis, the credit-to-GDP ratio was fairly stable, but since 2017, credit growth has been somewhat higher than the rate of growth in the economy. Compared with other coun-tries, Norwegian corporate debt is not particularly high (see the 2018 Financial Stability Report). In the period ahead, credit growth for non-financial enter-prises is expected to remain at approximately the current level.
CRE lending has long been the main contributor to bank credit growth (Chart 6.7). At the same time, CRE selling prices have increased sharply. Over the past year, construction lending has increased faster than growth in total bank credit to corporates. Higher growth in credit to real estate-related sectors may fuel the build-up of financial imbalances. The risk of losses on construction loans appears to be low, even though high residential construction activity in recent years has likely contributed to the increase in credit growth in this industry (see box on page 56). Banks’ overall corporate loan losses edged lower between 2017 and 2018, partly owing to lower loan losses in the power sector (Chart 6.8). Oil-related industries are also contributing to lower losses, but the contribu-tion varies by sub-industry.
Growth in bond and short-term paper debt declined through 2018 and issuance was low in 2019 Q1 com-pared with 2018 Q1. So far in 2019 Q2, issuance has picked up somewhat. The real estate and manufactur-ing sectors are the main contributors to overall growth, even though the growth contributions have fallen since summer 2018. The power sector is making a negative contribution. Redemptions will increase somewhat through 2019, and activity is therefore expected to pick up further. In line with international developments, risk premiums have fallen so far in 2019, despite having increased somewhat recently.
All corporate indicators signal low risk in the heatmap (Chart 6.A).
6.4 HOUSING MARKETHouse prices have risen sharply over a long period and are at historically high levels. Nevertheless, over the past two years, house prices relative to household disposable income have declined (Chart 6.9). In the heatmap, housing market developments have sig-
2007 2009 2011 2013 2015 2017
0
0.2
0.4
0.6
0.8
1
0
0.2
0.4
0.6
0.8
1
Chart 6.8 Banks'1)
loan losses to the corporate market as a share of total lending to
1) Branches of foreign banks are not included, except for Nordea. Source: Norges Bank
Commercial real estate Construction
Manufacturing, mining and quarrying Services and transport
Distributive trade, hotels and restaurants Fishing and aquaculture
Agriculture, forestry and power sector Oil-related industries
49

NORGES BANK MONETARY POLICY REPORT 2/2019
nalled low risk since 2017 Q4 (Chart 6.A). At the same time, the high level of house prices is a source of vul-nerability for the Norwegian financial system (see the 2018 Financial Stability Report).
After a long period of rapid house price inflation, house prices fell in 2017 by approximately 3% between the peak in March and the trough at the beginning of 2018. House prices rebounded in the course of 2018. As expected, house price inflation has recently been low and lower than growth in household disposable income. The 12-month rise was 1.8% in May (Chart 6.10). The slower rise in house prices will likely reduce the risk of an abrupt and more pronounced downturn further out.
Smaller regional differencesIn the past five years, house price inflation has varied widely across regions. In 2015 and 2016, house prices rose sharply in Oslo while falling markedly in Stavanger (Chart 6.11). The decline in house prices in 2017 was much more pronounced in Oslo than in the other cities. Regional differences in house price inflation have recently narrowed. From 2003 to the present, house prices in large urban areas have risen to approx-imately the same extent, with the exception of Oslo, where the rise in prices has been significantly higher (Chart 6.11). This is partly because residential con-struction in Oslo has for a longer period been lower than implied by population growth.1 In Stavanger, prices rose at a very fast pace in the pre-crisis years and at a faster pace than in other urban areas up until the fall in oil prices in 2014.
Activity remains highActivity in the market for existing homes is strong Through much of 2018, the number of homes for sale was at its highest monthly post-crisis level, and in May 2019, a particularly high number of homes were listed for sale (Chart 6.12). The number of listings is high in much of the country. The increase reflects a large number of completions. Many buyers of new homes will sell and move from the property they already own.
Sales of existing homes have also been high through 2018 and so far in 2019 (Chart 6.13). Housing demand
1 See Mæhlum, S., P. M. Pettersen and H. Xu (2018) “Residential construction and household formation”. Staff Memo 12/2018. Norges Bank.
Jan Feb Mar Apr May Jun Jul Aug Sep Oct Nov Dec
0
5000
10000
15000
20000
0
5000
10000
15000
20000
Sources: Eiendomsverdi, Finn.no and Real Estate Norway
2019
2003 2007 2011 2015 2019
50
100
150
200
250
300
350
50
100
150
200
250
300
350
Chart 6.11 House prices. Index. Seasonally adjusted. January 2003 = 100.
Sources: Eiendomsverdi, Finn.no and Real Estate Norway
Oslo
Bergen
Trondheim
Stavanger and vicinity
Norway
2013 2014 2015 2016 2017 2018 2019
0
1
2
5
15
Sources: Eiendomsverdi, Finn.no and Real Estate Norway
Seasonally adjusted monthly change (l.h.s)
Twelve-month change (r.h.s)
1983 1990 1997 2004 2011 2018
50
100
150
200
50
100
150
200
Chart 6.9 House prices relative to disposable income.
Sources: Eiendomsverdi, Finn.no, Norwegian Association of Real Estate Agents (NEF), Real EstateNorway, Statistics Norway and Norges Bank
House prices/disposable income
House prices/disposable income per capita (aged 15 - 74)
Crises
50

PART 2 FINANCIAL STABILITY / SECTION 6
Jan Feb Mar Apr May Jun Jul Aug Sep Oct Nov Dec
0
4000
8000
12000
16000
0
4000
8000
12000
16000
Chart 6.13 Turnover of existing homes.
Sources: Eiendomsverdi, Finn.no and Real Estate Norway
2019
Jan Feb Mar Apr May Jun Jul Aug Sep Oct Nov Dec
0
4000
8000
12000
16000
0
4000
8000
12000
16000
Sources: Eiendomsverdi, Finn.no and Real Estate Norway
2019
Average 2010 - 2018
Max/Min. 2010 - 2018
2005 2007 2009 2011 2013 2015 2017 2019
0
10000
20000
30000
40000
50000
0
10000
20000
30000
40000
50000
Chart 6.15 Housing starts, completions and annual change in number of households.1)
1) Projections for 2019 and 2020 (broken lines and shaded bars).Sources: Statistics Norway and Norges Bank
Number of housing starts
Number of completions
Change in number of households
may have increased as a result of solid developments in the Norwegian economy, with lower unemploy-ment and increased income growth. However, sales have not increased by as much as the number of homes listed for sale. This has resulted in an increase in the number of unsold existing homes from already high levels (Chart 6.14). Although this increase affects much of the country, the number of unsold homes is particularly high in central, southern and western Norway.
In the market for new homes, the number of unsold homes has declined somewhat over the past four months, especially for housing starts. This reflects both fewer new homes listed for sale compared with the same period in 2018 and continued firm demand.
This indicates that the market for new homes is in balance (see box on page 56).
Moderate house price inflation aheadHouse price inflation is expected to be moderate in the coming years (Annex Table 4). The number of housing starts is expected to remain firm, with a large number of completions in 2019 (Chart 6.15). This is likely to sustain the high volume of existing homes listed for sale. Along with higher interest rates, these developments are expected to pull down on house price inflation, while prospects for increased employ-ment and higher wage growth pull in the opposite direction.
Jan Feb Mar Apr May Jun Jul Aug Sep Oct Nov Dec
0
5000
10000
15000
20000
0
5000
10000
15000
20000
Sources: Eiendomsverdi, Finn.no and Real Estate Norway
2019
51

NORGES BANK MONETARY POLICY REPORT 2/2019
For a long period, residential construction activity has been outpaced by household formation. This backlog in residential construction reduces the likelihood of a substantial fall in house prices owing to the high number of housing completions.
The projections are uncertainThe uncertainty surrounding the effects of higher interest rates on house prices has increased as a result of a long period of low lending rates and his-torically high household leverage. The projections for house price inflation are also discussed in Section 4.1.
6.5 COMMERCIAL REAL ESTATE MARKETCRE prices have risen sharply over a long period. Prices are at historically high levels. Developments in CRE prices are important for banks owing to their substantial CRE exposures. The CRE market indicator signals high risk in the heatmap (Chart 6.A).
Somewhat more moderate rise in CRE pricesEstimated real selling prices for prime real estate in Oslo have risen sharply in recent years (Chart 6.16). Prices continued to rise in 2019 Q1, but the rise in prices has edged down. Selling prices are estimated as the ratio of market rents to yields. The rise in selling prices was long driven up by falling yields. In the past two years, however, higher rents have made the largest contribution to growth while yields have remained stable.
Rents continued to rise somewhat in Oslo in 2019 Q1 (Chart 6.17). As reasons for the rise in rents, market participants point in particular to a low supply of new office buildings and strong demand for offices in central Oslo. According to the real estate company Entra’s Consensus Report, market participants expect the rise in rents in 2019 to be fairly strong in central Oslo and somewhat more moderate in surrounding areas. From 2020, an increased number of new office building completions is expected to contribute to a moderate rise also in central Oslo. In Bergen, Trond-heim and Stavanger, demand for centrally located office space is high and has contributed to higher rents. Conditions are more varied outside of the city centres.
Yields on office space in Oslo were unchanged in 2019 Q1, both for prime and non-prime office space (Chart
2006 2010 2014 2018
0
2
4
6
8
10
0
2
4
6
8
10
Chart 6.18 Yields on office space in Oslo.
1) Property along Ring 3. Five-year lease.Source: DNB Næringsmegling
Non-prime yields1)
Prime yields
2009 2011 2013 2015 2017 2019
1000
2000
3000
4000
1000
2000
3000
4000
Chart 6.17 Office rents in Oslo.
Source: Arealstatistikk
Vika-Aker Brygge
Central Oslo
Oslo
1983 1990 1997 2004 2011 2018
0
100
200
300
0
100
200
300
Chart 6.16 Real commercial real estate prices.1)
1) Estimated real selling prices per square metre for prime office space in Oslo. Deflated by GDP deflatorfor mainland Norway. Average selling price for the previous four quarters. Sources: CBRE, Dagens Næringsliv, OPAK, Statistics Norway and Norges Bank
Crises
52

PART 2 FINANCIAL STABILITY / SECTION 6
2009 2011 2013 2015 2017 2019
0
5
10
15
20
0
5
10
15
20
Chart 6.19 Return on equity for large Norwegian banks.
Sources: Banks' quarterly reports and Norges Bank
Quarterly return on equity (annualised)
Four-quarter moving average
6.18). In recent quarters, banks’ margins on CRE expo-sures have narrowed somewhat, which may reflect stronger competition. Long-term interest rates are lower compared with the March Report (Chart 3.4), resulting in a slight decline in total level of financing costs. Owing to continued high demand for attractive investment opportunities and lower foreign and domestic interest rate expectations, market partici-pants expect yields to remain fairly flat in the years ahead with only a marginal rise next year.
Overall, market expectations of higher rents and yields suggest that selling prices will continue to rise ahead, albeit at a more moderate pace than in recent years.
6.6 BANKSStricter capital, liquidity and recovery and resolution requirements following the financial crisis have strengthened the resilience of banks to losses and market stress. A majority of the banking indicators in the heatmap signal low risk (Chart 6.A).
Bank profitability is solidThe profitability of Norwegian banks is solid (Chart 6.19). In 2019 Q1, the return on equity of a number of large Norwegian banks was affected by a non-recur-ring gain related to the merger of SpareBank 1 Ska-deforsikring and DNB Forsikring. Underlying profit-ability is also solid, and higher market prices for secu-rities holdings are also making a positive contribution. Net interest income is pulling profitability down some-what (Chart 6.20), partly owing to new rules for the calculation of banks’ contributions to the deposit guarantee fund. Low operating expenses and losses are making positive contribution to profitability. The low losses reflect solid developments in the Norwegian economy.
Banks meet capital requirementsBanks are well positioned to comply with changes to capital requirements, including the increase in the countercyclical capital buffer to 2.5% from year-end 2019. Banks’ capital ratios are in line with regulatory requirements and banks’ long-term Common Equity Tier 1 (CET1) targets (Chart 6.21). The Ministry of Finance has decided that changes will not be made to the criteria for designating systemically important banks. Finanstilsynet (Financial Supervisory Author-
2009 2012 2015 2018
0
0.5
1
0
0.5
1
Chart 6.20 Decomposed change in the profits of large Norwegian banks.
Sources: Banks' quarterly reports and Norges Bank
Net interest income Other operating income Labour costs
Other operating costs Loan losses Pre-tax profit
2011 2012 2013 2014 2015 2016 2017 2018
0
5
10
15
20
0
5
10
15
20
2019Q1
9.310.4
11.412.3
14.015.5 15.9 16.0 16.2
Sources: Banks' quarterly reports and Norges Bank
CET1 capital ratio
Banks' long-term capital target
53

NORGES BANK MONETARY POLICY REPORT 2/2019
ity of Norway) had proposed a regional criterion, which Norges Bank supported and which would have imposed higher capital requirements on several large regional banks.
The forthcoming transposition of EU regulations into Norwegian law will lead to a reduction in the capital required to achieve the same risk-weighted capital ratio. The Ministry of Finance will soon circulate for comment a draft of possible adjustments to Norwegian capital requirements aimed at preventing an undesirable weakening of the capital levels that Norwegian banks have reached since the financial crisis and at harmonising capital requirements for Norwegian and foreign banks operating in Norway.
Norwegian banks’ market capitalisation fell consider-ably during the stock market decline in 2018 Q4, but has since recovered (Chart 6.22). Market capitalisation is somewhat lower than at the time of the March Report, but banks have ample access to wholesale funding in both NOK and foreign currency. The risk premiums Norwegian banks pay for senior bonds and covered bonds are at approximately the same level as at the time of the March Report. In the liquidity survey, banks reported continued ample access to funding. In the course of 2019, Finanstilsynet will set a recovery and resolution plan and a minimum requirement equal to the sum of own funds and eli-gible liabilities (MREL) for the largest and most complex banks. This may impact banks’ funding struc-ture.
In the period ahead, banks are expected to have suf-ficient capacity to meet credit demand. Twelve-month growth in bank lending to Norwegian corporates increased during 2017, stabilising at around 6% (Chart 6.23). Relative to lending from branches of foreign banks in Norway, Norwegian banks’ share of corpo-rate lending growth has increased over the past twelve months, while the share of growth in lending to households has declined.
2014 2015 2016 2017 2018 2019
0
2
4
6
8
10
0
2
4
6
8
10
Chart 6.23 Banks' and mortgage companies' lending to Norwegian non-financial
enterprises. Banking groups' contribution to 12-month growth in the stock of loans.
Sources: Statistics Norway and Norges Bank
Total DNB Other Norwegian banks
Nordea Other branches
2015 2016 2017 2018 2019
80
120
160
200
240
80
120
160
200
240
Chart 6.22 Equity price indexes in the banking sector.
Source: Thomson Reuters
Equity Certificate Index (OSEEX)
Bank Index (OSE4010GI)
Benchmark Index (OSEBX)
54

PART 2 FINANCIAL STABILITY / SECTION 6
A HEATMAP FOR MONITORING SYSTEMIC RISK
Norges Bank’s ribbon heatmap is a tool for assessing systemic risk in the Norwegian financial system. The heatmap tracks developments in a broad range of indicators for three main areas: risk appetite and asset valuations, non-financial sector vulnerabilities (household and corporate) and financial sector vulnerabilities.1
Developments in each individual indicator are mapped into a common colour coding scheme, where green (red) reflects low (high) levels of vulnerability. The heatmap thus provides a visual summary of current vulnerabilities in the Norwegian financial system compared with historical episodes. The composite indica-tors are constructed by averaging individual indicators.
Chart 6.A Composite Indicators in the heatmap 1980 Q1 – 2019 Q12
Housing marketCommercial real estateEquity marketBond marketBank loansGlobal financial cycle
Risk appetiteAsset
valuations
Non-financial sector
Financial sector
Banking crisis
1980 1985 1990 1995 2000 2005 2010 2015
Sources: BIS, Bloomberg, CBRE, Dagens Næringsliv, DNB Markets, Eiendomsverdi, Finn.no, Norwegian Association of Real Estate Agents (NEF), OECD, OPAK, Real Estate Norway, Statistics Norway, Thomson Reuters and Norges Bank
Financial crisis
Banks – Growth in assets and equity ratioBanks – FundingBanks – ConnectednessNon-bank financial institutions
Households – LeverageHouseholds – Debt serviceHouseholds – Credit growthNon-financial enterprises – LeverageNon-financial enterprises – Debt serviceNon-financial enterprises – Credit growth
1 For a detailed description of the heatmap and the individual indicators, see Arbatli, E.C. and R.M. Johansen (2017) “A Heatmap for Monitoring Systemic Risk in Norway”. Staff Memo 10/2017. Norges Bank. See also box on page 54 of Monetary Policy Report 4/17.
2 The equity market indicator is revised in order to only reflect developments in equity prices relative to trend. This indicator has previously also reflected developments in the price/earnings ratio (PE ratio).
55

NORGES BANK MONETARY POLICY REPORT 2/2019
BANKS’ RISK FROM ACQUISITION, DEVELOPMENT AND CONSTRUCTION EXPOSURES1
Norwegian banks’ acquisition, development and construction (ADC) exposures are considerable. Histori-cally, the bankruptcy rate in this sector has been fairly high, particularly during downturns. Most bankrupt-cies are in construction, but most of the debt is in real estate development. Bank losses on real estate development exposures have been low since the financial crisis. Pre-sale requirements help to mitigate loss risk in building projects. Despite high residential construction activity, the number of unsold homes in com-pleted projects has been low in recent years.
The ADC sector accounts for approximately 8% of mainland GDP and about 11% of banks’ corporate expo-sures (Chart 6.B). Bank losses on real estate development exposures have been low since the financial crisis (Chart 6.C). Losses on the other ADC exposures have been higher than the average for corporate loan losses but this is a smaller share of banks’ lending.
For a real estate developer, unsold homes in a development project are a substantial source of risk. New completions without buyers could be a source of large financial losses for both banks and developers. A high proportion of pre-sales is therefore important for reducing the risk associated with the debt held by these enterprises. In pre-sales, buyers normally pay a smaller deposit and are obliged to pay the remainder of the contractual purchase price when the homes are completed.
High pre-sale requirements mean that the buyers of newly completed homes assume much of the project’s price risk. This may be appropriate. As long as the purchase was not made solely with the intent to resell, the buyer will still have use for the home even if it were to have decreased in value since its purchase date.
1 See also Hagen, M., I. N. Hjelseth, H. Solheim and B. H. Vatne (2019) “Kan høy boligbygging gi økte tap i bankene? ” [Can high residential construction activity result in higher bank losses?]. Published on Bankplassen blogg 20 June 2019.
46%
8%3%
6%
11%
7%
7%
4%
8%
Chart 6.B Lending to the corporate market1)
by all banks and mortage companies.
Percent. At 31 March 2019
1) Total corporate loans NOK 1 484bn. 2) Other industries comprise "Oil services", "Othertransportation", "Electricity and water supply" and "Extraction of natural resources". Here, "Oilservices" are narrowly defined.Source: Norges Bank
Commercial real estate
Real estate development
Other construction
Manufacturing
Services
Distributive trade, hotels and restaurants
Primary industries
Shipping
Other industries2)
2010 2012 2014 2016 2018
0
0.5
1
1.5
2
2.5
0
0.5
1
1.5
2
2.5
Chart 6.C Banks'1)
loan losses by sector.
1) Branches of foreign banks are not included, except for Nordea. Source: Norges Bank
Real estate development
Other construction
Sector total
56

PART 2 FINANCIAL STABILITY / SECTION 6
At the same time, a high pre-sale requirement may make it difficult to launch new real estate development projects in periods when buyers are unwilling to assume price risk. Pre-sale requirements may therefore contribute to a decline in new building starts in periods when property price developments are weak and to exacerbating the procyclical nature of residential construction.
Residential construction activity in Norway was high in the years to 2017, but housing starts have declined somewhat in 2018 and 2019 (Chart 6.15). The high level of activity was preceded by a period in which housing construction activity was lower than population growth. The stock of unsold new homes rose markedly when house price inflation fell in 2017 (Chart 6.D). The rise was particularly high in eastern Norway, where housing starts had been highest and the decline in house price inflation was most pronounced. The number of unsold homes in completed projects in eastern Norway has not risen substantially, even though expec-tations for house price inflation may have diminished (Chart 6.E). During the financial crisis, the number of unsold completed homes rose markedly in eastern Norway. Following the fall in oil prices in 2014, there has been a slight increase in the number of unsold completed homes in western Norway.
Throughout Norway, the number of unsold new homes under construction has recently declined, which indicates that most of the unsold homes are sold during the construction phase and that there will not be a glut of unsold completed homes. This indicates that the market for new homes is in balance and that banks’ loss risk related to the sector as a whole appears to be low.
2010 2012 2014 2016 2018
0
0.5
1
1.5
2
2.5
0
0.5
1
1.5
2
2.5
Chart 6.C Banks'1)
loan losses by sector.
1) Branches of foreign banks are not included, except for Nordea. Source: Norges Bank
Real estate development
Other construction
Sector total
2014 2015 2016 2017 2018 2019
0
2000
4000
6000
8000
10000
0
2000
4000
6000
8000
10000
Chart 6.D Unsold new homes.1)
1) This statistic covers all projects with more than 15 units. Sources: ECON and Economics Norway
Not started
Under construction
Completed
Jul-04 Jul-06 Jul-08 Jul-10 Jul-12 Jul-14 Jul-16 Jul-18
0
400
800
1200
1600
2000
0
400
800
1200
1600
2000
Chart 6.E Unsold completions. Number of units. February 2004 - April 20191)
1) This statistic covers all projects with more than 15 units. Data is available from April 2012 for western Norway and from October 2013 for central, southern and northern Norway, but the number of unsold completions may be somewhat underestimated in the beginning of the data series for each of these regions. Sources: ECON and Economics Norway
Eastern Norway
Western Norway
Southern Norway
Central Norway
Northern Norway
57

NORGES BANK MONETARY POLICY REPORT 2/2019
CRITERIA FOR AN APPROPRIATE COUNTERCYCLICAL CAPITAL BUFFER1
The countercyclical capital buffer should satisfy the following criteria:
1. Banks should become more resilient during an upturn2. The size of the buffer should be viewed in the light of other requirements applying to banks3. Stress in the financial system should be alleviated
The countercyclical capital buffer should be increased when financial imbalances are building up or have built up. This will bolster banks’ resilience and lessen the amplifying effects of bank lending during down-turns. Moreover, a countercyclical capital buffer may curb high credit growth and mitigate the risk that financial imbalances trigger or amplify an economic downturn.
Experience from previous financial crises in Norway and other countries shows that both banks and bor-rowers often take on considerable risk in periods of strong credit growth. In an upturn, credit that rises faster than GDP can signal a build-up of imbalances. In periods of rising real estate prices, debt growth tends to accelerate. When banks grow rapidly and raise funding for new loans directly from financial markets, systemic risk may increase.
Norges Bank’s advice to increase the countercyclical capital buffer will as a main rule be based on four key indicators: i) the ratio of total credit (C2 households and C3 mainland non-financial enterprises) to mainland GDP, ii) the ratio of house prices to household disposable income, iii) real commercial property prices and iv) wholesale funding ratios for Norwegian credit institutions. The four indicators have historically risen ahead of periods of financial instability. As part of the basis for its advice on the countercyclical capital buffer, Norges Bank will analyse developments in the key indicators and compare the current situation with historical trends.2
Norges Bank’s advice will also build on recommendations from the European Systemic Risk Board (ESRB). Under the EU Capital Requirements Directive (CRD IV), national authorities are required to calculate a refer-ence buffer rate (a buffer guide) for the countercyclical buffer on a quarterly basis.
There will not be a mechanical relationship between the indicators, the gaps or the recommendations from the ESRB3 and Norges Bank’s advice on the countercyclical capital buffer. The advice will be based on the Bank’s professional judgement, which will also take other factors into account. Other requirements apply-ing to banks will be part of the assessment, particularly when new requirements are introduced.
The countercyclical capital buffer is not an instrument for fine-tuning the economy. The buffer rate should not be reduced automatically even if there are signs that financial imbalances are receding. In long periods of low loan losses, rising asset prices and credit growth, banks should normally hold a countercyclical buffer.
The buffer rate can be reduced in the event of an economic downturn and large bank losses. If the buffer functions as intended, banks will tighten lending to a lesser extent in a downturn than would otherwise have been the case. This may mitigate the procyclical effects of tighter bank lending. The buffer rate will not be reduced to alleviate isolated problems in individual banks.
The key indicators are not well suited to signalling when the buffer rate should be reduced. Other informa-tion, such as market turbulence, substantial loan loss prospects for the banking sector and significant credit supply tightening, will then be more relevant.
1 See also “Criteria for an appropriate countercyclical capital buffer”. Norges Bank Papers 1/2013.2 See Norges Bank’s website “Indicators of financial imbalances”. As experience and insight are gained, the set of indicators can be developed further.3 See European Systemic Risk Board (2014) “Recommendation on guidance for setting countercyclical buffer rates”.
58

Annex
Monetary policy meetings in Norges Bank
Tables and detailed projections

NORGES BANK MONETARY POLICY REPORT 2/2019
Monetary policy meetings in Norges BankDate1 Policy rate2 Change
18 September 201914 August 201919 June 2019 1.25 0.258 May 2019 1.00 020 March 2019 1.00 0.2523 January 2019 0.75 012 December 2018 0.75 024 October 2018 0.75 019 September 2018 0.75 0.2515 August 2018 0.50 020 June 2018 0.50 02 May 2018 0.50 014 March 2018 0.50 024 January 2018 0.50 013 December 2017 0.50 025 October 2017 0.50 020 September 2017 0.50 021 June 2017 0.50 03 May 2017 0.50 014 March 2017 0.50 014 December 2016 0.50 026 October 2016 0.50 021 September 2016 0.50 022 June 2016 0.50 011 May 2016 0.50 016 March 2016 0.50 -0.2516 December 2015 0.75 04 November 2015 0.75 023 September 2015 0.75 -0.2517 June 2015 1.00 -0.25
6 May 2015 1.25 018 March 2015 1.25 010 December 2014 1.25 -0.2522 October 2014 1.50 017 September 2014 1.50 018 June 2014 1.50 07 May 2014 1.50 026 March 2014 1.50 04 December 2013 1.50 0
1 The interest rate decision has been published on the day following the monetary policy meeting as from the monetary policy meeting on 13 March 2013. The interest rate decision at the monetary policy meeting on 14 March 2017 was published two days after the meeting.
2 The policy rate is the interest rate on banks’ sight deposits in Norges Bank. This interest rate forms a floor for money market rates. By managing banks’ access to liquidity, Norges Bank ensures that short-term money market rates are normally slightly higher than the policy rate.
60

ANNEX
TABLE 1 Projections for GDP growth in other countries
Change from projections in Monetary Policy Report 1/19 in brackets
Share of world GDP1
Trading partners4
Percentage change from previous year
PPP
Market exchange rates 2018 2019 2020 2021 2022
US 16 25 9 2.9 (0) 2.3 (0.1) 1.7 (-0.1) 1.7 (0) 1.7 (0)
Euro area 12 16 33 1.9 (0.1) 1.2 (0.1) 1.4 (0) 1.4 (-0.1) 1.5 (0)
UK 2 4 10 1.4 (0) 1.3 (0.2) 1.3 (-0.1) 1.4 (-0.1) 1.5 (0)
Sweden 0.4 0.7 12 2.5 (0.1) 1.7 (0.1) 1.7 (0) 1.7 (-0.1) 1.8 (-0.2)
Other advanced economies2 7 10 18 1.9 (0) 1.6 (-0.1) 1.6 (-0.1) 1.8 (-0.1) 1.8 (-0.1)
China 16 15 6 6.6 (0) 6 (0) 5.8 (0) 5.7 (-0.1) 5.7 (-0.1)
Other emerging economies3 19 11 12 3.7 (0.1) 3 (-0.3) 3.8 (0) 3.8 (-0.1) 3.9 (-0.1)
Trading partners4 72 79 100 2.6 (0) 2 (0.1) 2 (-0.1) 2 (-0.1) 2.1 (-0.1)
World (PPP)5 100 3.6 (0) 3.2 (0) 3.5 (0) 3.5 (-0.1) 3.6 (-0.1)
World (market exchange rates)5 100 3.1 (0) 2.6 (0) 2.7 (-0.1) 2.8 (-0.1) 2.9 (0)
1 Country’s share of global output measured in a common currency. Average 2015–2017.2 Other advanced economies in the trading partner aggregate: Denmark, Japan, Korea, Singapore and Switzerland. Export weights.3 Emerging economies in the trading partner aggregate excluding China: Brazil, India, Indonesia, Poland, Russia, Thailand and Turkey.
GDP weights (market exchange rates) are used to reflect the countries’ contribution to global growth.4 Export weights, 25 main trading partners.5 GDP weights, three-year moving average.
Sources: IMF, Thomson Reuters and Norges Bank
TABLE 2 Projections for consumer prices in other countries
Change from projections in Monetary Policy Report 1/19 in brackets
Trading partners4
Percentage change from previous year
2018 2019 2020 2021 2022
US 8 2.4 (0) 1.9 (0.1) 2.2 (-0.1) 2.3 (0) 2.3 (0)
Euro area 33 1.8 (0) 1.3 (0.1) 1.5 (0) 1.6 (0) 1.7 (0)
UK 6 2.3 (0) 2 (0.1) 2.1 (0) 2 (0) 1.9 (0)
Sweden1 13 2.1 (0) 1.9 (0) 2 (0) 2 (0) 2 (0)
Other advanced economies2 17 1.1 (0) 1.1 (-0.3) 1.5 (-0.1) 1.6 (-0.1) 1.7 (0.1)
China 12 2.1 (0) 2.3 (0.1) 2.4 (0) 2.7 (0) 2.6 (0)
Other emerging economies3 10 4.4 (-0.3) 5 (-0.2) 4.7 (-0.1) 4.5 (0) 4.5 (0.2)
Trading partners4 100 2 (-0.1) 2 (0) 2.1 (0) 2.2 (0) 2.2 (0.1)
Underlying inflation5 1.4 (0) 1.5 (0) 1.7 (0) 1.9 (0) 1.9 (0)
Wage growth6 2.6 (-0.1) 2.5 (-0.1) 2.9 (0) 2.9 (0) 2.9 (0)
1 Consumer price index with a fixed interest rate (CPIF).2 Other advanced economies in the trading partner aggregate: Denmark, Japan, Korea, Singapore and Switzerland. Import weights.3 Emerging economies in the trading partner aggregate excluding China: Brazil, India, Indonesia, Poland, Russia, Thailand and Turkey.
GDP weights (market exchange rates).4 Import weights, 25 main trading partners.5 The aggregate for underlying inflation includes: the euro area, Sweden, UK and US. Import weights.6 Projections for compensation per employee in the total economy. The aggregate includes: the euro area, Sweden, UK and US. Import weights.
Sources: IMF, Thomson Reuters and Norges Bank
61

NORGES BANK MONETARY POLICY REPORT 2/2019
Table 3a GDP for mainland Norway. Quarterly change. Seasonally adjusted. Percent2018 2019
Q4 Q1 Q2 Q3
Actual 1.1 0.3Projections in MPR 1/19 0.6 0.8Projections in MPR 2/19 0.8 0.7
Sources: Statistics Norway and Norges Bank
Table 3b Registered unemployment (rate). Percent of labour force. Seasonally adjusted2019
Mar Apr May Jun Jul Aug Sep
Actual 2.3 2.2 2.3Projections in MPR 1/19 2.3 2.3 2.3 2.3Projections in MPR 2/19 2.3 2.2 2.2 2.2
Sources: Norwegian Labour and Welfare Administration (NAV) and Norges Bank
Tabell 3c Consumer prices. Twelve-month change. Percent2019
Mar Apr May Jun Jul Aug Sep
Consumer price index (CPI)Actual 2.9 2.9 2.5Projections in MPR 1/19 2.9 2.5 2.6 2.2Projections in MPR 2/19 2.1 1.8 1.6 1.7CPI-ATE1
Actual 2.7 2.6 2.3Projections in MPR 1/19 2.6 2.3 2.5 2.4Projections in MPR 2/19 2.4 2.4 2.3 2.4Imported consumer goods in the CPI-ATEActual 1.9 1.5 1.3Projections in MPR 1/19 2.2 1.7 1.8 1.8Projections in MPR 2/19 1.5 1.6 1.2 1.3Domestically produced goods and services in the CPI-ATE2
Actual 3.1 3.2 2.7Projections in MPR 1/19 2.8 2.6 2.9 2.8Projections in MPR 2/19 2.8 2.8 2.8 2.7
1 CPI adjusted for tax changes and excluding energy products.2 The aggregate ”domestically produced goods and services in the CPI-ATE” is calculated by Norges Bank.
Sources: Statistics Norway and Norges Bank
62

ANNEX
Table 4 Projections for main economic aggregates
Change from projections in Monetary Policy Report 1/19 in brackets
In billions of NOK
2018
Percentage change from previous year (unless otherwise stated)
2018
Projections
2019 2020 2021 2022
Prices and wagesConsumer price index (CPI) 2.7 (0) 2.2 (-0.1) 1.9 (0.2) 2.0 (0.2) 2.0 (0)
CPI-ATE1 1.6 (0) 2.4 (0.1) 2.1 (0.1) 2.0 (0.1) 2.0 (0)Annual wages 2.8 (0) 3.3 (0) 3.5 (0) 3.6 (-0.1) 3.5 (-0.1)Real economy2
Gross domestic product (GDP) 3536 1.8 (0.1) 2.0 (-0.4) 2.3 (0.3) 1.8 (0.1) 1.5 (0)GDP, mainland Norway 2907 2.6 (0.1) 2.6 (-0.1) 1.9 (0.1) 1.2 (0) 1.2 (0.1)Output gap, mainland Norway (level)3 -0.2 (0) 0.7 (0.1) 0.8 (0) 0.5 (0) 0.2 (0)Employment, persons, QNA 1.6 (0) 1.7 (0.3) 0.8 (0) 0.3 (0) 0.2 (0.1)Labour force, LFS4 1.5 (0) 0.9 (-0.4) 0.8 (0.1) 0.3 (-0.1) 0.2 (0)LFS unemployment (rate, level) 3.8 (0) 3.5 (-0.1) 3.3 (-0.2) 3.4 (-0.2) 3.5 (-0.1)Registered unemployment (rate, level) 2.4 (0) 2.2 (-0.1) 2.1 (-0.1) 2.1 (-0.2) 2.2 (-0.2)Demand2
Mainland demand5 3068 1.6 (0) 2.0 (0.2) 2.0 (0.1) 1.6 (-0.1) 1.8 (-0.1)- Household consumption6 1539 2.1 (0) 2.0 (0.1) 2.3 (-0.1) 2.1 (-0.2) 2.3 (-0.2)- Business investment 312 2.5 (0.7) 4.2 (0.1) 3.5 (1.0) 0.8 (-0.2) 1.5 (-0.3)- Housing investment 192 -6.0 (0) 0.3 (0.3) 1.0 (-0.2) 1.5 (0.2) 1.7 (0.2)- Public demand7 1025 2.2 (-0.2) 1.7 (0.3) 1.3 (0.1) 1.1 (0) 1.2 (0.1)
Petroleum investment8 155 2.7 (-0.6) 14.0 (1.5) 1.0 (0) -3.0 (-2.0) -6.0 (0)Mainland exports9 650 2.7 (0.2) 5.0 (0.5) 2.0 (-0.7) 2.2 (0) 2.8 (0.2)Imports 1154 0.6 (-0.3) 3.4 (0.7) 2.2 (-1.1) 2.8 (-0.5) 2.6 (-0.5)
House prices and debtHouse prices 0.7 (0) 2.3 (-0.1) 3.0 (0) 3.3 (0.1) 3.4 (-0.2)Credit to households (C2)10 5.5 (0) 5.6 (0.2) 5.2 (0) 5.3 (-0.1) 5.4 (-0.3)
Interest rate and exchange rate (level)Policy rate11 0.6 (0) 1.1 (0) 1.6 (0) 1.7 (0) 1.7 (0)Import-weighted exchange rate (I-44)12 104.6 (0) 105.4 (1.0) 103.3 (1.3) 102.9 (1.3) 102.8 (1.2)Money market rates, trading partners13 0.4 (0) 0.5 (-0.1) 0.3 (-0.3) 0.3 (-0.4) 0.4 (-0.5)Oil priceOil price, Brent Blend. USD per barrel14 71 (0) 63 (-3) 59 (-6) 58 (-5) 58 (-4)
1 CPI adjusted for tax changes and excluding energy products.2 All figures are working day-adjusted.3 The output gap measures the percentage deviation between mainland GDP and projected potential mainland GDP.4 Labour Force Survey.5 Household consumption and private mainland gross fixed investment and public demand.6 Includes consumption for non-profit organisations.7 General government gross fixed investment and consumption.8 Extraction and pipeline transport.9 Traditional goods, travel, petroleum services and exports of other services from mainland Norway.10 Credit growth is calculated as the four-quarter change at year-end.11 The policy rate is the interest rate on banks’ deposits in Norges Bank.12 The weights are estimated on the basis of imports from 44 countries, which comprise 97% of total imports. A higher value denotes a weaker krone exchange rate.13 Based on three-month money market rates and interest rate swaps.14 Spot price for 2018. The price for 2019 is calculated as the average spot price so far in 2019 and futures prices for the remainder of the year. Futures prices for
2020–2022. Futures prices at 14 June 2019.
Sources: Eiendomsverdi, Finn.no, Norwegian Labour and Welfare Administration (NAV), Real Estate Norway, Statistics Norway, Thomson Reuters and Norges Bank
63

Design: BrandlabPrinting: 07 Media ASThe text is set in 9.5 point Azo Sans LightPhoto: Esten BorgosISSN: 1894-0242 (print) | 1894-0250 (online)
NORGES BANKBankplassen 2, P.O. Box 1179 Sentrum, N-0107 Oslo, NorwayPhone: +47 22316000www.norges-bank.no
Monetary Policy Report 2|19 – June


