Monday, September 21, 2015 Weston Middle School Library ... · 9/21/2015 · Weston Middle School...
109
WESTON BOARD OF EDUCATION Monday, September 21, 2015 Weston Middle School Library Resource Center Executive Session 6:30 p.m. Regular Session 7:30 p.m. Agenda I. CALL TO ORDER, VERIFICATION OF QUORUM Philip Schaefer, Chairperson II. EXECUTIVE SESSION 1. Matters Pertaining to Security III. PLEDGE OF ALLEGIANCE IV. RECOGNITION Motion 1. Mr. Schaefer, Board Chair, will recognize Nina Daniel for her four years of service to the Weston Board of Education. V. APPROVAL OF MINUTES, pages 1-6 Motion 1. The Board will vote to approve the minutes from June 29. 2. The Board will vote to approve the minutes from August 17. VI. PUBLIC COMMENT Information VII. NEW BUSINESS 1. Gifts, page 7 Information Dr. Palmer, as per Board Policy #3280, has accepted, with appreciation, a Steinway piano valued at $75,000 and piano bench valued at $1,000, for the Weston High School music program. 2. Update on Beginning of 2015-16 School Year Information Dr. Palmer, Superintendent of Schools, will provide an update on the beginning of the 2015-16 school year. 3. Tri-State Report, pages 8-66 Information Dr. Craw, Assistant Superintendent, will present the math K-12 Tri-State Consultancy Report from the Tri-State Consortium’s March 2015 visit. 4. Weston High School Proposed International Field Trip, pages 67-68 Information Dr. Craw, Assistant Superintendent, and Mrs. Deorio, Weston High School Principal, will discuss the proposed WHS trip to Spain for April 2016. 5. Second FY 2016 Financial Update and Approval of Transfers, pages 69-95 Motion Mr. Rudl, Director of Finance and Operations, will provide a monthly financial update.
Transcript of Monday, September 21, 2015 Weston Middle School Library ... · 9/21/2015 · Weston Middle School...

WESTON BOARD OF EDUCATION Monday, September 21, 2015
Weston Middle School Library Resource Center
Executive Session 6:30 p.m.
Regular Session 7:30 p.m.
Agenda
I. CALL TO ORDER, VERIFICATION OF QUORUM
Philip Schaefer, Chairperson
II. EXECUTIVE SESSION
1. Matters Pertaining to Security
III. PLEDGE OF ALLEGIANCE
IV. RECOGNITION Motion
1. Mr. Schaefer, Board Chair, will recognize Nina Daniel for her four years of
service to the Weston Board of Education.
V. APPROVAL OF MINUTES, pages 1-6 Motion
1. The Board will vote to approve the minutes from June 29.
2. The Board will vote to approve the minutes from August 17.
VI. PUBLIC COMMENT Information
VII. NEW BUSINESS
1. Gifts, page 7 Information
Dr. Palmer, as per Board Policy #3280, has accepted, with appreciation, a Steinway
piano valued at $75,000 and piano bench valued at $1,000, for the Weston High
School music program.
2. Update on Beginning of 2015-16 School Year Information
Dr. Palmer, Superintendent of Schools, will provide an update on the beginning of
the 2015-16 school year.
3. Tri-State Report, pages 8-66 Information Dr. Craw, Assistant Superintendent, will present the math K-12 Tri-State
Consultancy Report from the Tri-State Consortium’s March 2015 visit.
4. Weston High School Proposed International Field Trip, pages 67-68 Information
Dr. Craw, Assistant Superintendent, and Mrs. Deorio, Weston High School Principal,
will discuss the proposed WHS trip to Spain for April 2016.
5. Second FY 2016 Financial Update and Approval of Transfers, pages 69-95 Motion Mr. Rudl, Director of Finance and Operations, will provide a monthly financial
update.

VIII. OLD BUSINESS None
IX. SUPERINTENDENT’S REPORT Information
1. Next Regular Board Meeting is Monday, October 19, 2015, at 7:30 p.m.
2. District Update
3. Principals’ Reports, pages 96-107
X. COMMITTEE REPORTS
1. Communications Committee – Sara Spaulding Information
2. Curriculum Committee - Ellen Uzenoff Information
3. Finance Committee - Denise Harvey Information
4. Facilities Committee - Ellen Uzenoff Information 5. Policy Committee - Dana Levin Information 6. Negotiations Committee - Denise Harvey Information 7. CES - Elise Major Information 8. CABE – Daniel McNeill Information 9. Weston Education Foundation – Sara Spaulding Information
XI. ADJOURNMENT Motion

Weston Public Schools
Board of Education Special Meeting
Central Office Conference Room
June 29, 2015
Attendance:
Philip Schaefer, Chairperson Dr. Colleen Palmer, Superintendent
Dana Levin, Secretary/Treasurer Dr. Jo-Ann Keating, Director of Finance and Ops.
Denise Harvey Richard Rudl, Director of Finance and Operations
Sara Spaulding
I. CALL TO ORDER, VERIFICATION OF QUORUM
Philip Schaefer, Chairperson
II. Anticipated Executive Session
1. Discussion of evaluations relative to a prospective public supply contract (food
service)
III. Resume Public Session
1. Award food service contact
Dr. Keating provided an overview of the bidding process. Chartwells scored higher
than the other two companies that bid, using that State’s scoring matrix. There will
be the option of a one-year renewal, and Dr. Keating will let the other two
companies know the status of the bid.
Motion: Moved that the Weston Board of Education awards the food service
contract for the fiscal year 2016, commencing on July 1, 2015 to Chartwells, a
member of the Compass Group. Motion by Ms. Harvey, second by Mrs. Levin, all
in favor. (4-0)
IV. ADJOURNMENT
There being no further business to discuss, meeting adjourned at 6:02 p.m.
Motion by Ms. Harvey, second by Mrs. Levin, all in favor. (4-0)
Minutes prepared by Jennifer Markov, Board of Education Clerk.
September 21, 2015 - Page 1

Weston Public Schools
Board of Education Meeting
Central Office Conference Room
August 17, 2015
Attendance:
Philip Schaefer, Chairperson Dr. Colleen Palmer, Superintendent
Ellen Uzenoff, Vice Chairperson Dr. Kenneth Craw, Assistant Superintendent
Dana Levin, Secretary/Treasurer Lewis Brey, Director of Human Resources
Nina Daniel Richard Rudl, Director of Finance & Operations
Denise Harvey
Elise Major Absent: Sara Spaulding
I. CALL TO ORDER, VERIFICATION OF QUORUM
Philip Schaefer, Chairperson
II. EXECUTIVE SESSION
1. Discussion of the evaluation by the administration relative to the negotiation of a
prospective public supply contract for cleaning services with Shamrock of New
England
III. PLEDGE OF ALLEGIANCE
Dr. Palmer expressed her concern for Jeanette Navin and her family and hopes for their safe return.
Mr. Schaefer announced that this meeting will be the last for Ms. Daniel as a member of the Board of
Education, and that she will be formally recognized at the September meeting.
IV. RECOGNITION – No report
V. APPROVAL OF MINUTES
The Board will vote to approve the minutes from June 29 at its next monthly meeting
due to a lack of quorum for the motion.
The Board voted to approve the minutes from July 28. Ms. Harvey was absent.
Motion: Moved that the Weston Board of Education approves the minutes of the
July 28, 2015, Special Meeting and Executive Session. Motion by Mrs. Levin,
second by Ms. Major, 5 in favor – Mr. Schaefer, Mrs. Uzenoff, Mrs. Levin, Ms.
Major, Ms. Daniel; 1 abstained – Ms. Harvey. (5-0-1)
VI. PUBLIC COMMENT – no report
September 21, 2015 - Page 2

VII. NEW BUSINESS
1. Resignation
Motion: Moved that the Weston Board of Education notes the resignation of Jeff
Horton, 1.0 FTE Weston High School English Teacher, effective June 30, 2015.
Motion by Mrs. Uzenoff, second by Ms. Major, all in favor. (6-0)
Dr. Palmer announced that she has accepted the letter of resignation from Dr. Marotto indicating
his retirement from his position as Weston High School Assistant Principal, acknowledged his
years of service, and wished him well.
Mr. Schaefer requested the amendment of the agenda to include the addition of two items:
Under New Business – the appointment of an assistant principal to fill the vacancy at
the high school, and
Under Old Business – a second reading of Administrative Regulation 3323, Soliciting
Prices (Bids and Quotations).
Motion: Moved that the Weston Board of Education adds a new agenda item
under New Business, which is for the appointment of a new assistant principal at
Weston High School, and adds a new agenda item under Old Business, which is a
second reading of Administrative Regulations 3323 A and B, Soliciting Prices
(Bids and Quotations). Motion by Ms. Harvey, second by Ms. Levin. (6-0)
2. Appointment of Weston High School Assistant Principal
Motion: Moved that the Weston Board of Education appoints Juli Givoni as the
Assistant Principal for Weston High School at a date of mutual agreement.
Motion by Ms. Daniel, second by Ms. Major, all in favor. (6-0)
Dr. Palmer welcomed Ms. Givoni to Weston Public Schools and highlighted her
stellar background. Ms. Givoni began interviewing as a candidate for Assistant
Principal with the departure of Mr. Doak and was one of the two finalists for the
position.
3. FY 2015 Year-End Financial Report Mr. Rudl, Director of Finance and Operations, reviewed the Year-End Financial
Report, and presented six journal entries to the operating budget from the IDEA grant
for Special Education totaling $176,454 and an additional 25 transfers to reconcile
and balance out all accounts, totaling $30,703. Fiscal year-end balance was $3,003.
The Internal Services Fund remains with a healthy balance. Discussion by the Board
followed.
Motion: Moved that the Weston Board of Education approves the final financial
report and transfers presented by Mr. Rudl and reflected in the tenth financial
September 21, 2015 - Page 3
report for FY 2015, which is for the fiscal year ending June 30, 2015. Motion by
Ms. Harvey, second by Ms. Major, all in favor (6-0)
4. First FY 2016 Financial Update and Approval of Transfers Mr. Rudl, Director of Finance and Operations, provided a monthly financial update.
There were four transfers presented for approval, in the areas of technology (a
reclassification), student liability insurance, increased association membership fee for
the high school library, and a membership in a facilities leadership organization.
Motion: Moved that the Weston Board of Education approves the transfers as
presented by Mr. Rudl in the first FY 2016 financial update. Motion by Mrs.
Uzenoff, second by Mrs. Levin, all in favor. (6-0)
VIII. EXECUTIVE SESSION
1. Matters Pertaining to Security
Motion: Motion to enter into executive session by Ms. Major, second by Ms.
Daniel, all in favor. (6-0)
The following individuals were invited into executive session: Police Commissioners
Beth Gralnick, William Brady, and Jess DiPasquale; Dr. Colleen Palmer, Superintendent
of Schools; Dr. Kenneth Craw, Assistant Superintendent; Richard Rudl, Director of
Finance and Operations; Dr. Craig Tunks, Director of Digital Learning and Innovation;
Lewis Brey, Director of Human Resources and Internal Counsel; and Lois Pernice,
Director of Pupil Personnel Services.
IX. RESUME PUBLIC SESSION
5. Discussion and Possible Vote on School Resource Officer Program Agreement
Dr. Palmer, Superintendent of Schools, discussed collaborative work to craft the
proposed agreement between the Weston Police Department and Weston Public
Schools for the School Resource Officer Program. She thanked the Board, Police
Commission, and Weston Police Department for their hard work in supporting
campus safety. Mrs. Levin also thanked Ms. Harvey, who was on the Committee; Ms.
Daniel who attended site visits; and Dr. Marotto, who gathered data and arranged the
site visits.
Motion: Moved that the Weston Board of Education approves the agreement
between the Weston Police Department and Weston Public Schools for the School
Resource Officer Program as presented to the Board of Education by the Weston
Police Commission in Executive Session with the addition of the phrase “other
administrators” after the word “principals” in the first bullet point under the
section entitled “Duties of the School Resource Officer,” and authorizes the
Board Chair and Superintendent to sign an agreement on its behalf. Motion by
Ms. Harvey, second by Ms. Daniel, all in favor. (6-0)
September 21, 2015 - Page 4

X. OLD BUSINESS
1. Weston Board of Education Policies, Regulations, and Bylaws The Board voted to approve Administrative Regulations 3323A and B, Soliciting
Prices (Bids and Quotations).
Motion: Moved that the Weston Board of Education approves Administrative
Regulations 3323 A and B, Soliciting Prices (Bids and Quotations). Motion by
Mrs. Levin, second by Ms. Major, all in favor. (6-0)
XI. SUPERINTENDENT’S REPORT
1. Next Regular Board Meeting is Monday, September 21, 2015, at 7:30 p.m.
2. District Update Dr. Palmer, Superintendent of Schools, welcomed 11 new teachers to the Weston
district and asked Mr. Brey to highlight the draft of the new teacher brochure. Mr.
Brey explained the rigorous process that goes into the process of hiring a teacher, and
listed the areas in the district in which new teachers were hired for the 2015-16 school
year. Dr. Palmer also provided an update on summer renovations and repairs to
instructional space and other facilities/grounds areas. Discussion by the Board and
Superintendent followed on district enrollment and the addition of a section for
kindergarten.
XII. COMMITTEE REPORTS
1. Communications Committee There was nothing to report.
2. Curriculum Committee
There was nothing to report.
3. Finance Committee
Per Mr. Schaefer, in addition to what was discussed previously in the agenda, an
update on the Shamrock and Zenon plant contracts was discussed at the August 12
meeting. The next meeting is scheduled for September 10.
4. Facilities Committee
Mrs. Uzenoff highlighted the high school courtyard renovations.
5. Policy Committee
There was nothing to report.
6. Negotiations Committee
Per Ms. Harvey, negotiations continue with AFCSME.
September 21, 2015 - Page 5

7. CES
There was nothing to report.
8. CABE
There was nothing to report.
9. Weston Education Foundation There was nothing to report.
XIII. ADJOURNMENT
Motion: Motion to adjourn by Mrs. Uzenoff, second by Ms. Daniel, all in favor.
(6-0) Meeting adjourned at 9:22 p.m.
Minutes prepared by Jennifer Markov, Board of Education Clerk.
September 21, 2015 - Page 6

September 21, 2015 - Page 7

WESTON SCHOOL DISTRICT
TRI-STATE CONSULTANCY 2015
Math K-12 | March 11-13, 2015
September 21, 2015 - Page 8
2 Tri-State Consortium Weston School District Consultancy Report
Table of Contents
District Visit Personnel and Information 3
Executive Summary 5
Commendations and Recommendations 16
Evaluation Scores Appendix I
September 21, 2015 - Page 9

3 Tri-State Consortium Weston School District Consultancy Report
WESTON SCHOOL DISTRICT
TRI-STATE CONSULTANCY 2015 Math K-12 | March 11-13, 2015
Mark Secaur – Co-leader Assistant Superintendent Hewlett-Woodmere Hewlett-Woodmere Public Schools One Johnson Place, Woodmere, NY 11598 516-792-4802 [email protected]
Bernie Josefsberg – Co-leader Superintendent Easton-Redding, Region 9 Easton, Redding & Region 9 School Districts 654 Morehouse Road, Easton, CT 06612 203-261-2513 x 101 [email protected]
Kelly Maloney Principal Croton-Harmon Carrie E. Tompkins Elementary School 8 Gerstein Street Croton-on-Hudson, NY 10520 914 271-5184 x3211 [email protected]
Janet Rossi Math, K-12 Supervisor Easton-Redding, Region 9 John Read Middle School 486 Redding Road, Redding, CT 06486 203-938-2533 [email protected]
Darlene Wallin Assistant Principal Easton-Redding, Region 9 Helen Keller Middle School 360 Sport Hill Road, Easton, CT 06612 203-268-8651 [email protected]
John Antonella Dean Fairfield Fairfield Ludlow 785 Unquowa Road, Fairfield, CT 06824 203-255-7223 [email protected]
September 21, 2015 - Page 10

4 Tri-State Consortium Weston School District Consultancy Report
Eileen Roxbee Principal Fairfield Roger Sherman Elementary School 250 Fern Street, Fairfield, CT 06430 203-255-2330 [email protected]
Donald Murphy Supervisor, K-12 Math Hauppauge Hauppauge School District 495 Hoffman Lane, Hauppauge, NY 11788 631-761-8311 [email protected]
Anthony Murray PK-12 Math Chair Hewlett-Woodmere Hewlett-Woodmere Public Schools One Johnson Place, Woodmere, NY 11598 516-792-4802 [email protected]
Tammy Pegrem Math Specialist Hopewell Valley Timberlane Middle School 51 S. Timberlane Drive, Pennington, NJ 08534 609-737-4004 x 1184 [email protected]
David Besancon Teacher Scarsdale Fox Meadow Elementary School 59 Brewster Road, Scarsdale, NY 10583 914-721-2400 x 2720 [email protected]
Daniel Brodsky Elementary General Ed. Teacher Scarsdale Fox Meadow Elementary School 59 Brewster Road, Scarsdale, NY 10583 914-721-2720 [email protected]
Trudy Denton Teacher Westport Staples High School 70 North Ave., Westport, CT 06880 203-341-1889 [email protected]
Dave Scrofani Teacher Westport Staples High School 70 North Avenue, Westport, CT 06880 203-341-1414 [email protected]
Maureen Krawac Math Coach Woodbridge Beecher Road School 40 Beecher Road, Woodbridge, CT 06525 203-389-2195 [email protected]
Jean Molot Math Specialist Woodbridge Beecher Road School 40 Beecher Road, Woodbridge, CT 06525 203-389-2195 [email protected]
TRI-STATE LIAISONS: Kathleen Reilly Director of Training Tri-State Consortium 203-762-2004 [email protected]
Martin G. Brooks Executive Director Tri-State Consortium 631-478-9954 [email protected]
September 21, 2015 - Page 11

5 Tri-State Consortium Weston School District Consultancy Report
Executive Summary
The Weston Public Schools invited a Tri-State visiting team to benchmark the progress of the
district’s current K-12 Math initiative centered on a renewal of professional learning
experiences, math instruction and assessment practices, and the implementation of
performance-based assessments. As the Tri-State Consortium enters its third decade, we
describe our mission as “… a dynamic learning organization of public school districts that
values systems thinking as the foundation for continuous improvement. The Consortium
assists its member districts in using quantitative and qualitative data to enhance student
performance and to build a rigorous framework for planning, assessment and systemic
change. Collaborating as colleagues and critical friends, Consortium members apply the
standards of the Tri-State model to benchmark member districts’ progress in advancing
teaching and learning.” The Tri-State team, composed of elementary, middle, and high school
teachers, and administrators, spent three days, March 11, 12, 13, 2015, examining documents
prepared as evidence of Weston’s Mathematics program. The goal of the Tri-State visit team is
to affirm and confirm the district’s decisions about the current Mathematics program, the
growth of student achievement, and the strength of the professional learning community.
Through the collaborative analysis of student work samples, curriculum documents, district and
building initiatives, representative district publications, and data, both quantitative and
qualitative, the team draws its conclusions about the ongoing and systemic processes in place.
The team seeks to help our member districts further coordinate and systematize the processes
already in place to that are designed to educate the whole child.
The philosophical underpinning of the Tri-State Consortium assessment model is based on
systems thinking; that is, the model focuses on the degree to which there is consistent
alignment with the model’s eight indicators throughout the K-12 system. The extent to which
the district’s evidence is aligned with the Tri-State indicators organizes our thinking and modes
September 21, 2015 - Page 12

6 Tri-State Consortium Weston School District Consultancy Report
of inquiry during our visit. We center our analysis on the district’s current application of the
model in the process of planning, monitoring, and assuring continuous improvement in student
performance.
The team was based in the High School Library. We were welcomed by Superintendent Colleen
Palmer; Assistant Superintendent of Curriculum and Instruction, Ken Craw; building Principals
and Assistant Principals; and district Math Curriculum Instructional Leaders, Caroline Vinton
and Janine Russo. Dr. Palmer described the current curriculum renewal cycle for the K-12 math
program as a “…high priority for our district.” She spoke about the research-based process of
analyzing the newest programmatic resources to support decisions and the professional
development phase to support staff in the process, adding that the district goal is to develop
highly effective problem-solvers.
Assistant Superintendent of Curriculum and Instruction, Ken Craw ‘s presentation guided us
through the district’s “Theory of Action” about K-12 Math Renewal --- a document that links
the theory’s phases to the development of the Essential Questions posed to the team. Dr.
Craw’s impressive document, “Internal Assessment Report”, was in our packets and it most
effectively outlined Weston’s commitment to the AIM (Academic Innovation and
Measurement) initiative and the current status of performance-based assessments. Further,
this report contains detailed descriptors of performance-based assessments, and grade level
rubrics designed to assess existing Cornerstone Projects.
Weston’s Tri-State Steering Committee represented all district levels, and they collaborated to
create the Essential Questions. These questions guide the team’s thinking, analysis, and
conclusions as we move through the visit process:
Essential Question # 1
To what extent are our district’s K-12 professional learning activities influencing teacher
planning and instructional practice to:
Promote greater emphasis on developing a deeper understanding of math concepts
and problem-solving strategies with students.
September 21, 2015 - Page 13
7 Tri-State Consortium Weston School District Consultancy Report
Provide opportunities for student metacognition to enhance their learning through
self and/or peer assessment.
Essential Question # 2
To what extent are our district’s K-12 math instruction and assessment practices enabling us
to:
Become more systemic in our use of pre-assessment, formative, and summative
assessment data to inform and adjust classroom instruction?
Become more systemic in our use of data for providing targeted
intervention/enrichment and for progress monitoring?
Appropriately program and accelerate pathways for learning providing all students
with access to coursework that is personally challenging?
As our commendations make clear, the visiting team encountered substantial evidence that
Weston elementary and secondary math teachers have benefitted from the district’s
commitment to professional learning. Elementary teachers, in particular, spoke enthusiastically
about the support provided to implement the Math in Focus materials. They were explicit
about using these materials as part of a larger shift in their planning and pedagogy that aim at
deep conceptual understanding, problem-solving strategies, and metacognition.
The visiting team was impressed with the district’s ambitious thinking about how student
learning data may be aggregated and disseminated to leverage systemic change in teacher
practice and curricular structures. Our recommendations acknowledge that this aspect of the
math initiative is just beginning to unfold. We applaud the resource commitments made by
district leadership and supported by the Board of Education, and we are confident that the
professional talent and expertise inherent among Weston educators will fuel significant system
growth as the district’s approach deepens.
General Commentary on Commendations
More so than many of their colleagues, math teachers, especially of elementary and middle
school students, contend with many challenges rooted in the Common Core’s impact on their
“subject.” Among other effects, the K-12 Standards reverse course on conceptual spiraling and
re-order topical sequence. Instructional focus necessarily changes as a result, especially in the
September 21, 2015 - Page 14

8 Tri-State Consortium Weston School District Consultancy Report
earlier grades. These changes anticipate improved high school outcomes with more college-
bound students knowing math more deeply.
For the Weston Public Schools, the policy challenge of improved math outcomes overlies the
community’s historical expectation that its high performing schools will benefit all students in
all key academic respects. Recognizing that the external policy challenge requires an adaptive
response, Weston school leaders acted strategically to rework existing instructional
arrangements in math education. Program options were evaluated, choices were made, and
new materials – e.g., Math in Focus -- were introduced moving upward from kindergarten.
Teachers were provided ample support in using those materials and in pivoting their instruction
in keeping with more ambitious learning goals.
As the impact of new instructional method and material works its way upward toward the
middle and high school years, leadership seeks to pivot the system to leverage realized gains
and identify next steps. A wider discussion is envisioned around the following prominent
issues:
1) K-12 teacher access to and facility in using student learning data to plan/adjust
instruction, monitor student progress, and appraise student performance
2) K -5 instructional differentiation
3) 6th grade placement protocols and subsequent effects upon student math attainment
4) Content disparity between identically labeled courses at different grade levels
5) Track disparities within the secondary grades and accompanying teacher/student
selection effects
6) Ongoing adult learning opportunities (PD)
Weston enjoys exceptional material and human assets. Nonetheless assets often do not equate
with results. These arise from a system of forward-thinking governance, strong leadership and
highly skilled teachers. When these assets are blended with motivated students from families
who endow the schools with treasured social capital, there is much for a visiting team to
admire. Such was the case with our encounter with “the Weston Way.”
We were deeply impressed, for example, with what we heard from Weston Board of Education
members serving on the Curriculum Committee. Their history on their board, standing in the
community, and appreciation of what counts most in student learning imbued their responses
to our questions. Uniformly, they discussed changes in math instruction as a means of
September 21, 2015 - Page 15

9 Tri-State Consortium Weston School District Consultancy Report
improving educational opportunity for all students. Further, they emphasized that the sought
“opportunity” had much less to do with standardized outcomes and much more to do with
“genuine and authentic” learning. They acknowledged that Weston parents are not indifferent
to test scores, but they also emphasized their hope that Weston educators could support all
students in learning math deeply in a school context that also emphasizes emotional balance
and civic responsibility.
Similarly, we were impressed by the vision of district leaders to ensure that students are
personally challenged in their math learning and that their teachers are afforded every
opportunity to grow their craft. The Theory of Action accompanying the Essential Questions
makes explicit one aspect of that vision: “Improved Instructional and Performance Assessment
Practices” are declared to be contingent upon district-level action to augment professional
development and widen data use. Such action, in turn, will “strengthen the capacity of our
teachers to meet the needs of all learners.” We concur.
Most school districts know how to organize professional development activities. Knowing how
to prompt more teachers to use learning data to greater effect is less prevalent. The newly
created roles of District Data Coordinator and Director of Digital Learning and Innovation
indicate that Weston appreciates that new routines featuring data use require new supports for
superseding older routines that feature the absence of such use. The acumen and the
enthusiasm of the Data Coordinator especially impressed the visiting team. We have no doubt
that she will meet her target date for integrating disparate data bases into a common platform,
thereby making it easier for her and her colleagues to “crunch the numbers” to good effect. As
she asserted, “We’re on the move [and soon we’ll be able] to talk data the Weston Way!”
Mention must also be made of district leaders’ own use of data to highlight the current results
– both positive and problematic -- of existing arrangements and routines. As Knapp, Copeland
and Swinnerton write, “Data is only useful to the extent that leaders and those who work with
them ask questions that can be answered with the data.” (Data Informed Leadership in
Education, 2006, University of Washington.) We commend district leadership for calling
attention to high rates of student attrition in high school double-accelerated courses and for
believing in the capacity of Weston teachers to better support students through existing and
prospective learning pathways.
Based on K-12 classroom visits as well as on interviews with teachers, students and parents,
leadership faith in teacher efficacy is fully merited. Anecdotal impressions of eager, well-
trained, and committed teachers are supported by student and parent testimony as well as by
faculty demographic data. Fully 51 of 223 district teachers were hired in the past 4 years,
presumably allowing Weston to blend new perspectives with established expertise. Of equal
interest, these teachers are distributed on all steps and across all lanes of the salary guide,
suggesting a conscious intent to match specific talent to specific need. Math curricular
September 21, 2015 - Page 16

10 Tri-State Consortium Weston School District Consultancy Report
leadership – via the work of the two Curriculum Instructional Leaders --- appears to be one of
the beneficiaries of Weston’s hiring philosophy.
We encountered little of the fraught testimony that characterizes how teachers elsewhere
respond to the present moment. In various meetings, Weston teachers expressed confidence
in their efficacy and satisfaction with the support given to shift their math instruction. Even the
recurring request for “more time to learn from each other” can be understood as expressing a
bent to rely upon colleagues to work through common challenges. That confidence resurfaces
in their instruction: teachers are in command of their classrooms and move purposefully
through their lessons.
Students and parents matched the teachers’ pride in their membership in the Weston
community. It may be intangible, but the collective sense of being part of something special is a
genuine asset that Weston educators draw upon to accomplish the work they’ve defined for
themselves.
We endorse the leadership’s understanding of that work as a matter of embedding systemic
processes that forge K-12 connections that are stronger than those now in place. Such
connections support multi-directional information flows that may also be described as the
feedback loops upon which true systems depend. Many school districts everywhere struggle to
define, nurture and anchor these processes, and Weston is no exception. However – and for
the reasons discussed above – Weston has the wherewithal to take that work to the next level.
General Commentary on Recommendations
Many of our recommendations refer, one way or another, to “system building” as in:
Consider a process that brings K-12 teachers together to define, discuss and agree upon an understanding of the concepts of metacognition.
It may be useful to identify some of the defining features of the arrangements in place that
make it challenging to integrate adult effort around student learning – the “bringing together”
aspect of system building.
Weston has a 187 day teacher work year that supports robust professional development
activities. Three percent of the Weston budget – a remarkable statistic --- is dedicated to
curriculum and professional development. Nonetheless, educators face many change demands
beyond math that are chasing the resource of time, the scarcity of which is often cited as one of
the reasons why “change is so difficult.” Complex change – as envisioned in the math initiative
-- adds another layer of difficulty.
September 21, 2015 - Page 17

11 Tri-State Consortium Weston School District Consultancy Report
No one teacher, or for that matter, no one group of teachers, can be expected to work through
the complexities of the change that the math initiative entails. By the same token, no one
teacher – or for that matter no one group of teachers at any grade level --- should be exempted
from the needed whole system response. For this reason, it makes sense to nest the question
of “what must change about math instruction” within the larger question of “what can be
provided to all students throughout their school experience to support deeper learning than is
now the case?” Reframing the question to focus upon “integrated learning supports”
emphasizes the k-12 nature of the work at hand.
Student interviews reinforced certain parent survey comments that not all math instruction
results in all students learning the math lessons at hand. Course attrition rates in the high
school can be understood in this context. These rates highlight the difference between
instructional intention and instructional impact. This is a commonplace disconnect; minimizing
it is a complex challenge.
Learning supports take many different forms, including the necessary, but insufficient, form of
teacher-centered content coverage. Other examples include:
“Compacting” a unit of instruction for particular students based upon the results of a
unit pre-assessment;
Emphasizing particular content or modifying instructional approach based upon a team
analysis of student learning results. The analysis may be qualitative, quantitative, or
both. The results so analyzed may include performance as well as standardized data.
The results may reflect that of a single student or of a class gathered at one specific
point in time. Or, it might reflect data collected from larger populations and assembled
longitudinally;
Minimizing instructional variability through collectively developed assured experiences;
Re-teaching material through extra-help sessions offered in school settings other than
the classroom (a STEM Center, for example);
Flexible within-class or across-class grouping practices;
Vertical feedback loops --- particularly at grade-level transition points – that build upon
existing teacher affiliations (grade level teams, for example) toward a K-12 teaching
community (that in this instance shares the concern of student math learning. “Vertical
articulation” is the common name for this process);
Co-teaching; and
Track reduction and flexible student placement practices.
There are other learning supports that Weston educators surely have used, contemplate using,
or are familiar with. These may be enumerated and applied to particular points along the grade
continuum. Doing so is important work, but not as important as integrating a continuum of
support for students as they move upward through the grades.
September 21, 2015 - Page 18
12 Tri-State Consortium Weston School District Consultancy Report
A collective focus on this work would instill the prospect of a k-12 learning continuum in the
minds of K-12 teachers. Success in doing so would maximize, for example, high school teacher
concern about K-8 learning conditions and arrangements. It would also enable second grade
teachers to better appreciate the impact of their instruction upon the high stakes outcome of
sixth grade math placements. In due time, a continuum of support tied to developmental
needs would be a feature of the system.
Time is indeed a scarce resource that inhibits such system building work. Certainly Weston
teachers are not alone in recognizing (and lamenting) this familiar constraint that can neither
be ignored nor wished away. Its effects often undermine innovation and its diffusion. It
explains why habit is such a durable feature in school cultures and why formalized change
initiatives are so often disappointing.
In this context, Weston might consider how technology can be deployed to support
asynchronous teacher collaboration that interrogates existing practices in the name of building
a system of learning supports. Technology’s power to amass, manipulate, and disseminate data
is already an intrinsic feature of the district’s vision. Technology’s social networking capacity
complements that power. The second Essential Question refers to “instruction and assessment
practices” as an “enabler” of data usage that can assist in “accelerating pathways for learning.”
“Practice” is defined as “the actual application or use of an idea, belief or method as opposed
to theories about such application or use.” In this sense, “practices” are akin to the very habits
that innovation aims to uproot. Technology can be an ally converting “inhibiters” into
“enablers.”
As an adult workplace, school often incentivizes teachers to protect habits upon which the
difficult work of individual teaching relies. Deconstructing individual habit in the name of more
effective collective practice requires re-imagining the work at hand as a community’s handiwork
– as in a community of practitioners. Providing teachers the means of connection ---- the
essence of social networking --- may assist in creating such a community.
Membership in a community of practice -- as opposed to membership in a group that reinforces
shared habits --- encourages teachers to moderate habits that are at odds with the mission-
related goals of deeper understanding, enriched metacognition, and universal personal
challenge that are embedded in the two Essential Questions.
To once again belabor the obvious, Weston leadership is asking much of its math educators.
Content coverage, especially in secondary courses, creates its own set of imperatives as do the
existing protocols associated with student track placement. Insofar as district goals and theories
of action interrogate these imperatives, teachers may seek distance from the efforts required
to do so. Thus, a number of high school teachers in their survey responses distanced
themselves from the math reforms underway in the earlier grades in favor of emphasizing their
own allegedly unmet support needs. Their detachment seemingly contrasts with the
September 21, 2015 - Page 19

13 Tri-State Consortium Weston School District Consultancy Report
enthusiasm that many of the teachers in those earlier grades expressed, and is an important
matter to examine. What supports would the high school teachers want, and how can the
district provide them? Their engagement in the process is critical to systemic success.
Because their prospective participation is critical, ways must be found to induce the high school
to join their colleagues in a singular community of practice. How might this be done? Perhaps
by acknowledging that high school teachers are no less -- nor more -- concerned about their
own particular interests than their elementary and middle school colleagues. Even as teaching
imperatives change as students age through the system, all teachers rely upon their particular
“proven” ways. Indeed, the “enthusiasm gap” between the two groups might be more apparent
than real, masking shared problems of practice.
We also suggest that high school teachers be supported in the development of performance
based assessments, to better match the assessment structures used in the elementary and
middle schools and also to acknowledge the district’s growing interest in deeper conceptual
thinking. Providing time for high school teachers to develop such assessments could be a way of
bringing the system into greater alignment, and engaging teacher voice (and student voice) can
be most helpful in this process.
Consider the attrition rates in accelerated high school math courses, rightly perceived as a
problem --- but not by the high school math teachers for whom those rates validate their
efforts to maintain the integrity of high school course differentiation. For obvious reasons,
attrition rates are not a problem in the elementary grades and for elementary teachers. Unless
one buys the argument that poor preparation in the earlier grades causes high school course
attrition, the attrition rate problem is wrapped in a leadership dilemma: teachers do not seem
to be taking ownership of it.
Both kindergarten and second grade teachers answered the following question in the
affirmative: “Based upon your students’ math performance, do you feel that you can identify
which ones will be taking Calculus BC in high school?” That teachers recognize differences
among their students is not surprising. The further question, however, is the extent to which
their instruction responds to those differences. In other words, to what extent do elementary
teachers differentiate math instruction within their heterogeneous classrooms?
In the absence of sufficient evidence one way or the other, the visiting team has no definitive
answer to that question. But generalizing from other settings, it would be surprising if
differentiated math instruction prevailed over the whole class routines that are baked into an
elementary teacher’s pedagogy. Interviews and observations provide some basis for noting
how readily existing routines assimilate the innovation --- Math in Focus in this instance.
Elementary teachers acknowledge that they supplement Math in Focus with their own, time-
honored materials and pedagogical practices.
September 21, 2015 - Page 20

14 Tri-State Consortium Weston School District Consultancy Report
Navigation through the Scylla of High School Deflection and the Charybdis of Elementary School
Assimilation depends upon the membership of all teachers in a single community of practice
that holds itself responsible for answering the cross-cutting question: what system of
integrated learning supports in math offers the greatest likelihood that each and every student
will acquire deeper conceptual understanding through personally challenging coursework?
Our discussions with teachers, students and parents revealed that high stakes placement
decisions are made about students in the 6th grade, and there is little movement among the
tracks once those decisions have been made. It is important to remember that students
develop at different rates, and that decisions made when students are 11 years of age may not
hold when they reach the high school.
We are convinced that Weston has the wherewithal to foster such a community of practice.
Mention has already been made of using technology to support asynchronous collaboration
among teachers to amplify real-time, face-to-face collaboration. Confronting the empirical
effects of existing practices, structures and arrangements leads teachers to consider the
efficacy of current course tracks and course sequences, placement criteria, within-class
differentiation, performance task and assessment design, school-home communication, et. al.
The learning interests of Weston students certainly will benefit from meaningful teacher
collaboration. But so, too, will the professional interests of teachers by de-mystifying system
issues that are rooted in a lack of understanding of the imperatives shaping teacher work in
other classrooms. For example, both high school math teachers and elementary teachers
wonder about what goes on in middle school math classrooms. But they do so for different
reasons. High school teachers wonder about what hasn’t happened in the middle school years
that explains high school math placement problems. Elementary teachers wonder what
happens to the children they pass upward and into the consequential placement protocols of
6th grade and above. Meaningful collaboration ends the wonder in favor of shared
understanding and shared ownership of better outcomes.
Vertical alignment is an area ripe for attention. The three transition points for students (2nd to
3rd grade, 5th to 6th grade, and 8th to 9th grade) are acknowledged as being problematic for some
students. What needs to be done to improve school-to-school alignment? We suggest this is a
question for the faculties in the sending and receiving grades.
We also wondered about course alignment. For example, geometry is offered in the middle
school and the high school. Yet, the materials used in the courses are different. We are not
calling for standardization, but we are asking if the district is comfortable with this disparity.
In summary, make it possible for the stewards of the system – the teachers --- to examine the
system, consider its results, and refine its operations.
September 21, 2015 - Page 21

15 Tri-State Consortium Weston School District Consultancy Report
The Weston Public Schools are well positioned to attain its highest aspirations. Throughout our
visit, the human resources -- the caliber of the educators, the enthusiasm of the students, the
value that parents place on learning – impressed us as second to none. When fully marshaled,
these resources will move forward the “Weston Way.”
Finally, our thanks to the High School librarians for sharing their space; it was the ideal base for
us, and we appreciated the generosity of everyone in each building we visited. Teachers and
administrators are dedicated to their students, eager to participate in initiatives that identify
methods leading to deeper understanding and learning. We were delighted with Chef Maria’s
special attention to our meals, her most inviting food presentations and, of course, the snacks!
September 21, 2015 - Page 22

16 Tri-State Consortium Weston School District Consultancy Report
Commendations and Recommendations
Indicator #1: Performance Based Assessment
Commendations:
There is consistent evidence of the use of performance based assessments to achieve k-12 learning outcomes described in the Academic Innovation and Measurement matrix of learning outcomes presented to the Board of Education on February 24th, 2015.
The district has established Cornerstone interdisciplinary projects in grades 2, 5 and 8. These projects emphasized the process and product of learning and will be used to measure student growth as they progress through the school system.
There is notable evidence of common language around the use of performance based assessments throughout the district.
Recommendations:
Consider establishing a more systemic utilization of performance based assessments by offering professional development that provides training in their composition.
Expand the practice of evaluating student work based on common criteria and analyzing the results over time to inform curriculum and instruction.
Continue developing a process to collect and measure evidence of improved student
learning linked to the use of performance based assessments.
Consider ways to engage high school math teachers in the development of more performance-based assessments.
September 21, 2015 - Page 23

17 Tri-State Consortium Weston School District Consultancy Report
Indicator #2: Student Metacognition in the Learning Process
Commendations:
Throughout the district there is evidence that teachers have discussed and engaged students in opportunities that require them to think about their thinking in mathematics. Students are comfortable explaining how they accomplished a task and justifying their answers.
The choice of Math In Focus as the foundation of mathematics instruction in K-8 reflects a commitment to a student learning environment that encourages engagement, reflection and metacognition.
Recommendations:
Consider a process that brings K-12 teachers together to define, discuss and agree upon a common understanding of metacognition.
Consider a process to decide what shared metacognitive expectations are in place, K-12. This information should lead to systemic and consistent practices that can be seamlessly implemented.
Consider curriculum writing that provides students with active instruction devoted to
the transition from thinking about how to accomplish a task, to why it is important, and to what extent they are successful.
September 21, 2015 - Page 24

18 Tri-State Consortium Weston School District Consultancy Report
Indicator #3: Student Performance Data
Commendations:
The district’s students perform well on all assessments, and the district conducts longitudinal analyses of trends, utilizing multiple data sources.
The district collects a large amount of data pertaining to student performance on
assessments, and provides time for teachers to review and analyze the data.
The district has developed rubrics for cornerstone projects to benchmark student progress and provide detailed feedback to the students and their parents.
Recommendations:
Consider engaging the faculty’s voice in determining what forms of data are important for the district to examine in order to understand students’ strengths and needs.
Determine “next steps” for the most effective use of the data analyst and director
of digital learning. These may include a cross-walk among the data sources (NWEA, SBAC, Iowa’s, PSATs, SATs, ACTs, APs, etc.) to determine synchrony in the district’s data points.
Consider a process to measure student growth other than standard scores, especially K -2, in light of the current work on standards based report cards
September 21, 2015 - Page 25
19 Tri-State Consortium Weston School District Consultancy Report
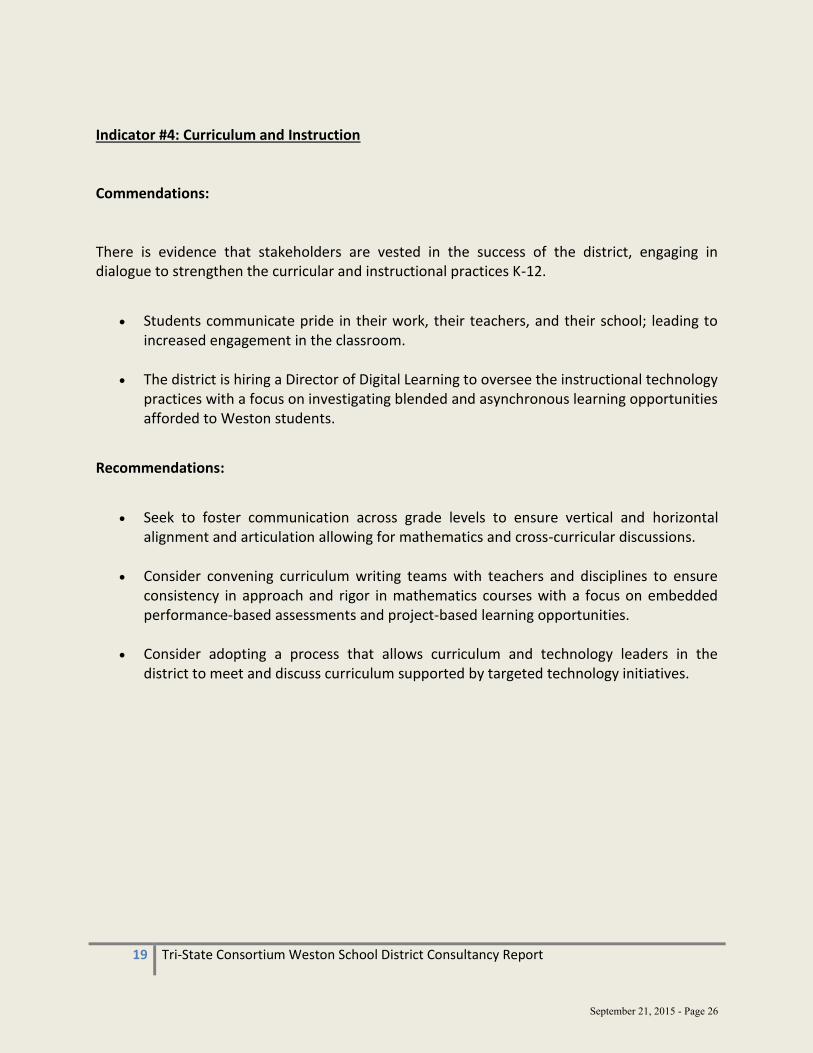
Indicator #4: Curriculum and Instruction
Commendations:
There is evidence that stakeholders are vested in the success of the district, engaging in dialogue to strengthen the curricular and instructional practices K-12.
Students communicate pride in their work, their teachers, and their school; leading to
increased engagement in the classroom.
The district is hiring a Director of Digital Learning to oversee the instructional technology practices with a focus on investigating blended and asynchronous learning opportunities afforded to Weston students.
Recommendations:
Seek to foster communication across grade levels to ensure vertical and horizontal
alignment and articulation allowing for mathematics and cross-curricular discussions.
Consider convening curriculum writing teams with teachers and disciplines to ensure consistency in approach and rigor in mathematics courses with a focus on embedded performance-based assessments and project-based learning opportunities.
Consider adopting a process that allows curriculum and technology leaders in the district to meet and discuss curriculum supported by targeted technology initiatives.
September 21, 2015 - Page 26
20 Tri-State Consortium Weston School District Consultancy Report
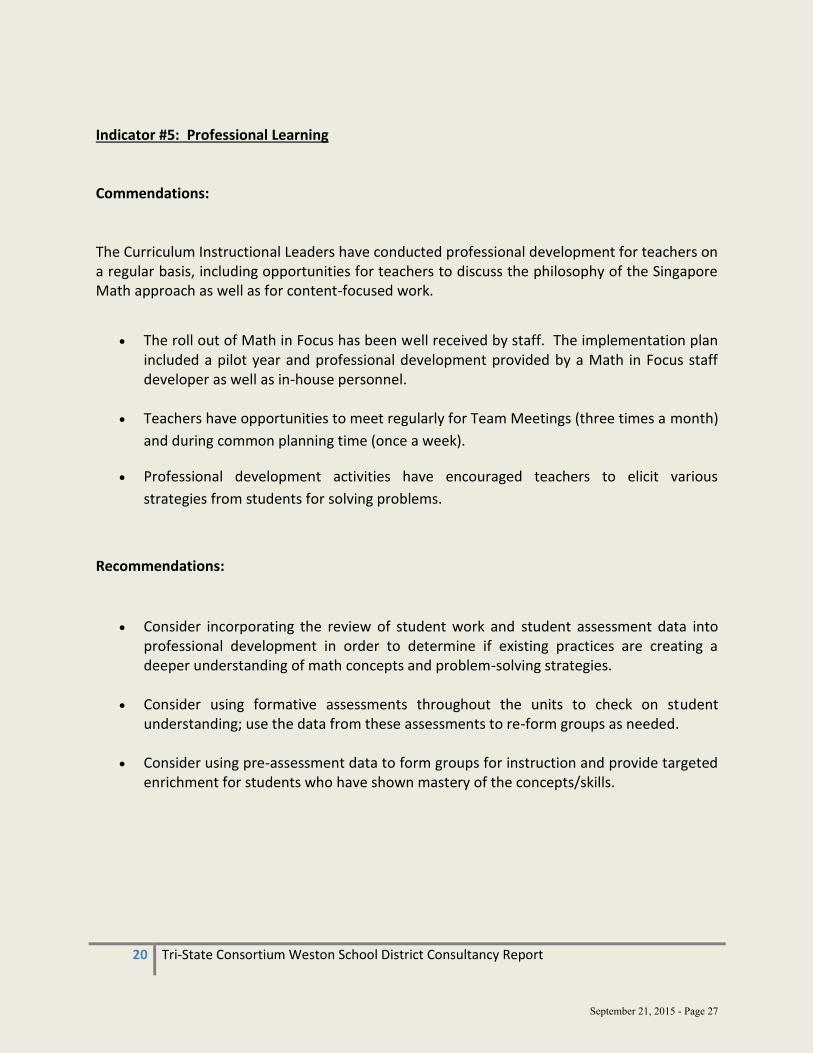
Indicator #5: Professional Learning
Commendations:
The Curriculum Instructional Leaders have conducted professional development for teachers on a regular basis, including opportunities for teachers to discuss the philosophy of the Singapore Math approach as well as for content-focused work.
The roll out of Math in Focus has been well received by staff. The implementation plan
included a pilot year and professional development provided by a Math in Focus staff developer as well as in-house personnel.
Teachers have opportunities to meet regularly for Team Meetings (three times a month)
and during common planning time (once a week).
Professional development activities have encouraged teachers to elicit various
strategies from students for solving problems.
Recommendations:
Consider incorporating the review of student work and student assessment data into professional development in order to determine if existing practices are creating a deeper understanding of math concepts and problem-solving strategies.
Consider using formative assessments throughout the units to check on student understanding; use the data from these assessments to re-form groups as needed.
Consider using pre-assessment data to form groups for instruction and provide targeted
enrichment for students who have shown mastery of the concepts/skills.
September 21, 2015 - Page 27

21 Tri-State Consortium Weston School District Consultancy Report
Indicator #6: Equitable Support for Student Needs
Commendations:
There is a K-5 math SRBI plan for identifying students’ academic needs from a variety of sources that is systemic and periodically reviewed and revised.
There are systems in place to ensure that information is easily disseminated and time is provided for colleagues to engage one another in discussion and planning.
Recommendations:
Consider setting expectations for common planning time so that it can be used, in part,
to analyze grade level data so teachers are able to differentiate instruction and align
student outcomes with the goals of the program.
Consider designing professional development opportunities for reflection upon
instructional strategies that satisfy the educational needs of diverse learners.
Examine existing supports and identify new methods of support to assist students as they seek to maintain their path of mathematics study.
Consider ways to permit students to move up to more challenging work as they become more confident mathematicians.
September 21, 2015 - Page 28

22 Tri-State Consortium Weston School District Consultancy Report
Indicator # 7: Shared Vision and Environment for Change
Commendations:
There appears to have been a concerted effort to thoughtfully introduce Singapore math through Math in Focus by utilizing such resources as Dr. Yeap Ban Hur and by providing ongoing professional development. Teachers expressed comfort in this method of instruction and student learning.
A high level of cooperation and collegiality was observed among teachers in the district
including the sharing of ideas, lessons, and mathematics teaching strategies. This positive culture is reflected in students’ attitudes toward their mathematics instruction.
Mathematics teachers are collecting data and giving common summative assessments in similar classes/levels.
Recommendations:
Consider the design and adoption of a vertical team (K-12) charged with defining a well-articulated K-12 mathematics vision that encompasses mathematics at the high school.
Consider engaging the mathematics department at the high school in curricular evaluation in order to provide continuity in implementing the Math in Focus district philosophy and vision.
Consider expanding upon the foundational work of data collection by utilizing a district-
wide database and forming data analysis teams. This will allow teachers to implement the vision of using performance data to inform instruction.
Consider ways to include student voice in the development and expansion of the district
vision.
September 21, 2015 - Page 29

23 Tri-State Consortium Weston School District Consultancy Report
Indicator #8: Parent and Community Support
Commendation:
There is considerable and impressive evidence of the district’s outreach to the community, particularly connected to the selection, implementation and professional learning of Math in Focus.
The Weston Education Foundation describes its mission “…to coordinate and support
initiatives that cultivate meaningful learning experiences for our community.” Direct grants are awarded to individual teachers and administrators.
The Internal Assessment Report developed by Assistant Superintendent Kenneth Craw,
details the implementation of district performance assessments and the current status of the AIM initiative. The curricular focus to develop and integrate authentic assessments that reflect creative and critical thinking strategies is evident in the district-developed “Characteristics’ chart that breaks down the specific elements, and the rubrics for Cornerstone Projects are included.
The budget strongly aligns with and supports the stated mission and aspirations of the
district. There are scheduled public BOE sessions that outline the allocation of funds by department across the district; comprehensive documents are available that describe emerging trends and issues that affect the budget allotment.
Parents interviewed confirmed the consistent, timely two-way communication with teachers across all grade levels. Teachers maintain individual websites that contain daily information as well as links to research-based resources for students and parents.
Recommendations:
Continue to involve parents in experiences that will deepen their understanding of and facility with Math in Focus as students transition to the Middle and High Schools. Interviews with parents reflect their desire to be involved in the process.
September 21, 2015 - Page 30

24 Tri-State Consortium Weston School District Consultancy Report
Parent surveys, completed in advance of the Tri-State visit, describe a range of experiences and concerns about the consistency of instruction in the upper grades. Close reading of the narrative responses may uncover areas that need clarification.
Continue to tap into the parent resources inherent in the district population. Opportunities to involve parents such as the Engineer and Math seminar create a natural extension of student learning.
September 21, 2015 - Page 31

1– Appendix I
Appendix I: Evaluation Scores
Performance-based Assessment
Student Performance – Indicator # 1 Educators utilize performance-based assessments that enable students to demonstrate their capacity to transfer and apply knowledge. These assessments demonstrate the degree to which students integrate knowledge, skills, and higher-level thinking both within and across disciplines. Student work is evaluated based on common criteria, and results are analyzed and used over time to inform curriculum and instruction.
Approach Implementation Results
There is no process evident.
There is no evidence of implementation.
There is no evidence of results.
There is a foundational process to use performance-based assessments that enable students to demonstrate, transfer and apply knowledge, skills and higher level thinking within and across disciplines. Student work is evaluated based on common criteria.
Evidence of a foundational process to create and use performance-based assessments.
Evidence that the foundational process enables students to demonstrate, transfer and apply knowledge, skills and higher level thinking.
Evidence that the foundational process includes evaluation of student work based on common criteria.
Individual educators use performance-based assessments that enable students to demonstrate, transfer and apply knowledge, skills, and higher level thinking within and across disciplines. Some educators evaluate student work based on common criteria.
Evidence that individual educators use performance-based assessments that meet established design criteria.
Evidence that these assessments enable students to demonstrate, transfer and apply knowledge, skills and higher level thinking within and across disciplines.
Evidence that individual educators evaluate student work based on common criteria.
Some improvement in student learning is related (in part) to the use of performance assessments that are evaluated based on common criteria.
Evidence of improved student learning linked (in part) to the use of performance-based assessments.
Evidence of improved student learning linked (in part) to evaluation based on common criteria.
September 21, 2015 - Page 32

2– Appendix I
Performance-based Assessment Student Performance – Indicator # 1 (continued)
Approach Implementation Results
There is a systematic process for the use of performance-based assessments that enable students to demonstrate their capacity to transfer and apply knowledge, skills and higher level thinking within and across disciplines. Student work is evaluated based on common criteria.
Evidence that a common understanding of performance-based assessments exists within the district.
Evidence of a systematic process to use performance-based assessments that enable students to demonstrate, transfer and apply knowledge, skills and higher level thinking both within and across disciplines.
Evidence of a systematic plan to evaluate student work using common criteria.
Many educators use a variety of performance-based assessments that enable students to demonstrate their capacity to transfer and apply knowledge, skills and higher level thinking within and across disciplines. Many educators evaluate student work based on common criteria.
Evidence that up to half (50 %) of educators are using performance-based assessments that enable students to transfer and apply knowledge, skills, and higher level thinking within and across disciplines.
Measurable improvement in student learning related (in part) to the use of performance assessments that enable students to demonstrate their capacity to transfer and apply knowledge, skills and higher level thinking within and across disciplines.
Evidence of measurable improvement in student learning linked (in part) to the use of performance-based assessments.
Evidence of measurable student improvement linked to the analysis of performance-based assessment results, using common criteria
There is a systemic process for the use of performance-based assessments that enable students to demonstrate their capacity to transfer and apply knowledge, skills and higher level thinking within and across disciplines. Student work is evaluated on common based on common criteria and results are analyzed and used over time to inform curriculum and instruction decisions.
Evidence of a systemic process to use performance-based assessments that enable students to demonstrate, transfer and apply knowledge, skills and higher level thinking within and across disciplines.
Evidence that student work is evaluated based on common criteria.
Evidence of a plan to analyze results over time to inform curriculum and instruction decisions.
Most educators use performance-based assessments that enable students to demonstrate their capacity to transfer and apply knowledge, skills and higher level thinking within and across disciplines. Most educators use common criteria to evaluate student work, and analyze results to inform curriculum and instruction decisions.
Evidence that up to 75% of educators use performance-based assessments that enable students to demonstrate the capacity to transfer and apply knowledge, skills and higher level thinking within an across disciplines.
Evidence that this information is used to inform decisions about curriculum and instruction.
Significant improvement in student learning is sustained over time and related (in part) to the use of performance-based assessments that enable students to demonstrate their capacity to transfer and apply knowledge, skills, and higher level thinking within and across disciplines.
Evidence of significant improvement in student learning linked (in part) to the use of performance-based assessments.
Evidence of significant improvement in student learning linked in part to the capacity to transfer and apply knowledge, skills and higher level thinking within and across disciplines.
Evidence that significant improvement in student learning is sustained over time.
September 21, 2015 - Page 33

3– Appendix I
Performance-based Assessment Student Performance – Indicator # 1 (continued)
Approach Implementation Results
There is a systemic, district-wide process for the use of performance-based assessments to enable students to demonstrate their capacity to transfer and apply knowledge, skills and higher level thinking within and across disciplines. Student work is evaluated based on common criteria and results are analyzed and used over time to inform curriculum and instruction. The process is reviewed and revised periodically based on current research and district analysis of performance-based assessments.
Evidence of a systemic, district-wide process to use performance-based assessments.
Evidence that the process is reviewed and refined periodically, based on current research and district analysis of performance-based assessments.
All educators systematically use performance-based assessments that enable students to demonstrate their capacity to transfer and apply knowledge, skills, and higher level thinking within and across disciplines. All educators evaluate student work based on common criteria, and analyze student results to inform curriculum and instruction decisions.
Evidence that all educators are using performance-based assessments that enable students to demonstrate their capacity to transfer and apply knowledge, skills and higher level thinking within and across disciplines.
Evidence that all educators evaluate that student work based on common criteria.
Evidence that all educators analyze student results to inform curriculum and instruction decisions.
Significant improvement in student learning sustained over time is related to the use of performance-based assessments that enable students to demonstrate their capacity of transfer and apply knowledge, skills and higher level thinking. Improved student performance is attributable to the use of common criteria and analysis of results, and supported by local, regional and national measures of excellence.
Evidence of improved student learning linked to the use of performance assessments.
Evidence of how that improvement is measured using local, regional and national measures of excellence.
Evidence that the improvement is sustained over time.
September 21, 2015 - Page 34

4– Appendix I
Student Metacognition in the Learning Process Student Performance – Indicator #2
Educators design and implement a learning environment that enables students to engage in metacognition continuously and systematically. As a result, students build the capacity over time to assess, reflect upon and make choices that advance their own learning.
Approach Implementation Results
There is no process evident.
There is no evidence of implementation.
There is no evidence of results.
There is a foundational process to design a learning environment that enables students to engage in metacognition.
Evidence of a foundational process to design a learning environment that enables students to engage in metacognition.
Individual educators design and intentionally implement a learning environment that enables students to engage in metacognition.
Evidence that individual educators design and implement a learning environment that enables students to engage in metacognition.
Evidence that individual educators provide some opportunities for students to make choices about their learning.
Some improvement in student performance is attributable (in part) to the design and implementation of a learning environment that enables students to engage in metacognition.
Evidence of improved learning and student performance linked (in part) to a learning environment that enables students to engage in metacognition.
There is a systematic process to design a learning environment that enables students to engage in metacognition continuously and systematically. This process includes student reflection, choice and self-assessment.
Evidence that a common understanding of metacognition exists within the district.
Evidence of a systematic process that enables students to engage in metacognition.
Evidence that the process includes student reflection, choice, and self-assessment
Many educators design and implement a learning environment that enables students to engage in metacognition systematically. Many educators provide opportunities for student reflection, choice, and self-assessment.
Evidence that up to half (50%) of educators design and implement a learning environment that enables students to engage in metacognition continuously and systematically.
Evidence that up to half (50%) of educators provide opportunities for student reflection, choice, and self-assessment.
Evidence that up to half (50%) of educators inform instruction based upon students’ reflections, self-assessment and choice.
Measurable improvement in student performance is attributable (in part) to the design and implementation of a learning environment that enables students to engage in metacognition systematically.
Evidence of measurable improvement in student learning and performance linked (in part) to a learning environment that enables students to engage in metacognition continuously and systematically.
Evidence of measurable improvement in student learning and performance linked (in part) to a learning environment that provides opportunities for reflection, choice, and self-assessment.
September 21, 2015 - Page 35

5– Appendix I
Student Metacognition in the Learning Process Student Performance – Indicator #2 (continued)
Approach Implementation Results There is a systemic process that enables students to engage in metacognition continuously and systematically. The learning environment is designed to enable students to build the capacity to assess and reflect upon their learning and make choices that advance their learning.
Evidence of a systemic process that enables students to engage in metacognition continuously and systemically.
Evidence of a systemic process to design a learning environment that enables students to build the capacity to assess and reflect upon their learning and make choices that advance their learning.
Most educators design and implement a learning environment that enables students to engage in metacognition continuously and systematically. Educators enable students to build the capacity to assess, reflect upon their learning, and make choices that advance their learning.
Evidence that up to 75% of educators design and implement a learning environment that enables students to engage in metacognition continuously and systemically.
Evidence that up to 75% of educators enable students to build the capacity to assess and reflect upon their learning, and make choices that advance their learning.
Students’ capacity to assess, reflect upon and make choices that advance their learning is attributable (in part) to the design and implementation of a learning environment that enables them to engage in metacognition continuously and systematically. Significant improvement in student performance is sustained over time.
Evidence of significant improvement in student learning and performance resulting (in part) from continuous and systemic engagement in metacognition.
Evidence of significant improvement in student learning and performance linked (in part) to their capacity to assess, reflect upon and make choices that advance their learning.
Evidence of significant improvement in student learning and performance being sustained over time.
There is a systemic, district-wide process that enables students to engage in metacognition continuously and systematically. The design of the learning environment enables students to build the capacity to assess, reflect upon and make choices that advance their learning. The process is reviewed and revised, periodically, based on current research and district analysis of student metacognition data.
Evidence of a systemic, district-wide process that enables students to engage in metacognition continuously and systemically.
Evidence that the design of the learning environment enables teachers to make instructional choices based upon student metacognitive data.
Evidence that the process is reviewed and revised, periodically, based on current research and analysis of student metacognition data.
All educators design and implement a learning environment that enables students to engage in metacognition, continuously and systematically. All educators enable students to build the capacity to assess and reflect upon their learning, and make choices that advance their learning.
Evidence that all educators design and implement a learning environment that enables students to engage in metacognition continuously and systemically.
Evidence that the learning environment enables students to build the capacity to assess, reflect upon and make choices that advance their learning.
Evidence that educators adjust instruction based upon the analysis of student metacognition data.
Significant improvement in student performance, sustained over time, is attributable to the design and implementation of a learning environment that enables them to engage in metacognition continuously and systematically. Students build the capacity to assess, reflect upon and make choices that advance their learning.
Evidence of significant improvement in student learning and performance resulting from continuous and systemic engagement in metacognition.
Evidence of significant improvement in student learning and performance resulting from the capacity to assess and reflect upon their learning, and make choices that advance their learning.
Evidence of how that improvement is measured against local and national measures of excellence.
September 21, 2015 - Page 36
6– Appendix I
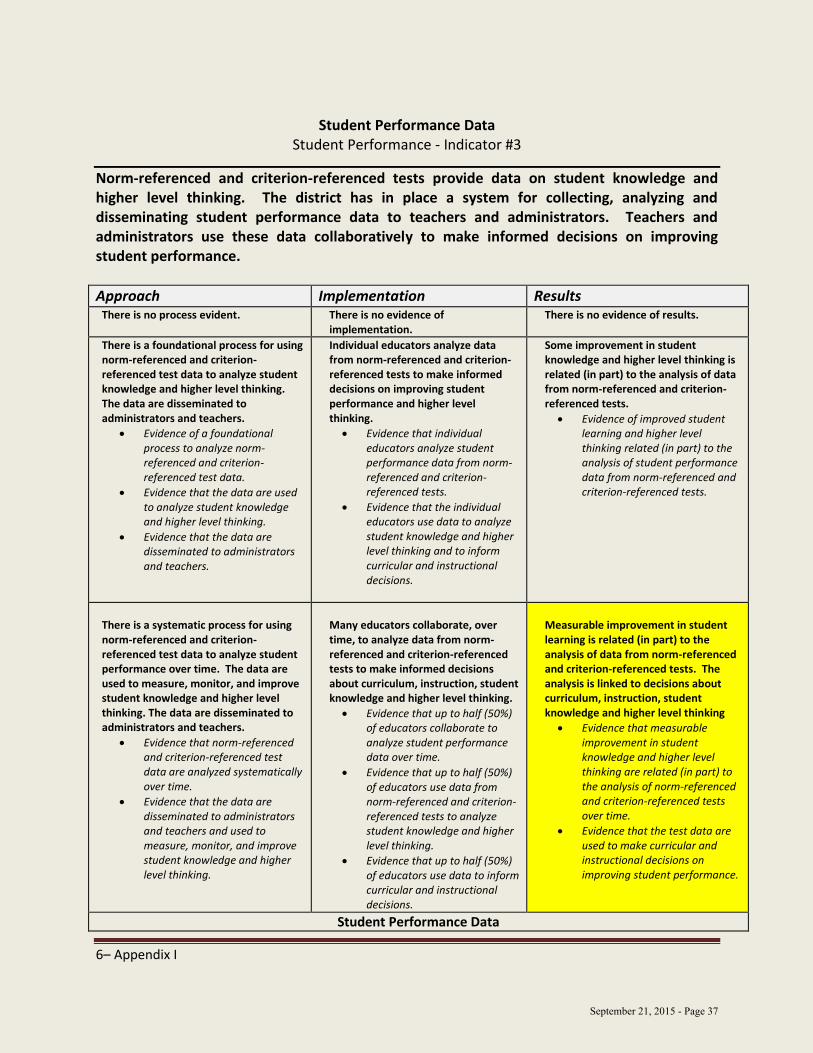
Student Performance Data
Student Performance - Indicator #3
Norm-referenced and criterion-referenced tests provide data on student knowledge and higher level thinking. The district has in place a system for collecting, analyzing and disseminating student performance data to teachers and administrators. Teachers and administrators use these data collaboratively to make informed decisions on improving student performance.
Approach Implementation Results There is no process evident.
There is no evidence of implementation.
There is no evidence of results.
There is a foundational process for using norm-referenced and criterion-referenced test data to analyze student knowledge and higher level thinking. The data are disseminated to administrators and teachers.
Evidence of a foundational process to analyze norm- referenced and criterion- referenced test data.
Evidence that the data are used to analyze student knowledge and higher level thinking.
Evidence that the data are disseminated to administrators and teachers.
Individual educators analyze data from norm-referenced and criterion-referenced tests to make informed decisions on improving student performance and higher level thinking.
Evidence that individual educators analyze student performance data from norm-referenced and criterion-referenced tests.
Evidence that the individual educators use data to analyze student knowledge and higher level thinking and to inform curricular and instructional decisions.
Some improvement in student knowledge and higher level thinking is related (in part) to the analysis of data from norm-referenced and criterion-referenced tests.
Evidence of improved student learning and higher level thinking related (in part) to the analysis of student performance data from norm-referenced and criterion-referenced tests.
There is a systematic process for using norm-referenced and criterion-referenced test data to analyze student performance over time. The data are used to measure, monitor, and improve student knowledge and higher level thinking. The data are disseminated to administrators and teachers.
Evidence that norm-referenced and criterion-referenced test data are analyzed systematically over time.
Evidence that the data are disseminated to administrators and teachers and used to measure, monitor, and improve student knowledge and higher level thinking.
Many educators collaborate, over time, to analyze data from norm-referenced and criterion-referenced tests to make informed decisions about curriculum, instruction, student knowledge and higher level thinking.
Evidence that up to half (50%) of educators collaborate to analyze student performance data over time.
Evidence that up to half (50%) of educators use data from norm-referenced and criterion-referenced tests to analyze student knowledge and higher level thinking.
Evidence that up to half (50%) of educators use data to inform curricular and instructional decisions.
Measurable improvement in student learning is related (in part) to the analysis of data from norm-referenced and criterion-referenced tests. The analysis is linked to decisions about curriculum, instruction, student knowledge and higher level thinking
Evidence that measurable improvement in student knowledge and higher level thinking are related (in part) to the analysis of norm-referenced and criterion-referenced tests over time.
Evidence that the test data are used to make curricular and instructional decisions on improving student performance.
Student Performance Data
September 21, 2015 - Page 37

7– Appendix I
Student Performance—Indicator #3 (continued)
Approach Implementation Results
There is a systemic process for using norm-referenced and criterion-referenced test data to monitor student performance over time and to disaggregate data from norm-referenced and criterion referenced tests. The data are used to improve the learning environment, student knowledge, and higher level thinking. The data are disseminated, systemically, to administrators and teachers.
Evidence of a systemic process to analyze student performance data from norm-referenced and criterion-referenced tests.
Evidence that test data are disaggregated and analyzed over time.
Evidence that the data analysis is linked to the learning environment, student knowledge, and higher level thinking.
Evidence of a systemic process to disseminate data to administrators and teachers.
Most educators collaborate to disaggregate and analyze data from norm-referenced and criterion-referenced tests over time as part of a sustained effort to make informed decisions about curriculum, instruction, student knowledge and higher level thinking.
Evidence that up to 75% of educators collaborate to disaggregate and analyze norm-referenced and criterion-referenced test data over time.
Evidence that up to 75% of educators use data analysis in a sustained effort to make informed curricular and instructional decisions.
Significant improvement in student learning sustained over time is related (in part) to the use and analysis of student performance data from norm-referenced and criterion-referenced tests and other forms of assessment.
Evidence of significant improvement in student learning related (in part) to the analysis of tests and student performance data over time.
Evidence that improvement is measured using multiple forms of assessment data.
Evidence that the improvement in student learning is sustained over time.
There is a systemic, district-wide process that integrates and monitors student performance data from multiple assessments over time. The disseminated data are used to improve the learning environment, student learning, and higher level thinking through formal cycles of review and revision based on current research.
Evidence of a systemic, district-wide process that integrates and monitors student performance data into the teaching and learning cycle.
Evidence of data analysis and disaggregation of student performance from multiple assessments over time. Evidence that the process is reviewed and refined based on current research.
All educators collaborate to disaggregate and analyze student performance data from multiple sources over time. All educators are involved in a sustained effort to make informed decisions about curriculum and instruction across grades and subject areas.
Evidence that all educators collaborate to disaggregate and analyze student performance data over time.
Evidence that all educators use data from multiple sources to analyze student performance and to inform curriculum and instruction across grades and subject levels.
Evidence that the use of data is part of a sustained effort to improve curriculum, instruction, and student performance through formal cycles of evaluation.
Significant improvement in student learning is sustained over time and related to the use and analysis of student performance data. Student performance is benchmarked against local, regional, and national measures of performance.
Evidence of significant improvement in student learning related to the sustained analysis of tests and performance data over time.
Evidence of how that improvement is measured using local, regional, and national benchmarks.
September 21, 2015 - Page 38

8– Appendix I
Curriculum and Instruction
Internal Support – Indicator # 4 Teachers and administrators collaborate and develop an articulated and aligned curriculum that ensures optimal student results. Assessment data from multiple sources are analyzed by teachers and administrators when making curricular and instructional decisions. In their planning, teachers purposefully select from a variety of teaching techniques and tools to help students improve and they differentiate curriculum and instruction to address all students’ learning needs.
Approach Implementation Results There is no process evident.
There is no evidence of implementation.
There is no evidence of results.
There is a foundational process for educators to collaborate in developing, articulating, and aligning curriculum and instruction, K-12. Educators analyze student assessment data from multiple sources and select from a variety of teaching materials and instructional strategies that ensure optimal student results.
Evidence of a foundational process for educators to collaborate to develop, articulate, and align curriculum and instruction, K-12.
Evidence of a foundational process to link data analysis to decisions about teaching materials and instructional strategies that ensure optimal student results.
Evidence of a foundational process of differentiating instruction to address the learning needs of all students.
Individual educators collect and analyze student assessment data from multiple sources and collaborate to develop, articulate, and align curriculum and instruction, K-12. Data are used to select appropriate teaching materials and instructional strategies that support differentiation, and to make curricular and instructional decisions to ensure optimal student results.
Evidence that individual educators collect and analyze student assessment data from multiple sources.
Evidence that individual educators collaborate to develop, articulate, and align curriculum and instruction, K-12.
Evidence that individual educators differentiate curriculum and instruction to address the learning needs of all students.
Evidence that individual educators analyze data to select appropriate teaching materials and instructional strategies that ensure optimal student results.
Some improvement in student learning is related (in part) to the link between educators’ collaboration and analysis of multiple forms of student assessment data to make curricular and instructional decisions, K-12.
Evidence of improved student learning related (in part) to educators’ analysis of multiple forms of student assessment data.
Evidence of improved student learning linked (in part) to curricular and instructional decisions that ensure optimal student results.
September 21, 2015 - Page 39

9– Appendix I
Curriculum and Instruction Internal Support – Indicator # 4 (continued)
Approach Implementation Results There is a systematic process used for educators to collaborate in developing, articulating, and aligning curriculum and instruction, K-12. Educators collaborate to collect and analyze multiple forms of data to ensure optimal student results and to make curricular and instructional decisions.
Evidence that a common understanding of differentiated instruction exists within the district.
Evidence of a systematic process to collect and analyze student performance data from multiple sources.
Evidence of a systematic process to link student performance data to decisions about teaching materials and instructional strategies to ensure optimal student results.
Evidence of designated standards used to guide analysis of student assessment data.
Evidence of systematic differentiation of instruction to address the learning needs of all students.
Many educators systematically collect and analyze student assessment data from multiple sources and collaborate to develop, articulate, and align curriculum and instruction, K-12. Educators purposefully select teaching materials and instructional strategies that differentiate to ensure optimal student results.
Evidence that up to half (50%) of educators collaborate to develop, articulate and align curriculum and instruction, K-12.
Evidence that up to half (50%) of educators collect and analyze student assessment data from multiple sources to make curricular and instructional decisions.
Evidence of designated standards used to guide the analysis of student assessment data.
Evidence that educators use the data to purposefully select teaching materials and instructional strategies that differentiate to ensure optimal student results.
Measurable improvement in student learning is related (in part) to the link between a clearly developed, articulated, and aligned curriculum and the systematic use of data analysis from multiple sources to ensure optimal student results.
Evidence of measurable improvement in student learning related (in part) to educators’ use of assessment data to make curricular and instructional decisions.
Evidence of designated standards used to guide the analysis of student assessment data, and to differentiate instruction that ensures optimal student results.
September 21, 2015 - Page 40

10– Appendix I
Curriculum and Instruction Internal Support – Indicator # 4 (continued)
Approach Implementation Results
There is a systemic process for educators to collaborate to develop, articulate, and align curriculum and instruction, K-12. This process is directly linked to the analysis of multiple forms of student assessment data when making curriculum and instruction decisions to ensure optimal student results.
Evidence of a systemic process for educators to collaborate to develop, articulate and align curriculum and instruction, K-12.
Evidence that the systemic process is linked to curriculum and instruction decisions to ensure optimal student results.
Evidence of a cycle to review and refine designated standards to guide the analysis of student assessment data.
Evidence of systemic differentiation of instruction to address the learning needs of all students.
Most educators collaborate in the systemic analysis of student assessment data from multiple sources and to plan, develop, articulate, and align curriculum and instruction, K-12. Student performance data analysis is used to plan, implement, and review curriculum and instruction decisions and to select teaching materials and instructional strategies that ensure optimal student results.
Evidence that up to 75% of educators collaborate in the systemic analysis of student assessment data from multiple sources.
Evidence that the collaboration extends across grade levels and content areas.
Evidence that up to 75% of educators use data to select appropriate teaching materials and instructional strategies to differentiate and ensure optimal student results.
Evidence that the designated standards used to guide analysis of student assessment data are reviewed.
Significant improvement in student learning is sustained over time and related (in part) to the link between the systemic, collaborative analysis of student assessment data and optimal student results.
Evidence that significant improvement in student learning is linked (in part) to curriculum and instruction decisions that ensure optimal student results.
Evidence that significant improvement in student learning is sustained over time and is linked (in part) to the systemic analysis of multiple sources of assessment data.
There is a systemic, district-wide process for educators to collaborate in the ongoing planning, development, articulation and alignment of curriculum and instruction, K-12. The systemic, district-wide analysis of student assessment data from multiple sources is directly linked to decisions about teaching materials and instructional strategies. The process is continually monitored and improved based on a formal cycle of review, shared experience, current research, new knowledge and feedback from multiple sources.
Evidence of a systemic, district-wide process for educators to collaborate to plan, develop, articulate and align curriculum and instruction, K-12.
All educators collaborate with colleagues across grade and content levels in the systemic analysis of multiple forms of student assessment data. All educators use student performance data to purposefully plan and select appropriate teaching materials and instructional strategies that differentiate to ensure optimal student results
Evidence that all educators collaborate across grade levels and content areas to collect, analyze, and review multiple forms of student assessment data.
Evidence that all educators plan and select teaching materials and instructional.
Significant improvement in student learning is sustained over time and consistent with local, national and international standards of excellence. Improved student achievement results are related to systemic, district-wide developed, articulated, and aligned curriculum, instruction, and data analysis from multiple sources.
Evidence of significantly improved student learning related to a planned, developed, articulated and aligned curriculum that is systemic and district-wide, and ensures optimal student results.
Evidence that improved
September 21, 2015 - Page 41
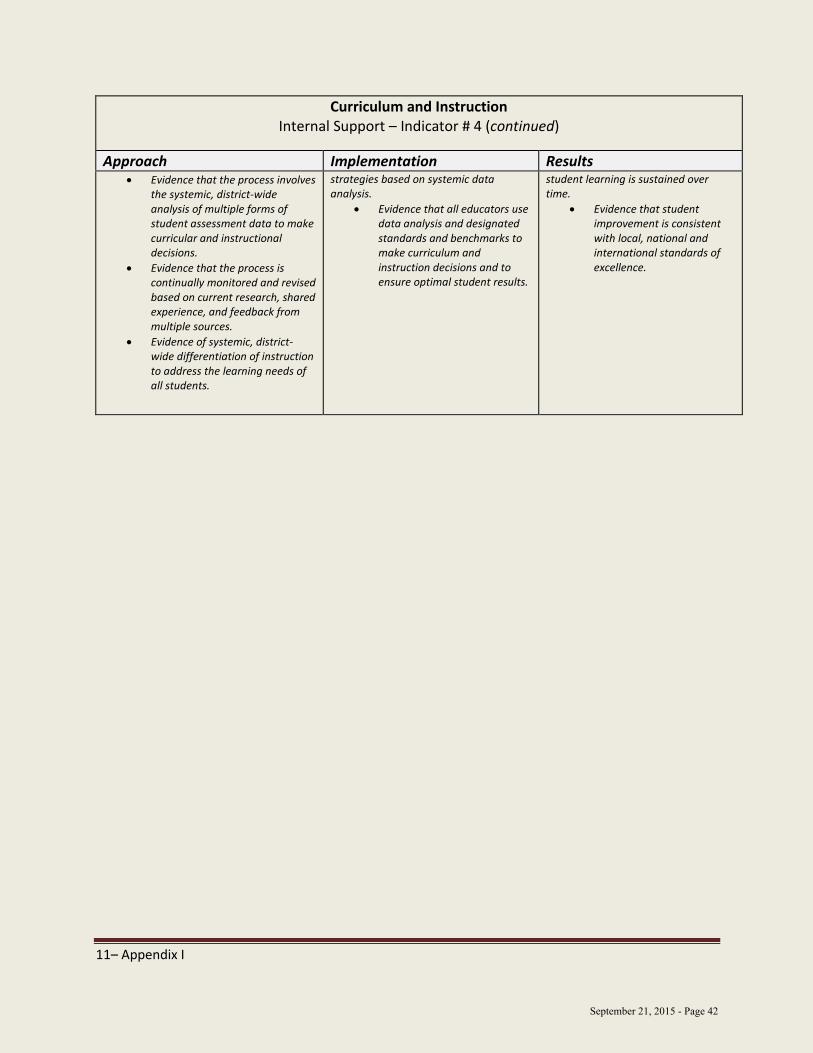
11– Appendix I
Curriculum and Instruction Internal Support – Indicator # 4 (continued)
Approach Implementation Results Evidence that the process involves
the systemic, district-wide analysis of multiple forms of student assessment data to make curricular and instructional decisions.
Evidence that the process is continually monitored and revised based on current research, shared experience, and feedback from multiple sources.
Evidence of systemic, district-wide differentiation of instruction to address the learning needs of all students.
strategies based on systemic data analysis.
Evidence that all educators use data analysis and designated standards and benchmarks to make curriculum and instruction decisions and to ensure optimal student results.
student learning is sustained over time.
Evidence that student improvement is consistent with local, national and international standards of excellence.
September 21, 2015 - Page 42

12– Appendix I
Professional Learning Internal Support – Indicator # 5
The professional learning plan is based on current student and teacher needs linked to district goals. Professional learning is embedded, collaborative, and reflective. The district is attentive to providing the time and resources for this learning to take place. Professional learning is evaluated using a supervision and evaluation process that focuses on the efficacy of instruction and attendant growth in student learning.
Approach Implementation Results
There is no process evident.
There is no evidence of implementation.
There is no evidence of results.
There is a foundational professional learning process that is based on current student and teacher needs related to district goals. This process is embedded, collaborative and reflective.
Evidence of a foundational professional learning process based on current student/teacher needs and linked to district goals.
Evidence that the district provides time and resources to ensure embedded professional learning.
Evidence that professional learning is designed to be collaborative and reflective.
Individual educators are involved in professional learning that is embedded, collaborative and reflective and based on teacher and student needs related to district goals.
Evidence that individual educators are participating in professional learning that is embedded, collaborative, reflective and linked to student and teacher needs and district goals.
Evidence that educators have the time and resources to participate in district professional learning.
Individual educators participate in professional learning that is focused on improved student learning.
Some improvement in student learning related (in part) to the link between professional learning and district goals.
Evidence of improved student learning is related (in part) to the link between professional learning and student needs.
There is a systematic professional learning process that is based on student and teacher needs related to district goals. Professional learning is embedded, collaborative and reflective; it is systematically evaluated.
Evidence of a systematic process for professional learning that is linked to student/teacher needs and district goals.
Evidence that professional learning is systematically evaluated and focused on improved student learning.
Evidence that the supervision and evaluation process is linked to professional learning, student learning and district goals.
Many educators participate in professional learning that is embedded, collaborative, reflective and based on teacher and student needs related to district goals.
Evidence that up to 50% of educators regularly participate in professional learning that is embedded, collaborative and reflective.
Evidence that up to 50% of educators are provided time to participate in professional learning that is focused on student/teacher needs and aligned with district goals.
Evidence that up to 50% of educators align professional learning goals and instructional strategies with student learning.
Measurable improvement in student learning is related (in part) to district goals linked to professional learning that is embedded, collaborative and reflective.
Evidence of measurable improvement in student learning related (in part) to professional learning that is embedded, collaborative and reflective.
Evidence of how improvement in student learning is measured.
September 21, 2015 - Page 43

13– Appendix I
Professional Learning Internal Support – Indicator # 5 (continued)
Approach Implementation Results
There is a systemic professional learning process that is based on student and teacher needs related to district goals. Sustained professional learning is embedded, collaborative and reflective. Professional learning is reviewed and revised over time and is linked to the district plan for supervision and evaluation.
Evidence of a systemic professional learning process that is based on student/teacher needs related to district goals.
Evidence that the systemic process is periodically revisited and refined.
Evidence that the professional learning plan is directly linked to the district supervision and evaluation process.
Most educators participate in professional learning that is systemic and based on student/teacher needs related to district goals. Educators consistently link professional goals to student learning.
Evidence that up to 75% of educators participate in systemic, on-going, scheduled professional learning that is embedded, collaborative and reflective.
Evidence that up to 75% of educators are provided time to participate in systemic professional learning that is focused on student/ teacher needs and aligned with district goals.
Evidence that up to 75% of educators align professional learning goals and instructional strategies to promote optimal student results.
Significant improvement in student learning related (in part) to educators’ participation in systemic professional learning that is embedded, collaborative, reflective and related to student needs. Student growth is directly linked to systematic, sustained professional learning.
Evidence that significant improvement in student learning is sustained over time.
Examples of how significant improvement is measured using data from multiple sources.
There is a systemic, district-wide professional learning process in place that is based on teacher/student needs related to district goals. Time and resources are provided to ensure that professional learning is embedded, collaborative and reflective. The plan is evaluated using a supervision and evaluation process that focuses on optimal student results. The professional learning plan is reviewed and revised based on current research and district analysis of professional learning.
Evidence of a systemic, district-wide professional learning process related to district goals.
Evidence that the process is sustained over time.
Evidence that the revisions are based on current research and analysis of the district’s professional learning process.
All educators participate in professional learning that is systemic, district-wide, and based on student and teacher needs related to district goals. Educators consistently link professional goals to decisions about instructional strategies that promote optimal student learning.
Evidence that all educators participate in ongoing scheduled professional learning that is embedded, collaborative and reflective.
Evidence that all educators are provided time to participate in professional learning that is focused on student and teacher needs and aligned with district goals.
Evidence that all educators align professional learning goals and instructional strategies to promote optimal student results.
Evidence that all educators analyze current research and practices to inform instructional decisions.
Significant improvement in student learning is related to educators’ participation in systemic, district-wide professional learning that is embedded, collaborative, reflective and related to student needs. Student learning is directly linked to professional learning.
Evidence that significant improvement in student learning is sustained over time.
Examples of how significant improvement is measured using data from multiple sources.
Examples of how significant improvement is benchmarked against local and national best practices.
September 21, 2015 - Page 44

14– Appendix I
Equitable Support for Student Needs
Student Performance Indicator #6
Processes and practices are in place in the district that identify and meet students’ academic and non-academic needs. These processes and practices are informed by data gathered from a variety of sources and are aligned with student learning goals for students at all performance levels. Policies and practices that govern student access to all programs are non-discriminatory and set high expectations that challenge each student. All students have equitable access to all programs.
Approach Implementation Results There is no process evident. There is no evidence of
implementation.
There is no evidence of results.
There is a foundational process to identify students’ academic and non-academic needs through policies and practices informed by data from a variety of sources.
Evidence of a foundational process to identify students’ academic and non-academic needs.
Evidence that processes and practices are informed by data analysis from a variety of sources and aligned with student learning goals.
Individual educators analyze data from a variety of sources to meet students’ academic and non-academic needs. Data analysis is used to align policies and practices with learning goals of students at all performance levels.
Evidence that individual educators analyze data from a variety of sources to meet students’ academic and non- academic needs.
Evidence that the foundational processes and practices are informed by data analysis and aligned with student learning goals at all performance levels.
Some improvement in student performance is attributable (in part) to the alignment of policies and practices with student learning goals. Data from a variety of sources are analyzed and used to ensure students’ equitable access to all programs.
Evidence that some improvement in student learning is attributable (in part) to the alignment of policies and practices with student learning goals.
Evidence that data from a variety of sources are analyzed and used to ensure equitable access to all programs.
There is a systematic process that identifies students’ academic and non-academic needs. Data from a variety of sources are analyzed and aligned with student learning goals to ensure non-discriminatory, equitable access to all programs for students at all performance levels. High expectations challenge all students.
Evidence that the systematic process sets high expectations that challenge students at all performance levels.
Evidence that the systematic process is non-discriminatory and ensures that students at all performance levels have equitable access to all programs.
Many educators analyze data from a variety of sources to meet students’ academic and non-academic needs. The data analysis is aligned with student learning goals, ensures equitable access to all programs. High expectations challenge students at all performance levels.
Evidence that up to half (50%) of educators analyze data to identify and meet students’ academic and non-academic needs.
Evidence that up to half (50%) of educators analyze data from a variety of sources.
Evidence that data analysis is aligned with student learning goals and used to set high expectations that challenge
Measurable improvement in student performance is attributable (in part) to the analysis of data aligned with student learning goals. The data are used to ensure equitable access to all programs and to set high expectations that challenge students at all performance levels.
Evidence that measurable improvement in student learning is attributable (in part) to data analysis from a variety of sources.
Evidence that the systematic data analysis process is non-discriminatory, used to ensure equitable access to all programs, and sets high expectations that challenge students at all performance levels.
September 21, 2015 - Page 45

15– Appendix I
Equitable Support for Student Needs Student Performance Indicator #6 (continued)
Approach Implementation Results each student.
Evidence that students at all performance levels have equitable access to all programs.
There is a systemic process that identifies student academic and non-academic needs. Data from a variety of sources, aligned with student learning goals, are analyzed to ensure all students have non-discriminatory, equitable access to all programs. The systemic process includes setting high expectations that challenge students at all performance levels and is periodically reviewed and revised.
Evidence that the systemic process is periodically reviewed and revised.
Most educators analyze data to meet students’ academic and non-academic needs at all performance levels. Data analyses are aligned with student learning goals to ensure equitable access to all programs and to challenge students to meet high expectations at all performance levels.
Evidence that up to 75% of educators analyze data from a variety of sources to meet the academic and non- academic needs of students at all performance levels.
Significant improvement in student performance is attributable (in part) to the analysis of data aligned with student goals, and is sustained over time. Data are analyzed to ensure equitable access to all programs for students at all performance levels.
. Evidence of significant and sustained improvement in student learning linked (in part) to data analysis.
Evidence of significant improvement in student learning linked (in part) to high expectations that challenge students at all performance levels.
Evidence of significant improvement in student learning attributable (in part) to equitable access to all programs.
There is a systemic, district-wide process to analyze data from a variety of sources to meet students’ academic and non-academic needs. This process is aligned with student learning goals to ensure equitable access to all programs for students at all performance levels. High expectations are set that challenge each student. The process is formally reviewed and revised based on current research.
Evidence that the process is formally reviewed and revised based on current research.
All educators analyze data from a variety of sources to meet students’ academic and non-academic needs. The data and analyses are aligned with student learning goals and used to set high expectations that challenge students at all performance levels. Students at all performance levels have equitable access to all programs.
Evidence that all educators systemically analyze student performance data from a variety of sources to ensure high expectations that challenge students at all performance levels.
Significant improvement in student learning sustained over time is linked to the systematic analysis of data aligned with student learning goals and high expectations that challenge students at all performance levels. The data are used to ensure all students have equitable access to all programs.
Evidence that significant improvement in student learning is sustained over time.
Evidence of the link among equitable access, high expectations that challenge students, and significant improvement in student learning and performance.
September 21, 2015 - Page 46

16– Appendix I
Shared Vision and Environment for Change Internal Support – Indicator # 7
Shared vision and goals focused on student performance have been developed with the staff and community, are well articulated, clearly communicated, and consistently pursued throughout the district and school community. This vision expects, supports, and recognizes change and creativity. It values and encourages progressive innovation that leads toward higher student achievement. Data are utilized to support decisions for change. This includes a process to review work and learn from experimentation.
Approach Implementation Results
There is no process evident.
There is no evidence of implementation.
There is no evidence of results.
There is a foundational process to build a shared vision with staff and community to establish goals focused on student performance. This process encourages progressive innovation that leads toward higher student achievement.
Evidence of a foundational process to build a shared vision and establish goals focused on student performance.
Evidence of a foundational process to encourage progressive innovation.
Individual educators and community members collaborate to pursue a shared vision and goals that are focused on student performance. The vision expects, supports, and recognizes change, creativity and progressive innovation.
Evidence that individual educators and community members collaborate to pursue a shared vision and goals that are focused on improved student performance.
Evidence that individual educators are engaged in progressive innovation that leads toward higher student achievement.
Some improvement in student performance is attributable (in part) to a shared vision and goals focused on student performance and to innovative programs and practices.
Evidence of improved student learning related (in part) to a shared vision and goals focused on student performance and to innovative programs and practices.
There is a systematic process to build a shared vision and goals with staff and community that are focused on student performance. The vision and goals are articulated, communicated and pursued throughout the district and school community. This process values and encourages change, creativity, and progressive innovation that lead toward higher student achievement.
Evidence of a systematic process to build a shared vision and goals focused on student performance.
Evidence of a systematic process that ensures the vision and goals are articulated and communicated throughout the
Many educators and community members collaborate to support the systemic shared vision and goals that are focused on student performance. The vision expects, supports, and recognizes change, creativity and progressive innovation. Many educators value change, creativity, and progressive innovation that leads toward higher student achievement. Data are analyzed to support decisions for change.
Evidence that up to half of (50%) the educators and community members support the systemic shared vision and goals.
Evidence that up to half (50%)
Measurable improvement in student learning is related (in part) to a shared vision and related goals and is suggested by data from multiple sources. Measurable improvement is a result (in part) of innovative programs and practices.
Evidence of how measurable improvement in student learning related (in part) to a shared vision and related goals is measured.
Evidence of how measurable improvement in student learning related (in part) to innovative programs and practices is measured and tracked.
September 21, 2015 - Page 47

17– Appendix I
Shared Vision and Environment for Change Internal Support – Indicator # 7 (continued)
Approach Implementation Results district and community.
Evidence of a systematic process that encourages change, creativity and progressive innovation.
Of the educators value change, creativity and progressive innovation.
Evidence that change and innovation are linked to data analysis
There is a systemic process for building a shared vision and goals with staff and community. The vision and related goals are well articulated, communicated and pursued throughout the district and community. This process values change and creativity and encourages progressive innovation. Data are analyzed to support decisions for change. The process is periodically reviewed and revised based on current research.
Evidence that data are analyzed to support decisions for change.
Evidence that the process is periodically reviewed and revised based on current research.
Most educators and community members collaborate to support the systemic shared vision and goals that are focused on student performance. The vision expects, supports, and recognizes change, creativity and progressive innovation. Many educators value change, creativity, and progressive innovation that leads toward higher student achievement. Data are analyzed to support decisions for change.
Evidence that up to 75% of educators support the district vision and goals focused on student performance.
Evidence that up to 75% of educators value change, creativity and progressive innovation.
Significant improvement in student learning, sustained over time, is related to a shared vision and related goals and to innovative programs, practices, and analysis of student performance data.
Evidence of significant improvement in student achievement related to a shared vision and goals and to innovative programs and practices.
Evidence that significant improvement in student learning is sustained over time.
There is a systemic, district-wide process for building a shared vision with staff and community and establishing related goals that are well articulated, communicated, and consistently pursued throughout the district and school community. This systemic, district-wide process is formally reviewed and revised based on current research.
Evidence of a systemic, district-wide process to build a shared vision and related goals.
Evidence that the systemic, district-wide process is formally reviewed and revised based on current research.
All educators and members of the community collaborate to support the systemic and district-wide vision and related goals focused on student performance. All educators are actively engaged in the development, testing, evaluating and sharing of new tools, techniques and instructional strategies focused on improving student achievement. Change and program innovations are expected, on-going and are derived from multiple assessments.
Evidence that all educators understand and support the vision and goals.
Evidence that all educators share a sense of responsibility for realizing the vision and goals.
Evidence that all educators are engaged in programs focused on realizing the vision
Significant improvement in student performance, sustained over time, is related to a shared vision and is benchmarked against local and national measures of excellence. Significant improvement in student achievement, sustained over time, is a result of innovative programs and practices.
Evidence of significantly improved student leaning sustained over time and related to the shared vision and goals and to innovative programs and practices.
Evidence of how significant improvement is benchmarked against local and national measures of excellence.
September 21, 2015 - Page 48

18– Appendix I
Shared Vision and Environment for Change Internal Support – Indicator # 7 (continued)
Approach Implementation Results and goals.
Evidence that all educators collaborate in developing, testing, evaluating and sharing new tools, techniques and strategies.
Evidence that the innovations are expected, ongoing and linked to the analysis of assessment data.
September 21, 2015 - Page 49

19– Appendix I
Parent and Community Support External Support – Indicator #8
The active involvement of parents and the community and ongoing communication among all constituent groups are encouraged and utilized to improve student learning. A wide range of community resources extends the classroom and enriches the educational experience of students. The budget development process supports the mission, vision and goals of the district and is aligned with efforts to improve student performance.
Approach Implementation Results
There is no process evident.
There is no evidence of implementation.
There is no evidence of results.
There is a foundational process that encourages the active involvement of and communication with parents, community and educators. The budget process supports the district mission, vision and goals and is aligned with efforts to improve student performance.
Evidence of a foundational process for active involvement and ongoing communication among constituent groups.
Evidence of a foundational budget process that supports the district mission, vision and goals and is aligned with efforts to improve student performance.
Individual educators are actively involved with parents and community members in conversations focused on improved teaching and learning. Opportunities for parents to communicate with educators are aligned with district efforts to improve student performance.
Evidence that individual educators, parents, and community members have opportunities for ongoing communication focused on student learning.
Evidence that individual educators, parents and community members communicate to support programs focused on improved student performance.
The active involvement and two-way communication among educators, parents and community members are linked (in part) to some improvement in student learning.
. Evidence of improved student learning linked (in part) to communication between parents, community members and educators.
There is a systematic process for the active involvement of parents and community members, and ongoing communication among parents, community members, and educators. The systematic process includes developing a budget that supports the district mission, vision and goals. A wide range of community resources extends the classroom experience and is aligned with efforts to improve student performance.
Evidence of a systematic process that encourages two-way communication between parents/community and educators.
Evidence of a systematic
Many educators communicate with parents and community members to improve student learning. Parents and community members support the budget, the mission, vision and goals of the district and provide resources that extend the classroom experience.
Evidence that up to half (50%) of parents, community members and educators are actively involved in ongoing communication to improve student learning.
Evidence that a wide range of community resources extends and enriches the classroom experience.
Evidence that the district
The active involvement of the parents and community members in the education process is recognized, along with programs supported by the district budget, as contributing (in part) to measurable improvement in student learning as assessed by classroom and district data from multiple sources.
Evidence of measurable improvement in student learning linked (in part) to the active involvement of parents/ community members.
Evidence of measurable improvement in student learning linked (in part) to programs supported by the district budget.
September 21, 2015 - Page 50

20– Appendix I
Parent and Community Support External Support – Indicator #8 (continued)
Approach Implementation Results process for developing a budget that supports the district mission, vision, and goals.
Evidence of community resources that extend and enrich the classroom experience.
mission, vision and goals are aligned with educators’ efforts to improve student performance.
There is a systemic process to encourage the active involvement of and communication between parents and community members and educators. The budget development process supports the district mission, vision and goals and is aligned with efforts to improve student performance. A wide range of community resources extends and enriches the classroom experience and is aligned with efforts to improve student performance.
Evidence of a systemic process that encourages the active involvement of parents and community members.
Evidence that there is a systemic process at all grade levels and departments to maintain consistent, productive communication with parents.
Evidence that the budget development process is aligned with efforts to improve student performance.
Most parents and community members are actively involved in ongoing communication with educators to improve student learning. The budget development process supports the district mission, vision and goals and is aligned with efforts to improve student performance.
Evidence that up to 75% of parents and community members have the opportunity to become involved in programs that are supported by the Board and are aligned with efforts to improve student performance.
Evidence that up to 75% of parents and many community members consistently support the district mission, vision and goals.
The active involvement of the parents and community members in the education process is recognized, along with programs supported by the district budget, as contributing (in part) to significant improvement in student learning sustained over time.
Evidence that significant improvement in student learning is related (in part) to parent and community support and is sustained over time.
There is a systemic, district-wide process for the active involvement of and communication among parents, community members and educators. The budget development process is systemic and district-wide, is aligned with the district mission, vision, and goals, and is aligned with efforts to improve student achievement. A wide range of community resources extends and enriches the classroom experience. These processes are periodically reviewed and revised based on current research.
Evidence of a systemic, district-wide process for active
All parents and community members are afforded opportunities to be actively involved in ongoing communication with educators to improve student learning. Community resources provide enrichment that extends the classroom experience for all students. The budget development process supports the district mission, vision and goals and is aligned with efforts to improve student performance.
Evidence that all parents and community members are afforded opportunities to be actively involved in ongoing
communication with educators.
The active involvement of parents and community members in ongoing two-way communication with educators is linked to significant improvement in student learning sustained over time. There is consistent community support for programs aligned with efforts to improve student performance and based on local and national measures of excellence.
Evidence that significant improvement in student performance is benchmarked against local, regional, and national measures of excellence.
September 21, 2015 - Page 51

21– Appendix I
Parent and Community Support External Support – Indicator #8 (continued)
Approach Implementation Results involvement and two-way communication between parents/community members and educators.
Evidence that the budget development process is systemic, district-wide, and aligned with the district mission, vision and goals of improved student performance.
Evidence that these processes are periodically reviewed and revised
Evidence that all parents and community members are aware of the district mission, vision and goals and are afforded opportunities to inform and support these goals.
September 21, 2015 - Page 52
September 21, 2015 - Page 53

September 21, 2015 - Page 54

September 21, 2015 - Page 55

September 21, 2015 - Page 56

September 21, 2015 - Page 57

September 21, 2015 - Page 58

September 21, 2015 - Page 59

September 21, 2015 - Page 60

September 21, 2015 - Page 61

September 21, 2015 - Page 62

September 21, 2015 - Page 63

September 21, 2015 - Page 64

September 21, 2015 - Page 65

September 21, 2015 - Page 66

September 21, 2015 - Page 67

September 21, 2015 - Page 68

The first financial report for the FY 2016 Operating Budget can be found on pages 4 through 37 of this document. The financial information presented in this section of the report includes the adopted budget,
monthly and year-to-date transfers, the revised budget (adopted budget plus or minus transfers), actual year-to-date budget expenditures, encumbrances, anticipated expenditures that have not been encumbered,
and the total projected expenditures by object, which is the sum of the previous three columns. The Internal Services report for health insurance can be found on pages 38-40.
FY 2016 Budget 48,503,782$
FY 2016 YTD Actuals 4,584,945$
FY 2016 Encumbrances 2,822,007$
FY 2016 Anticipated 40,951,337$
FY 2016 Balance 145,493$ *
*The available balance represents the IDEA carryover funds from the prior fiscal year after select para professional salaries were shifted from the operating budget to the IDEA carryover. It is anticipated these funds
will be re-allocated to special education tuition/contracted services.
There are transfers totaling $234,255 before the Board of Education for its approval. Those transfers are as follows and are reflected in the financial report:
Facilities:
TO: Contracted Services/Maintenance Projects (Facilities) 19,908$
FROM: Books (Curriculum) 19,908$
To address gas burners in the Weston High School Science Wing. These funds allowed the Science Wing of the High School to begin using gas burners.
TO: Contracted Services/Maintenance Projects (Facilities) 25,000$
FROM: Non-Certified Salaries (Facilities) 25,000$
To provide additional funding in contracted services within the facilities department due to the general maintenance mechanic position being put on hold for FY 2016.
TO: Contracted Services (Roof Repair) 3,000$
FROM: Contracted Services (Repair Allowance) 3,000$
To address roof repair at Weston High School.
WESTON PUBLIC SCHOOLS
FINANCIAL REPORT #1
July 2015 - August 2015
1September 21, 2015 - Page 69

WESTON PUBLIC SCHOOLS
FINANCIAL REPORT #1
July 2015 - August 2015
Special Education:
TO: Certified Salaries 108,500$
FROM: Professional & Educational Services 108,500$
To fund recently hired Behavioral Analysts that were previously contracted out. This transfer was reflected in the budget book.
Hurlbutt Elementary School
TO: Certified Salaries 69,959$
FROM: Certified Salaries (HES Teacher) 68,600$
FROM: Medicare Taxes 1,359$
To fund a 1.0 FTE Kindergarten Teacher that was added to address increasing elementary enrollment.
Weston High School
TO: Equipment Repairs 288$
FROM: Materials 288$
To repair cameras used at the High School.
TO: Dues, Fees, Memberships 50$
FROM: Materials 50$
To fund an increase in American Library Association Membership.
TO: Materials 400$
FROM: Books 400$
To Purchase additional AP Biology Books due to increased enrollment in course.
TO: Books 50$
FROM: Materials 50
To purchase Chemistry Books due to increased enrollment in course.
TO: Books 600$
FROM: Supplies 600$
To Purchase AP Spanish Books due to increased enrollment in course.
2September 21, 2015 - Page 70

WESTON PUBLIC SCHOOLS
FINANCIAL REPORT #1
July 2015 - August 2015
Weston Middle School
TO: Materials 2,500$
FROM: Equipment (Curriculum) 2,500$
To purchase additional Vex Kits.
Curriculum
TO: Travel & Conference 4,000$
FROM: Certified Salaries (C&I Stipends) 4,000$
To send district team to the EdLeader21 Conference.
Certified Staff: Salary Differential: Non Certified Staff:
Special Education Teachers (97,167)$ Non Certified Supervisors 7,267$ HES Para's 26,944$
BCBA's 108,500$ Non Certified Staff Technicians 5,000$ WIS Para 28,450$
Guidance (24,784)$ Certified Staff (Administrators) 23,719$ WMS Para 510$
C&I Salaries (14,847)$ 35,986$ WHS Para 1,155$
Salary Increase CO Admin 23,719$ Athletic Secretary (855)$
Tech Integrators (11,676)$ SPED Para's (Funding Source Change) (70,486)$
Classroom Teachers 75,081$ Certified Stipends: Occupational Therapist 1,978$
Director of Finance (13,524)$ C&I Stipends (4,000)$ PPS Secretary (529)$
WMS Principal (7,372)$ Team Leader Stipends (11,000)$ Technology Salary Increases 9,500$
WHS Administrators 27,745$ (15,000)$ Technicians (6,041)$
HES Additional Kindergarten
Teacher (68,600)$ Facilities Director 2,767$
Non Certified Stipends Grounds (18,884)$
(2,925.00)$ Vacant HVAC Stipend (7,296)$ Custodian (2,995)$
HVAC Position (87,405)$
Copy center 744$
Business Office Reorg 66,413$
(48,734)$
Breakdown of Net Turnover Savings, which is reflected in the Salaries & Wages section of the financial statements
3September 21, 2015 - Page 71

Object Account FY Adopted Budget Cumulative Current Report Revised Line FY 2016 FY 2016 FY 2016 FY 2016
Series Budget
Budget
Adjustments
Budget
Adjustments Budget Variance % $ Expended Encumbered Anticipated Balance
WESTON PUBLIC SCHOOLS
Salaries & Wages (1000s)
Certified Staff $23,016,234 ($2,925) ($2,925) $23,013,309 0.0% $1,396,780 $0 $21,616,529 (0)$
Non Certified Staff $5,953,211 ($48,734) ($48,734) $5,904,477 -0.8% $625,600 $0 $5,139,883 138,994$
Overtime $144,620 ($2,800) ($2,800) $141,820 -1.9% $19,020 $0 $122,801 (1)$
Certified Stipends $784,494 ($15,000) ($15,000) $769,494 -1.9% $5,230 $0 $761,264 3,000$
Non Certified Stipends $116,809 ($7,296) ($7,296) $109,513 -6.2% $8,821 $0 $100,692 (0)$
Turnover Savings ($193,600) $193,600 $193,600 $0 -100.0% $0 $0 $0 -$
Salary Differential $193,250 ($35,986) ($35,986) $157,264 -18.6% $0 $0 $157,264 -$
$30,015,018 $80,859 $80,859 $30,095,877 $2,055,451 -$ 27,898,433$ 141,993$
Group $ transfer in/(transfer out): $80,859
Group change %: 0.3%
Benefits (2000's)
2000 Health Insurance $6,991,965 $0 $0 $6,991,965 $1,165,328 $0 $5,826,637 -$
2001 Social Security $507,618 $0 $0 $507,618 $55,865 $0 $451,752 0$
2002 Medicare $436,781 ($1,359) ($1,359) $435,422 -0.3% $29,660 $0 $405,762 (0)$
2003 Workers Compensation $226,043 ($10,023) ($10,023) $216,020 -4.4% $216,020 $0 $0 -$
2004 Unemployment Compensation $68,000 $0 $0 $68,000 $5,078 $0 $62,922 -$
2005 Early Retirement Incentive $4,759 $0 $0 $4,759 $4,758 $0 $0 1$
2007 Pension Contributions $834,052 $0 $0 $834,052 $81,141 $0 $752,911 0$
2010 Tuition Reimbursement $75,000 $0 $0 $75,000 $0 $0 $75,000 -$
2011 Life Insurance $88,495 $0 $0 $88,495 $16,886 $0 $71,609 0$
2012 Disability Insurance $18,086 $0 $0 $18,086 $0 $0 $18,086 -$
2014 Sick Bank $45,000 $0 $0 $45,000 $0 $0 $45,000 -$
2015 GASB 43/45 $209,000 $0 $0 $209,000 $0 $0 $209,000 -$
$9,504,799 ($11,382) ($11,382) $9,493,417 $1,574,736 -$ 7,918,679$ 2$
Group $ transfer in/(transfer out): ($11,382)
Group change %: -0.1%
Professional & Technical Services (3000s)
3210 Contracted Services Educational $723,785 ($108,500) ($108,500) $615,285 -15.0% $13,268 $5,116 $596,901 -$
3220/3221 Consulting Services $176,900 $0 $0 $176,900 $25,600 $28,000 $123,300 -$
3235 Testing $85,000 $0 $0 $85,000 $18,850 $4,880 $61,270 0$
3239 Other Pupil Services $201,665 $0 $0 $201,665 $4,014 $132 $197,519 -$
3303 Management Services $27,895 $0 $0 $27,895 $4,866 $400 $22,629 -$
3304 License Fees-Facilities $2,800 $0 $0 $2,800 $0 $0 $2,800 -$
3306 Legal Fees $90,000 $0 $0 $90,000 $991 $35,000 $54,009 -$
3308 Police/Fire $85,642 $0 $0 $85,642 $308 $3,116 $82,218 (0)$
3309 Professional Technical Services $63,423 $0 $0 $63,423 $5,515 $21,205 $36,703 (0)$
3310 Sports Officials $45,863 $0 $0 $45,863 $15,000 $0 $30,863 -$
$1,502,973 ($108,500) ($108,500) $1,394,473 $88,413 97,849$ 1,208,212$ (0)$
Group $ transfer in/(transfer out): ($108,500)
Group change %: -7.2%
Property Services (4000s)
4200 Cleaning Services $585,245 $0 $0 $585,245 $48,275 $531,907 $5,063 (0)$
4202 Rubbish Removal $74,475 $0 $0 $74,475 $2,123 $69,877 $2,475 -$
4203 Mop & Mat Service $5,000 $0 $0 $5,000 $0 $5,000 $0 -$
4204 Exterminator $8,000 $0 $0 $8,000 $0 $7,500 $500 -$
4302 Equipment Repairs $146,001 $288 $288 $146,289 0.2% $17,279 $36,478 $92,533 (0)$
4400 Equipment Rental $529,699 $0 $0 $529,699 $19,678 $82,511 $427,510 0$
4401 Rental of Facilities $17,492 $0 $0 $17,492 $490 $2,010 $14,992 -$
4500 Repair Allowance $132,000 ($3,000) ($3,000) $129,000 -2.3% $0 $28,104 $100,896 0$
4510 Asbestos Abatement $5,000 $0 $0 $5,000 $0 $0 $5,000 -$
4511 Elevator Contract $13,480 $0 $0 $13,480 $1,647 $8,871 $2,962 -$
4512 Emergency Lights $11,570 $0 $0 $11,570 $5,909 $0 $5,661 0$
4513 Generator Contract $10,377 $0 $0 $10,377 $0 $3,000 $7,377 -$
4514 Fire Alarm System $33,929 $0 $0 $33,929 $14,309 $7,113 $12,507 -$
WESTON PUBLIC SCHOOLS
FINANCIAL REPORT
Aug-15
Period: 2 of 12
4September 21, 2015 - Page 72

Object Account FY Adopted Budget Cumulative Current Report Revised Line FY 2016 FY 2016 FY 2016 FY 2016
Series Budget
Budget
Adjustments
Budget
Adjustments Budget Variance % $ Expended Encumbered Anticipated Balance
WESTON PUBLIC SCHOOLS
FINANCIAL REPORT
Aug-15
Period: 2 of 12
4515 Fire Protection System $8,926 $0 $0 $8,926 $2,595 $1,000 $5,331 -$
4516 UST Testing $6,996 $0 $0 $6,996 $0 $0 $6,996 -$
4517 Sprinkler System $4,858 $0 $0 $4,858 $0 $4,648 $210 -$
4518 Sewer System Plant Maintenance $130,814 $0 $0 $130,814 $9,651 $102,425 $18,738 -$
4530 Parks & Recreation $56,350 $0 $0 $56,350 $0 $0 $56,350 -$
4531 Drain System $5,575 $0 $0 $5,575 $0 $0 $5,575 -$
4533 Glass Replacement $3,000 $0 $0 $3,000 $650 $850 $1,500 -$
4534 Roof Repair $5,000 $3,000 $3,000 $8,000 60.0% $7,739 $0 $261 (0)$
4535 Window Treatments $3,000 $0 $0 $3,000 $0 $0 $3,000 -$
4536 Air Filter HVAC System $3,500 $0 $0 $3,500 $0 $2,063 $1,438 (1)$
4538 Chiller Contract $10,600 $25,000 $25,000 $35,600 235.8% $861 $9,556 $25,183 0$
4539 Energy Management System $27,500 $0 $0 $27,500 $19,624 $0 $7,876 -$
4540 Athletic Facilities Repairs $6,000 $0 $0 $6,000 $0 $0 $6,000 -$
4542 Contracted Services $8,400 $0 $0 $8,400 $0 $0 $8,400 -$
4543 Paving $5,000 $0 $0 $5,000 $0 $0 $5,000 -$
4600 Special Projects $60,304 $19,908 $19,908 $80,212 33.0% $35,413 $9,531 $35,268 0$
4602 Tree Service $11,000 $0 $0 $11,000 $0 $0 $11,000 -$
4603 Exterior Lighting $2,800 $0 $0 $2,800 $0 $0 $2,800 -$
4604 Snow Plowing $12,500 $0 $0 $12,500 $0 $0 $12,500 -$
4605 Signage $2,500 $0 $0 $2,500 $0 $0 $2,500 -$
4606 Sprinkler Repairs $3,000 $0 $0 $3,000 $0 $0 $3,000 -$
4607 Storm Draining $1,000 $0 $0 $1,000 $0 $0 $1,000 -$
4608 Trucking Services $2,000 $0 $0 $2,000 $0 $0 $2,000 -$
4610 Playground Repairs $2,200 $0 $0 $2,200 $0 $0 $2,200 -$
4701 Security System Monitoring $20,040 $0 $0 $20,040 $5,010 $15,030 $0 -$
4702 Locks/Keys $6,000 $0 $0 $6,000 $0 $2,953 $3,047 -$
4705 United Alarm $500 $0 $0 $500 $0 $500 $0 -$
4900 Other Property Services $1,000 $0 $0 $1,000 $0 $0 $1,000 -$
$1,982,631 $45,196 $45,196 $2,027,827 $191,253 930,926$ 905,649$ (0)$
Group $ transfer in/(transfer out): $45,196
Group change %: 2.3%
Other Services (5000s)
5100 Regular Transportation $1,208,552 $0 $0 $1,208,552 $0 $1,174,240 $34,312 -$
5101 SPED Transportation $41,227 $0 $0 $41,227 $0 $500 $40,727 -$
5104 Athletic Transportation $80,429 $0 $0 $80,429 $83 $23,617 $56,729 -$
5105 Extra Curricular Transporation $8,150 $0 $0 $8,150 $0 $0 $8,150 -$
5200 General Liability Insurance $85,433 $0 $0 $85,433 $0 $0 $85,433 -$
5202 Athletic Insurance $19,916 $10,023 $10,023 $29,939 50.3% $29,939 $0 $0 -$
5205 Property Insurance $110,864 $0 $0 $110,864 $0 $0 $110,864 -$
5300 Communications $148,820 $0 $0 $148,820 $26,239 $135 $122,446 0$
5400 Postage $23,601 $0 $0 $23,601 $584 $6,247 $16,770 (0)$
5500 Advertising $7,000 $0 $0 $7,000 $342 $252 $6,406 -$
5501 Printing $24,522 $0 $0 $24,522 $8,273 $121 $16,129 (1)$
5600 Tuition $1,923,268 $0 $0 $1,923,268 $234,002 $247,953 $1,441,313 0$
5800,5802-5880 Travel & Conference $53,370 $4,000 $4,000 $57,370 7.5% $12,162 $8,643 $36,566 (0)$
5801 Mileage Reimbursement $28,400 $0 $0 $28,400 $3,000 $109 $21,791 3,500$
5900 Other Purchased Services $11,350 ($1,000) ($1,000) $10,350 -8.8% $0 $5,500 $4,850 -$
$3,774,902 $13,023 $13,023 $3,787,925 $314,623 1,467,316$ 2,002,486$ 3,499$
Group $ transfer in/(transfer out): $13,023
Group change %: 0.3%
Supplies & Materials (6000's)
6110 Materials $667,525 $1,762 $1,762 $669,287 0.3% $63,469 $191,186 $414,632 0$
6120 Office Materials $37,182 $0 $0 $37,182 $2,267 $5,644 $29,271 0$
6130 Maintenance Materials $0 $0 $0 $0 0.0% $0 $0 $0 -$
6131 Custodial Materials $78,061 $0 $0 $78,061 $15,808 $19,753 $42,500 0$
6132 Security Materials $0 $0 $0 $0 0.0% $0 $0 $0 -$
6140 Software $342,985 $0 $0 $342,985 $201,931 $17,907 $123,147 (0)$
6270 Diesel Fuel $131,171 $0 $0 $131,171 $3,307 $3,321 $124,544 (0)$
6410 Books $185,707 ($19,508) ($19,508) $166,199 -10.5% $30,130 $61,043 $75,026 (1)$
6510 Heating Oil $466,479 $0 $0 $466,479 $5,516 $0 $460,963 0$
5September 21, 2015 - Page 73

Object Account FY Adopted Budget Cumulative Current Report Revised Line FY 2016 FY 2016 FY 2016 FY 2016
Series Budget
Budget
Adjustments
Budget
Adjustments Budget Variance % $ Expended Encumbered Anticipated Balance
WESTON PUBLIC SCHOOLS
FINANCIAL REPORT
Aug-15
Period: 2 of 12
6520 Electricity $727,800 $0 $0 $727,800 $24,021 $0 $703,779 0$
6530 Propane gas $3,500 $0 $0 $3,500 $60 $2,940 $500 -$
$2,640,410 ($17,746) ($17,746) $2,622,664 $346,509 301,793$ 1,974,362$ (0)$
Group $ transfer in/(transfer out): ($17,746)
Group change %: -0.7%
Equipment (7000's)
7300 Equipment $25,000 ($2,500) ($2,500) $22,500 -10.0% $38 $590 $21,872 0$
$25,000 ($2,500) ($2,500) $22,500 $38 590$ 21,872$ 0$
Group $ transfer in/(transfer out): ($2,500)
Group change %: -10%
Other Objects (8000's)
8100 Dues, Fees and Memberships $93,400 $1,050 $1,050 $94,450 1.1% $52,637 $21,612 $20,201 0$
8900 Other Objects $1,895 $0 $0 $1,895 $2,201 $1,922 ($2,228) (0)$
$95,295 $1,050 $1,050 $96,345 $54,838 23,534$ 17,973$ 0$
Group $ transfer in/(transfer out): $1,050
Group change %: 1.1%
Revenues (9000's)
9200 Technology Revenue ($45,000) $0 $0 ($45,000) $0 $0 ($45,000) -$
9201 Participation Fees, Athletics ($59,710) $0 $0 ($59,710) $0 $0 ($59,710) -$
9202 Gate Receipts, Athletics ($15,500) $0 $0 ($15,500) $0 $0 ($15,500) -$
9205 Excess Cost SPED ($764,946) $0 $0 ($764,946) $0 $0 ($764,946) -$
9206 Pre School Tuition SPED ($82,500) $0 $0 ($82,500) ($27,356) $0 ($55,144) (0)$
9207 Regular Ed. Tuition $0 $0 $0 $0 0.0% ($13,561) $0 $13,561 -$
9208 Revenue from Town for Fields ($39,590) $0 $0 ($39,590) $0 $0 ($39,590) -$
9209 Parking Fees ($30,000) $0 $0 ($30,000) $0 $0 ($30,000) -$
(1,037,246.00)$ $0 $0 (1,037,246.00)$ (40,916.55)$ -$ (996,329)$ (0)$
Group $ transfer in/(transfer out): $0
Group change %: 0%
Total: $48,503,782 $0 $0 $48,503,782 $4,584,945 2,822,007$ 40,951,337$ 145,493$
6September 21, 2015 - Page 74
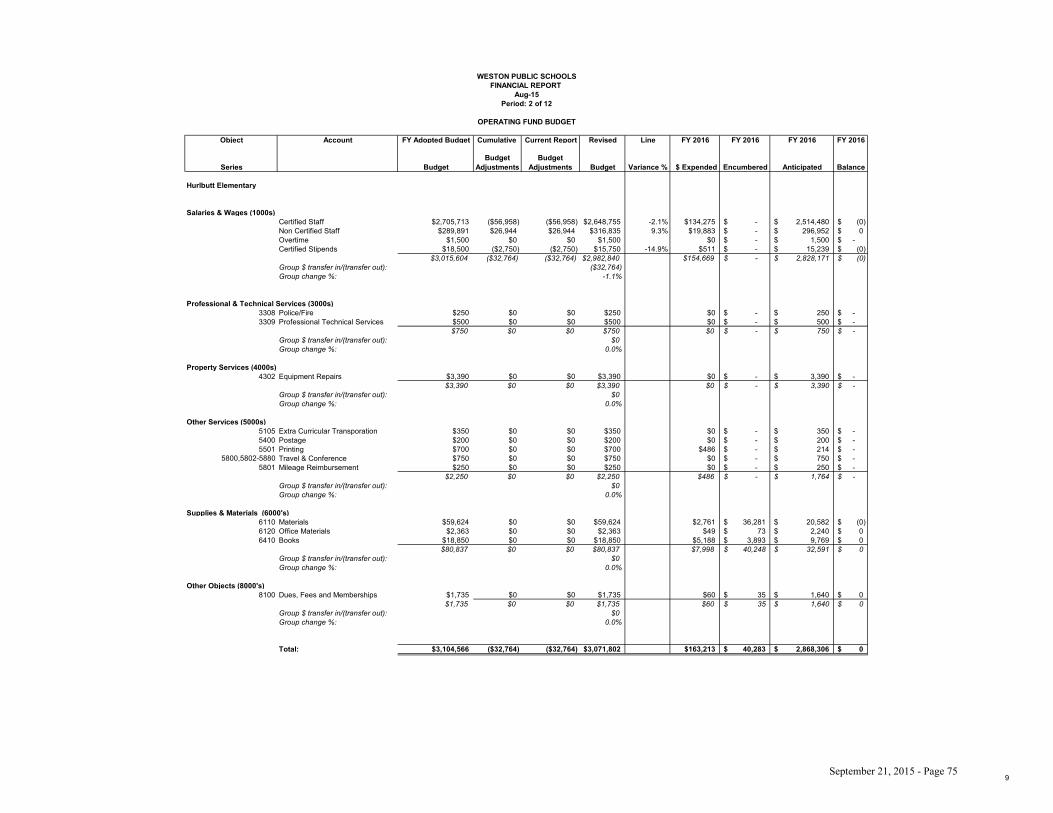
Object Account FY Adopted Budget Cumulative Current Report Revised Line FY 2016 FY 2016 FY 2016 FY 2016
Series Budget
Budget
Adjustments
Budget
Adjustments Budget Variance % $ Expended Encumbered Anticipated Balance
Hurlbutt Elementary
Salaries & Wages (1000s)
Certified Staff $2,705,713 ($56,958) ($56,958) $2,648,755 -2.1% $134,275 -$ 2,514,480$ (0)$
Non Certified Staff $289,891 $26,944 $26,944 $316,835 9.3% $19,883 -$ 296,952$ 0$
Overtime $1,500 $0 $0 $1,500 $0 -$ 1,500$ -$
Certified Stipends $18,500 ($2,750) ($2,750) $15,750 -14.9% $511 -$ 15,239$ (0)$
$3,015,604 ($32,764) ($32,764) $2,982,840 $154,669 -$ 2,828,171$ (0)$
Group $ transfer in/(transfer out): ($32,764)
Group change %: -1.1%
Professional & Technical Services (3000s)
3308 Police/Fire $250 $0 $0 $250 $0 -$ 250$ -$
3309 Professional Technical Services $500 $0 $0 $500 $0 -$ 500$ -$
$750 $0 $0 $750 $0 -$ 750$ -$
Group $ transfer in/(transfer out): $0
Group change %: 0.0%
Property Services (4000s)
4302 Equipment Repairs $3,390 $0 $0 $3,390 $0 -$ 3,390$ -$
$3,390 $0 $0 $3,390 $0 -$ 3,390$ -$
Group $ transfer in/(transfer out): $0
Group change %: 0.0%
Other Services (5000s)
5105 Extra Curricular Transporation $350 $0 $0 $350 $0 -$ 350$ -$
5400 Postage $200 $0 $0 $200 $0 -$ 200$ -$
5501 Printing $700 $0 $0 $700 $486 -$ 214$ -$
5800,5802-5880 Travel & Conference $750 $0 $0 $750 $0 -$ 750$ -$
5801 Mileage Reimbursement $250 $0 $0 $250 $0 -$ 250$ -$
$2,250 $0 $0 $2,250 $486 -$ 1,764$ -$
Group $ transfer in/(transfer out): $0
Group change %: 0.0%
Supplies & Materials (6000's)
6110 Materials $59,624 $0 $0 $59,624 $2,761 36,281$ 20,582$ (0)$
6120 Office Materials $2,363 $0 $0 $2,363 $49 73$ 2,240$ 0$
6410 Books $18,850 $0 $0 $18,850 $5,188 3,893$ 9,769$ 0$
$80,837 $0 $0 $80,837 $7,998 40,248$ 32,591$ 0$
Group $ transfer in/(transfer out): $0
Group change %: 0.0%
Other Objects (8000's)
8100 Dues, Fees and Memberships $1,735 $0 $0 $1,735 $60 35$ 1,640$ 0$
$1,735 $0 $0 $1,735 $60 35$ 1,640$ 0$
Group $ transfer in/(transfer out): $0
Group change %: 0.0%
Total: $3,104,566 ($32,764) ($32,764) $3,071,802 $163,213 40,283$ 2,868,306$ 0$
WESTON PUBLIC SCHOOLS
FINANCIAL REPORT
Aug-15
Period: 2 of 12
OPERATING FUND BUDGET
9September 21, 2015 - Page 75

Object Account FY Adopted Budget Cumulative Current Report Revised Line FY 2016 FY 2016 FY 2016 FY 2016
Series Budget
Budget
Adjustments
Budget
Adjustments Budget Variance % $ Expended Encumbered Anticipated Balance
Weston Intermediate School
Salaries & Wages (1000s)
Certified Staff $3,514,852 $119,585 $119,585 $3,634,437 3.4% $186,526 -$ 3,447,911$ (0)$
Non Certified Staff $224,181 $28,450 $28,450 $252,631 12.7% $14,475 -$ 238,156$ (0)$
Overtime $750 $0 $0 $750 $0 -$ 750$ -$
Certified Stipends $33,593 ($2,750) ($2,750) $30,843 -8.2% $624 -$ 30,219$ (0)$
$3,773,376 $145,285 $145,285 $3,918,661 $201,626 -$ 3,717,036$ (1)$
Group $ transfer in/(transfer out): $145,285
Group change %: 3.9%
Property Services (4000s)
4302 Equipment Repairs $2,420 $0 $0 $2,420 $0 -$ 2,420$ -$
$2,420 $0 $0 $2,420 $0 -$ 2,420$ -$
Group $ transfer in/(transfer out): $0
Group change %: 0.0%
Other Services (5000s)
5501 Printing $1,000 $0 $0 $1,000 $124 65$ 812$ (1)$
5800,5802-5880 Travel & Conference $500 $0 $0 $500 $0 -$ 500$ -$
5801 Mileage Reimbursement $250 $0 $0 $250 $0 -$ 250$ -$
$1,750 $0 $0 $1,750 $124 65$ 1,562$ (1)$
Group $ transfer in/(transfer out): $0
Group change %: 0.0%
Supplies & Materials (6000's)
6110 Materials $37,221 $0 $0 $37,221 $1,324 22,038$ 13,860$ (0)$
6120 Office Materials $2,000 $0 $0 $2,000 $0 311$ 1,689$ 0$
6410 Books $38,192 $0 $0 $38,192 $373 20,744$ 17,075$ (0)$
$77,413 $0 $0 $77,413 $1,697 43,093$ 32,624$ (1)$
Group $ transfer in/(transfer out): $0
Group change %: 0.0%
Other Objects (8000's)
8100 Dues, Fees and Memberships $1,189 $0 $0 $1,189 $218 -$ 971$ -$
$1,189 $0 $0 $1,189 $218 -$ 971$ -$
Group $ transfer in/(transfer out): $0
Group change %: 0.0%
Total: $3,856,148 $145,285 $145,285 $4,001,433 $203,664 43,157$ 3,754,613$ (2)$
WESTON PUBLIC SCHOOLS
FINANCIAL REPORT
Aug-15
Period: 2 of 12
OPERATING FUND BUDGET
11September 21, 2015 - Page 76

Object Account FY Adopted Budget Cumulative Current Report Revised Line FY 2016 FY 2016 FY 2016 FY 2016
Series Budget
Budget
Adjustments
Budget
Adjustments Budget Variance % $ Expended Encumbered Anticipated Balance
Weston Middle School
Salaries & Wages (1000s)
Certified Staff $4,214,955 ($16,873) ($16,873) $4,198,082 -0.4% $211,841 -$ 3,986,241$ (0)$
Non Certified Staff $177,500 $510 $510 $178,010 0.3% $15,288 -$ 162,722$ (0)$
Certified Stipends $147,251 ($2,750) ($2,750) $144,501 -1.9% ($216) -$ 144,717$ 0$
$4,539,706 ($19,113) ($19,113) $4,520,593 $226,914 -$ 4,293,680$ (1)$
Group $ transfer in/(transfer out): ($19,113)
Group change %: -0.4%
Professional & Technical Services (3000s)
3308 Police/Fire $1,610 $0 $0 $1,610 $224 600$ 786$ (0)$
3309 Professional Technical Services $13,620 $0 $0 $13,620 $0 -$ 13,620$ -$
$15,230 $0 $0 $15,230 $224 600$ 14,406$ (0)$
Group $ transfer in/(transfer out): $0
Group change %: 0.0%
Property Services (4000s)
4400 Equipment Rental $5,871 $0 $0 $5,871 $0 800$ 5,071$ -$
$5,871 $0 $0 $5,871 $0 800$ 5,071$ -$
Group $ transfer in/(transfer out): $0
Group change %: 0.0%
Other Services (5000s)
5105 Extra Curricular Transporation $7,800 $0 $0 $7,800 $0 -$ 7,800$ -$
5400 Postage $292 $0 $0 $292 $245 -$ 47$ -$
5501 Printing $3,160 $0 $0 $3,160 $0 56$ 3,104$ -$
5600 Tuition $2,630 $0 $0 $2,630 $0 -$ 2,630$ -$
5800,5802-5880 Travel & Conference $1,000 $0 $0 $1,000 $0 -$ 1,000$ -$
5801 Mileage Reimbursement $550 $0 $0 $550 $0 -$ 550$ -$
$15,432 $0 $0 $15,432 $245 56$ 15,131$ -$
Group $ transfer in/(transfer out): $0
Group change %: 0.0%
Supplies & Materials (6000's)
6110 Materials $79,797 $2,500 $2,500 $82,297 3.1% $3,983 25,174$ 53,140$ 0$
6120 Office Materials $3,500 $0 $0 $3,500 $33 21$ 3,446$ 0$
6410 Books $20,395 $0 $0 $20,395 $0 2,119$ 18,276$ (0)$
$103,692 $2,500 $2,500 $106,192 $4,016 27,314$ 74,862$ 0$
Group $ transfer in/(transfer out): $2,500
Group change %: 2.4%
Equipment (7000's)
7300 Equipment $3,000 $0 $0 $3,000 $0 -$ 3,000$ -$
$3,000 $0 $0 $3,000 $0 -$ 3,000$ -$
Group $ transfer in/(transfer out): $0
Group change %: 0%
Other Objects (8000's)
8100 Dues, Fees and Memberships $5,771 $0 $0 $5,771 $625 217$ 4,929$ -$
$5,771 $0 $0 $5,771 $625 217$ 4,929$ -$
Group $ transfer in/(transfer out): $0
Group change %: 0.0%
Total: $4,688,702 ($16,613) ($16,613) $4,672,089 $232,023 28,987$ 4,411,079$ (0)$
WESTON PUBLIC SCHOOLS
FINANCIAL REPORT
Aug-15
Period: 2 of 12
13September 21, 2015 - Page 77

Object Account FY Adopted Budget Cumulative Current Report Revised Line FY 2016 FY 2016 FY 2016 FY 2016
Series Budget
Budget
Adjustments
Budget
Adjustments Budget Variance % $ Expended Encumbered Anticipated Balance
Weston High School
Salaries & Wages (1000s)
Certified Staff $5,640,273 $49,700 $49,700 $5,689,973 0.9% $274,740 -$ 5,415,233$ 0$
Non Certified Staff $188,451 $1,155 $1,155 $189,606 0.6% $16,722 -$ 172,884$ (0)$
Overtime $250 $0 $0 $250 $0 -$ 250$ -$
Certified Stipends $129,628 ($2,750) ($2,750) $126,878 -2.1% $0 -$ 126,878$ -$
$5,958,602 $48,105 $48,105 $6,006,707 $291,462 -$ 5,715,245$ 0$
Group $ transfer in/(transfer out): $48,105
Group change %: 0.8%
Professional & Technical Services (3000s)
3308 Police/Fire $1,800 $0 $0 $1,800 $0 -$ 1,800$ -$
3309 Professional Technical Services $6,303 $0 $0 $6,303 $0 1,500$ 4,803$ -$
$8,103 $0 $0 $8,103 $0 1,500$ 6,603$ -$
Group $ transfer in/(transfer out): $0
Group change %: 0.0%
Property Services (4000s)
4302 Equipment Repairs $13,994 $288 $288 $14,282 2.1% $2,828 1,050$ 10,404$ -$
4400 Equipment Rental $1,700 $0 $0 $1,700 $0 -$ 1,700$ -$
$15,694 $288 $288 $15,982 $2,828 1,050$ 12,104$ -$
Group $ transfer in/(transfer out): $288
Group change %: 1.8%
Other Services (5000s)
5100 Regular Transportation $3,000 $0 $0 $3,000 $0 -$ 3,000$ -$
5400 Postage $539 $0 $0 $539 $0 489$ 50$ -$
5501 Printing $13,812 $0 $0 $13,812 $7,235 -$ 6,577$ -$
5800,5802-5880 Travel & Conference $1,890 $0 $0 $1,890 $0 -$ 1,890$ -$
5801 Mileage Reimbursement $1,750 $0 $0 $1,750 $0 -$ 1,750$ -$
5900 Other Purchased Services $900 $0 $0 $900 $0 -$ 900$ -$
$21,891 $0 $0 $21,891 $7,235 489$ 14,167$ -$
Group $ transfer in/(transfer out): $0
Group change %: 0.0%
Supplies & Materials (6000's)
6110 Materials $153,396 ($738) ($738) $152,658 -0.5% $22,136 48,766$ 81,756$ 0$
6120 Office Materials $6,928 $0 $0 $6,928 $62 301$ 6,565$ 0$
6410 Books $43,705 $400 $400 $44,105 0.9% $9,113 21,774$ 13,218$ (0)$
$204,029 ($338) ($338) $203,691 $31,311 70,841$ 101,539$ 0$
Group $ transfer in/(transfer out): ($338)
Group change %: -0.2%
Equipment (7000's)
7300 Equipment $4,500 $0 $0 $4,500 $0 -$ 4,500$ -$
$4,500 $0 $0 $4,500 $0 -$ 4,500$ -$
Group $ transfer in/(transfer out): $0
Group change %: 0%
Other Objects (8000's)
8100 Dues, Fees and Memberships $14,140 $50 $50 $14,190 0.4% $8,930 -$ 5,260$ -$
$14,140 $50 $50 $14,190 $8,930 -$ 5,260$ -$
Group $ transfer in/(transfer out): $50
Group change %: 0.4%
Revenues (9000's)
9209 Parking Fees (30,000)$ -$ $0 (30,000)$ $0 -$ (30,000)$ -$
(30,000.00)$ $0 $0 (30,000.00)$ -$ -$ (30,000)$ -$
WESTON PUBLIC SCHOOLS
FINANCIAL REPORT
Aug-15
Period: 2 of 12
15September 21, 2015 - Page 78

Group $ transfer in/(transfer out): $0
Group change %: 0%
Total: $6,196,959 $48,105 $48,105 $6,245,064 $341,766 73,880$ 5,829,418$ 0$
16September 21, 2015 - Page 79

Object Account FY Adopted Budget Cumulative Current Report Revised Line FY 2016 FY 2016 FY 2016 FY 2016
Series Budget
Budget
Adjustments
Budget
Adjustments Budget Variance % $ Expended Encumbered Anticipated Balance
Athletics
Salaries & Wages (1000s)
Certified Staff $147,895 $0 $0 $147,895 $28,441 -$ 119,454$ (0)$
Non Certified Staff $118,561 ($855) ($855) $117,706 -0.7% $3,992 -$ 113,714$ (0)$
Certified Stipends $341,037 $0 $0 $341,037 $0 -$ 341,037$ -$
$607,493 ($855) ($855) $606,638 $32,434 -$ 574,205$ (1)$
Group $ transfer in/(transfer out): ($855)
Group change %: -0.1%
Professional & Technical Services (3000s)
3239 Other Pupil Services $3,500 $0 $0 $3,500 $0 -$ 3,500$ -$
3308 Police/Fire $4,300 $0 $0 $4,300 $84 2,516$ 1,700$ -$
3310 Sports Officials $45,863 $0 $0 $45,863 $15,000 -$ 30,863$ -$
$53,663 $0 $0 $53,663 $15,084 2,516$ 36,063$ -$
Group $ transfer in/(transfer out): $0
Group change %: 0.0%
Property Services (4000s)
4302 Equipment Repairs $21,604 $0 $0 $21,604 $0 12,000$ 9,604$ -$
4900 Other Property Services $1,000 $0 $0 $1,000 $0 -$ 1,000$ -$
$22,604 $0 $0 $22,604 $0 12,000$ 10,604$ -$
Group $ transfer in/(transfer out): $0
Group change %: 0.0%
Other Services (5000s)
5104 Athletic Transportation $80,429 $0 $0 $80,429 $83 23,617$ 56,729$ -$
5202 Athletic Insurance $19,916 $10,023 $10,023 $29,939 50.3% $29,939 -$ -$ -$
5800,5802-5880 Travel & Conference $2,100 $0 $0 $2,100 $2,100 -$ -$ -$
$102,445 $10,023 $10,023 $112,468 $32,122 23,617$ 56,729$ -$
Group $ transfer in/(transfer out): $10,023
Group change %: 9.8%
Supplies & Materials (6000's)
6110 Materials $56,250 $0 $0 $56,250 $1,628 3,791$ 50,831$ (0)$
$56,250 $0 $0 $56,250 $1,628 3,791$ 50,831$ (0)$
Group $ transfer in/(transfer out): $0
Group change %: 0.0%
Other Objects (8000's)
8100 Dues, Fees and Memberships $15,835 $0 $0 $15,835 $15,000 -$ 835$ -$
8900 Other Objects ($20,000) $0 $0 ($20,000) $0 -$ (20,000)$ -$
($4,165) $0 $0 ($4,165) $15,000 -$ (19,165)$ -$
Group $ transfer in/(transfer out): $0
Group change %: 0.0%
Revenues (9000's)
9201 Participation Fees, Athletics (59,710.00)$ $0 $0 (59,710.00)$ $0 -$ (59,710)$ -$
9202 Gate Receipts, Athletics (15,500.00)$ $0 $0 (15,500.00)$ $0 -$ (15,500)$ -$
(75,210.00)$ $0 $0 (75,210.00)$ -$ -$ (75,210)$ -$
Group $ transfer in/(transfer out): $0
Group change %: 0%
Total: $763,080 $9,168 $9,168 $772,248 $96,267 41,924$ 634,057$ (1)$
WESTON PUBLIC SCHOOLS
FINANCIAL REPORT
Aug-15
Period: 2 of 12
17September 21, 2015 - Page 80

Object Account FY Adopted Budget Cumulative Current Report Revised Line FY 2016 FY 2016 FY 2016 FY 2016
Series Budget
Budget
Adjustments
Budget
Adjustments Budget Variance % $ Expended Encumbered Anticipated Balance
Special Education
Salaries & Wages (1000s)
Certified Staff $3,529,258 $11,333 $11,333 $3,540,591 0.3% $247,878 -$ 3,292,713$ 0$
Non Certified Staff $1,483,373 ($70,486) ($70,486) $1,412,887 -4.8% $131,724 -$ 1,142,168$ 138,995$
$5,012,631 ($59,153) ($59,153) $4,953,478 $379,602 -$ 4,434,881$ 138,995$
Group $ transfer in/(transfer out): ($59,153)
Group change %: -1.2%
Professional & Technical Services (3000s)
3210 Contracted Services Educational $715,970 ($108,500) ($108,500) $607,470 -15.2% $13,268 5,116$ 589,086$ -$
3220/3221 Consulting Services $82,800 $0 $0 $82,800 $0 -$ 82,800$ -$
3235 Testing $48,000 $0 $0 $48,000 $0 -$ 48,000$ -$
3306 Legal Fees $40,000 $0 $0 $40,000 $0 -$ 40,000$ -$
$886,770 ($108,500) ($108,500) $778,270 $13,268 5,116$ 759,886$ -$
Group $ transfer in/(transfer out): ($108,500)
Group change %: -12.2%
Property Services (4000s)
4302 Equipment Repairs $1,250 $0 $0 $1,250 $0 -$ 1,250$ -$
4400 Equipment Rental $1,250 $0 $0 $1,250 $0 -$ 1,250$ -$
$2,500 $0 $0 $2,500 $0 -$ 2,500$ -$
Group $ transfer in/(transfer out): $0
Group change %: 0.0%
Other Services (5000s)
5600 Tuition $1,920,638 $0 $0 $1,920,638 $234,002 247,953$ 1,438,683$ 0$
5801 Mileage Reimbursement $3,000 $0 $0 $3,000 $0 -$ 3,000$ -$
$1,923,638 $0 $0 $1,923,638 $234,002 247,953$ 1,441,683$ 0$
Group $ transfer in/(transfer out): $0
Group change %: 0.0%
Supplies & Materials (6000's)
6110 Materials $36,631 $0 $0 $36,631 $4,438 8,121$ 24,071$ 0$
6120 Office Materials $719 $0 $0 $719 $0 -$ 719$ -$
6410 Books $5,900 $0 $0 $5,900 $345 -$ 5,555$ (0)$
$43,250 $0 $0 $43,250 $4,784 8,121$ 30,345$ (0)$
Group $ transfer in/(transfer out): $0
Group change %: 0.0%
Equipment (7000's)
7300 Equipment $15,000 $0 $0 $15,000 $38 590$ 14,372$ 0$
$15,000 $0 $0 $15,000 $38 590$ 14,372$ 0$
Group $ transfer in/(transfer out): $0
Group change %: 0%
Other Objects (8000's)
8100 Dues, Fees and Memberships $2,000 $0 $0 $2,000 $20 -$ 1,980$ -$
$2,000 $0 $0 $2,000 $20 -$ 1,980$ -$
Group $ transfer in/(transfer out): $0
Group change %: 0.0%
Revenues (9000's)
9205 Excess Cost SPED (764,946.00)$ $0 $0 (764,946.00)$ $0 -$ (764,946)$ -$
9206 Pre School Tuition SPED (82,500.00)$ $0 $0 (82,500.00)$ ($27,356) -$ (55,144)$ (0)$
(847,446.00)$ $0 $0 (847,446.00)$ (27,355.55)$ -$ (820,090)$ (0)$
Group $ transfer in/(transfer out): $0
Group change %: 0%
Total: $7,038,343 ($167,653) ($167,653) $6,870,690 $604,359 261,780$ 5,865,557$ 138,995$
WESTON PUBLIC SCHOOLS
FINANCIAL REPORT
Aug-15
Period: 2 of 12
19September 21, 2015 - Page 81

Object Account FY Adopted Budget Cumulative Current Report Revised Line FY 2016 FY 2016 FY 2016 FY 2016
Series Budget
Budget
Adjustments
Budget
Adjustments Budget Variance % $ Expended Encumbered Anticipated Balance
Pupil Services
Salaries & Wages (1000s)
Certified Staff $1,598,511 ($24,784) ($24,784) $1,573,727 -1.6% $88,460 -$ 1,485,267$ -$
Non Certified Staff $694,273 $1,449 $1,449 $695,722 0.2% $45,672 -$ 650,050$ -$
Certified Stipends $28,860 $0 $0 $28,860 $1,110 -$ 27,750$ -$
Non Certified Stipends $19,340 $0 $0 $19,340 $878 -$ 18,462$ (0)$
$2,340,984 ($23,335) ($23,335) $2,317,649 $136,120 -$ 2,181,529$ (0)$
Group $ transfer in/(transfer out): ($23,335)
Group change %: -1.0%
Professional & Technical Services (3000s)
3239 Other Pupil Services $198,165 $0 $0 $198,165 $4,014 132$ 194,019$ -$
$198,165 $0 $0 $198,165 $4,014 132$ 194,019$ -$
Group $ transfer in/(transfer out): $0
Group change %: 0.0%
Property Services (4000s)
4302 Equipment Repairs $1,075 $0 $0 $1,075 $524 -$ 551$ -$
$1,075 $0 $0 $1,075 $524 -$ 551$ -$
Group $ transfer in/(transfer out): $0
Group change %: 0.0%
Other Services (5000s)
5400 Postage $2,000 $0 $0 $2,000 $0 2,000$ -$ -$
5501 Printing $4,600 $0 $0 $4,600 $0 -$ 4,600$ -$
5801 Mileage Reimbursement $100 $0 $0 $100 $0 -$ 100$ -$
$6,700 $0 $0 $6,700 $0 2,000$ 4,700$ -$
Group $ transfer in/(transfer out): $0
Group change %: 0.0%
Supplies & Materials (6000's)
6110 Materials $13,600 $0 $0 $13,600 $2,312 4,742$ 6,546$ 0$
$13,600 $0 $0 $13,600 $2,312 4,742$ 6,546$ 0$
Group $ transfer in/(transfer out): $0
Group change %: 0.0%
Other Objects (8000's)
8100 Dues, Fees and Memberships $575 $0 $0 $575 $0 -$ 575$ -$
$575 $0 $0 $575 $0 -$ 575$ -$
Group $ transfer in/(transfer out): $0
Group change %: 0.0%
Total: $2,561,099 ($23,335) ($23,335) $2,537,764 $142,970 6,874$ 2,387,920$ (0)$
WESTON PUBLIC SCHOOLS
FINANCIAL REPORT
Aug-15
Period: 2 of 12
21September 21, 2015 - Page 82

Object Account FY Adopted Budget Cumulative Current Report Revised Line FY 2016 FY 2016 FY 2016 FY 2016
Series Budget
Budget
Adjustments
Budget
Adjustments Budget Variance % $ Expended Encumbered Anticipated Balance
Curriculum & Instruction
Salaries & Wages (1000s)
Certified Staff $767,609 ($10,764) ($10,764) $756,845 -1.4% $108,166 -$ 648,679$ 0$
Non Certified Staff $59,594 $0 $0 $59,594 $11,460 -$ 48,134$ (0)$
Certified Stipends $85,625 ($4,000) ($4,000) $81,625 -4.7% $3,201 -$ 75,424$ 3,000$
$912,828 ($14,764) ($14,764) $898,064 $122,827 -$ 772,237$ 3,000$
Group $ transfer in/(transfer out): ($14,764)
Group change %: -1.6%
Professional & Technical Services (3000s)
3210 Contracted Services Educational $7,815 $0 $0 $7,815 $0 -$ 7,815$ -$
3220/3221 Consulting Services $60,500 $0 $0 $60,500 $20,000 -$ 40,500$ -$
3235 Testing $37,000 $0 $0 $37,000 $18,850 4,880$ 13,270$ 0$
$105,315 $0 $0 $105,315 $38,850 4,880$ 61,585$ 0$
Group $ transfer in/(transfer out): $0
Group change %: 0.0%
Property Services (4000s)
Other Services (5000s)
5800,5802-5880 Travel & Conference $47,130 $4,000 $4,000 $51,130 8.5% $10,062 8,643$ 32,426$ (0)$
5801 Mileage Reimbursement $6,000 $0 $0 $6,000 $1,000 -$ 5,000$ -$
5900 Other Purchased Services $8,450 $0 $0 $8,450 $0 5,500$ 2,950$ -$
$61,580 $4,000 $4,000 $65,580 $11,062 14,143$ 40,376$ (0)$
Group $ transfer in/(transfer out): $4,000
Group change %: 6.5%
Supplies & Materials (6000's)
6110 Materials $1,450 $0 $0 $1,450 $0 659$ 791$ -$
6120 Office Materials $5,825 $0 $0 $5,825 $352 1,648$ 3,825$ -$
6410 Books $58,665 ($19,908) ($19,908) $38,757 -33.9% $15,111 12,513$ 11,133$ 0$
$65,940 ($19,908) ($19,908) $46,032 $15,464 14,819$ 15,749$ 0$
Group $ transfer in/(transfer out): ($19,908)
Group change %: -30.2%
Equipment (7000's)
7300 Equipment $2,500 ($2,500) ($2,500) $0 -100.0% $0 -$ -$ -$
$2,500 ($2,500) ($2,500) $0 $0 -$ -$ -$
Group $ transfer in/(transfer out): ($2,500)
Group change %: -100%
Other Objects (8000's)
8100 Dues, Fees and Memberships $21,655 $0 $0 $21,655 $1,524 19,735$ 396$ -$
$21,655 $0 $0 $21,655 $1,524 19,735$ 396$ -$
Group $ transfer in/(transfer out): $0
Group change %: 0.0%
Total: $1,169,818 ($33,172) ($33,172) $1,136,646 $189,726 53,577$ 890,343$ 3,000$
WESTON PUBLIC SCHOOLS
FINANCIAL REPORT
Aug-15
Period: 2 of 12
23September 21, 2015 - Page 83

Object Account FY Adopted Budget Cumulative Current Report Revised Line FY 2016 FY 2016 FY 2016 FY 2016
Series Budget
Budget
Adjustments
Budget
Adjustments Budget Variance % $ Expended Encumbered Anticipated Balance
Technology
Salaries & Wages (1000s)
Certified Staff $160,998 ($11,676) ($11,676) $149,322 -7.3% $4,606 -$ 144,716$ (0)$
Non Certified Staff $551,234 $3,459 $3,459 $554,693 0.6% $84,440 -$ 470,253$ (0)$
Overtime $6,120 ($2,800) ($2,800) $3,320 -45.8% $0 -$ 3,320$ -$
$718,352 ($11,017) ($11,017) $707,335 $89,047 -$ 618,289$ (1)$
Group $ transfer in/(transfer out): ($11,017)
Group change %: -1.5%
Professional & Technical Services (3000s)
3220/3221 Consulting Services $33,600 $0 $0 $33,600 $5,600 28,000$ -$ -$
3309 Professional Technical Services $18,750 $0 $0 $18,750 $4,007 14,705$ 38$ -$
$52,350 $0 $0 $52,350 $9,607 42,705$ 38$ -$
Group $ transfer in/(transfer out): $0
Group change %: 0.0%
Property Services (4000s)
4302 Equipment Repairs $15,000 $0 $0 $15,000 $0 2,838$ 12,162$ (0)$
4400 Equipment Rental $372,001 $0 $0 $372,001 $0 -$ 372,001$ -$
$387,001 $0 $0 $387,001 $0 2,838$ 384,163$ (0)$
Group $ transfer in/(transfer out): $0
Group change %: 0.0%
Other Services (5000s)
5300 Communications $148,820 $0 $0 $148,820 $26,239 135$ 122,446$ 0$
5801 Mileage Reimbursement $3,000 $0 $0 $3,000 $500 -$ 2,500$ -$
$151,820 $0 $0 $151,820 $26,739 135$ 124,946$ 0$
Group $ transfer in/(transfer out): $0
Group change %: 0.0%
Supplies & Materials (6000's)
6110 Materials $27,250 $0 $0 $27,250 $824 500$ 25,926$ (0)$
6140 Software $342,985 $0 $0 $342,985 $201,931 17,907$ 123,147$ (0)$
$370,235 $0 $0 $370,235 $202,755 18,407$ 149,073$ (0)$
Group $ transfer in/(transfer out): $0
Group change %: 0.0%
Revenues (9000's)
9200 Technology Revenue (45,000.00)$ $0 $0 (45,000.00)$ $0 -$ (45,000)$ -$
(45,000.00)$ $0 $0 (45,000.00)$ -$ -$ (45,000)$ -$
Group $ transfer in/(transfer out): $0
Group change %: 0%
Total: $1,634,758 ($11,017) ($11,017) $1,623,741 $328,147 64,085$ 1,231,509$ (1)$
WESTON PUBLIC SCHOOLS
FINANCIAL REPORT
Aug-15
Period: 2 of 12
25September 21, 2015 - Page 84

Object Account FY Adopted Budget Cumulative Current Report Revised Line FY 2016 FY 2016 FY 2016 FY 2016
Series Budget
Budget
Adjustments
Budget
Adjustments Budget Variance % $ Expended Encumbered Anticipated Balance
Security
Salaries & Wages (1000s)
Non Certified Staff $311,798 $0 $0 $311,798 $14,173 -$ 297,625$ 0$
Overtime $20,000 $0 $0 $20,000 $0 -$ 20,000$ -$
Non Certified Stipends $24,000 $0 $0 $24,000 $157 -$ 23,843$ 0$
$355,798 $0 $0 $355,798 $14,329 -$ 341,468$ 1$
Group $ transfer in/(transfer out): $0
Group change %: 0.0%
Professional & Technical Services (3000s)
3308 Police/Fire $77,682 $0 $0 $77,682 $0 -$ 77,682$ -$
$77,682 $0 $0 $77,682 $0 -$ 77,682$ -$
Group $ transfer in/(transfer out): $0
Group change %: 0.0%
Property Services (4000s)
4701 Security System Monitoring $20,040 $0 $0 $20,040 $5,010 15,030$ -$ -$
$20,040 $0 $0 $20,040 $5,010 15,030$ -$ -$
Group $ transfer in/(transfer out): $0
Group change %: 0.0%
Supplies & Materials (6000's)
6110 Materials $5,500 $0 $0 $5,500 $3,849 288$ 1,363$ 0$
$5,500 $0 $0 $5,500 $3,849 288$ 1,363$ 0$
Group $ transfer in/(transfer out): $0
Group change %: 0.0%
Total: $459,020 $0 $0 $459,020 $23,188 15,318$ 420,513$ 1$
WESTON PUBLIC SCHOOLS
FINANCIAL REPORT
Aug-15
Period: 2 of 12
27September 21, 2015 - Page 85

Object Account FY Adopted Budget Cumulative Current Report Revised Line FY 2016 FY 2016 FY 2016 FY 2016
Series Budget
Budget
Adjustments
Budget
Adjustments Budget Variance % $ Expended Encumbered Anticipated Balance
District Administration
Salaries & Wages (1000s)
Certified Staff $604,050 $6,112 $6,112 $610,162 1.0% $111,847 -$ 498,315$ 0$
Non Certified Staff $353,489 $66,413 $66,413 $419,902 18.8% $68,107 -$ 351,795$ (0)$
Overtime $1,000 $0 $0 $1,000 $88 -$ 912$ (0)$
Non Certified Stipends $6,000 $0 $0 $6,000 $1,000 -$ 5,000$ -$
$964,539 $72,525 $72,525 $1,037,064 $181,042 -$ 856,022$ 0$
Group $ transfer in/(transfer out): $72,525
Group change %: 7.5%
Professional & Technical Services (3000s)
3303 Management Services $19,500 $0 $0 $19,500 $500 -$ 19,000$ -$
3306 Legal Fees $50,000 $0 $0 $50,000 $991 35,000$ 14,009$ -$
3309 Professional Technical Services $20,000 $0 $0 $20,000 $1,508 5,000$ 13,492$ (0)$
$89,500 $0 $0 $89,500 $2,999 40,000$ 46,501$ (0)$
Group $ transfer in/(transfer out): $0
Group change %: 0.0%
Property Services (4000s)
4302 Equipment Repairs $750 $0 $0 $750 $0 -$ 750$ -$
$750 $0 $0 $750 $0 -$ 750$ -$
Group $ transfer in/(transfer out): $0
Group change %: 0.0%
Other Services (5000s)
5400 Postage $2,500 $0 $0 $2,500 $339 1,886$ 275$ -$
5500 Advertising $7,000 $0 $0 $7,000 $342 252$ 6,406$ -$
5501 Printing $1,250 $0 $0 $1,250 $428 -$ 822$ -$
5801 Mileage Reimbursement $10,500 $0 $0 $10,500 $1,000 109$ 5,891$ 3,500$
$21,250 $0 $0 $21,250 $2,109 2,247$ 13,394$ 3,500$
Group $ transfer in/(transfer out): $0
Group change %: 0.0%
Supplies & Materials (6000's)
6120 Office Materials $15,847 $0 $0 $15,847 $1,770 3,290$ 10,787$ (0)$
$15,847 $0 $0 $15,847 $1,770 3,290$ 10,787$ (0)$
Group $ transfer in/(transfer out): $0
Group change %: 0.0%
Other Objects (8000's)
8100 Dues, Fees and Memberships $30,020 $0 $0 $30,020 $26,260 875$ 2,885$ -$
8900 Other Objects $6,895 $0 $0 $6,895 $2,201 1,922$ 2,772$ (0)$
$36,915 $0 $0 $36,915 $28,461 2,797$ 5,657$ (0)$
Group $ transfer in/(transfer out): $0
Group change %: 0.0%
Total: $1,128,801 $72,525 $72,525 $1,201,326 $216,382 48,334$ 933,111$ 3,499$
WESTON PUBLIC SCHOOLS
FINANCIAL REPORT
Aug-15
Period: 2 of 12
28September 21, 2015 - Page 86

Object Account FY Adopted Budget Cumulative Current Report Revised Line FY 2016 FY 2016 FY 2016 FY 2016
Series Budget
Budget
Adjustments
Budget
Adjustments Budget Variance % $ Expended Encumbered Anticipated Balance
Facilities
Salaries & Wages (1000s)
Non Certified Staff $1,218,553 ($106,517) ($106,517) $1,112,036 -8.7% $165,970 -$ 946,066$ (0)$
Overtime $115,000 $0 $0 $115,000 $18,931 -$ 96,069$ (0)$
Non Certified Stipends $67,469 ($7,296) ($7,296) $60,173 -10.8% $6,786 -$ 53,387$ -$
$1,401,022 ($113,813) ($113,813) $1,287,209 $191,687 -$ 1,095,522$ (0)$
Group $ transfer in/(transfer out): ($113,813)
Group change %: -8.1%
Professional & Technical Services (3000s)
3304 License Fees-Facilities $2,800 $0 $0 $2,800 $0 -$ 2,800$ -$
3309 Professional Technical Services $4,250 $0 $0 $4,250 $0 -$ 4,250$ -$
$7,050 $0 $0 $7,050 $0 -$ 7,050$ -$
Group $ transfer in/(transfer out): $0
Group change %: 0.0%
Property Services (4000s)
4200 Cleaning Services $585,245 $0 $0 $585,245 $48,275 531,907$ 5,063$ (0)$
4202 Rubbish Removal $74,475 $0 $0 $74,475 $2,123 69,877$ 2,475$ -$
4203 Mop & Mat Service $5,000 $0 $0 $5,000 $0 5,000$ -$ -$
4204 Exterminator $8,000 $0 $0 $8,000 $0 7,500$ 500$ -$
4302 Equipment Repairs $61,518 $0 $0 $61,518 $11,464 12,552$ 37,502$ 0$
4400 Equipment Rental $21,110 $0 $0 $21,110 $0 7,604$ 13,506$ (0)$
4401 Rental of Facilities $17,492 $0 $0 $17,492 $490 2,010$ 14,992$ -$
4500 Repair Allowance $132,000 ($3,000) ($3,000) $129,000 -2.3% $0 28,104$ 100,896$ 0$
4510 Asbestos Abatement $5,000 $0 $0 $5,000 $0 -$ 5,000$ -$
4511 Elevator Contract $13,480 $0 $0 $13,480 $1,647 8,871$ 2,962$ -$
4512 Emergency Lights $11,570 $0 $0 $11,570 $5,909 -$ 5,661$ 0$
4513 Generator Contract $10,377 $0 $0 $10,377 $0 3,000$ 7,377$ -$
4514 Fire Alarm System $33,929 $0 $0 $33,929 $14,309 7,113$ 12,507$ -$
4515 Fire Protection System $8,926 $0 $0 $8,926 $2,595 1,000$ 5,331$ -$
4516 UST Testing $6,996 $0 $0 $6,996 $0 -$ 6,996$ -$
4517 Sprinkler System $4,858 $0 $0 $4,858 $0 4,648$ 210$ -$
4518 Sewer System Plant Maintenance $130,814 $0 $0 $130,814 $9,651 102,425$ 18,738$ -$
4530 Parks & Recreation $56,350 $0 $0 $56,350 $0 -$ 56,350$ -$
4531 Drain System $5,575 $0 $0 $5,575 $0 -$ 5,575$ -$
4533 Glass Replacement $3,000 $0 $0 $3,000 $650 850$ 1,500$ -$
4534 Roof Repair $5,000 $3,000 $3,000 $8,000 60.0% $7,739 -$ 261$ (0)$
4535 Window Treatments $3,000 $0 $0 $3,000 $0 -$ 3,000$ -$
4536 Air Filter HVAC System $3,500 $0 $0 $3,500 $0 2,063$ 1,438$ (1)$
4538 Chiller Contract $10,600 $25,000 $25,000 $35,600 235.8% $861 9,556$ 25,183$ 0$
4539 Energy Management System $27,500 $0 $0 $27,500 $19,624 -$ 7,876$ -$
4540 Athletic Facilities Repairs $6,000 $0 $0 $6,000 $0 -$ 6,000$ -$
4542 Contracted Services $8,400 $0 $0 $8,400 $0 -$ 8,400$ -$
4543 Paving $5,000 $0 $0 $5,000 $0 -$ 5,000$ -$
4600 Special Projects $60,304 $19,908 $19,908 $80,212 33.0% $35,413 9,531$ 35,268$ 0$
4602 Tree Service $11,000 $0 $0 $11,000 $0 -$ 11,000$ -$
4603 Exterior Lighting $2,800 $0 $0 $2,800 $0 -$ 2,800$ -$
4604 Snow Plowing $12,500 $0 $0 $12,500 $0 -$ 12,500$ -$
4605 Signage $2,500 $0 $0 $2,500 $0 -$ 2,500$ -$
4606 Sprinkler Repairs $3,000 $0 $0 $3,000 $0 -$ 3,000$ -$
4607 Storm Draining $1,000 $0 $0 $1,000 $0 -$ 1,000$ -$
4608 Trucking Services $2,000 $0 $0 $2,000 $0 -$ 2,000$ -$
4610 Playground Repairs $2,200 $0 $0 $2,200 $0 -$ 2,200$ -$
4702 Locks/Keys $6,000 $0 $0 $6,000 $0 2,953$ 3,047$ -$
4705 United Alarm $500 $0 $0 $500 $0 500$ -$ -$
$1,368,519 $44,908 $44,908 $1,413,427 $160,751 817,063$ 435,614$ (0)$
WESTON PUBLIC SCHOOLS
FINANCIAL REPORT
Aug-15
Period: 2 of 12
30September 21, 2015 - Page 87

Object Account FY Adopted Budget Cumulative Current Report Revised Line FY 2016 FY 2016 FY 2016 FY 2016
Series Budget
Budget
Adjustments
Budget
Adjustments Budget Variance % $ Expended Encumbered Anticipated Balance
WESTON PUBLIC SCHOOLS
FINANCIAL REPORT
Aug-15
Period: 2 of 12
Group $ transfer in/(transfer out): $44,908
Group change %: 3.3%
Other Services (5000s)
5205 Property Insurance $102,160 $0 $0 $102,160 $0 -$ 102,160$ -$
5801 Mileage Reimbursement $3,000 $0 $0 $3,000 $500 -$ 2,500$ -$
5900 Other Purchased Services $2,000 ($1,000) ($1,000) $1,000 -50.0% $0 -$ 1,000$ -$
$107,160 ($1,000) ($1,000) $106,160 $500 -$ 105,660$ -$
Group $ transfer in/(transfer out): ($1,000)
Group change %: -0.9%
Supplies & Materials (6000's)
6110 Materials $182,644 $0 $0 $182,644 $16,018 40,523$ 126,104$ (0)$
6131 Custodial Materials $78,061 $0 $0 $78,061 $15,808 19,753$ 42,500$ 0$
6510 Heating Oil $466,479 $0 $0 $466,479 $5,516 -$ 460,963$ 0$
6520 Electricity $727,800 $0 $0 $727,800 $24,021 -$ 703,779$ 0$
6530 Propane gas $3,500 $0 $0 $3,500 $60 2,940$ 500$ -$
$1,458,484 $0 $0 $1,458,484 $61,422 63,215$ 1,333,846$ 0$
Group $ transfer in/(transfer out): $0
Group change %: 0.0%
Other Objects (8000's)
8100 Dues, Fees and Memberships $480 $1,000 $1,000 $1,480 208.3% $0 750$ 730$ -$
8900 Other Objects $15,000 $0 $0 $15,000 $0 -$ 15,000$ -$
$15,480 $1,000 $1,000 $16,480 $0 750$ 15,730$ -$
Group $ transfer in/(transfer out): $1,000
Group change %: 6.5%
Revenues (9000's)
9208 Revenue from Town for Fields (39,590.00)$ $0 $0 (39,590.00)$ $0 -$ (39,590)$ -$
(39,590.00)$ $0 $0 (39,590.00)$ -$ -$ (39,590)$ -$
Group $ transfer in/(transfer out): $0
Group change %: 0%
Total: $4,318,125 ($68,905) ($68,905) $4,249,220 $414,360 881,028$ 2,953,832$ (0)$
31September 21, 2015 - Page 88
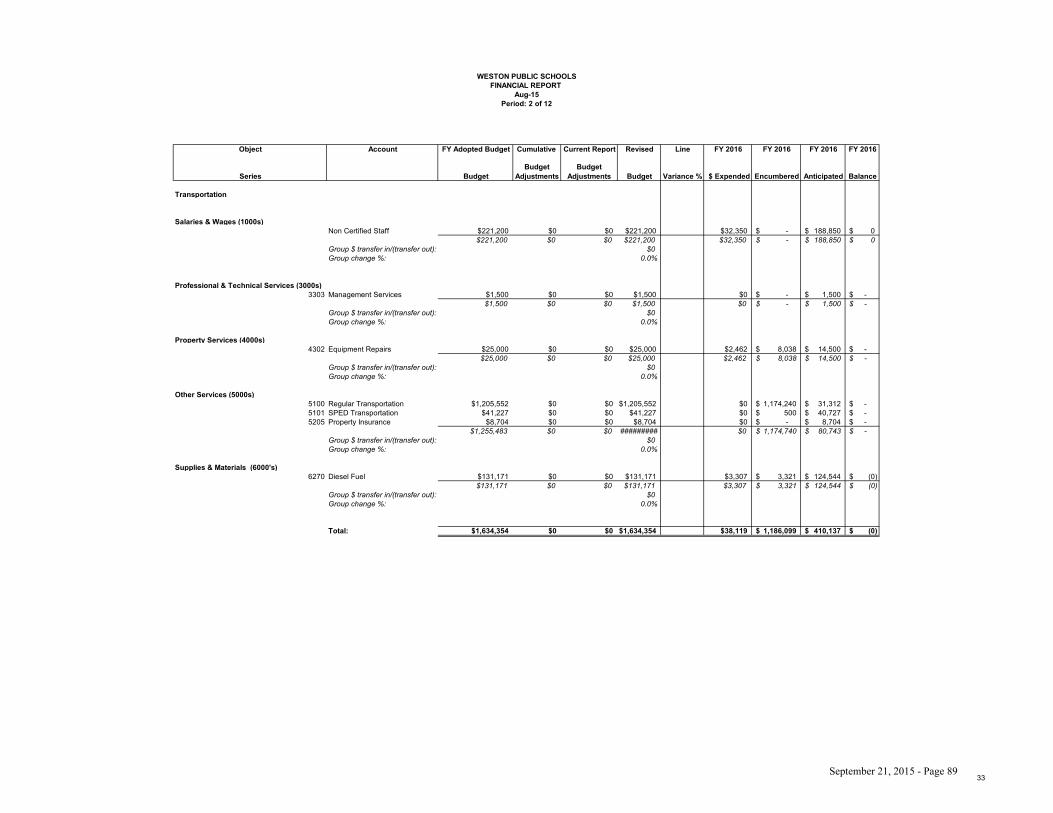
Object Account FY Adopted Budget Cumulative Current Report Revised Line FY 2016 FY 2016 FY 2016 FY 2016
Series Budget
Budget
Adjustments
Budget
Adjustments Budget Variance % $ Expended Encumbered Anticipated Balance
Transportation
Salaries & Wages (1000s)
Non Certified Staff $221,200 $0 $0 $221,200 $32,350 -$ 188,850$ 0$
$221,200 $0 $0 $221,200 $32,350 -$ 188,850$ 0$
Group $ transfer in/(transfer out): $0
Group change %: 0.0%
Professional & Technical Services (3000s)
3303 Management Services $1,500 $0 $0 $1,500 $0 -$ 1,500$ -$
$1,500 $0 $0 $1,500 $0 -$ 1,500$ -$
Group $ transfer in/(transfer out): $0
Group change %: 0.0%
Property Services (4000s)
4302 Equipment Repairs $25,000 $0 $0 $25,000 $2,462 8,038$ 14,500$ -$
$25,000 $0 $0 $25,000 $2,462 8,038$ 14,500$ -$
Group $ transfer in/(transfer out): $0
Group change %: 0.0%
Other Services (5000s)
5100 Regular Transportation $1,205,552 $0 $0 $1,205,552 $0 1,174,240$ 31,312$ -$
5101 SPED Transportation $41,227 $0 $0 $41,227 $0 500$ 40,727$ -$
5205 Property Insurance $8,704 $0 $0 $8,704 $0 -$ 8,704$ -$
$1,255,483 $0 $0 ######### $0 1,174,740$ 80,743$ -$
Group $ transfer in/(transfer out): $0
Group change %: 0.0%
Supplies & Materials (6000's)
6270 Diesel Fuel $131,171 $0 $0 $131,171 $3,307 3,321$ 124,544$ (0)$
$131,171 $0 $0 $131,171 $3,307 3,321$ 124,544$ (0)$
Group $ transfer in/(transfer out): $0
Group change %: 0.0%
Total: $1,634,354 $0 $0 $1,634,354 $38,119 1,186,099$ 410,137$ (0)$
WESTON PUBLIC SCHOOLS
FINANCIAL REPORT
Aug-15
Period: 2 of 12
33September 21, 2015 - Page 89

Object Account FY Adopted Budget Cumulative Current Report Revised Line FY 2016 YTD FY 2016 FY 2016 FY 2016
Series Budget
Budget
Adjustments
Budget
Adjustments Budget Variance % $ Expended % Expended Encumbered Anticipated Balance
District Wide
Salaries & Wages (1000s)
Certified Staff $132,120 ($68,600) ($68,600) $63,520 -51.9% $0 0.0% -$ 63,520$ -$
Turnover Savings ($193,600) $193,600 $193,600 $0 -100.0% $0 0.0% -$ -$ -$
Salary Differential $193,250 ($35,986) ($35,986) $157,264 -18.6% $0 0.0% -$ 157,264$ -$
$131,770 $89,014 $89,014 ####### $0 0.0% -$ 220,784$ -$
Group $ transfer in/(transfer out): $89,014
Group change %: 67.6%
Other Services (5000s)
5200 General Liability Insurance $85,433 $0 $0 $85,433 $0 0.0% -$ 85,433$ -$
$85,433 $0 $0 $85,433 $0 0.0% -$ 85,433$ -$
Group $ transfer in/(transfer out): $0
Group change %: 0.0%
Revenues (9000's)
9207 Regular Ed. Tuition -$ $0 $0 -$ ($13,561) 0.0% -$ 13,561$ -$
-$ $0 $0 -$ ######### 0.0% -$ 13,561$ -$
Group $ transfer in/(transfer out): $0
Group change %: 0.0%
Total: $217,203 $89,014 $89,014 $306,217 ($13,561) -4.4% -$ 319,778$ -$
WESTON PUBLIC SCHOOLS
FINANCIAL REPORT
Aug-15
Period: 2 of 12
35September 21, 2015 - Page 90

Object Account FY Adopted Budget Cumulative Current Report Revised Line FY 2016 FY 2016 FY 2016 FY 2016
Series Budget
Budget
Adjustments
Budget
Adjustments Budget Variance % $ Expended Encumbered Anticipated Balance
Employee Benefits
Benefits (2000's)
2000 Health Insurance $6,991,965 $0 $0 $6,991,965 $1,165,328 -$ 5,826,637$ -$
2001 Social Security $507,618 $0 $0 $507,618 $55,865 -$ 451,752$ 0$
2002 Medicare $436,781 ($1,359) ($1,359) $435,422 -0.3% $29,660 -$ 405,762$ (0)$
2003 Workers Compensation $226,043 ($10,023) ($10,023) $216,020 -4.4% $216,020 -$ -$ -$
2004 Unemployment Compensation $68,000 $0 $0 $68,000 $5,078 -$ 62,922$ -$
2005 Early Retirement Incentive $4,759 $0 $0 $4,759 $4,758 -$ -$ 1$
2007 Pension Contributions $834,052 $0 $0 $834,052 $81,141 -$ 752,911$ 0$
2010 Tuition Reimbursement $75,000 $0 $0 $75,000 $0 -$ 75,000$ -$
2011 Life Insurance $88,495 $0 $0 $88,495 $16,886 -$ 71,609$ 0$
2012 Disability Insurance $18,086 $0 $0 $18,086 $0 -$ 18,086$ -$
2014 Sick Bank $45,000 $0 $0 $45,000 $0 -$ 45,000$ -$
2015 GASB 43/45 $209,000 $0 $0 $209,000 $0 -$ 209,000$ -$
$9,504,799 ($11,382) ($11,382) $9,493,417 $1,574,736 -$ 7,918,679$ 2$
Group $ transfer in/(transfer out): ($11,382)
Group change %: -0.1%
Professional & Technical Services (3000s)
3303 Management Services $6,895 $0 $0 $6,895 $4,366 400$ 2,129$ -$
$6,895 $0 $0 $6,895 $4,366 400$ 2,129$ -$
Group $ transfer in/(transfer out): $0
Group change %: 0.0%
Property Services (4000s)
Total: $9,511,694 ($11,382) ($11,382) $9,500,312 $1,579,102 400$ 7,920,808$ 2$
WESTON PUBLIC SCHOOLS
FINANCIAL REPORT
Aug-15
Period: 2 of 12
36September 21, 2015 - Page 91

Object Account FY Adopted Budget Cumulative Current Report Revised Line FY 2016 FY 2016 FY 2016 FY 2016
Series Budget
Budget
Adjustments
Budget
Adjustments Budget Variance % $ Expended Encumbered Anticipated Balance
Copy Center
Salaries & Wages (1000s)
Non Certified Staff $61,113 $744 $744 $61,857 1.2% $1,343 -$ 60,514$ (0)$
$61,113 $744 $744 $61,857 $1,343 -$ 60,514$ (0)$
Group $ transfer in/(transfer out): $744
Group change %: 1.2%
Property Services (4000s)
4400 Equipment Rental $127,767 $0 $0 $127,767 $19,678 74,107$ 33,982$ 0$
$127,767 $0 $0 $127,767 $19,678 74,107$ 33,982$ 0$
Group $ transfer in/(transfer out): $0
Group change %: 0.0%
Other Services (5000s)
5400 Postage $18,070 $0 $0 $18,070 $0 1,872$ 16,198$ (0)$
$18,070 $0 $0 $18,070 $0 1,872$ 16,198$ (0)$
Group $ transfer in/(transfer out): $0
Group change %: 0.0%
Supplies & Materials (6000's)
6110 Materials $14,162 $0 $0 $14,162 $4,197 303$ 9,662$ -$
$14,162 $0 $0 $14,162 $4,197 303$ 9,662$ -$
Group $ transfer in/(transfer out): $0
Group change %: 0.0%
Total: $221,112 $744 $744 $221,856 $25,218 76,282$ 120,356$ (0)$
WESTON PUBLIC SCHOOLS
FINANCIAL REPORT
Aug-15
Period: 2 of 12
37September 21, 2015 - Page 92

Fiscal Year Ended Actual 2016
STATEMENT OF REVENUES AND EXPENDITURES
Fund Balance -July 1, 2015 2,023,677$
Revenues:
General Fund Appropriation (July-June) 1,165,328$
Contributions:
Employee Cost Sharing -$
Retiree/COBRA Contributions 102,877$
State Teachers Retirement Reimbursement (TRB) 13,442$
Stop Loss Settlement -$
Total Contributions 116,319$
Total Revenues (A) 1,281,647$
Expenditures
Aetna Medical & RX:
Claims 921,531$
Administrative Fees 19,167$
Stop Loss 76,881$
District Portion of H.S.A. Deductible 228,410$
Delta Dental:
Claims 63,044$
Administrative Fees 1,804$
Affordable Care Act Taxes 1,794$
EAP 1,943$
Medical/Supplement/Other Costs 4,901$
Total Health Plan Costs (B) 1,319,475$
Net Change (A-B) (37,828)$
Fund balance June 30, 2016 1,985,849$
WESTON PUBLIC SCHOOLS
INTERNAL SERVICES FUND
FOR HEALTH BENEFITS PROGRAM
38September 21, 2015 - Page 93

WESTON PUBLIC SCHOOLS
INSURANCE FUNDS
Month Expected Claims Actual Claims
% of Total
Actuals Claims
Cumulative Total
of Actual Claims
%
Anticipated
Cumulative
Expected Claims Variance Expected Claims Actual Claims % of Total Variance
Jul-15 599,245$ 532,917$ 58% 58% 8% 66,328$ 33,292$ 34,556$ 55% (1,264)$
Aug-15 599,245$ 388,614$ 42% 100% 17% 210,631$ 33,292$ 28,488$ 45% 4,804$
Sep-15 599,245$ 0% 100% 25% 599,245$ 33,292$ 0% 33,292$
Oct-15 599,245$ 0% 100% 33% 599,245$ 33,292$ 0% 33,292$
Nov-15 599,245$ 0% 100% 42% 599,245$ 33,292$ 0% 33,292$
Dec-15 599,245$ 0% 100% 50% 599,245$ 33,292$ 0% 33,292$
Jan-16 599,245$ 0% 100% 58% 599,245$ 33,292$ 0% 33,292$
Feb-16 599,245$ 0% 100% 67% 599,245$ 33,292$ 0% 33,292$
Mar-16 599,245$ 0% 100% 75% 599,245$ 33,292$ 0% 33,292$
Apr-16 599,245$ 0% 100% 83% 599,245$ 33,292$ 0% 33,292$
May-16 599,245$ 0% 100% 92% 599,245$ 33,292$ 0% 33,292$
Jun-16 599,245$ 0% 100% 100% 599,245$ 33,292$ 0% 33,292$
Total 7,190,943$ 921,531$ 100% 200% 108% 6,269,412$ 399,500$ 63,044$ 100% 336,456$
Medical and RX Delta Dental
39September 21, 2015 - Page 94

Expected Claims = $559,245 per month
$532,917
$388,614
$-
$100,000
$200,000
$300,000
$400,000
$500,000
$600,000
$700,000
Jul-15 Aug-15 Sep-15 Oct-15 Nov-15 Dec-15 Jan-16 Feb-16 Mar-16 Apr-16 May-16 Jun-16
Medical and Rx Claims
Actual Claims
Expected Claims
40September 21, 2015 - Page 95

WESTON PUBLIC SCHOOLS REPORT September 21, 2015
Weston High School Lisa Deorio, Principal
In this issue… Principal’s Update
Academic Programs
Co-Curricular Programs
Alumni News
Principal’s Update
The first four weeks of school were incredibly busy. Freshmen and new students became familiar with
their class schedules at our orientation, the entire school community participated in the annual Trojan
Kick Off, and our club advisors hosted a club fair last week. Fall sports are underway and Company
has casted its fall production You Can’t Take It With You. I encourage students to get involved with
our co-curricular program.
This summer I received some wonderful news and am very proud to announce that senior Eric
Benninghoff has been selected to the 2015-2016 State Student Advisory Council on Education. This
council gives students a voice and shares their persepctive on key issues with the State Board of
Education. We are fortunate to have Eric representing our community in this role.
One of our district and school commitments is to continually promote a positive learning environment
for our students and staff. The following is a list that highlights some of our different prgrams and
initiatives in this area.
No homework or tests due immediately following vacations and religious holidays;
Monthly Blue and Gold Fridays;
Relaxation exercises before PE classes;
Daily announcements emailed to all students and staff in addition to posting in the “T” of the
school;
Morning break between third and fourth block;
Writing Center in the Learning Commons to support student writing;
Increased focus on transtion from WMS to WHS;
Student support groups through the school counseling office;
Club Fair during Trojan Time September 17;
True Trojans of the Month recognize grade-level students and staff;
30-minute reduction of athletic practices during midterm and final weeks;
Monthly “Munchkin Mondays;”
Morning music before school;
Newly refurbished main courtyard;
Refurbished space for students to charge electronic devices/socialize;
Therapy dog visits bimonthly to provide staff and students with an outlet to reduce stress; and
September 21, 2015 - Page 96

Spirit weeks by season (Homecoming/Winter Spirit/Spring Color Clash).
Our Alumni News is the last section of this newsletter where we share information about what our
graduates have done after leaving Weston High School. If you have any news that you would like to
share, kindly email me at [email protected].
Academic Programs
Math
The math department is ready to start a new year. We have some familiar faces
teaching new courses this year, and one brand new face in our department.
Welcome to Weston High School Ms. Marissa Pavlik. Each teacher in the math
department has been charged with the challenge of trying out a new-to-them
technology this year. Ask your students if they have tried a Kahoot! Or
collaborated on a problem of the week using Padlet. We are excited at the opportunity to integrate
technology to enhance math instruction. We wrapped up any lingering review topics before Labor Day
and are ready to start with course curricula.
Music
WHS would like to thank Weston community member Mr. David Allon for his generous donation of a
Steinway Concert Grand Model a piano this summer. This beautiful piano, built in 1910, was a family
heirloom. Choral Director Mr. Paul orchestrated the delivery of this precious instrument and is looking
forward to playing it in our school concerts.
Learning Commons
Summer reading is fun reading. In addition to required texts, students and staff enjoyed some great
titles over the summer months. Now that everyone is back, our readers are sharing their favorite
books by posing for a photo holding it. The collection of images is growing, and is on display in the
glass case and as a slideshow on the website. Students who share a picture can stop by the circulation
desk to complete a raffle ticket entry. On September 30, the Learning Commons will hold a drawing
for three gift certificates supporting our local food businesses: Peter’s Market, the Lunchbox, and
Cobb’s Mill Inn.
College and Career Center/School Counseling
Juniors and seniors should check college visits frequently on Naviance for the complete list of colleges
visiting the College and Career Center. Students must first ask their teacher for permission and then
sign up on Naviance.
Our annual college panel this year for sophomore, junior, senior students, and their parents, will take
place on Tuesday, October 13, at 7:00 p.m. in the auditorium. A diverse admissions panel of very
selective and highly selective colleges and universities representing both the private and public sector
will address current trends and relevant issues regarding post-secondary planning. Panelists will clarify
the admissions processes unique to their institutions as well as discuss more broadly the various key
components of the application process such as transcripts, standardized tests, scholarships, essays,
interviews, campus visits, file review, and financial aid. We invite students to come get an inside peek
at how decisions are made and how they can best prepare for the college application process.
September 21, 2015 - Page 97

Social Studies
This summer teachers completed their five-year curriculum renewal. The tenth-grade Modern World
Studies and AP U.S. History courses were the final revisions in this process. The entire department is
excited to bring this inquiry-based and student-centered curriculum to their students.
This month, World Studies students transformed into historical characters from a variety of
civilizations, all vying to become the newest inductee of the Civilizations Hall of Fame. Working
collaboratively in teams, the freshmen students engaged in research on their particular civilization,
developed compelling questions that they then had to answer, and created a unique presentation for
why their civilization was most deserving of being included into the Hall of Fame. Both the teachers
and students in World Studies found that having this project early in the year was a great way to begin
their investigation into world history.
Videography
Eric Benninghoff’s Freedom of the Waters documentary has been selected to be screened at the All
American High School Film Festival on Saturday October 10 in New York City. The event is the
world’s largest high school film festival and gives students an opportunity to not only have their films
screened by industry professionals, but also to connect with the latest technology, explore higher
education opportunities, receive scholarships and technology prizes, and create new relationships.
World Languages
Teachers are looking forward to beginning activities with our students in our newly formed language
honor societies. Last May, many students were inducted into the Spanish, French, Latin, and Chinese
Honor Societies. This year, our teachers are planning a range of activities within the WHS community
and beyond in order to promote each language and its culture. Amongst the many activities being
planned, French and Spanish students will offer homework help to our middle school students.
Spanish 6 AP students had the opportunity to interview some parents of our school community on the
topic of cultural assimilation. Mr. and Mrs. Bara (Argentina), Mrs. Kauffman-Rodriguez (Spain), Mrs.
Navaresse (Argentina), and Mrs. Munoz (Venezuela) visited our two Spanish AP classes to talk about
their experiences as immigrants and offered advice on how to best assimilate to a new culture. It was a
great opportunity for our students to hear different Spanish accents, learn about different cultural
perspectives, and practice with their interpersonal speaking skills.
WHS is excited to welcome two exchange students from France and Germany through Rotary
International. French students are working with our French exchange student to help him overcome the
language barrier in the classroom. From Contemporary Media Design to Biology, our students are
experiencing the unique opportunity to improve their language skills outside of the classroom.
Professional Development
Mr. Brencher spent two weeks at the University of New Haven studying the Introduction to
Engineering Design training course through Project Lead the Way in preparation for teaching it this
fall. The Core Training is an intensive 10 day long process, during which teachers gain confidence
with the Introduction to Engineering Design curriculum as they explore activities such as working in
teams on a virtual product design challenge, aided by the Autodesk® Inventor® software.
September 21, 2015 - Page 98

Ms. Conetta, social studies teacher and student government advisor, and Mrs. Snaith, teacher librarian,
received Masters Degrees in Instructional Technology from University of Connecticut this summer.
They look forward to implementing new strategies in their teaching as well as collaborating with the
district’s technology department to support district initiatives. WHS now has three graduates of the
prestigious program. They join Math CIL Mrs. Russo, who graduated in 2014.
Transition Coordinator Mrs. Johnston attended the first annual Connecticut Secondary Transition
Summer Symposium in July at UCONN’s Greater Hartford Campus. Transition experts from
Connecticut and area states presented topics that impact transition age students. These included the
following: An Organizing Framework of College and Career Readiness for Secondary Students with
Disabilities and Assistive Technology and Accessible Materials to Support Secondary Transition
Goals.
Mr. Jorge graduated this summer from Southern Connecticut State University with his Master of Arts
Degree in History. Mr. Jorge focused on World and European History during his coursework, earning
a concentration in those fields. His program of study culminated with a capstone project about
Chinese migrations around the world, which combined academic research, writing, and lesson
planning.
English Teacher, Mr. Mezzo, was one of 15 school teachers from around the country selected to
participate in a six-week seminar on Dante’s Divine Comedy, sponsored by the National Endowment
for the Humanities. Based in Siena, Italy, the program was taught by renowned medieval scholars Ron
Herzman and Bill Stephany, along with visiting lecturers in art history and mathematics, and immersed
its participants in study through daily discussions that closely examined the epic poem and through
tours of sites around Tuscany and surrounding areas significant to Dante’s life and work. Inferno, the
first of the three poems that make up the Divine Comedy, is taught in Mr. Mezzo’s Honors Humanities
course.
Pre-Engineering Teacher, Ms. Moosbrugger, completed two graduate courses at the University of
Cincinnati. They dealt with the integration of STEM across all disciplines and inquiry in science
laboratory settings. She is working towards a STEM Certificate.
School Counselor Mrs. Schirizzo earned a Masters in Social Work from Fordham University.
Music teacher Mr. Paul completed two courses with the National Association of Music Educators this
summer. Teaching Music through Composition will enhance our music theory course this fall.
Latin Teacher, Ms. Telford, completed AP training in preparation for our new AP Latin course this
fall. The workshop focused on identifying and tying together themes from Caesar’s de Bello Gallic
and Vergil’s Aeneid, the texts on which the AP exam is based. The course also allowed teachers from
across the country to share and discuss activities and best practices.
Mrs. Rita Oleksak, Director of World Languages at Glastonbury Public Schools and past president of
ACTFL (the American Council for Teachers of Foreign Languages), presented to our district world
language teachers this August. The topics discussed included: the World Readiness Standards for
Foreign Languages, how foreign language classrooms support Common Core, and vertical articulation
September 21, 2015 - Page 99

of the language programs offered at WHS. It was a very enriching experience for our teachers, and
they look forward to working again with Mrs. Oleksak as they renew their curricula.
Congratulations to all of these teachers who worked diligently this summer to expand their knowledge
and pedagogical skills.
Co-Curricular Programs
Athletics
On August 18 our sports’ captains got into the spirit of giving by taking part in a
teambuilding experience to benefit children affiliated with the Stamford Hospital
Foundation. David’s Treasure Tree toy closet aims to bring smiles to hospitalized
children. The result of their efforts was a generous donation of eight high-end
remote controlled (RC) racecars.
Team captains worked with Impact 4 Good
(www.impact4good.com), a company that runs socially conscious
teambuilding programs. The result was a program called “Crazy
Carz for Kidz.” Working in teams, participants rotated through
several activities that challenged them both physically and
mentally. Completing these car-themed activities earned each team
accessories needed to personalize their car. After all of the teams
completed the challenges and acquired their parts, they each
created a brand new RC car. . Based on performance in the
challenges, one team took home the checkered flag, but the real
winners were the kids who got to take home brand new, tricked out Crazy Carz.
Cure Cancer/Pink Aid Our Pink Aid Club received a Young Donor Grant for $1000 from CT Block Party. Weston Athletics
will partner with Pink Aid this October, beginning with the Friday night football
game on October 9. Join us for the home athletic events the week of October 12
and the Sherwood Island Breast Cancer Walk on Sunday, October 18. Our special
Pink Out Day at school is Wednesday, October 14.
Student Government
The school year started off enthusiastically for student government with both opening day festivities as
well as our annual Trojan Kickoff. Student Government organized a welcome
celebration the first day of school including outdoor music and munchkins to
welcome students back to WHS. Additionally, the first Friday of the year brought our
Trojan Kickoff, a short pep rally featuring student-led bands, a dodgeball game, and
our school-wide unity lap around the stadium track culminating in one large W.
On September 17, WHS held its annual Club Fair. Students had the opportunity to learn about the wide
variety of co-curricular activities available at WHS. Over 30 clubs and activities were represented,
including Student Government, National Art Honor Society, Girls Who Code, The Warhorse, Model
U.N., and Math Team. A list of all clubs may be found on our school website.
September 21, 2015 - Page 100

Pep Band
After an exciting season last year under the lights, WHS Pep Band is getting ready for the first football
game at WHS on Friday, September 18. The group will branch out this year to perform
at other sporting events throughout the year. The all-volunteer ensemble under the
direction of Mr. Fasoli will be run by senior Drum Majors Sam Ditkoff and Elaine
Freidricksen. In addition to the band cheers and traditional sporting event songs, the band
will be performing classic favorites like "Louie, Louie,” hits by Led Zepplin, and modern pop
tunes. Don’t forget to sit next to the band and cheer on our Trojans.
Company
Our drama club, WHS Company is in full swing. Auditions for the fall play You Can’t Take
It with You were a success. The play has been cast, and rehearsals begin this week. This old
fashioned comedy show is great fun for all ages and will run November 6, 7, and 8.
Alumni News
Samantha Rehr, Class of 2011, graduated in May from the University of Michigan and
moved to New York to launch her acting career. She was cast in a traveling education
based production of Anne Frank (playing Anne). The company producing the show is
the National Theater for Education and Arts and this particular show is designed as a
field trip for English and Social Studies classes.
Lindsay Rothenberg, Class of 2005 and graduate of NYU Film School, is a freelance producer for
Jigsaw Productions. Lindsay has produced a new documentary on dogs that will be shown at the
Hamptons Film Festival this October.
Brad Rothenberg, Class of 2003, a renowned architect and graduate of University of Colorado and the
Pratt Institute, has his own company focused on making 3D printed textiles, jewelry, and accessories
a viable and accessible reality. He has worked with some of the most cutting-edge fashion brands
and is at the forefront in introducing brands to 3D printing technology.
Many graduates from the Class of 2013 are spending their junior year abroad.
Kate Goldberg and Olivia Wolak are studying in Denmark, Ryan Major is in
Brussels, and Andrew Katz is in France.
Oliva Donnelly, Class of 2015, has joined the Notre Dame Marching Band as a
flutist.
Glen Kendall, Class of 2002, and Matt Silver, Luke Dudley, Ryan Squillante,
Adam Luchansky, Class of 2003, formed a non-profit organization The Boxer
Bowtie Club. Its objective is to utilize individual skill sets to build a platform that promotes
volunteerism for worthy causes within our communities. Anyone interested in attending their latest
fundraiser, may visit their website at http://www.boxerbowtieclub.org/about-us-1.
Corey Tolkin, Class of 2006, and her mother have created the new business Unbreakables, which are
bite-sized tidbits of cookie dough that do not require cooking. The following is a link:
September 21, 2015 - Page 101

http://www.bustle.com/articles/19407-unbakeables-let-you-eat-cookie-dough-without-fear-of-
salmonella-might-just-be-the-greatest-invention.
Kristen Hahn, class of 2007, is appearing on Broadway in A Gentleman’s Guide to Love and Murder.
Matt Gurren, Class of 2008, co-wrote a musical that was accepted to and performed at the New York
Musical Theater Festival this past summer. The show is called What Do Critics Know?
Weston Middle School Dan Doak, Principal
In this issue… The Library Learning Commons
The WMS Morning Show
Updates from our Physical Education Department
The marshmallow Challenge
Science Discovery Workshop
WMS Advisory Program
Technology and Engineering
WMS Fall Sports
The Library Learning Commons
The Library Learning Commons (LLC) at WMS is a very busy place. In addition to
lessons collaboratively taught by Mrs. Shuhart and our classroom teachers, students
are encouraged to use the LLC independently throughout the course of the school
day. Monthly, students come to the LLC with their ELA teachers for booktalks
with Mrs. Shuhart. Booktalks focus on reading across a wide variety of genres, a
mix of classics and new titles, and popular reads at WMS. As part of our goal to
foster a love of reading, students keep a booklist of titles they would like to read so
they always have a book ‘on deck.’ Built into booktalk lessons is time to ‘shop’ for
new books.
Within a tightly packed schedule, how can students use the LLC and its resources to its full
potential? Here are some highlights:
Chat and Chew book clubs: students are invited to bring their lunch and
to pre-read the selected book for a lively 30-minute book
discussion. The schedule can be found on the WMS LLC website or by
visiting https://sites.google.com/a/westonps.org/wmsllc/events/chat-
and-chew. This year’s Chat and Chews will focus on the Nutmeg
Nominated titles for 2016.
The LLC is open at recess for students to read on the couches, browse
for new books, play a game of chess or checkers, contribute to the
community jigsaw puzzle, participate in the Take-it-Apart station, or use
the resources in the soon-to-open Innovation Lab.
Students are also encouraged to get a pass from their classroom teacher to use the LLC when
they have independent work time.
September 21, 2015 - Page 102

The WMS Morning Show
The WMS Morning Show team, under the direction of Mr. Evan
Grace, has had a strong start to the 2015-2016 school year. Students
have been hard at work preparing news, announcements, featured
stories, and words of wisdom for their fellow peers. With the recent
additions of green screens and updated broadcasting technology, the
morning show is looking its best yet. We look forward to
welcoming our new members this month. Stay tuned for our live
broadcast every morning from the WMS LLC.
Updates from our Physical Education Department
Uniforms – We are now fully stocked. Uniforms may be ordered any time
throughout the year by completing an order form and handing it to your
student’s PE teacher with a check, or by using your online Myschoolbucks account.
Curricular Focus – We are currently focusing on spatial awareness and cardiovascular
endurance in PE. Through flag football activities students are applying movement concepts
and patterns. Students are also focusing on running as well as upper body, abdominals, and
flexibility.
Fitness Testing – We will begin administering the CT PHYSICAL FITNESS TEST at the
beginning of October. Students will be doing the mile run, sit and reach, curl-ups, and push-
ups. PE teachers will use last year’s data to work with each student to create goals to improve
their fitness on this year’s test. Reports will be e-mailed to parents in early December.
Powerschool – Please check Powerschool regularly to see how your child is doing in class. We
give daily grades in order to increase communication between school and home. If the grade
shows up as blue, please click on it, as that means there is a comment attached for you to view.
The marshmallow Challenge (Grade Eight)
Grade eight science students were challenged to build the tallest freestanding
structures using limited amounts of tape, spaghetti, and string…with a
marshmallow on top. The marshmallow is a metaphor for the hidden
assumptions of a project: The assumption in the Marshmallow Challenge is that
marshmallows are light and fluffy, and easily supported by the spaghetti sticks.
When you actually try to build the structure, the marshmallows don’t seem so
light. The lesson in the marshmallow challenge is that we need to identify the
assumptions in our project – the real customer needs, the cost of the product, the
duration of the service – and test them early and often. That’s the mechanism
that leads to effective innovation.
The Science Discovery Workshop (Grades Seven and Eight)
Students began by learning to embrace their scientific curiosity and nurture
scientific questioning. Collecting piles of wonderings was our start, and we then
analyzed the different types of questions to better understand how to frame
questions into investigations. What better way to elicit investigable questions
from students than with spheres of ice?
September 21, 2015 - Page 103

Weston Middle School Advisory Program
Weston Middle School will kick off our Advisory program on September 25. All middle school
students participate in this bi-monthly program which is designed to offer a personalized and
supportive learning environment with one faculty member and a small group of students. Advisory
will focus on the transitional needs of middle school students, character education, personal growth
and social awareness.
Weston Middle School’s Advisory program affords students another opportunity to develop a positive
relationship with a caring adult. When students feel that they have more helpful adults as resources in
school, we see an increase in emotional wellness and overall academic success.
The Advisory program also fosters positive relationships with peers and builds a
strong sense of school community. Many of the lessons that faculty advisors
facilitate reinforces our Positive Behavioral Intervention and Supports program
called SOAR which stands for Safety, Ownership, Attitude and Respect. Other
lessons will incorporate character education themes such as responsibility,
perseverance, citizenship and kindness. We are looking forward to this exciting
opportunity that will help our students grow both personally and academically.
Technology and Engineering
Grade seven students in their Design and Modeling course
reviewed the engineering design process by solving a
hypothetical rollercoaster design problem presented by a
regional amusement park. Each group had the same
materials and they were challenged to design a coaster
with at least one loop and hill, while the “car” of the
coaster had to stop on its own within six inches of the end of the
track. Students then used Google Classroom to collaborate with
their design team members to complete a Design Brief to develop and reflect on the
entire process of creation, testing and improving the rollercoaster.
Middle School Fall Sports
Middle school fall sports began the week of September 8. Offerings include field hockey, flag
football, volleyball, and cross country. More details can be found on the middle school homepage.
Weston Intermediate School Pattie Falber, Principal
In this issue… The Opening of School
WIS Pride
Teaching and Learning
Fifth-Grade Science
Professional Development
September 21, 2015 - Page 104

The Opening of School
Once again our halls and classrooms are filled with
the happy sounds of students and staff engaged in
the rhythm of teaching and learning. We welcomed
37 new students to our school this year: 17 third-
grade students; nine fourth-grade students; and 11
fifth-grade students. They have quickly made
friends and become integral members of our WIS
community. We are so pleased that they have
joined our school.
To help our large number of new students and their
families learn more about the school we held a
new family orientation in August that was very
well attended. Additionally, to welcome the
newest members of WIS, our third graders, we opened our doors on the Friday
before school officially started so students and families could meet their new
teacher and see their classrooms. There were lots of smiles as they got ready for
a new year.
WIS Pride
We kicked off the year by holding grade-level assemblies on the first day of school to welcome
everyone to WIS and share our goals and expectations. We also reviewed our Positive Behavioral
Intervention and Support (PBIS) program motto WIS P.R.I.D.E. and reminded students of what
P.R.I.D.E. stands for: Personal accountability, Respect, Integrity, Discipline, and Effort. We will
continue to encourage the positive attributes of WIS P.R.I.D.E. throughout the school year with
monthly assemblies, school-wide spirit days and celebrations, and classroom activities.
Teaching and Learning
One of our primary goals as a school, and as a district, this year is in
the area of writing, specifically fostering a culture where students
become independent and confident
writers. To facilitate this independence
and confidence, teachers are working to
expand their repertoire to meet the varying
needs of the writers in their classrooms.
All three grades are launching the year with a unit of study in narrative
writing. In third grade, students are crafting true small moment stories,
fourth-grade students are writing realistic fiction by studying the arc of
story, and fifth-grade students are studying narrative craft to write personal narratives.
Fifth-Grade Science
The fifth graders have begun their year in science studying sound energy. They will explore how sound
travels, and the science behind pitch and volume. Later they will look at how the ear translates sound
to meaningful communication. In the pictures, students are using drop chambers to examine the
properties of sound.
September 21, 2015 - Page 105

Professional Development
The WIS staff returned to school refreshed and ready to begin a new year. Our professional
development work was informative and stimulating, and built on the work that took place over the
summer. This summer we were fortunate to have a staff developer from Teachers College Reading
and Writing Project work with our teachers to strengthen their capacity as writing teachers. A staff
developer will also be visiting our classrooms, working with students and teachers throughout the year.
As part of our professional development, the teachers embarked on a close look at our writing units of
study to design grammar, spelling and conventions lessons that will be seamlessly integrated. It was an
exciting start to the year, and we are looking forward to continuing this work throughout the year.
Hurlbutt Elementary School Laura Kaddis, Principal
In this issue… Hurlbutt Kicks Off a Positive School Climate
Teaching and Learning
Parent Involvement
Summer News
Hurlbutt Kicks Off a Positive School Climate
Our preschool and kindergarten students have already learned
our motto, “Be safe, be kind, and be responsible.”
Throughout the first month of school, classroom teachers use
our Responsive Classroom approach to creating an
environment for learning. Responsive Classroom is a
research-based approach to education that is associated with
greater teacher effectiveness, higher student achievement, and
improved school climate. This approach consists of practical
strategies for helping children build academic and social-
emotional competencies day in and day out. Students have
been practicing being safe, kind, and responsible throughout
the building and have been earning honeycombs for our honeyhive. Once we fill the honeyhive as a
school we will have a schoolwide celebration. From learning to walk in the halls together to playing
safely on the playgrounds these routines and procedures are supported by our entire staff. Mr.
Hallgren, our physical eudcation teacher begins the year with a unit on playground safety. The
students learn to use all of the equipment in a safe and responsible manner while making new friends
and learning how to include everyone in play.
We also kicked off the year with our first assembly in the Learning Resource
Center (LRC). Singer and songwriter, Brian Chevalier, has been providing school
assemblies, school programs, and artist-in-residence programs since 1995. Our
students enjoyed singing and moving together with Brian (Mr. C), with a focus on
character education and making friends. His highly interactive and engaging
delivery of various music styles, from rock to blues to folk, had our students and
staff up and moving. Embedded in the songs were movement activities that
September 21, 2015 - Page 106

focused on keeping a beat, which fits right in with our music curriculum. We
even learned some sign languge as we sang and signed a friendship song
together. This was a great way for our school community to come together for
the first time.
Teaching and Learning
In addition to making new friends and getting used to new schedules, our students
have already been immersed in learning. Across the grades, our students are filling
their book bins with new reading material. The
teachers are using formal and informal assessments to determine student
reading levels and instructional focus areas for each student. Our reader’s
workshop model allows each child to learn and develop at his or her own
pace using books at their individual reading level. Instruction is tailored
to each student and teachers use guided reading groups as well as
individual student conferences to guide their instruction. In writer’s
workshop, all grades have been writing stories from their own
experiences. They write about people they know, places they go and things they do. Of course, many
students’ stories include their summer adventures and we love reliving those memories with them.
Parent Involvement
We hosted a Back-to-School Night for parents in each grade during the
first few weeks of school. These evenings gave parents insight into our
curriculum and gave them an opportunity to hear from their child’s
teacher. Our families enjoyed visiting their child’s classroom and
getting a glimpse of what school days are like. Our PTO was on hand
selling our new Hurlbutt Elementary school spirit t-shirts, which many
of our students are already proudly wearing.
Summer News
This summer our Hurlbutt Outdoor Learning Garden continued to thrive and
produce. Families visited the garden throughout the summer months to weed
and harvest the produce. Our garden was filled with
tomatoes, snap peas, and carrots to name just a few
of the vegetables planted by our students in the
spring. PTO parent and master gardener, Tara
Tanzer, continues to help us nurture and enhance
this valuable resource and is already planning for
next season. In addition to the vegetable garden,
Tara has designed and overseen the
installation of our new butterfly garden at
our main entrance. It is a beautiful addition
to the front of our school and we are looking
forward to integrating this special area into
our science curriculum. We have already seen many butterflies visiting
our campus and we look forward to learning about them.
September 21, 2015 - Page 107