Moncler - borsaitaliana.it · moncler – november 8, 2013 important disclosures appear at the back...
56
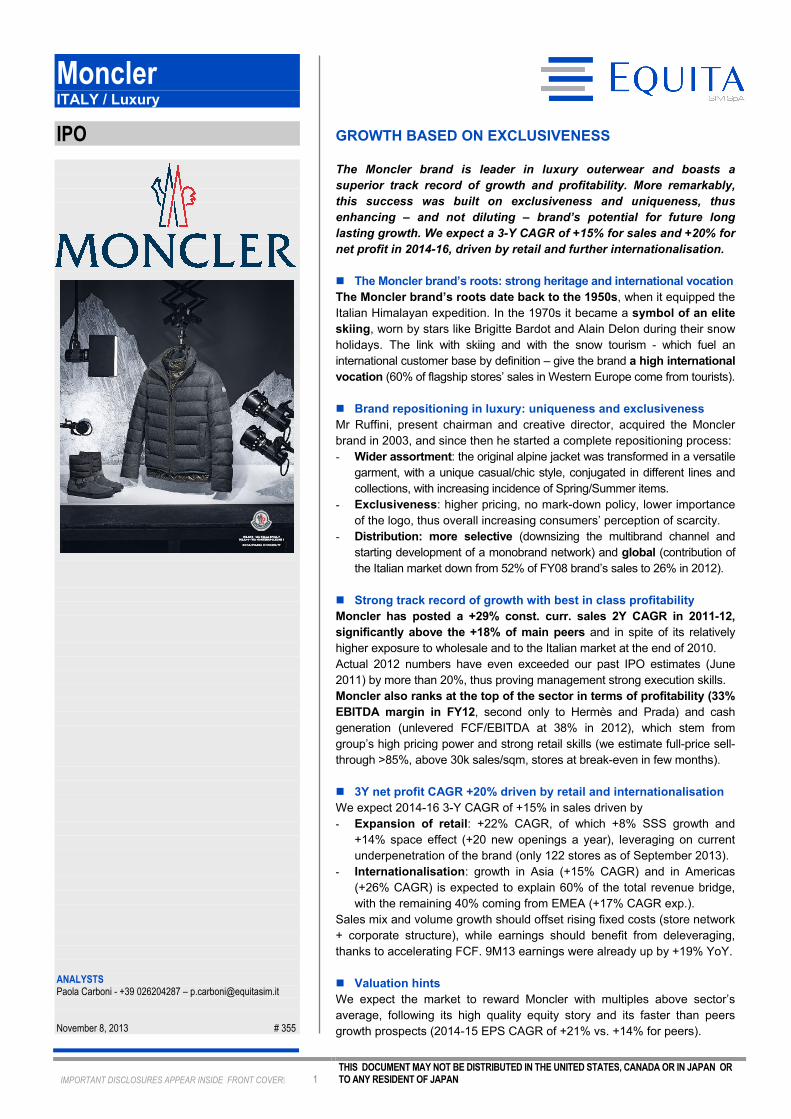
IMPORTANT DISCLOSURES APPEAR INSIDE FRONT COVER 1 THIS DOCUMENT MAY NOT BE DISTRIBUTED IN THE UNITED STATES, CANADA OR IN JAPAN OR TO ANY RESIDENT OF JAPAN Moncler ITALY / Luxury IPO ANALYSTS Paola Carboni - +39 026204287 – [email protected] November 8, 2013 # 355 GROWTH BASED ON EXCLUSIVENESS The Moncler brand is leader in luxury outerwear and boasts a superior track record of growth and profitability. More remarkably, this success was built on exclusiveness and uniqueness, thus enhancing – and not diluting – brand’s potential for future long lasting growth. We expect a 3-Y CAGR of +15% for sales and +20% for net profit in 2014-16, driven by retail and further internationalisation. The Moncler brand’s roots: strong heritage and international vocation The Moncler brand’s roots date back to the 1950s, when it equipped the Italian Himalayan expedition. In the 1970s it became a symbol of an elite skiing, worn by stars like Brigitte Bardot and Alain Delon during their snow holidays. The link with skiing and with the snow tourism - which fuel an international customer base by definition – give the brand a high international vocation (60% of flagship stores’ sales in Western Europe come from tourists). Brand repositioning in luxury: uniqueness and exclusiveness Mr Ruffini, present chairman and creative director, acquired the Moncler brand in 2003, and since then he started a complete repositioning process: - Wider assortment: the original alpine jacket was transformed in a versatile garment, with a unique casual/chic style, conjugated in different lines and collections, with increasing incidence of Spring/Summer items. - Exclusiveness: higher pricing, no mark-down policy, lower importance of the logo, thus overall increasing consumers’ perception of scarcity. - Distribution: more selective (downsizing the multibrand channel and starting development of a monobrand network) and global (contribution of the Italian market down from 52% of FY08 brand’s sales to 26% in 2012). Strong track record of growth with best in class profitability Moncler has posted a +29% const. curr. sales 2Y CAGR in 2011-12, significantly above the +18% of main peers and in spite of its relatively higher exposure to wholesale and to the Italian market at the end of 2010. Actual 2012 numbers have even exceeded our past IPO estimates (June 2011) by more than 20%, thus proving management strong execution skills. Moncler also ranks at the top of the sector in terms of profitability (33% EBITDA margin in FY12, second only to Hermès and Prada) and cash generation (unlevered FCF/EBITDA at 38% in 2012), which stem from group’s high pricing power and strong retail skills (we estimate full-price sell- through >85%, above 30k sales/sqm, stores at break-even in few months). 3Y net profit CAGR +20% driven by retail and internationalisation We expect 2014-16 3-Y CAGR of +15% in sales driven by - Expansion of retail: +22% CAGR, of which +8% SSS growth and +14% space effect (+20 new openings a year), leveraging on current underpenetration of the brand (only 122 stores as of September 2013). - Internationalisation: growth in Asia (+15% CAGR) and in Americas (+26% CAGR) is expected to explain 60% of the total revenue bridge, with the remaining 40% coming from EMEA (+17% CAGR exp.). Sales mix and volume growth should offset rising fixed costs (store network + corporate structure), while earnings should benefit from deleveraging, thanks to accelerating FCF. 9M13 earnings were already up by +19% YoY. Valuation hints We expect the market to reward Moncler with multiples above sector’s average, following its high quality equity story and its faster than peers growth prospects (2014-15 EPS CAGR of +21% vs. +14% for peers).
Transcript of Moncler - borsaitaliana.it · moncler – november 8, 2013 important disclosures appear at the back...
IMPORTANT DISCLOSURES APPEAR INSIDE FRONT COVER� 1 THIS DOCUMENT MAY NOT BE DISTRIBUTED IN THE UNITED STATES, CANADA OR IN JAPAN OR TO ANY RESIDENT OF JAPAN
Moncler ITALY / Luxury
IPO
ANALYSTS Paola Carboni - +39 026204287 – [email protected] November 8, 2013 # 355
GROWTH BASED ON EXCLUSIVENESS
The Moncler brand is leader in luxury outerwear and boasts a
superior track record of growth and profitability. More remarkably,
this success was built on exclusiveness and uniqueness, thus
enhancing – and not diluting – brand’s potential for future long
lasting growth. We expect a 3-Y CAGR of +15% for sales and +20% for
net profit in 2014-16, driven by retail and further internationalisation.
� The Moncler brand’s roots: strong heritage and international vocation
The Moncler brand’s roots date back to the 1950s, when it equipped the
Italian Himalayan expedition. In the 1970s it became a symbol of an elite
skiing, worn by stars like Brigitte Bardot and Alain Delon during their snow
holidays. The link with skiing and with the snow tourism - which fuel an
international customer base by definition – give the brand a high international
vocation (60% of flagship stores’ sales in Western Europe come from tourists).
� Brand repositioning in luxury: uniqueness and exclusiveness
Mr Ruffini, present chairman and creative director, acquired the Moncler
brand in 2003, and since then he started a complete repositioning process:
- Wider assortment: the original alpine jacket was transformed in a versatile
garment, with a unique casual/chic style, conjugated in different lines and
collections, with increasing incidence of Spring/Summer items.
- Exclusiveness: higher pricing, no mark-down policy, lower importance
of the logo, thus overall increasing consumers’ perception of scarcity.
- Distribution: more selective (downsizing the multibrand channel and
starting development of a monobrand network) and global (contribution of
the Italian market down from 52% of FY08 brand’s sales to 26% in 2012).
� Strong track record of growth with best in class profitability
Moncler has posted a +29% const. curr. sales 2Y CAGR in 2011-12,
significantly above the +18% of main peers and in spite of its relatively
higher exposure to wholesale and to the Italian market at the end of 2010.
Actual 2012 numbers have even exceeded our past IPO estimates (June
2011) by more than 20%, thus proving management strong execution skills.
Moncler also ranks at the top of the sector in terms of profitability (33%
EBITDA margin in FY12, second only to Hermès and Prada) and cash
generation (unlevered FCF/EBITDA at 38% in 2012), which stem from
group’s high pricing power and strong retail skills (we estimate full-price sell-
through >85%, above 30k sales/sqm, stores at break-even in few months).
� 3Y net profit CAGR +20% driven by retail and internationalisation
We expect 2014-16 3-Y CAGR of +15% in sales driven by
- Expansion of retail: +22% CAGR, of which +8% SSS growth and
+14% space effect (+20 new openings a year), leveraging on current
underpenetration of the brand (only 122 stores as of September 2013).
- Internationalisation: growth in Asia (+15% CAGR) and in Americas
(+26% CAGR) is expected to explain 60% of the total revenue bridge,
with the remaining 40% coming from EMEA (+17% CAGR exp.).
Sales mix and volume growth should offset rising fixed costs (store network
+ corporate structure), while earnings should benefit from deleveraging,
thanks to accelerating FCF. 9M13 earnings were already up by +19% YoY.
� Valuation hints
We expect the market to reward Moncler with multiples above sector’s
average, following its high quality equity story and its faster than peers
growth prospects (2014-15 EPS CAGR of +21% vs. +14% for peers).
Moncler – November 8, 2013
IMPORTANT DISCLOSURES APPEAR AT THE BACK OF THIS REPORT� 2 THIS DOCUMENT MAY NOT BE DISTRIBUTED IN THE UNITED STATES, CANADA OR IN JAPAN OR TO ANY RESIDENT OF JAPAN
THIS DOCUMENT IS BEING FURNISHED TO YOU SOLELY FOR YOUR INFORMATION AND MAY NOT BE REPRODUCED OR REDISTRIBUTED, IN
WHOLE OR IN PART, TO ANY OTHER PERSON. IN PARTICULAR, NEITHER THIS DOCUMENT NOR ANY COPY HEREOF MAY BE TAKEN OR
RETRANSMITTED IN OR INTO THE UNITED STATES OR REDISTRIBUTED, DIRECTLY OR INDIRECTLY, IN THE UNITED STATES OR TO ANY US
PERSON. ANY FAILURE TO COMPLY WITH THIS RESTRICTION MAY CONSTITUTE A VIOLATION OF US SECURITIES LAWS.
THIS DOCUMENT IS BEING DISTRIBUTED ONLY BY OR WITH THE APPROVAL OF AN AUTHORISED PERSON OR TO (I) PERSONS WHO ARE
OUTSIDE THE UNITED KINGDOM;(II) PERSONS IN THE UNITED KINGDOM WHO HAVE PROFESSIONAL EXPERIENCE IN MATTERS RELATED TO
INVESTMENTS AND WHO ARE INVESTMENT PROFESSIONALS WITHIN THE MEANING OF ARTICLE 19(5) OF THE FINANCIAL SERVICES AND
MARKETS ACT 2000 (FINANCIAL PROMOTION) ORDER 2005 (AS AMENDED) OF THE UNITED KINGDOM (THE "ORDER"); (III) PERSONS WHO
FALL WITHIN ARTICLE 49(2)(A) TO (D)("HIGH NET WORTH COMPANIES, UNINCORPORATED ASSOCIATIONS ETC.") OF THE ORDER; AND (IV)
ANY OTHER PERSONS TO WHOM THIS DOCUMENT MAY OTHERWISE LAWFULLY BE DIRECTED (ALL SUCH PERSONS TOGETHER BEING
REFERRED TO AS "RELEVANT PERSONS"). THE INVESTMENTS TO WHICH THIS DOCUMENT RELATES ARE AVAILABLE ONLY TO, AND ANY
INVITATION, OFFER OR AGREEMENT TO SUBSCRIBE, PURCHASE OR OTHERWISE ACQUIRE SUCH INVESTMENTS WILL BE ENGAGED IN
ONLY WITH, RELEVANT PERSONS. ANY PERSON WHO IS NOT A RELEVANT PERSON SHOULD NOT ACT OR RELY ON THIS DOCUMENT OR
ANY OF ITS CONTENTS.
THIS DOCUMENT IS FOR DISTRIBUTION IN ITALY ONLY TO QUALIFIED INVESTORS WITHIN THE MEANING OF ARTICLE
100 OF LEGISLATIVE DECREE NO. 58 OF 28 FEBRUARY 1998 AS AMENDED, AND ARTICLE 34-TER, PARA. 1, LETT B), OF CONSOB
REGULATION NO. 11971 OF 1999, AS AMENDED. THIS DOCUMENT IS NOT ADDRESSED TO ANY MEMBER OF THE GENERAL PUBLIC IN ITALY.
IN NO CIRCUMSTANCES SHOULD THIS DOCUMENT CIRCULATE AMONG, OR BE DISTRIBUTED TO (I) A MEMBER OF THE GENERAL PUBLIC;
(II) INDIVIDUALS OR ENTITIES FALLING OUTSIDE THE DEFINITION OF “QUALIFIED INVESTORS” AS SPECIFIED ABOVE; OR (III) TO
DISTRIBUTION CHANNELS THROUGH WHICH INFORMATION IS , OR IS LIKELY TO BECOME AVAILABLE TO A LARGE NUMBER OF PERSONS.
THIS DOCUMENT IS BEING FURNISHED TO YOU SOLELY FOR YOUR INFORMATION AND MAY NOT REPRODUCED OR REDISTRIBUTED, IN
WHOLE OR IN PART, TO ANY OTHER PERSON. IN PARTICULAT, NEITHER THIS DOCUMENT NOR ANY COPY HEREOF MAY BE TAKEN OR
RETRANSMITTED IN OR INTO JAPAN OR REDISTRIBUTED, DIRECTLY OR INDIRECTLY, IN JAPAN OR TO ANY RESIDENT THEREOF. ANY
FAILURE TO COMPLY WITH THIS RESTRICTION MAY CONSTITUTE A VIOLATION OF SECURITIES LAWS OF JAPAN.
THE DISTRIBUTION OF THIS DOCUMENT IN OTHER JURISDICTIONS MAY BE RESTRICTED BY LAW AND PERSONS INTO WHOSE POSSESSION
THIS DOCUMENT COMES SHOULD INFORM THEMSELVES ABOUT, AND OBSERVE, ANY SUCH RESTRICTION. ANY FAILURE TO COMPLY WITH
THESE RESTRICTIONS MAY CONSTITUTE A VIOLATION OF THE LAWS OF ANY SUCH OTHER JURISDICTION.
THIS DOCUMENT DOES NOT CONSTITUTE AN OFFER OR INVITATION OR FORM PART OF AN OFFER OR INVITATION TO SUBSCRIBE FOR OR
PURCHASE ANY SECURITIES, AND NEITHER THIS DOCUMENT NOR ANYTHING CONTAINED HEREIN SHALL FORM THE BASIS OF ANY
CONTRACT OR COMMITMENT WHATSOEVER.
This report has been prepared by EQUITA S.I.M. S.p.A. to provide background information about Moncler S.p.A. (the “Company”). EQUITA S.I.M.
S.p.A. or an affiliated company of EQUITA S.I.M S.p.A: is or may be a member of the underwriting group in respect of a proposed offering of
securities of the Company. This report has been produced independently of the Company and the forecasts, opinions and expectations
contained herein are entirely those of EQUITA S.I.M S.p.A. While all reasonable care has been taken to ensure that the facts stated herein are
accurate and that the forecasts, opinions and expectations contained herein are fair and reasonable, EQUITA S.I.M. S.p.A. has not verified the
contents hereof and no reliance should be placed on the accuracy, fairness or completeness of the information contained in this document. No
person accepts any liability whatsoever for any loss howsoever arising from any use of this document or its contents or otherwise arising in
connection therewith, and neither EQUITA S.I.M. S.p.A., the Company, nor any of their respective directors, officers or employees, shall be in any
way responsible for the contents hereof, apart from the liabilities and responsibilities which may be imposed on them by the FSMA, or the
regulatory regime thereunder. EQUITA S.I.M. S.p.A. and/or persons connected with it may have acted upon or used the information herein
contained, or the research or analysis on which it is based, before its publication. EQUITA S.I.M. S.p.A. may in the future participate in an offering
of Company’s securities. Any opinions, forecasts or estimates herein constitute a judgement as at the date of this report. There can be no
assurance that future results or events will be consistent with any such opinions, forecasts or estimates. This information is subject to change
without notice and its accuracy is not guaranteed. It may be incomplete or condensed and it may not contain all material information concerning
the Company. Any decision to purchase securities in any proposed offering should be made solely on the basis of the information to be
contained in the final offering document to be published in due course in relation to the proposed offering.
BY ACCEPTING THIS REPORT, YOU AGREE TO BE BOUND BY THE FOREGOING LIMITATIONS.
IMPORTANT DISCLOSURES APPEAR AT THE BACK OF THIS REPORT� 3 THIS DOCUMENT MAY NOT BE DISTRIBUTED IN THE UNITED STATES, CANADA OR IN JAPAN OR TO ANY RESIDENT OF JAPAN
Moncler ITALY / Luxury
IPO
MAIN METRICS 2012 2013E 2014E
Revenues 489 573 666
EBITDA 162 189 215
Net income 82 94 114
Adj. net income 82 95 114
INDEBTEDNESS 2012 2013E 2014E
NFP -229 -171 -96
Debt/EBITDA 1.4 x 0.9 x 0.4 x
Interests cov 9.4 x 9.4 x 16.5 x ANALYSTS Paola Carboni - +39 026204287 – [email protected] November 8, 2013 # 355
GROWTH BASED ON EXCLUSIVENESS
The Moncler brand is leader in luxury outerwear and boasts a
superior track record of growth and profitability. More remarkably,
this success was built on exclusiveness and uniqueness, thus
enhancing – and not diluting – brand’s potential for future long
lasting growth. We expect a 3-Y CAGR of +15% for sales and +20% for
net profit in 2014-16, driven by retail and further internationalisation.
� The Moncler brand’s roots: strong heritage and international vocation
The Moncler brand’s roots date back to the 1950s, when it equipped the
Italian Himalayan expedition. In the 1970s it became a symbol of an elite
skiing, worn by stars like Brigitte Bardot and Alain Delon during their snow
holidays. The link with skiing and with the snow tourism - which fuel an
international customer base by definition – give the brand a high international
vocation (60% of flagship stores’ sales in Western Europe come from tourists).
� Brand repositioning in luxury: uniqueness and exclusiveness
Mr Ruffini, present chairman and creative director, acquired the Moncler
brand in 2003, and since then he started a complete repositioning process:
- Wider assortment: the original alpine jacket was transformed in a versatile
garment, with a unique casual/chic style, conjugated in different lines and
collections, with increasing incidence of Spring/Summer items.
- Exclusiveness: higher pricing, no mark-down policy, lower importance
of the logo, thus overall increasing consumers’ perception of scarcity.
- Distribution: more selective (downsizing the multibrand channel and
starting development of a monobrand network) and global (contribution of
the Italian market down from 52% of FY08 brand’s sales to 26% in 2012).
� Strong track record of growth with best in class profitability
Moncler has posted a +29% const. curr. sales 2Y CAGR in 2011-12,
significantly above the +18% of main peers and in spite of its relatively
higher exposure to wholesale and to the Italian market at the end of 2010.
Actual 2012 numbers have even exceeded our past IPO estimates (June
2011) by more than 20%, thus proving management strong execution skills.
Moncler also ranks at the top of the sector in terms of profitability (33%
EBITDA margin in FY12, second only to Hermès and Prada) and cash
generation (unlevered FCF/EBITDA at 38% in 2012), which stem from
group’s high pricing power and strong retail skills (we estimate full-price sell-
through >85%, above 30k sales/sqm, stores at break-even in few months).
� 3Y net profit CAGR +20% driven by retail and internationalisation
We expect 2014-16 3-Y CAGR of +15% in sales driven by
- Expansion of retail: +22% CAGR, of which +8% SSS growth and
+14% space effect (+20 new openings a year), leveraging on current
underpenetration of the brand (only 122 stores as of September 2013).
- Internationalisation: growth in Asia (+15% CAGR) and in Americas
(+26% CAGR) is expected to explain 60% of the total revenue bridge,
with the remaining 40% coming from EMEA (+17% CAGR exp.).
Sales mix and volume growth should offset rising fixed costs (store network
+ corporate structure), while earnings should benefit from deleveraging,
thanks to accelerating FCF. 9M13 earnings were already up by +19% YoY.
� Valuation hints
We expect the market to reward Moncler with multiples above sector’s
average, following its high quality equity story and its faster than peers
growth prospects (2014-15 EPS CAGR of +21% vs. +14% for peers).

Moncler –November 8, 2013
IMPORTANT DISCLOSURES APPEAR INSIDE FRONT COVER� 4 THIS DOCUMENT MAY NOT BE DISTRIBUTED IN THE UNITED STATES, CANADA OR IN JAPAN OR TO ANY RESIDENT OF JAPAN
BUSINESS DESCRIPTION
The Moncler Group is leader in luxury outerwear (85% of
FY12 group revenues) with a unique positioning and strong
international vocation.
The group insources the higher value-added phases of the
production process (design and product development, sales
campaign, sourcing of raw materials, quality control,
communication and marketing) and outsources manufacturing
activities – all located in Europe.
The brand is distributed in 66 countries, both through
wholesale (49% of FY12 revenues) and retail (51% of FY12
revenues). As of September 2013, the monobrand distribution
network consisted of 98 DOS stores and 24 shop-in-shop
wholesale.
The group has raised its penetration abroad in the last few
years, with Italy now accounting for only 26% of 2012
revenues.
MAIN FIGURES € mn 2011 2012 2013E 2014E 2015E 2016E
Revenues 364 489 573 666 768 872
Growth 29% 34% 17% 16% 15% 14%
EBITDA 112 162 189 215 254 291
Growth 23% 45% 17% 14% 18% 15%
Adjusted EBITDA 114 162 187 215 254 291
Growth 26% 41% 16% 15% 18% 15%
EBIT 102 146 168 188 221 252
Growth 20% 43% 15% 12% 18% 14%
Profit before tax 89 129 148 175 213 251
Growth n.a. 44% 15% 18% 22% 18%
Net income 56 82 94 114 139 164
Growth n.a. 47% 14% 21% 22% 18%
Adj. net income 58 82 95 114 139 164
Growth n.a. 43% 15% 20% 22% 18%
MARGIN 2011 2012 2013E 2014E 2015E 2016E
Ebitda Margin 30.7% 33.0% 32.9% 32.2% 33.0% 33.4%
Ebitda adj Margin 31.5% 33.0% 32.6% 32.2% 33.0% 33.4%
Ebit margin 28.0% 29.8% 29.3% 28.2% 28.7% 28.9%
Pbt margin 24.6% 26.3% 25.8% 26.2% 27.7% 28.8%
Ni rep margin 15.4% 16.9% 16.4% 17.1% 18.1% 18.8%
Ni adj margin 15.9% 16.9% 16.5% 17.1% 18.1% 18.8%
VARIOUS - € mn 2011 2012 2013E 2014E 2015E 2016E
Capital emloyed 394 421 455 470 502 524
FCF 26 49 54 72 108 142
Capex 35 26 34 34 35 35
Trade working capital 18 37 56 82 104 122
INDEBTNESS - €mn 2011 2012 2013E 2014E 2015E 2016E
NFP -270 -229 -171 -96 -17 90
D/E 2.18 x 1.19 x 0.60 x 0.26 x 0.03 x n.m.
Debt/EBITDA 2.4 x 1.4 x 0.9 x 0.4 x 0.1 x n.m.
Interests cov 9.0 x 9.4 x 9.4 x 16.5 x 33.4 x 224.2 x
REMUNERATION 2011 2012 2013E 2014E 2015E 2016E
ROE 45.0% 42.9% 33.2% 30.4% 28.7% 26.7%
ROCE 16.2% 22.2% 23.5% 26.0% 28.7% 31.5%
Source: EQUITA SIM estimates and company data FCF calculated as: change in NFP plus dividends distributed during the period

Moncler – November 8, 2013
IMPORTANT DISCLOSURES APPEAR INSIDE FRONT COVER� 5 THIS DOCUMENT MAY NOT BE DISTRIBUTED IN THE UNITED STATES, CANADA OR IN JAPAN OR TO ANY RESIDENT OF JAPAN
TABLE OF CONTENTS
INVESTMENT SUMMARY ............................................................................................. 6
HIGH QUALITY, FOR BOTH CONSUMERS AND INVESTORS ............................... 12
GROUP’S ORIGINS AND PRESENT SHAREHOLDER BASE .................................. 13
THE IPO ........................................................................................................................ 13
REPOSITIONING IN THE LUXURY ARENA: UNIQUENESS AND EXCLUSIVITY .. 14
THE MONCLER BRAND TODAY: “THE GLOBAL DUVET JACKET” ........................ 17
A SUPERIOR TRACK RECORD OF GROWTH ….. ................................................... 22
… WITH BEST IN CLASS PROFITABILITY ................................................................ 24
VISIBLE GROWTH PROSPECTS ............................................................................... 27
SEASONALITY OF RESULTS ..................................................................................... 31
9M RESULTS LARGELY UNDERPIN OUR FY13 ESTIMATES ................................ 33
2014-2016 ESTIMATES: +20% CAGR IN EARNINGS, DRIVEN BY RETAIL AND
FOREIGN MARKETS ................................................................................................... 37
SWOT ANALYSIS ......................................................................................................... 42
VALUATION HINTS ...................................................................................................... 43
STATEMENT OF RISKS .............................................................................................. 46
APPENDIX 1: STILL POSITIVE LONG TERM PROSPECTS FOR LUXURY ............ 47
APPENDIX 2: MONCLER’S OPERATIONS ................................................................ 50
APPENDIX 3: STRONG AND LOYAL MANAGEMENT TEAM ................................... 54
Moncler – November 8, 2013
IMPORTANT DISCLOSURES APPEAR INSIDE FRONT COVER� 6 THIS DOCUMENT MAY NOT BE DISTRIBUTED IN THE UNITED STATES, CANADA OR IN JAPAN OR TO ANY RESIDENT OF JAPAN
INVESTMENT SUMMARY
MONCLER’S HISTORY: STRONG HERITAGE AND REPOSITIONING IN LUXURY
The Moncler brand’s roots date back to the 1950s, when it equipped the Italian
Himalayan expedition, as a high performance technical jacket born for Alpine use. In
the 1970’s it became a symbol of an elite skiing, worn by stars like Brigitte Bardot
and Alain Delon during their holidays in the midst of the snow.
The story of the Moncler brand then became a story of fast growth (3-year
sales CAGR = 30% in 2010-12, based on 2009 divisional data) and
internationalization (74% of sales outside of Italy in FY12), thanks to the
remarkable success of the restyling and repositioning process undertaken by the
present chairman and creative director, Remo Ruffini, who acquired the brand in
2003. Since the beginning, Mr. Ruffini’s strategy was centred on brand’s
exclusiveness, through
- A wider assortment: the original alpine jacket was transformed in a versatile
garment, with a unique casual/chic style, conjugated in different lines and
collections, with increasing incidence of Spring/Summer items.
- Greater exclusiveness: higher pricing (€ 800-1000 for the Autumn/Winter
collection), no mark-down policy, lower importance of the logo, thus overall
increasing consumers’ perception of scarcity. As a further luxury statement, the
Main Collection has been flanked by two haute couture collections presented
at the main European fashion weeks (Paris and Milan).
- More selective distribution (downsizing the multibrand channel and starting
development of a monobrand network) and more global presence (contribution
of the Italian market down from 52% of FY08 brand’s sales to 26% in 2012).
THE MONCLER BRAND TODAY: THE “GLOBAL DUVET JACKET”
The Moncler brand now rightfully forms part of the luxury arena by virtue of its
strong heritage, exclusiveness, very high quality, high price positioning, strong
recognisability and iconic products.
In our opinion the strength of the Moncler brand lies in:
- the uniqueness of its proposition and positioning. Moncler has managed to
win leadership in outerwear thanks to an across-the-board style – which we
can define as casual/chic, informal but refined at the same time – that, in its
various conjugations and lines - make it suitable for different occasions and for
different consumers; a contemporary style, designed to survive fashion
- its strong international vocation, thanks to the link with skiing and with the
snow tourism, which, by definition, fuel an International customer base. This
has been a key success factor for the rapid international expansion of the
brand outside its domestic market. As a matter of fact, 60% of revenues in
group’s Western European flagship stores are generated by tourists. Light
duvet jackets for example are a key success factor for the brand vis à vis
customers from warmer regions such as Brazil, Middle East, Hong Kong.
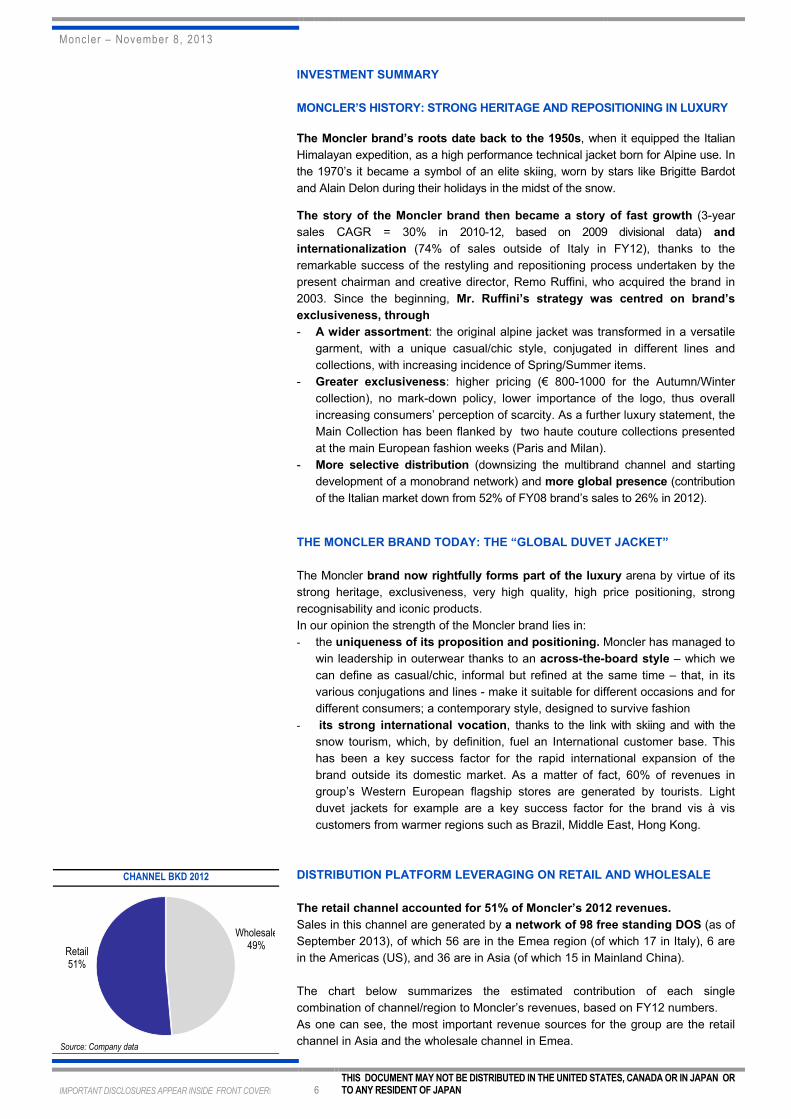
DISTRIBUTION PLATFORM LEVERAGING ON RETAIL AND WHOLESALE
The retail channel accounted for 51% of Moncler’s 2012 revenues.
Sales in this channel are generated by a network of 98 free standing DOS (as of
September 2013), of which 56 are in the Emea region (of which 17 in Italy), 6 are
in the Americas (US), and 36 are in Asia (of which 15 in Mainland China).
The chart below summarizes the estimated contribution of each single
combination of channel/region to Moncler’s revenues, based on FY12 numbers.
As one can see, the most important revenue sources for the group are the retail
channel in Asia and the wholesale channel in Emea.
CHANNEL BKD 2012
Source: Company data
Wholesale49%
Retail51%

Moncler – November 8, 2013
IMPORTANT DISCLOSURES APPEAR INSIDE FRONT COVER� 7 THIS DOCUMENT MAY NOT BE DISTRIBUTED IN THE UNITED STATES, CANADA OR IN JAPAN OR TO ANY RESIDENT OF JAPAN
MONCLER: MAIN CONTRIBUTORS TO TOTAL SALES
Source: Company data
A SUPERIOR TRACK RECORD WITH UNTAPPED GROWTH POTENTIAL
MONCLER: HISTORICAL TREND IN SALES AND EBITDA MARGIN (€ mn)
Source: Company data
Two years after the past IPO attempt of June 2011 (which ended with the entry of
Eurazeo in the company’s share capital), Moncler comes to the market today boasting:
- a clearer equity story, offering a pure bet on luxury, thanks to the disposal of
the “Casual Brands” division (four brands positioned in the medium/high-end
casual wear segment), which has been just signed (closing on November 8th).
- an even stronger brand positioning, with an enhanced sales mix in terms of
distribution channels (retail up to 51% of revenues vs. 27% in 2010, growing at
+82% 2Y CAGR) and geographies (Americas and Asia up to 42% of revenues
vs. 24% in 2010, growing at +73% 2Y CAGR), consistently with the strategic
guidelines highlighted by management two years ago.
- a superior track record of growth, with +30% 3Y sales CAGR in the 2010-
2012 period, significantly above the +11% CAGR of the global luxury market as
a whole and the +18% of main listed peers. The company has also beaten our
past IPO estimates by more than 20%, whereas the other main listed luxury
peers have exceeded 18-month-earlier consensus estimates by only 6%.
- best in class profitability, with Ebitda margin of 33%, at the top of the sector,
second only to Hermès and Prada which however can rely on a much stronger
exposure to leather goods and retail. We mainly attribute the superior
profitability of Moncler to its higher mark-ups (we estimate 10% above the
sector average, particularly abroad) and to its strong retail skills (full-price sell-
through that we estimate at 85-90%, no mark-down policy, best-in-class sales
densities - we estimate above € 30,000/sqm -, stores at break-even usually a
few months after inauguration).
15%
12%
24%8%5%
27%
5%5%
�� Emea
�� America
�� Asia
��Italy
dark = retail pale = wholesale
221
283
364
489
29%
32%31%
33%
25%
30%
35%
40%
45%
50%
0
100
200
300
400
500
600
2009 2010 2011 2012
Sales
Moncler – November 8, 2013
IMPORTANT DISCLOSURES APPEAR INSIDE FRONT COVER� 8 THIS DOCUMENT MAY NOT BE DISTRIBUTED IN THE UNITED STATES, CANADA OR IN JAPAN OR TO ANY RESIDENT OF JAPAN
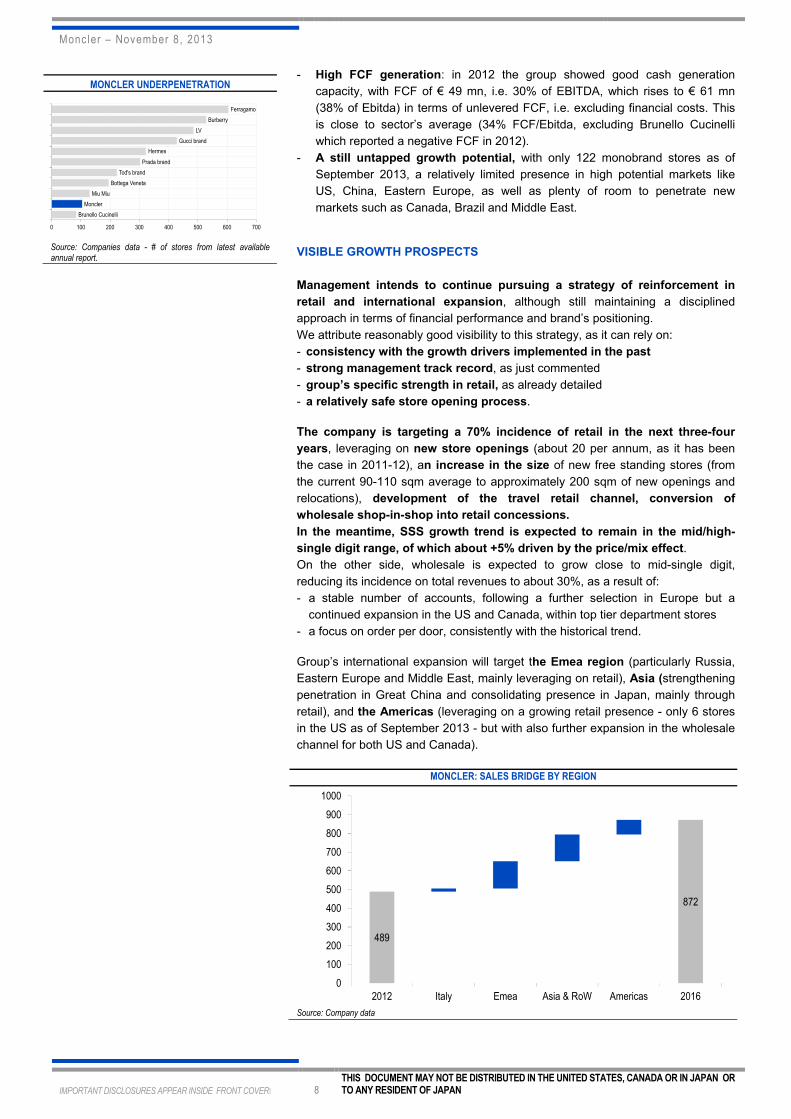
- High FCF generation: in 2012 the group showed good cash generation
capacity, with FCF of € 49 mn, i.e. 30% of EBITDA, which rises to € 61 mn
(38% of Ebitda) in terms of unlevered FCF, i.e. excluding financial costs. This
is close to sector’s average (34% FCF/Ebitda, excluding Brunello Cucinelli
which reported a negative FCF in 2012).
- A still untapped growth potential, with only 122 monobrand stores as of
September 2013, a relatively limited presence in high potential markets like
US, China, Eastern Europe, as well as plenty of room to penetrate new
markets such as Canada, Brazil and Middle East.
VISIBLE GROWTH PROSPECTS
Management intends to continue pursuing a strategy of reinforcement in
retail and international expansion, although still maintaining a disciplined
approach in terms of financial performance and brand’s positioning.
We attribute reasonably good visibility to this strategy, as it can rely on:
- consistency with the growth drivers implemented in the past
- strong management track record, as just commented
- group’s specific strength in retail, as already detailed
- a relatively safe store opening process.
The company is targeting a 70% incidence of retail in the next three-four
years, leveraging on new store openings (about 20 per annum, as it has been
the case in 2011-12), an increase in the size of new free standing stores (from
the current 90-110 sqm average to approximately 200 sqm of new openings and
relocations), development of the travel retail channel, conversion of
wholesale shop-in-shop into retail concessions.
In the meantime, SSS growth trend is expected to remain in the mid/high-
single digit range, of which about +5% driven by the price/mix effect.
On the other side, wholesale is expected to grow close to mid-single digit,
reducing its incidence on total revenues to about 30%, as a result of:
- a stable number of accounts, following a further selection in Europe but a
continued expansion in the US and Canada, within top tier department stores
- a focus on order per door, consistently with the historical trend.
Group’s international expansion will target the Emea region (particularly Russia,
Eastern Europe and Middle East, mainly leveraging on retail), Asia (strengthening
penetration in Great China and consolidating presence in Japan, mainly through
retail), and the Americas (leveraging on a growing retail presence - only 6 stores
in the US as of September 2013 - but with also further expansion in the wholesale
channel for both US and Canada).
MONCLER: SALES BRIDGE BY REGION
Source: Company data
MONCLER UNDERPENETRATION
Source: Companies data - # of stores from latest available annual report.
489
872
0
100
200
300
400
500
600
700
800
900
1000
2012 Italy Emea Asia & RoW Americas 2016
Brunello Cucinelli
Moncler
Miu Miu
Bottega Veneta
Tod's brand
Prada brand
Hermes
Gucci brand
LV
Burberry
Ferragamo
0 100 200 300 400 500 600 700
Moncler – November 8, 2013
IMPORTANT DISCLOSURES APPEAR INSIDE FRONT COVER� 9 THIS DOCUMENT MAY NOT BE DISTRIBUTED IN THE UNITED STATES, CANADA OR IN JAPAN OR TO ANY RESIDENT OF JAPAN
With outerwear still accounting for 85% of revenues, the company has also clear
growth opportunities in other product categories. Focus will be mainly on
knitwear, which is more consistent with the brand’s heritage. Offering is also
being widened in leather goods (still at 4-5% of revenues, mainly shoes), as well
as in accessories such as eyewear or suitcases, with recent specific product
initiatives. However, we see these drivers simply as a further support to
revenue growth, without factoring in any drastic acceleration in the
incidence of non-outerwear: management is in fact committed to remain
consistent with group’s DNA and heritage, focused on winter jackets.
9M RESULTS LARGELY UNDERPIN OUR FY13 ESTIMATES
Sales and EBITDA grew by +17.5% and +16% YoY respectively in 9M13, with
EBITDA margin slightly down to 29.5% vs. 29.9% in 9M12, and net profit up by
+19% YoY. 3Q in particular was up by +17% YoY in revenues (+22% YoY at
constant currency), with a slight improvement in EBITDA margin (+40 bps).
These results largely underpin our FY13 estimates, which might even turn to be
conservative: in particular we are factoring in:
- FY revenues up by +17%, or +22% at constant currency
- FY adj. EBITDA up by +16%, with EBITDA margin down -40 bps (following a
negative forex impact which we estimate in excess of 100 bps)
- FY adj. net profit up by +15%.
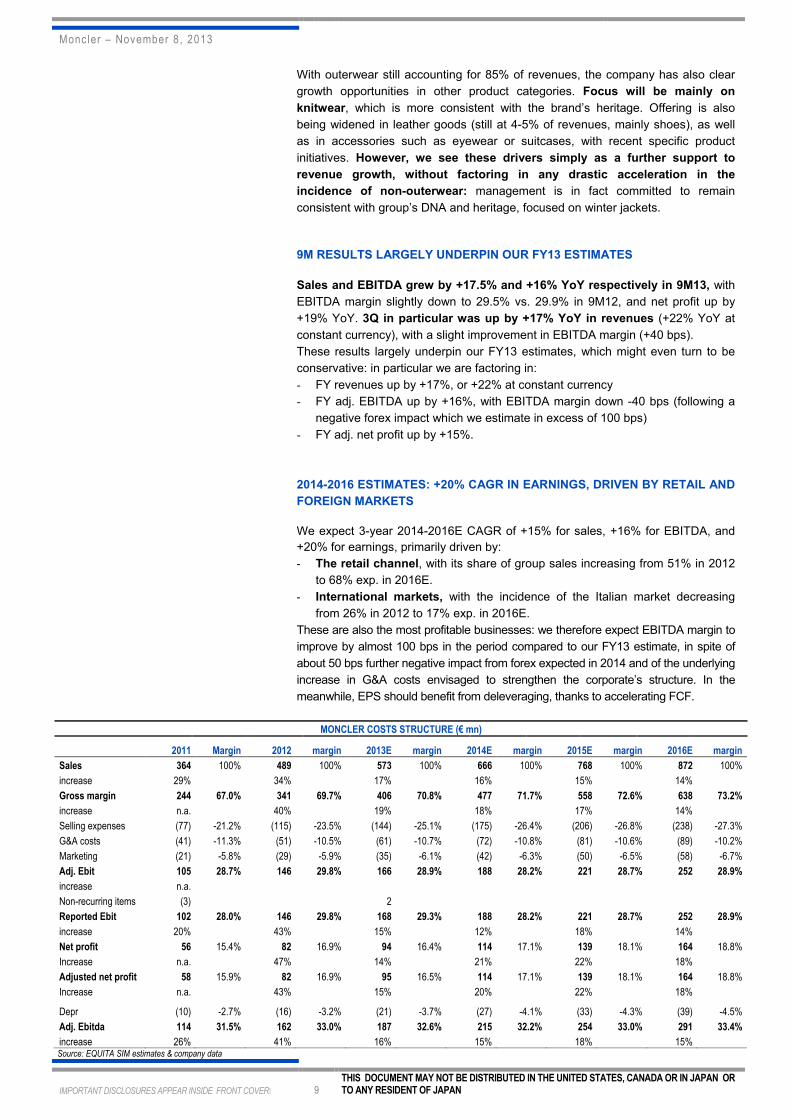
2014-2016 ESTIMATES: +20% CAGR IN EARNINGS, DRIVEN BY RETAIL AND
FOREIGN MARKETS
We expect 3-year 2014-2016E CAGR of +15% for sales, +16% for EBITDA, and
+20% for earnings, primarily driven by:
- The retail channel, with its share of group sales increasing from 51% in 2012
to 68% exp. in 2016E.
- International markets, with the incidence of the Italian market decreasing
from 26% in 2012 to 17% exp. in 2016E.
These are also the most profitable businesses: we therefore expect EBITDA margin to
improve by almost 100 bps in the period compared to our FY13 estimate, in spite of
about 50 bps further negative impact from forex expected in 2014 and of the underlying
increase in G&A costs envisaged to strengthen the corporate’s structure. In the
meanwhile, EPS should benefit from deleveraging, thanks to accelerating FCF.
MONCLER COSTS STRUCTURE (€ mn)
2011 Margin 2012 margin 2013E margin 2014E margin 2015E margin 2016E margin
Sales 364 100% 489 100% 573 100% 666 100% 768 100% 872 100%
increase 29% 34% 17% 16% 15% 14%
Gross margin 244 67.0% 341 69.7% 406 70.8% 477 71.7% 558 72.6% 638 73.2%
increase n.a. 40% 19% 18% 17% 14%
Selling expenses (77) -21.2% (115) -23.5% (144) -25.1% (175) -26.4% (206) -26.8% (238) -27.3%
G&A costs (41) -11.3% (51) -10.5% (61) -10.7% (72) -10.8% (81) -10.6% (89) -10.2%
Marketing (21) -5.8% (29) -5.9% (35) -6.1% (42) -6.3% (50) -6.5% (58) -6.7%
Adj. Ebit 105 28.7% 146 29.8% 166 28.9% 188 28.2% 221 28.7% 252 28.9%
increase n.a.
Non-recurring items (3) 2
Reported Ebit 102 28.0% 146 29.8% 168 29.3% 188 28.2% 221 28.7% 252 28.9%
increase 20% 43% 15% 12% 18% 14%
Net profit 56 15.4% 82 16.9% 94 16.4% 114 17.1% 139 18.1% 164 18.8%
Increase n.a. 47% 14% 21% 22% 18%
Adjusted net profit 58 15.9% 82 16.9% 95 16.5% 114 17.1% 139 18.1% 164 18.8%
Increase n.a. 43% 15% 20% 22% 18%
Depr (10) -2.7% (16) -3.2% (21) -3.7% (27) -4.1% (33) -4.3% (39) -4.5%
Adj. Ebitda 114 31.5% 162 33.0% 187 32.6% 215 32.2% 254 33.0% 291 33.4%
increase 26% 41% 16% 15% 18% 15% Source: EQUITA SIM estimates & company data
Moncler – November 8, 2013
IMPORTANT DISCLOSURES APPEAR INSIDE FRONT COVER� 10 THIS DOCUMENT MAY NOT BE DISTRIBUTED IN THE UNITED STATES, CANADA OR IN JAPAN OR TO ANY RESIDENT OF JAPAN
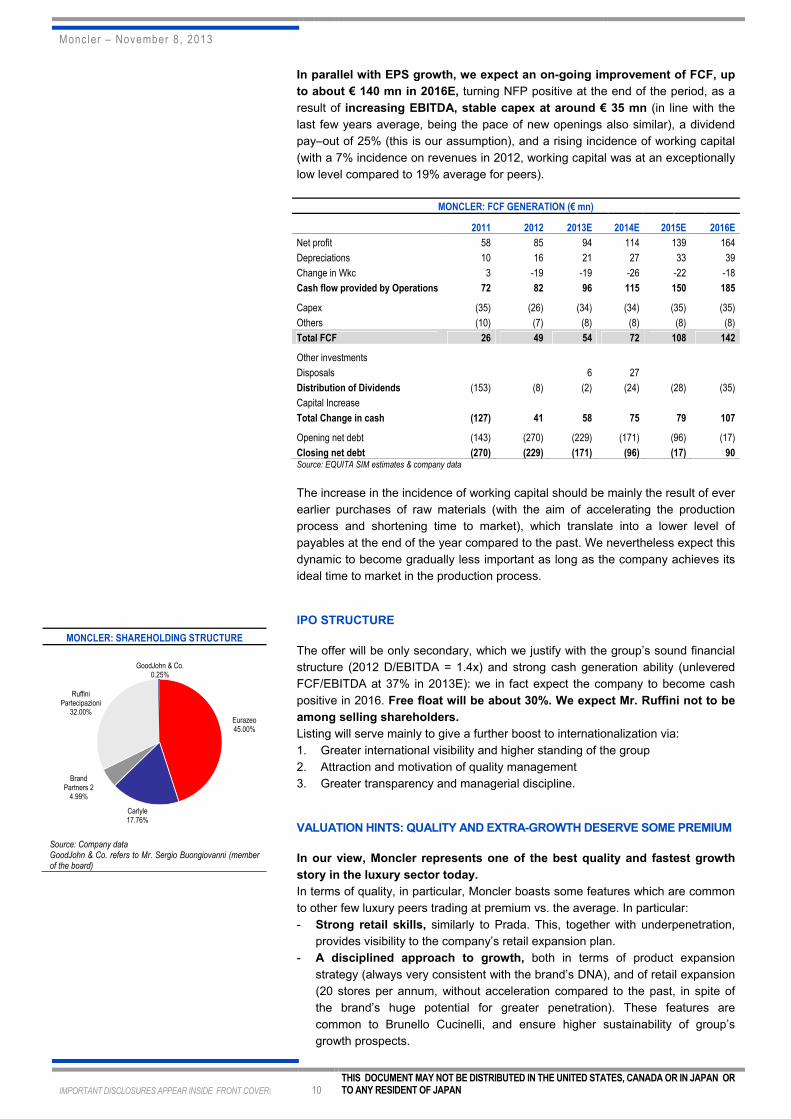
In parallel with EPS growth, we expect an on-going improvement of FCF, up
to about € 140 mn in 2016E, turning NFP positive at the end of the period, as a
result of increasing EBITDA, stable capex at around € 35 mn (in line with the
last few years average, being the pace of new openings also similar), a dividend
pay–out of 25% (this is our assumption), and a rising incidence of working capital
(with a 7% incidence on revenues in 2012, working capital was at an exceptionally
low level compared to 19% average for peers).
MONCLER: FCF GENERATION (€ mn)
2011 2012 2013E 2014E 2015E 2016E
Net profit 58 85 94 114 139 164
Depreciations 10 16 21 27 33 39
Change in Wkc 3 -19 -19 -26 -22 -18
Cash flow provided by Operations 72 82 96 115 150 185
Capex (35) (26) (34) (34) (35) (35)
Others (10) (7) (8) (8) (8) (8)
Total FCF 26 49 54 72 108 142
Other investments
Disposals 6 27
Distribution of Dividends (153) (8) (2) (24) (28) (35)
Capital Increase
Total Change in cash (127) 41 58 75 79 107
Opening net debt (143) (270) (229) (171) (96) (17)
Closing net debt (270) (229) (171) (96) (17) 90 Source: EQUITA SIM estimates & company data
The increase in the incidence of working capital should be mainly the result of ever
earlier purchases of raw materials (with the aim of accelerating the production
process and shortening time to market), which translate into a lower level of
payables at the end of the year compared to the past. We nevertheless expect this
dynamic to become gradually less important as long as the company achieves its
ideal time to market in the production process.
IPO STRUCTURE
The offer will be only secondary, which we justify with the group’s sound financial
structure (2012 D/EBITDA = 1.4x) and strong cash generation ability (unlevered
FCF/EBITDA at 37% in 2013E): we in fact expect the company to become cash
positive in 2016. Free float will be about 30%. We expect Mr. Ruffini not to be
among selling shareholders.
Listing will serve mainly to give a further boost to internationalization via:
1. Greater international visibility and higher standing of the group
2. Attraction and motivation of quality management
3. Greater transparency and managerial discipline.
VALUATION HINTS: QUALITY AND EXTRA-GROWTH DESERVE SOME PREMIUM
In our view, Moncler represents one of the best quality and fastest growth
story in the luxury sector today.
In terms of quality, in particular, Moncler boasts some features which are common
to other few luxury peers trading at premium vs. the average. In particular:
- Strong retail skills, similarly to Prada. This, together with underpenetration,
provides visibility to the company’s retail expansion plan.
- A disciplined approach to growth, both in terms of product expansion
strategy (always very consistent with the brand’s DNA), and of retail expansion
(20 stores per annum, without acceleration compared to the past, in spite of
the brand’s huge potential for greater penetration). These features are
common to Brunello Cucinelli, and ensure higher sustainability of group’s
growth prospects.
MONCLER: SHAREHOLDING STRUCTURE
Source: Company data GoodJohn & Co. refers to Mr. Sergio Buongiovanni (member of the board)
Eurazeo45.00%
Carlyle17.76%
Brand Partners 24.99%
Ruffini Partecipazioni32.00%
GoodJohn & Co.0.25%

Moncler – November 8, 2013
IMPORTANT DISCLOSURES APPEAR INSIDE FRONT COVER� 11 THIS DOCUMENT MAY NOT BE DISTRIBUTED IN THE UNITED STATES, CANADA OR IN JAPAN OR TO ANY RESIDENT OF JAPAN
- A low fashion content, which is a strong loyalty building element for
consumers. This feature recalls Brunello Cucinelli and Tod’s products.
- Highly recognizable and iconic products, which can be changed in few
details or in fabrics and colours - offering consumers always new occasions to
buy – while remaining always recognizable and up to date (similar to Tod’s).
- Best in class profitability (Ebitda margin at 33% on revenues, similarly to
Prada, compared to a 27% average for the sector) and high FCF generation
(37% unlevered FCF/Ebitda exp. in 2013E).
- Pure luxury play status, compared to other leading global brands such as
Gucci or Louis Vuitton, which are within big conglomerates.
MULTIPLE COMPARISON
Price Perf. EV/EBITDA Ebitda margin Sales growth P/E EPS Cagr Asia
€ 3M 2013E 2014E 2015E 2013E 2014E 2015E 2013E 2014E 2015E 2013E 2014E 2015E 2014E-15E Ex-Jap
Hermes 255 -2% 19.1 16.9 14.7 36% 36% 36% 9% 11% 12% 32.9 29.5 26.1 12% 32%
Brunello Cucinelli 23 9% 27.7 23.6 20.1 18% 19% 19% 14% 13% 13% 54.7 45.1 38.4 19% 12%
LVMH 140 1% 10.0 8.6 7.9 25% 25% 25% 8% 12% 9% 19.1 16.3 14.7 14% 28%
Richemont 93 0% 13.0 11.5 10.1 28% 29% 29% 8% 10% 9% 19.1 17.0 15.3 12% 41%
Tiffany 78 -4% 11.0 9.8 8.8 24% 24% 25% 5% 8% 9% 21.6 19.1 16.9 13% 21%
Burberry 1,494 -4% 10.4 9.2 8.2 26% 27% 24% 16% 14% 19% 17.8 15.5 14.1 12% 31%
Kering (luxury) 165 -8% 9.9 8.6 7.7 29% 29% 29% 1% 7% 9% 16.0 14.7 13.1 10% 31%
Swatch 575 3% 11.8 10.2 8.8 28% 29% 30% 12% 10% 9% 18.1 16.1 14.4 12% 49%
Tod's 124 -9% 14.1 12.7 11.1 26% 26% 27% 4% 7% 10% 25.2 22.5 19.7 13% 25%
Prada 77 7% 14.8 12.1 10.2 34% 35% 36% 12% 15% 13% 25.6 21.1 18.2 19% 36%
Ferragamo 25 -2% 15.5 13.3 11.0 22% 22% 24% 10% 11% 11% 28.6 24.5 20.5 18% 37%
Average 14.3 12.4 10.8 27% 27% 28% 9% 11% 11% 25.3 22.0 19.2 14% 31%
Average ex-BC & RMS -2% 12.3 10.7 9.3 27% 27% 28% 9% 10% 11% 21.2 18.5 16.3 Moncler 33% 32% 33% 17% 16% 15% 21% 16% Source: Bloomberg consensus and EQUITA SIM estimates. Closure prices of Nov 7th , 2013
Moncler also deserves a premium in our view for its faster growth prospects,
with expected EPS CAGR in 2014-15 of +21% vs. 14% average for the sector.
For this reason, we would focus valuation on 2015 rather than on 2013-14, in
order to try to capture most of the company’s extra-growth potential.
Overall, for all the reasons just mentioned, we think the company should
merit a multiple above the luxury sector average.
The following table shows an analysis of the valuation’s sensitivity to the various
multiples applied and the corresponding percentage of premium or discount vs.
the average of peers we have identified.
We have excluded from the calculation of the sector’s average the two outlyiers,
featuring the lowest stock liquidity, i.e. Hermès (because of its small free float) and
Brunello Cucinelli (with its peculiar long term project of “sustainable growth”, which
explains a relatively stable “shareholders’ club”).
SENSITIVITY OF VALUATION
EV/EBITDA P/E
Equity (€ mn) 2013E 2014E 2015E 2013E 2014E 2015E
2,000 11.6 9.8 8.0 21.1 17.6 14.4
Premium (discount) vs. peers -5.2% -8.4% -14.6% -0.5% -5.2% -11.8%
2,200 12.7 10.7 8.7 23.3 19.3 15.8
Premium (discount) vs. peers 3.5% 0.4% -6.2% 9.5% 4.2% -3.0%
2,400 13.8 11.6 9.5 25.4 21.1 17.3
Premium (discount) vs. peers 12.3% 9.1% 2.3% 19.4% 13.7% 5.8%
2,600 14.8 12.6 10.3 27.5 22.8 18.7
Premium (discount) vs. peers 21.0% 17.9% 10.7% 29.4% 23.2% 14.6%
2,800 15.9 13.5 11.1 29.6 24.6 20.1
Premium (discount) vs. peers 29.7% 26.6% 19.2% 39.3% 32.7% 23.5%
3,000 17.0 14.4 11.9 31.7 26.4 21.6
Premium (discount) vs. peers 38.5% 35.4% 27.7% 49.3% 42.2% 32.3% Source: EQUITA SIM estimates

Moncler – November 8, 2013
IMPORTANT DISCLOSURES APPEAR INSIDE FRONT COVER� 12 THIS DOCUMENT MAY NOT BE DISTRIBUTED IN THE UNITED STATES, CANADA OR IN JAPAN OR TO ANY RESIDENT OF JAPAN
HIGH QUALITY, FOR BOTH CONSUMERS AND INVESTORS
The Moncler brand’s roots date back to the 1950s, when it equipped the Italian
Himalayan expedition, as a high performance technical jacket born for Alpine use. In
the 1970’s it became a symbol of an elite skiing, worn by stars like Brigitte Bardot
and Alain Delon during their holidays in the midst of the snow.
The story of the Moncler brand then became a story of fast
growth (3-year sales CAGR = 30% in 2010-12, based on 2009
divisional data) and internationalization (today 74% of sales
are generated abroad), thanks to the remarkable success of
the restyling and repositioning process undertaken by the
present chairman and creative director, Remo Ruffini, who
acquired the brand in 2003. Since the beginning, Mr. Ruffini’s
strategy was centred on brand’s exclusiveness, working on both product
offering (style, materials, overall brand’s architecture) and distribution (careful
selection in the wholesale channel, internalisation of licenses, start of a
monobrand presence consistent with the brand’s new image).
Today the Moncler brand not only rightfully forms part of the luxury arena
(strong heritage, exclusiveness, very high quality, high price positioning, strong
recognisability and iconic products) – but it also holds:
- a unique positioning as leader in luxury outerwear, with a contemporary
casual/chic style conceived to survive fashion, conjugated in several lines and
collections, suitable to a variegated public and different occasions for use.
- a strong international vocation, thanks to the link with skiing and with the snow
tourism, which, by definition, fuel an International customer base. As a matter of fact,
60% of revenues in group’s Western European flagship stores are generated by
tourists, with most of that coming from Non-European customers.
Two years after the past IPO attempt of June 2011 (which ended with the entry of
Eurazeo in the company’s share capital), Moncler comes to the market today boasting:
- a clearer equity story, offering a pure bet on luxury, thanks to the disposal of
the “Casual Brands” division (four brands positioned in the medium/high-end
casual wear segment), which has been just signed (closing on November 8th).
- an even stronger brand positioning, with an enhanced sales mix in terms of
distribution channels (retail up to 51% of revenues vs. 27% in 2010, growing at
+82% 2Y CAGR) and geographies (Americas and Asia up to 42% of revenues
vs. 24% in 2010, growing at +73% 2Y CAGR), consistently with the strategic
guidelines highlighted by management two years ago.
- a superior track record of growth and profitability (see the table below),
beating our past IPO estimates by more than 20%: the group has closed 2012
with € 489 mn revenues and € 162 mn Ebitda, with Ebitda margin of 33%, at
the top of the sector, second only to Hermès and Prada which however can
rely on a much stronger exposure to leather goods and retail.
- a still untapped growth potential, with only 122 monobrand stores as of
September 2013, a relatively limited presence in high potential markets like
US, China, Eastern Europe, as well as plenty of room to penetrate new
markets such as Canada, Brazil and Middle East.
Moncler represents in our view one of the best quality and fastest growth
story in the luxury sector today.
MONCLER MAIN NUMBERS (€ mn)
2010 Margin 2011 Margin 2012 Margin 3Y CAGR
Sales 283 100% 364 100% 489 100%
Increase 28.1% 28.7% 34.5% 30%
Adj. Ebitda 91 32% 114 31% 162 33%
Increase 41.1% 26.3% 41.2% 36%
Adj. Net profit n.a. n.a. 58 15.9% 82 16.9%
Increase n.a. n.a. 42.7% n.a. Source: Equita SIM estimates and Company data
CHANNEL BKD 2012
Source: Company data
GEOGRAPHICAL BKD 2012
Source: Company data
Wholesale49%
Retail51%
Italy26%
Emea ex Italy32%
Asia and RoW32%
Americas10%

Moncler – November 8, 2013
IMPORTANT DISCLOSURES APPEAR INSIDE FRONT COVER� 13 THIS DOCUMENT MAY NOT BE DISTRIBUTED IN THE UNITED STATES, CANADA OR IN JAPAN OR TO ANY RESIDENT OF JAPAN
GROUP’S ORIGINS AND PRESENT SHAREHOLDER BASE
To pass from the historical Moncler brand to the group that controls it today it is
necessary to go back to 2003, when the Italian entrepreneur Remo Ruffini -
present chairman and creative director - purchased the Moncler brand from the
Finpart group, within which he had made his mark as the creative director of the
subsidiary Pepper Industries (holding company for the brands that used to be part
of the “Other Brands” division, before their recent spin-off).
Purchase of the brand was followed by the purchase of operations. In 2005, with
the financial support of the Italian merchant bank Mittel, Mr. Ruffini in fact
purchased 100% of Pepper Industries, thus creating a whole group and initiating a
process of evolution and restyling of the main brand, Moncler.
In 2008, with entry as a shareholder of the Carlyle private equity fund, the relaunch
and internationalization plan initiated by Mr. Ruffini underwent acceleration,
particularly as regards strengthening of the retail strategy.
In June 2011, when the first IPO process took place, the sale to a third private
equity firm was finally preferred instead of the equity market: Eurazeo thus
entered the Moncler share capital with a 45% stake which it bought from:
- Carlyle (down from 48% to 17.76% today)
- Mittel (which, through its vehicle Brand Partners 2, went down from 13.5% to the
current 4.99%)
- Mr. Ruffini himself (through its holding company Ruffini Partecipazioni, which
went down from 38% to 32% today).
This is still the company’s current shareholding structure (see chart on the left).
When Carlyle entered the company in 2008, it valued Moncler Group (i.e.
including the “Other Brands” division) € 470 mn EV (i.e. 9x EV/EBITDA).
When Eurazeo entered the company in 2011, it valued the Moncler Group
(still including the “Other Brands” division) € 930 mn equity and € 1.2 bn EV
(following € 150 mn dividends distributed by the company just before the entry of
Eurazeo). The implied multiple at that time was 16x P/E or 10.2x EV/EBITDA,
based on our past estimates for 2011.
Most recently (August 2013), also the Investment Company Tamburi
Investment Partners acquired an indirect stake in Moncler (buying 14% of
Ruffini Partecipazioni from Mr. Ruffini), with an implicit valuation that we
estimate close to € 2 bn equity or € 2.17 bn EV. This would imply a 2013 P/E of
21x and EV/EBITDA of 11.6x (based on our 2013 estimates). An earn-out
mechanism has also been envisaged in favour of Mr. Ruffini.
THE IPO
The offer will be only secondary, which we justify with the group’s sound financial
structure (2012 D/EBITDA = 1.4x) and strong cash generation ability (unlevered
FCF/EBITDA at 40% in 2013E): we in fact expect the company to become cash
positive in 2016.
Free float will be about 30%. We expect Mr. Ruffini not to be among selling
shareholders.
Listing will serve mainly to give a further boost to internationalization via:
1. Greater international visibility and higher standing of the group
2. Attraction and motivation of quality management, including managers already
present in the company. A stock option plan up to 3% of company’s share
capital will be in place after the listing.
3. Greater transparency and managerial discipline.
MONCLER: SHAREHOLDING STRUCTURE
Source: Company data GoodJohn & Co. refers to Mr. Sergio Buongiovanni (member of the board)
Eurazeo45.00%
Carlyle17.76%
Brand Partners 24.99%
Ruffini Partecipazioni32.00%
GoodJohn & Co.0.25%

Moncler – November 8, 2013
IMPORTANT DISCLOSURES APPEAR INSIDE FRONT COVER� 14 THIS DOCUMENT MAY NOT BE DISTRIBUTED IN THE UNITED STATES, CANADA OR IN JAPAN OR TO ANY RESIDENT OF JAPAN
REPOSITIONING IN THE LUXURY ARENA: UNIQUENESS AND EXCLUSIVITY
In the 1980s the original Moncler duvet jacket had become a metropolitan
garment, in glazed nylon and flashy colours (blue, yellow, orange and green), with
a well visible logo on the front, immediately establishing itself as a must-have for
teenagers: a real fashion phenomenon. However, after the 1980s “explosion”, the
brand gradually lost its sparkle.
We now review the main steps of the repositioning and internationalization
process started by Mr. Ruffini in 2003, which has instead made of Moncler the
leading luxury sportswear brand as we know it today.
MONCLER BRAND REPOSITIONING
Source: Company data
� Wider assortment: beyond the historical sporty winter jackets
1) Wearability and materials: while maintaining and revisiting the historical
roots of the original alpine garment, on which the brand’s strong heritage is
based, at the same time Mr. Ruffini and his team have transformed it, with the
aim of making it an across-the-board brand, capable of being conjugated in
different occasions and for different consumers. In this way the duvet jacket
has become more feminine, slimmer and more chic – and also more versatile,
elegant and contemporary, suitable no longer just for the mountains and sport,
but also for towns and for the various moments of everyday life.
2) Overall architecture of the brand: Moncler Main Collection, the best known
and widest spread, has been developed in several lines with different styles
and price positionings (Première, Sport Chic and Archive), and new product
categories have been added to flank outerwear. The Main Collection has also
been joined by Grenoble, a technical/outdoor sports collection with a total look
proposition. At the same time, as a further luxury statement, the Main
Collection has been flanked by two haute couture collections (Gamme Rouge
for women, launched in 2006, and Gamme Bleu for men, launched in 2009),
designed by internationally famous stylists and presented at the main
European fashion weeks (Paris and Milan).
3) Deseasonalization: the weight of the Spring/Summer collections has steadily
increased in both channels, thanks also to innovative products such as the
“long saison” jacket (an extremely light down jacket, which can either be used
as a summer jacket or as an under-jacket for the colder days. Spring/summer
items now account for 30% in the wholesale channel and 15% in the retail
channel (the incidence is lower in retail as new stores are usually opened in
the F/W season, and also because the selling period of the S/S season is
usually shorter in group’s DOS, carrying winter items at full price also during
the January/February period).
Moncler – November 8, 2013
IMPORTANT DISCLOSURES APPEAR INSIDE FRONT COVER� 15 THIS DOCUMENT MAY NOT BE DISTRIBUTED IN THE UNITED STATES, CANADA OR IN JAPAN OR TO ANY RESIDENT OF JAPAN
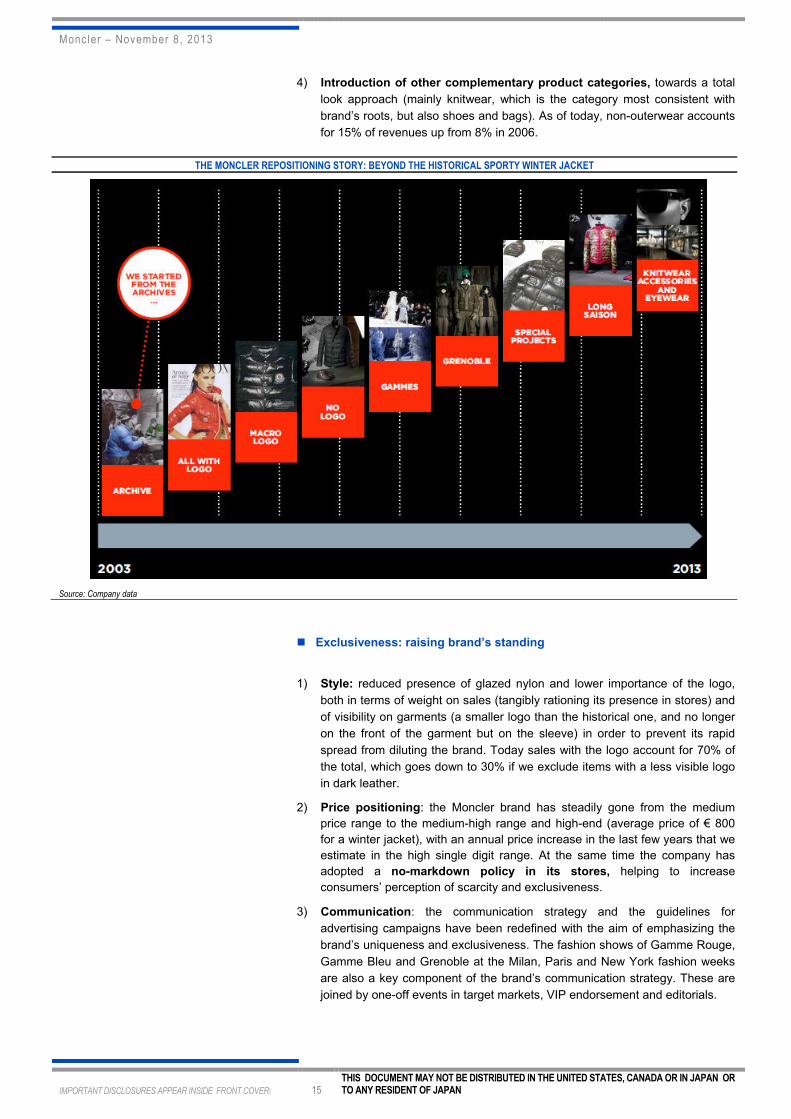
4) Introduction of other complementary product categories, towards a total
look approach (mainly knitwear, which is the category most consistent with
brand’s roots, but also shoes and bags). As of today, non-outerwear accounts
for 15% of revenues up from 8% in 2006.
THE MONCLER REPOSITIONING STORY: BEYOND THE HISTORICAL SPORTY WINTER JACKET
Source: Company data
� Exclusiveness: raising brand’s standing
1) Style: reduced presence of glazed nylon and lower importance of the logo,
both in terms of weight on sales (tangibly rationing its presence in stores) and
of visibility on garments (a smaller logo than the historical one, and no longer
on the front of the garment but on the sleeve) in order to prevent its rapid
spread from diluting the brand. Today sales with the logo account for 70% of
the total, which goes down to 30% if we exclude items with a less visible logo
in dark leather.
2) Price positioning: the Moncler brand has steadily gone from the medium
price range to the medium-high range and high-end (average price of € 800
for a winter jacket), with an annual price increase in the last few years that we
estimate in the high single digit range. At the same time the company has
adopted a no-markdown policy in its stores, helping to increase
consumers’ perception of scarcity and exclusiveness.
3) Communication: the communication strategy and the guidelines for
advertising campaigns have been redefined with the aim of emphasizing the
brand’s uniqueness and exclusiveness. The fashion shows of Gamme Rouge,
Gamme Bleu and Grenoble at the Milan, Paris and New York fashion weeks
are also a key component of the brand’s communication strategy. These are
joined by one-off events in target markets, VIP endorsement and editorials.

Moncler – November 8, 2013
IMPORTANT DISCLOSURES APPEAR INSIDE FRONT COVER� 16 THIS DOCUMENT MAY NOT BE DISTRIBUTED IN THE UNITED STATES, CANADA OR IN JAPAN OR TO ANY RESIDENT OF JAPAN
� Distribution: more selective and global
1) Downsizing of wholesale network of multibrand stores, which decreased
from about 2,800 stores in 2008 to about 1,850 as of today, with more
stringent selection above all in Italy and Japan were the wholesale presence
was most spread. Since the beginning, focus has shifted from the sports
product channel to that of apparel boutiques. The choice of stores now meets
specific criteria of consistency with the brand’s image in terms of choice of
assortment, store location and Moncler’s products visibility.
2) Development of a monobrand network to help strengthen the Moncler brand’s
image and accompany its internationalization. The first sky resort boutique was
opened in 2006, and in 2007 the first urban store. Today (as of September 2013),
the Moncler brand has 122 monobrand stores, of which 98 directly operated
(DOS), located in the main international cities and in some of the most
exclusive skiing localities.
3) Control of distribution, with the internalization in 2009 of licenses for the
Japanese market and for children’s wear, through the creation of two
dedicated joint ventures, 51% and 50.1% owned by the group, respectively
(the JV for the Enfant business has also been recently terminated and
Moncler will fully control the business as from January 1st, 2014).
4) Increasing penetration abroad, in particular in Asia but also in North America
and in the rest of Europe. The brand is now distributed in 66 countries around
the world. The incidence of the Italian market, in fact, has gradually
decreased, particularly in the last few years, going down from 52% of Moncler
brand revenues in 2008 to 26% in 2012.
MONCLER GROUP: EVOLUTION OF THE SALES MIX
GEOGRAPHICAL
Source: Company data
BY CHANNEL
Source: Company data
MONCLER GROUP: SUCCESSFUL PRODUCT EXPANSION
BREAKDOWN BY PRODUCT (2012)
Source: Company data
BREAKDOWN BY SEASON (2012)
Source: Company data
87% 83%73%
62%49%
13% 17%27%
38%51%
2008 2009 2010 2011 2012
Wholesale Retail
Outerwear85%
Non Outerwear15%
Fall/Winter77%
Spring/Summer23%
52% 50%42%
34%26%
34% 33%34%
33%32%
9% 13%18%
25%32%
5% 4% 6% 8% 10%
2008 2009 2010 2011 2012
Italy Emea ex Italy Asia and RoW Americas

Moncler – November 8, 2013
IMPORTANT DISCLOSURES APPEAR INSIDE FRONT COVER� 17 THIS DOCUMENT MAY NOT BE DISTRIBUTED IN THE UNITED STATES, CANADA OR IN JAPAN OR TO ANY RESIDENT OF JAPAN
THE MONCLER BRAND TODAY: “THE GLOBAL DUVET JACKET”
Thanks to the excellent work done by Mr. Ruffini and his team since 2003 to date,
the Moncler brand is now able to count on:
- Unique positioning in the luxury arena, with high international vocation
- A varied and structured proposition
- Multichannel and global distribution, efficient and consistent with the
brand’s positioning.
� A unique positioning in the luxury arena
Today the Moncler brand rightfully forms part of the luxury arena by virtue of its:
- Strong heritage, due to its historical reputation as a high-performance alpine
garment, associated with the important achievements of professional
mountaineers.
- Exclusiveness, fuelled by the high price positioning (as for outerwear, we
estimate an average price of € 800-1000 for the Autumn/Winter collection and
of € 400-500 for the Spring/Summer collection), by the company’s no-
markdown policy, by the presence only in select stores and by the Group’s
efforts to avoid inflation of the famous logo.
- Very high quality: (1) selected raw materials, sourcing of which is directly
managed by the company, (2) constant and directly managed quality checks
throughout the production process (fully outsourced), and (3) production
totally made in Europe (mainly Eastern Europe) with some items even
handmade in Italy (Gamme Rouge and Gamme Bleu collections).
- Strong recognisability, thanks to its easy visibility (outerwear is always
visible by definition) and to its iconic products (evergreen account for 20% of
Moncler’s revenues). Moncler has in fact become synonymous of duvet; its
brand awareness has always been very strong not only in its domestic market
but also in Japan, and has recently increased considerably in China and in the
US.
- a strong international vocation, thanks to the link with skiing and with the
snow tourism, which, by definition, fuel an International customer base. This
has been a key success factor for the rapid international expansion of the
brand outside its domestic market. Suffice it to say that 60% of revenues in
group’s Western European flagship stores are generated by tourists (similar
to more international brands such as Prada and Salvatore Ferragamo, and
above the 30/40% incidence we estimate for less international brands, such
as Brunello Cucinelli or Tod’s). Most of tourists purchases are generated from
Non-European customers. Light duvet jackets for example are a key success
factor for the brand vis à vis customers from warmer regions such as Brazil,
Middle East, Hong Kong.
In our opinion the strength of the Moncler brand lies in the uniqueness of its
proposition and positioning. Moncler has managed to win leadership in
outerwear thanks to an across-the-board style – which we can define as
casual/chic, informal but refined at the same time – that, in its various conjugations
and lines - make it suitable for different occasions and for different consumers.
Mr. Ruffini often explains this valuable versatility very effectively: the Moncler
duvet jacket must “dialogue with a variegated public, from the grey-suited manager
to the boy on a scooter, from the skiing enthusiast to the lady attending the first
night of La Scala’s opera season”.

Moncler – November 8, 2013
IMPORTANT DISCLOSURES APPEAR INSIDE FRONT COVER� 18 THIS DOCUMENT MAY NOT BE DISTRIBUTED IN THE UNITED STATES, CANADA OR IN JAPAN OR TO ANY RESIDENT OF JAPAN
� A structured proposition, conjugated in different collections and lines
The overall brand architecture that management has developed since 2003
exactly reflects the across-the-board positioning that is its hallmark.
In effect, the Moncler proposition is organized in several lines and collections,
covering the various segments of the luxury pyramid comprehensively and in a
structured manner, while at the same time meeting different needs in terms of use.
All the collections in turn comprise two seasons: Autumn/Winter (which, overall,
accounts for about 77% of the brand’s total sales in FY12) and
Spring/Summer (23% of the total).
Some collections also feature product categories other than outerwear (about 15%
of 2012 sales, of which we estimate about two thirds is knitwear and about one
third are accessories, mostly shoes).
The proposition is also balanced in terms of gender: excluding the children’s
segment (which we estimate accounted for some 5-10% of FY2012 sales) the
respective weight of the collections for men and women is in fact similar.
MONCLER BRAND: COLLECTION STRUCTURE
Source: Company data
Main Collection: easy to wear
The Main Collection is the most important collection (we estimate it accounts for
some 85-90% of sales). It is also the one most accessible in terms of price
positioning and more versatile in terms of use and wearability. It also includes a
select offering of products other than outwear – in particular knitwear and cut &
sewn items, but also accessories (footwear and, to a lesser extent, bags).
The Main Collection in turn is organized in several lines:
- Première (for women only): the most elegant and refined, and thus also the
most expensive
- Sport Chic (for men and women): it embodies a sober, contemporary style, for
metropolitan use
- Archive (for men and women): based on the brand’s historical roots, with
models taken from the archive and revamped, mostly showing the typical
logo
- Enfant (for children).
1,500 €
1,000 €
800 €
300 €
Avg Price

Moncler – November 8, 2013
IMPORTANT DISCLOSURES APPEAR INSIDE FRONT COVER� 19 THIS DOCUMENT MAY NOT BE DISTRIBUTED IN THE UNITED STATES, CANADA OR IN JAPAN OR TO ANY RESIDENT OF JAPAN
Grenoble: a sporty/active concept
This is the collection with the greatest technical content, designed for outdoor
sport and evoking the brand’s main historical products.
In this case the proposition is a total look, with a complete outfit, which includes
trousers, t-shirts, pullovers, coordinated accessories (above all footwear) and, of
course, the strong point, outerwear.
Fashion content is nevertheless in the forefront. This collection is in fact presented
during the New York fashion week.
Grenoble is sold only in DOS and by a few select multibrand retailers.
Gamme Rouge/Gamme Bleu: Haute Couture collections
These are the highest end collections of the Moncler
brand’s proposition, made in Italy, tailored and hand-
made, almost entirely dedicated to outerwear and
designed by famous international stylists.
The first of the two, the Gamme Rouge collection for
women, was launched in 2006. Designed first by
Alessandra Facchinetti and then by Giambattista Valli, it
embodies a sophisticated, modern and refined
interpretation of the duvet jacket.
The second one, the Gamme Bleu collection for men, was launched in 2009. Still
designed by the stylist Thom Browne today, it is a proposition that combines
sartorial quality and a sporty core.
Both collections are shown during the main fashion
weeks (Gamme Rouge in Milan and Gamme Bleu in
Paris), contributing to underpin brand positioning
and image on a global scale.
Retail distribution is highly selective for these two
collections. They are sold only in few select DOS and in
the most exclusive multibrand boutiques (around 250
stores in total).
Special Projects & Capsule Collections
Capsule collections are highly innovative collections realised through
collaborations with avantgarde designers, which give freshness and energy to the
brand and might become source of inspiration for Moncler’s other lines.
The same is true for some special projects like the one launched with Rimowa for
a multi-wheel cabin trolley.
Eyewear
Consistently with its strong attention to product quality and brand positioning, the
company has decided to pursue its growth in the eyewear segment directly and
not through a license, as it is instead typical in the industry.
Moncler has in fact recently signed a Joint-Venture with the eyewear producer and
distributor Allison (51% Moncler and 49% Allison): the first sunglass collection has
been presented at the latest Mido fair in May, and also a prescription collection
has recently been launched at the Silmo fair at the beginning of October.

Moncler – November 8, 2013
IMPORTANT DISCLOSURES APPEAR INSIDE FRONT COVER� 20 THIS DOCUMENT MAY NOT BE DISTRIBUTED IN THE UNITED STATES, CANADA OR IN JAPAN OR TO ANY RESIDENT OF JAPAN
A global distribution platform leveraging on retail and wholesale
The chart below summarizes the estimated contribution of each single
combination of channel/region to Moncler’s revenues, based on FY12 numbers.
As one can see, the most important revenue sources for the group are the retail
channel in Asia and the wholesale channel in Emea.
MONCLER: MAIN CONTRIBUTORS TO TOTAL SALES
Source: Company data
The retail channel accounted for 51% of Moncler’s 2012 revenues.
Sales in this channel are generated by a network of 98 free standing DOS (as of
September 2013), of which 56 are in the Emea region (of which 17 in Italy), 6 are
in the Americas (US), and 36 are in Asia (of which 15 in Mainland China).
MONCLER: DOS STORE NETWORK (as of Sept. 2013)
Source: Company data
15%
12%
24%8%5%
27%
5%5%
�� Emea
�� America
�� Asia
��Italy
dark = retail pale = wholesale
8
11
1517
16
24
31
39
12
22
31
36
34
6 6
0
5
10
15
20
25
30
35
40
2010 2011 2012 Sept. 2013
Italy Emea Asia Americas

Moncler – November 8, 2013
IMPORTANT DISCLOSURES APPEAR INSIDE FRONT COVER� 21 THIS DOCUMENT MAY NOT BE DISTRIBUTED IN THE UNITED STATES, CANADA OR IN JAPAN OR TO ANY RESIDENT OF JAPAN
Free standing stores can show different formats:
- Flagship stores: located in top luxury streets, these stores are the most
representative of Moncler’s image and positioning. Thanks to their size (400
sqm on average) - they are also the ones carrying the widest assortment of the
brand’s collections and product range. Main flagship stores are Milan (via
Montenapoleone), Paris, New York, Tokyo, Beijing, Shanghai, Hong Kong.
- Urban boutiques: they are located in the main cities (including Milan, Paris,
Munich, Zurich, London, Los Angeles, Chicago, Osaka, Tokyo, Shanghai,
Beijing, Hong Kong) and their size is in the 90-250-sqm range (we estimate 150-
160 sqm on average). Thanks to their large size, they usually carry a wide
assortment.
- Ski resort boutiques: they are located in the best-known
and most exclusive ski resorts (St Moritz, Cortina,
Courmayeur, Crans-sur-Sierre, Megève, Courchevel,
Aspen, Gstaad, Verbier, Kitzbuhel, and Zermatt) and have
a smaller average size than urban boutiques (in the 35-100
sqm range, with the exception of the flagship in St. Moritz,
recently reopened with a 200 sqm surface – see picture on
the left). These stores have a specific assortment, different
to that of urban boutiques not only for reasons of space, but
also in order to give more emphasis to more technical
products, thus expressing the link with Moncler’s heritage
and DNA.
- Concessions: these are corners located in the main department stores and run
directly by the company. They have an assortment similar to that of urban
boutiques but narrower because of the smaller spaces (between 20 sqm and 65
sqm). The company was running 26 concessions as of September 2013.
- Outlets: they take the unsold stock of the retail network or any production
surplus to the wholesale backlog. The company does not produce on purpose
for the outlet channel. These stores are always located in the main outlet malls
worldwide. The company was running 12 outlets as of September 2013, of
which 3 in Italy. Outlets’ sales account for about 8% of total group’s revenues
On the other side the wholesale channel, accounting for 49% of the Moncler
brand’s sales in 2012, is organized in:
- Multibrand stores: about 1,850 independent boutiques worldwide as of
September 2013 (of which about 50% in Emea and about 30% in Italy),
meticulously selected to assure consistency with brand positioning. As a
reference, the Moncler’s wholesale presence in Italy is below that of the Tod’s
group in terms of number of accounts (about 500, vs. close to 600 for Tod’s).
This network is almost exclusively dedicated to the Main Collection since, as we
have seen, Grenoble and Gamme Rouge/Gamme Bleu have even more
exclusive distribution.
- Shop in Shop: 23 as of September 2013. These are corners in selected top tier
department stores (including Bergdorf Goodman, Bloomingdale’s, Neiman
Marcus, Harrods, Tsum, Harvey Nichols and Shinsegae). Size of these spaces
ranges between 20 and 65 sqm. On top of the 23 corners, the group also has
one franchised store in Seoul (Korea).
Moncler – November 8, 2013
IMPORTANT DISCLOSURES APPEAR INSIDE FRONT COVER� 22 THIS DOCUMENT MAY NOT BE DISTRIBUTED IN THE UNITED STATES, CANADA OR IN JAPAN OR TO ANY RESIDENT OF JAPAN
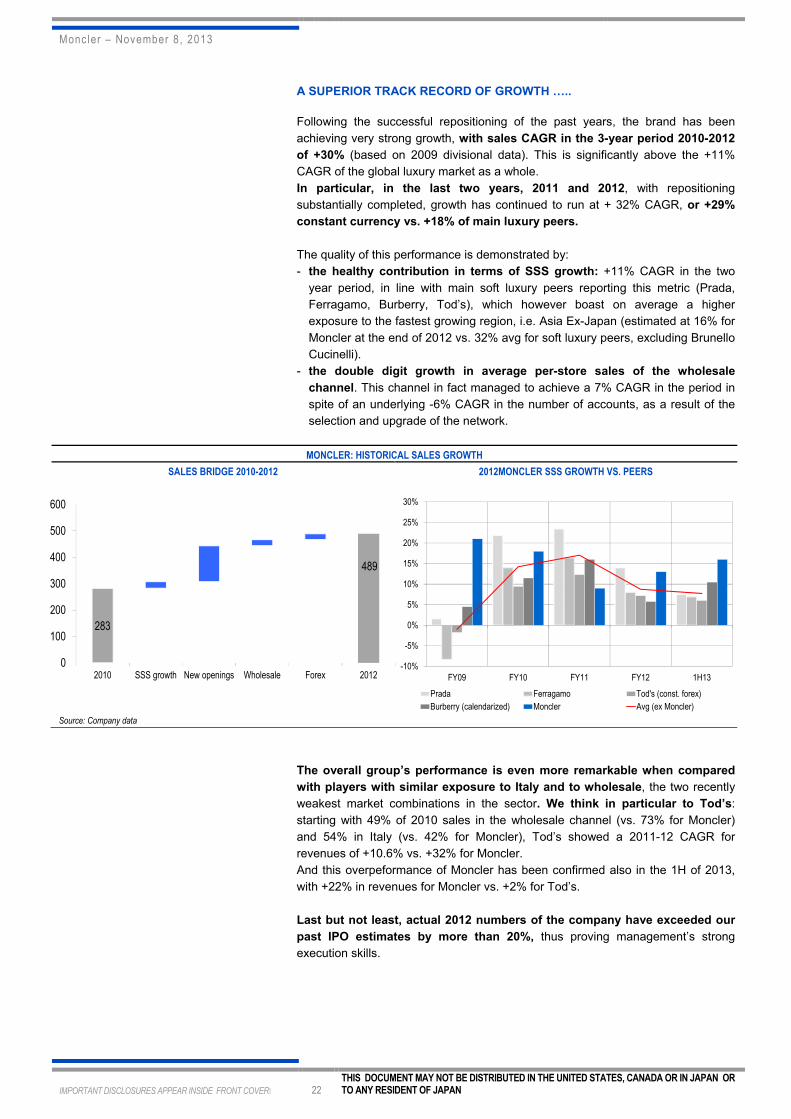
A SUPERIOR TRACK RECORD OF GROWTH …..
Following the successful repositioning of the past years, the brand has been
achieving very strong growth, with sales CAGR in the 3-year period 2010-2012
of +30% (based on 2009 divisional data). This is significantly above the +11%
CAGR of the global luxury market as a whole.
In particular, in the last two years, 2011 and 2012, with repositioning
substantially completed, growth has continued to run at + 32% CAGR, or +29%
constant currency vs. +18% of main luxury peers.
The quality of this performance is demonstrated by:
- the healthy contribution in terms of SSS growth: +11% CAGR in the two
year period, in line with main soft luxury peers reporting this metric (Prada,
Ferragamo, Burberry, Tod’s), which however boast on average a higher
exposure to the fastest growing region, i.e. Asia Ex-Japan (estimated at 16% for
Moncler at the end of 2012 vs. 32% avg for soft luxury peers, excluding Brunello
Cucinelli).
- the double digit growth in average per-store sales of the wholesale
channel. This channel in fact managed to achieve a 7% CAGR in the period in
spite of an underlying -6% CAGR in the number of accounts, as a result of the
selection and upgrade of the network.
MONCLER: HISTORICAL SALES GROWTH
SALES BRIDGE 2010-2012 2012MONCLER SSS GROWTH VS. PEERS
Source: Company data
The overall group’s performance is even more remarkable when compared
with players with similar exposure to Italy and to wholesale, the two recently
weakest market combinations in the sector. We think in particular to Tod’s:
starting with 49% of 2010 sales in the wholesale channel (vs. 73% for Moncler)
and 54% in Italy (vs. 42% for Moncler), Tod’s showed a 2011-12 CAGR for
revenues of +10.6% vs. +32% for Moncler.
And this overpeformance of Moncler has been confirmed also in the 1H of 2013,
with +22% in revenues for Moncler vs. +2% for Tod’s.
Last but not least, actual 2012 numbers of the company have exceeded our
past IPO estimates by more than 20%, thus proving management’s strong
execution skills.
-10%
-5%
0%
5%
10%
15%
20%
25%
30%
FY09 FY10 FY11 FY12 1H13
Prada Ferragamo Tod's (const. forex)
Burberry (calendarized) Moncler Avg (ex Moncler)
283
489
0
100
200
300
400
500
600
2010 SSS growth New openings Wholesale Forex 2012

Moncler – November 8, 2013
IMPORTANT DISCLOSURES APPEAR INSIDE FRONT COVER� 23 THIS DOCUMENT MAY NOT BE DISTRIBUTED IN THE UNITED STATES, CANADA OR IN JAPAN OR TO ANY RESIDENT OF JAPAN
As for Moncler, the comparison with past estimates must refer to the old group’s
set-up, which used to include also the recently disposed casual wear division
(three proprietary brands - Henry Cotton’s, Marina Yachting, Coast+Weber+House
- and the licensed brand 18CRR81 Cerruti). This was in fact the structure of the
Moncler group at the time of the past IPO attempt.
Actual numbers are reported in the Moncler Group’s 2012 consolidated annual
report, and we have compared them with past estimates in the table below.
MONCLER GROUP: STRONG BEAT OF PAST IPO ESTIMATES (€ mn)
2010 2011E 2012E 2011A 2012A BEAT OF 2012
Sales 429 488 550 513 624 13%
Increase 15% 14% 13% 20% 22%
Adj. Ebitda 102 117 134 123 170 27%
Increase 33% 15% 15% 20% 39%
Adj. Net profit 52 60 70 58 76 9%
Increase 44% 16% 17% 12% 31%
Moncler brand revenues 283 342 403 364 489 21%
Increase 28% 21% 18% 29% 34%
Other brands revenues 146 146 147 149 135 -8%
Increase -4% 0% 0% 2% -10% Source: EQUITA SIM estimates & company data
The brands included in the “other brands” division used to be much more exposed
to wholesale and to the Italian market, and they have in fact performed below
original expectations.
On the other side, the Moncler brand alone, which comes to the market
today, significantly exceeded original expectations both in terms of sales
and EBITDA. Beat in net profit, still at 9%, would have been even stronger should
the company not have distributed the € 150 mn dividend at the end of 2011, which
was not included in our estimates as of May 2011; this in fact entailed higher
financial costs compared to our original projections.
If we instead look to the other main listed luxury peers, actual 2012 numbers
have exceeded 18-month-earlier consensus estimates by only 6%, as an
average between some virtuous examples (Hermès, Burberry, Prada) and some
disappointments (mainly Tiffany and Tod’s, the latter being affected by its
particularly high exposure to Italian Wholesale).
ACTUAL VS. CONSENSUS EPS OF PEERS (€)
2012E 2012A Beat/(miss)
Hermes 5.3 7.0 32%
LVMH 6.9 6.7 -3%
Richemont 3.5 3.7 3%
Tiffany 3.8 2.5 -34%
Burberry 68.6 88.0 28%
Tod's 5.1 4.8 -6%
Ferragamo 0.6 0.7 3%
Prada 0.2 0.2 22%
Average +6% Source: Bloomberg
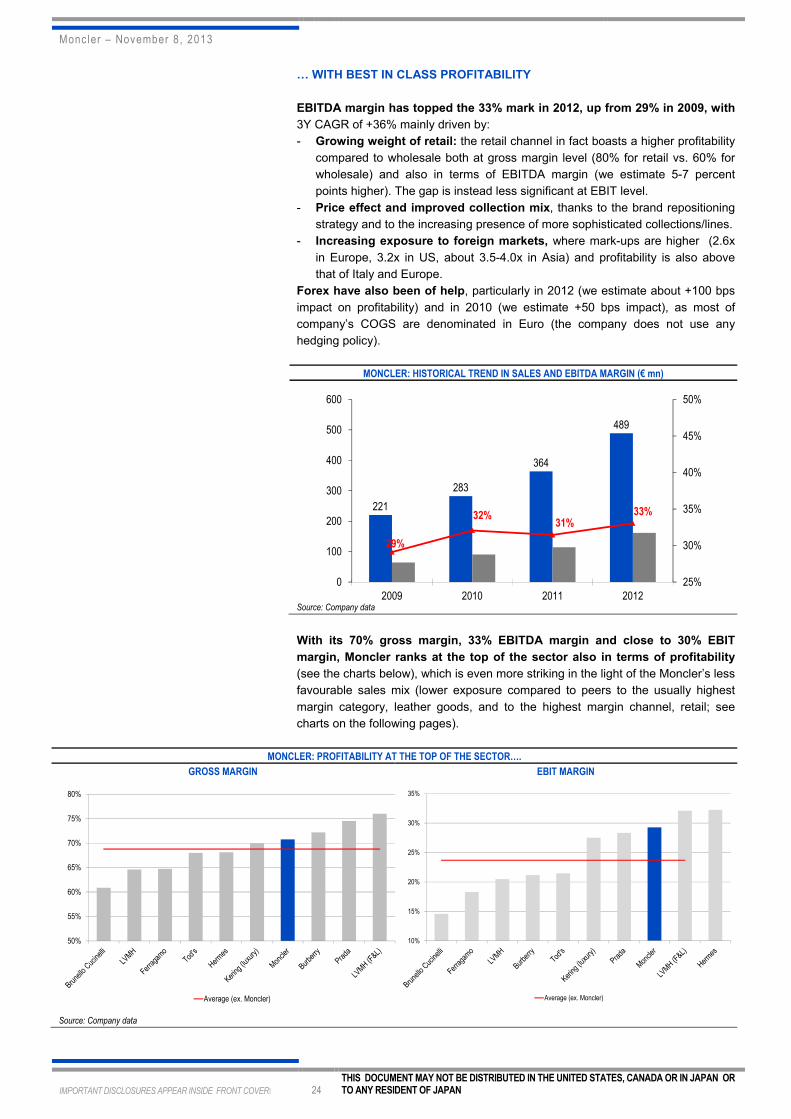
Moncler – November 8, 2013
IMPORTANT DISCLOSURES APPEAR INSIDE FRONT COVER� 24 THIS DOCUMENT MAY NOT BE DISTRIBUTED IN THE UNITED STATES, CANADA OR IN JAPAN OR TO ANY RESIDENT OF JAPAN
… WITH BEST IN CLASS PROFITABILITY
EBITDA margin has topped the 33% mark in 2012, up from 29% in 2009, with
3Y CAGR of +36% mainly driven by:
- Growing weight of retail: the retail channel in fact boasts a higher profitability
compared to wholesale both at gross margin level (80% for retail vs. 60% for
wholesale) and also in terms of EBITDA margin (we estimate 5-7 percent
points higher). The gap is instead less significant at EBIT level.
- Price effect and improved collection mix, thanks to the brand repositioning
strategy and to the increasing presence of more sophisticated collections/lines.
- Increasing exposure to foreign markets, where mark-ups are higher (2.6x
in Europe, 3.2x in US, about 3.5-4.0x in Asia) and profitability is also above
that of Italy and Europe.
Forex have also been of help, particularly in 2012 (we estimate about +100 bps
impact on profitability) and in 2010 (we estimate +50 bps impact), as most of
company’s COGS are denominated in Euro (the company does not use any
hedging policy).
MONCLER: HISTORICAL TREND IN SALES AND EBITDA MARGIN (€ mn)
Source: Company data
With its 70% gross margin, 33% EBITDA margin and close to 30% EBIT
margin, Moncler ranks at the top of the sector also in terms of profitability
(see the charts below), which is even more striking in the light of the Moncler’s less
favourable sales mix (lower exposure compared to peers to the usually highest
margin category, leather goods, and to the highest margin channel, retail; see
charts on the following pages).
MONCLER: PROFITABILITY AT THE TOP OF THE SECTOR….
GROSS MARGIN EBIT MARGIN
Source: Company data
10%
15%
20%
25%
30%
35%
Average (ex. Moncler)
50%
55%
60%
65%
70%
75%
80%
Average (ex. Moncler)
221
283
364
489
29%
32%31%
33%
25%
30%
35%
40%
45%
50%
0
100
200
300
400
500
600
2009 2010 2011 2012
Sales

Moncler – November 8, 2013
IMPORTANT DISCLOSURES APPEAR INSIDE FRONT COVER� 25 THIS DOCUMENT MAY NOT BE DISTRIBUTED IN THE UNITED STATES, CANADA OR IN JAPAN OR TO ANY RESIDENT OF JAPAN
….. IN SPITE OF A LESS FAVOURABLE SALES MIX VS. PEERS
PRODUCT MIX CHANNEL MIX
Source: Company data
We attribute the superior profitability of Moncler to:
1) Its higher mark-ups compared to peers, particularly in Non-European markets
(we estimate average mark-up for the sector is about 2.3-2.5x for Europe, 2.7-
3.0x for US and 3.0-3.5x for Asia). This is mainly reflected by the high group’s
gross margin.
2) its strong retail performances:
- full-price sell-through that we estimate at 85-90%
- no mark-down policy
- best-in-class sales densities (we estimate above € 30,000/sqm)
- break-even usually a few months after inauguration (stores are mainly
opened in the 2H of the year, which is the period of highest seasonality for
the brand).
- Pay-back period of less than two years on average (€ 6k per sqm is the
average capex for a new store).
MONCLER: BEST IN CLASS SALES DENSITY
SALES PER SQM (€ k) SALES PER STORE (€ mn)
Source: Company data
If we consider how recent is the development of the group’s retail network, we can
also imagine how much room is left for further improvements, for example in
terms of replenishments, which have still a marginal weight.
0%
10%
20%
30%
40%
50%
60%
70%
80%
90%
100%
Leather Goods Shoes Apparel Others Average (ex-BC; ex-Moncler)
0%
10%
20%
30%
40%
50%
60%
70%
80%
90%
100%
retail Wholesale Others Average (ex-BC; ex-Moncler)
0
5
10
15
20
25
30
35
Ferragamo Burberry BrunelloCucinelli
Tod's Prada Group Moncler
-
5.0
10.0
15.0
20.0
25.0

Moncler – November 8, 2013
IMPORTANT DISCLOSURES APPEAR INSIDE FRONT COVER� 26 THIS DOCUMENT MAY NOT BE DISTRIBUTED IN THE UNITED STATES, CANADA OR IN JAPAN OR TO ANY RESIDENT OF JAPAN
As of now, the company has already all its stores connected through the internal
ERP system, with a daily monitoring of SSS growth trends; on top of this, a buffer
of finished products is kept at group’s four regional warehouses (Piacenza for
Europe, New Jersey for Americas, Tokyo for Japan and Hong Kong for the rest of
Asia) in order to meet possible request of additional products from the stores
during the selling season.
However this only happens for some best-selling carry-over items, in order to
maintain a low inventory risk: this is mainly the consequence of the company’s
long production lead-time (approximately one year from design to the start of the
retail sales season).
We expect a gradual further evolution of the supply chain in the coming
years, which might lead to a shorter production lead time and an increasing weight
of replenishments also for more innovative items, possibly translating into
additional sales opportunities.
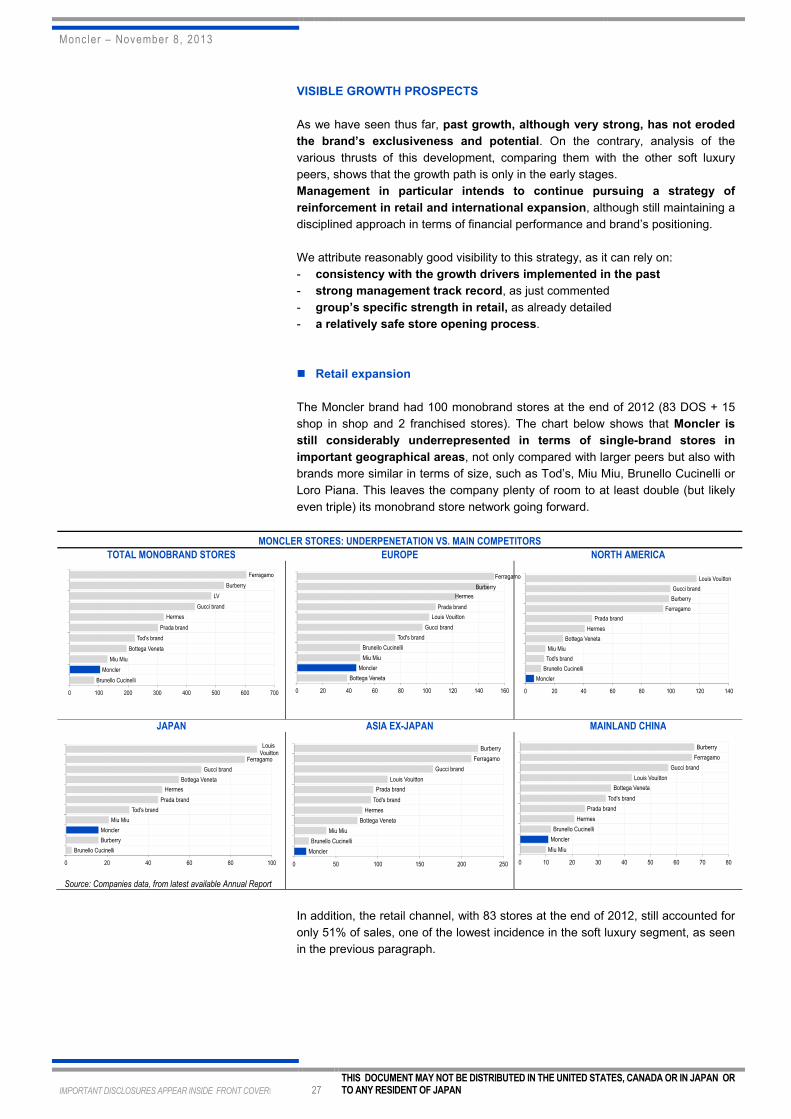
Moncler – November 8, 2013
IMPORTANT DISCLOSURES APPEAR INSIDE FRONT COVER� 27 THIS DOCUMENT MAY NOT BE DISTRIBUTED IN THE UNITED STATES, CANADA OR IN JAPAN OR TO ANY RESIDENT OF JAPAN
VISIBLE GROWTH PROSPECTS
As we have seen thus far, past growth, although very strong, has not eroded
the brand’s exclusiveness and potential. On the contrary, analysis of the
various thrusts of this development, comparing them with the other soft luxury
peers, shows that the growth path is only in the early stages.
Management in particular intends to continue pursuing a strategy of
reinforcement in retail and international expansion, although still maintaining a
disciplined approach in terms of financial performance and brand’s positioning.
We attribute reasonably good visibility to this strategy, as it can rely on:
- consistency with the growth drivers implemented in the past
- strong management track record, as just commented
- group’s specific strength in retail, as already detailed
- a relatively safe store opening process.
� Retail expansion
The Moncler brand had 100 monobrand stores at the end of 2012 (83 DOS + 15
shop in shop and 2 franchised stores). The chart below shows that Moncler is
still considerably underrepresented in terms of single-brand stores in
important geographical areas, not only compared with larger peers but also with
brands more similar in terms of size, such as Tod’s, Miu Miu, Brunello Cucinelli or
Loro Piana. This leaves the company plenty of room to at least double (but likely
even triple) its monobrand store network going forward.
MONCLER STORES: UNDERPENETATION VS. MAIN COMPETITORS
TOTAL MONOBRAND STORES EUROPE NORTH AMERICA
JAPAN ASIA EX-JAPAN MAINLAND CHINA
Source: Companies data, from latest available Annual Report
In addition, the retail channel, with 83 stores at the end of 2012, still accounted for
only 51% of sales, one of the lowest incidence in the soft luxury segment, as seen
in the previous paragraph.
Brunello Cucinelli
Moncler
Miu Miu
Bottega Veneta
Tod's brand
Prada brand
Hermes
Gucci brand
LV
Burberry
Ferragamo
0 100 200 300 400 500 600 700
Bottega Veneta
Moncler
Miu Miu
Brunello Cucinelli
Tod's brand
Gucci brand
Louis Vouitton
Prada brand
Hermes
Burberry
Ferragamo
0 20 40 60 80 100 120 140 160
Moncler
Brunello Cucinelli
Tod's brand
Miu Miu
Bottega Veneta
Hermes
Prada brand
Ferragamo
Burberry
Gucci brand
Louis Vouitton
0 20 40 60 80 100 120 140
Brunello Cucinelli
Burberry
Moncler
Miu Miu
Tod's brand
Prada brand
Hermes
Bottega Veneta
Gucci brand
Ferragamo
LouisVouitton
0 20 40 60 80 100
Moncler
Brunello Cucinelli
Miu Miu
Bottega Veneta
Hermes
Tod's brand
Prada brand
Louis Vouitton
Gucci brand
Ferragamo
Burberry
0 50 100 150 200 250
Miu Miu
Moncler
Brunello Cucinelli
Hermes
Prada brand
Tod's brand
Bottega Veneta
Louis Vouitton
Gucci brand
Ferragamo
Burberry
0 10 20 30 40 50 60 70 80

Moncler – November 8, 2013
IMPORTANT DISCLOSURES APPEAR INSIDE FRONT COVER� 28 THIS DOCUMENT MAY NOT BE DISTRIBUTED IN THE UNITED STATES, CANADA OR IN JAPAN OR TO ANY RESIDENT OF JAPAN
Management is targeting a 70% incidence of retail in the next three-four
years, leveraging on:
- New store openings (about 20 per annum, as it has been the case in 2011-12),
in the urban or flagship formats. The key targets are the premier high street
locations in Europe and Japan for flagship stores (for a footprint consolidation
on historical group’s markets), plus a growing penetration in US and China as
well as a starting presence in new markets (such as Russia, Eastern Europe,
Middle East, Canada, Brazil).
- An increase in the size of new free standing stores, from the current 90-110
sqm average to approximately 200 sqm of new openings and relocations, in
order to adequately accommodate in the stores all lines and product categories,
including knitwear and accessories.
- Development of the travel retail channel, which as of today consists of one
store only (in Fiumicino), with a target of further 5-6 openings in the next few
years.
- Conversion of wholesale shop-in-shop into retail concessions.
- Growth of the e-commerce revenues. The www.moncler.com website was
launched with the F/W 2011, in partnership with Yoox, the leading global
internet retailer, already the partner of numerous top international brands for
management of their respective monobrand sites. As of today, online sales
account for 1-2% of total brand’s revenues, a size similar to a flagship store. The
site has been launched in EU, US and in China (2012); a mobile platform is also
expected to be launched by year end.
Execution of this retail expansion strategy also appears relatively safe for
Moncler in the light of:
- The group’s disciplined approach in terms of financial performance: all
stores are budgeted to reach break-even within one year and to have a payback
period of less than three years. Actually, stores opened are usually in advance
compared with these objectives.
- The relatively small size of new stores, with 200 sqm for urban stores and 60-
80 sqm for concessions and travel retail stores.
- The attention to prevent any possible brand dilution: as a way of example,
in Mainland China, where the group currently operates 15 DOS, management
intends to open only further 8-10 stores in the next few years, just targeting 1st
and 2nd tier cities.
- The advance visibility on new locations: as a way of example, as of today the
group has already secured 18 stores out of a total of 20 new openings
envisaged for the next year.
- A relatively “controlled” pace of new openings (20 per year): this is in fact in
line with the last couple of years, without requiring any acceleration.
Management has already proven to be able to execute such a store opening plan.
In the meantime, SSS growth trend is expected to remain in the mid to high-
single digit range, of which about +5% driven by the price/mix effect. The
company is in fact always committed to rise the quality and material content of the
product: accordingly, management is also targeting the creation of a production
engineering team to search for innovative and technological solutions, materials
and weights.
On the other side, wholesale is expected to grow close to mid-single digit,
reducing its incidence on total revenues to about 30%, as a result of:
- a stable number of accounts, following a further selection in Europe but a
continued expansion in the US and Canada, within top tier department stores
- a focus on order per door, consistently with the historical trend.

Moncler – November 8, 2013
IMPORTANT DISCLOSURES APPEAR INSIDE FRONT COVER� 29 THIS DOCUMENT MAY NOT BE DISTRIBUTED IN THE UNITED STATES, CANADA OR IN JAPAN OR TO ANY RESIDENT OF JAPAN
MONCLER: SALES BRIDGE BY CHANNEL
Source: Equita SIM estimates
� Geographical expansion
Group’s international expansion will target:
- The Emea region, and in particular Russia, Eastern Europe, Middle East,
mainly leveraging on new retail openings (for example, the company has just
signed for a new location in Moscow).
- The Asian markets, aiming to strengthen penetration in Great China and to
consolidate its presence in Japan. Also in this case, retail will be the priority.
- The Americas, leveraging on a growing retail presence (flagship free standing
stores – only 6 stores in the US as of September 2013 - and concessions
within main luxury malls) but with also further expansion in the wholesale
channel (for both US and Canada), plus starting retail penetration in Brasil.
Management looks particularly confident on the potential of the US market,
thanks to a strong momentum of the brand and a rising appetite for luxury and
quality from the American consumer.
Overall, the Americas is expected to be the fastest growing region but Emea and
Asia will actually be the main contributors to group’s growth due to their relatively
larger size. Overall Italy, keeping a slightly positive trend in revenues, is expected
to further reduce its incidence on total revenues to about 15-20% vs. 26% at the
end of 2012.
MONCLER: SALES BRIDGE BY REGION
Source: Equita SIM estimates
489
872
0
100
200
300
400
500
600
700
800
900
1000
2012 Italy Emea Asia & RoW Americas 2016
489
872
0
100
200
300
400
500
600
700
800
900
1000
2012 SSS growth New openings Wholesale Forex 2016

Moncler – November 8, 2013
IMPORTANT DISCLOSURES APPEAR INSIDE FRONT COVER� 30 THIS DOCUMENT MAY NOT BE DISTRIBUTED IN THE UNITED STATES, CANADA OR IN JAPAN OR TO ANY RESIDENT OF JAPAN
� Opportunities in non-outerwear
With outerwear still accounting for 85% of revenues, the company has clear
growth opportunities in other product categories.
Focus will be mainly on knitwear, which is more consistent with the brand’s
heritage: sweaters in cashmere or wool, often combined with down in order to
state the link with Moncler’s DNA. Management is also targeting the creation of an
industrial platform dedicated to knitwear, in order to strengthen know-how and
innovation skills, as well as quality.
Offering is also being widened in leather goods (still at 4-5% of revenues, mainly
shoes), as well as in accessories such as eyewear or suitcases, with recent
specific product initiatives. At the same time the group will exploit an increased
presence of the Grenoble line, which proposes a complete outfit.
However, we see these drivers simply as a further support to revenue
growth, without factoring in any drastic acceleration in the incidence of non-
outerwear: management is in fact committed to remain consistent with group’s
DNA and heritage, focused on winter jackets.
The same in fact apply for the Spring/Summer season: this could potentially rise
its incidence up to 30% of revenues (as it is already the case for the wholesale
channel alone), but actually we expect an only marginal and gradual increase
going forward.
We have also to bear in mind that pricing for non-outerwear is about 30-40% that
of outerwear, while the average price of Spring/Summer garments is
approximately half that of Autumn/Winter garments. However, given the envisaged
consistency of the sales mix for the future, we expect an only marginal dilutive
effect on average group’s price and gross margin.

Moncler – November 8, 2013
IMPORTANT DISCLOSURES APPEAR INSIDE FRONT COVER� 31 THIS DOCUMENT MAY NOT BE DISTRIBUTED IN THE UNITED STATES, CANADA OR IN JAPAN OR TO ANY RESIDENT OF JAPAN
SEASONALITY OF RESULTS
The group features strong seasonality both of earnings and of cash generation.
Overall, we calculate that the 2H – were sales of the Fall/Winter season are
concentrated – accounts for almost 70% of the group’s full-year sales.
This depends on
- the seasonality of the product proposition. We recall the fact that
Fall/Winter collections account for 85% of Moncler’s revenues.
- the particular strategy of the company in developing the retail channel, with
new openings always concentrated in the 2H of the year, being this the period
of strongest seasonality for the brand and for retail in general.
Moreover, the strategy of retail expansion – with growing incidence of this channel
on total revenues - combined with such a strong sales seasonality, means that
growth rates are not evenly spread during the year, with stronger growth in 4Q
(where retail is concentrated) compared with the trend anticipated by earlier
quarters – with this being true both for sales/EBITDA and for cash
generation.
� Seasonality of sales and EBITDA
The third quarter is the most important one (about 35% of revenues and we
estimate about 40% of full-year EBITDA), as it is the one in which sales to
wholesale for the most important Fall/Winter season are concentrated.
It is followed by the fourth quarter (more than 30% of revenues and we
estimate about 40% of fully-year EBITDA), as this is generally the most
important quarter for the retail channel – particularly for the Moncler brand which
concentrates its sales in the winter season. The fourth quarter in fact accounts for
approximately 50% of the group’s FY retail sales.
MONCLER: SEASONALITY OF REVENUES (2011-2012)
Source: Company data
The first quarter accounts for around 20% of full-year revenues and we
estimate a bit less in terms of EBITDA: deliveries to wholesale for the
Spring/Summer season are usually concentrated in this period, whilst retail is still
selling Fall/Winter garments at full price (no-discount policy in group’s direct
stores, even during the end-of-season sales period).
1Q11 2Q11 3Q11 4Q11 1Q12 2Q12 3Q12 4Q12
Wholesale Retail
% quarterly contribution:
22% 9% 41% 28% 22% 10% 36% 32%
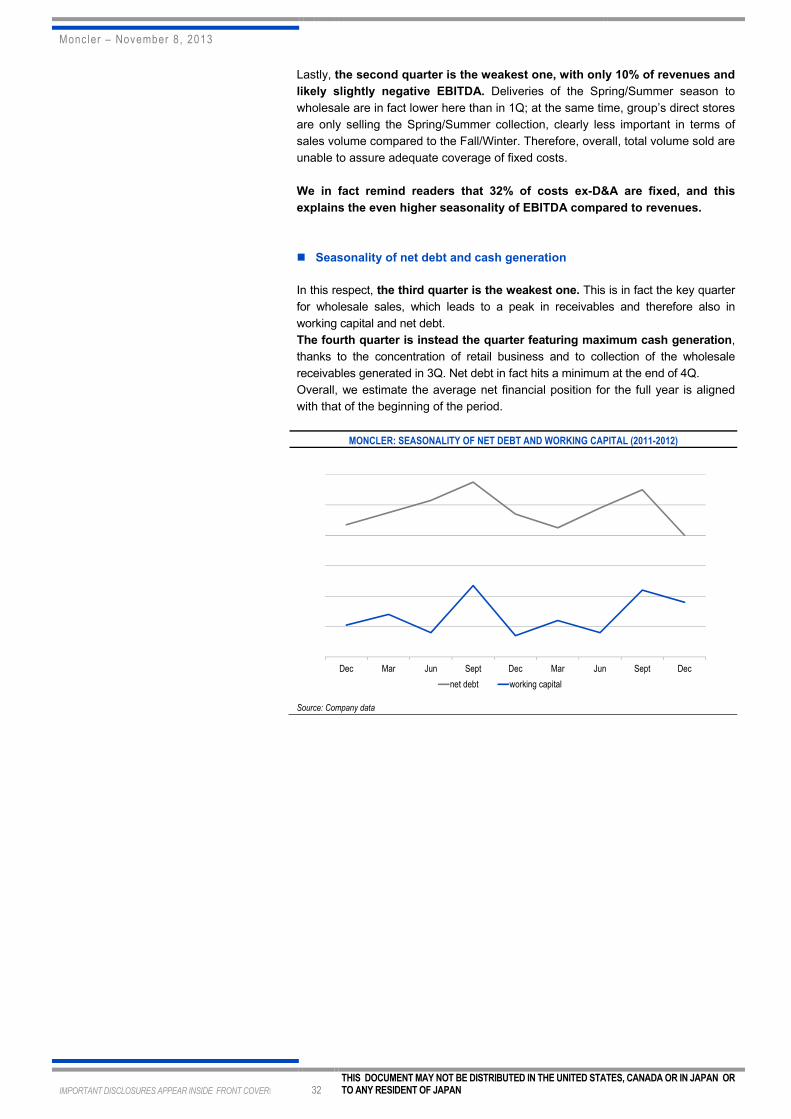
Moncler – November 8, 2013
IMPORTANT DISCLOSURES APPEAR INSIDE FRONT COVER� 32 THIS DOCUMENT MAY NOT BE DISTRIBUTED IN THE UNITED STATES, CANADA OR IN JAPAN OR TO ANY RESIDENT OF JAPAN
Lastly, the second quarter is the weakest one, with only 10% of revenues and
likely slightly negative EBITDA. Deliveries of the Spring/Summer season to
wholesale are in fact lower here than in 1Q; at the same time, group’s direct stores
are only selling the Spring/Summer collection, clearly less important in terms of
sales volume compared to the Fall/Winter. Therefore, overall, total volume sold are
unable to assure adequate coverage of fixed costs.
We in fact remind readers that 32% of costs ex-D&A are fixed, and this
explains the even higher seasonality of EBITDA compared to revenues.
� Seasonality of net debt and cash generation
In this respect, the third quarter is the weakest one. This is in fact the key quarter
for wholesale sales, which leads to a peak in receivables and therefore also in
working capital and net debt.
The fourth quarter is instead the quarter featuring maximum cash generation,
thanks to the concentration of retail business and to collection of the wholesale
receivables generated in 3Q. Net debt in fact hits a minimum at the end of 4Q.
Overall, we estimate the average net financial position for the full year is aligned
with that of the beginning of the period.
MONCLER: SEASONALITY OF NET DEBT AND WORKING CAPITAL (2011-2012)
Source: Company data
Dec Mar Jun Sept Dec Mar Jun Sept Dec
net debt working capital
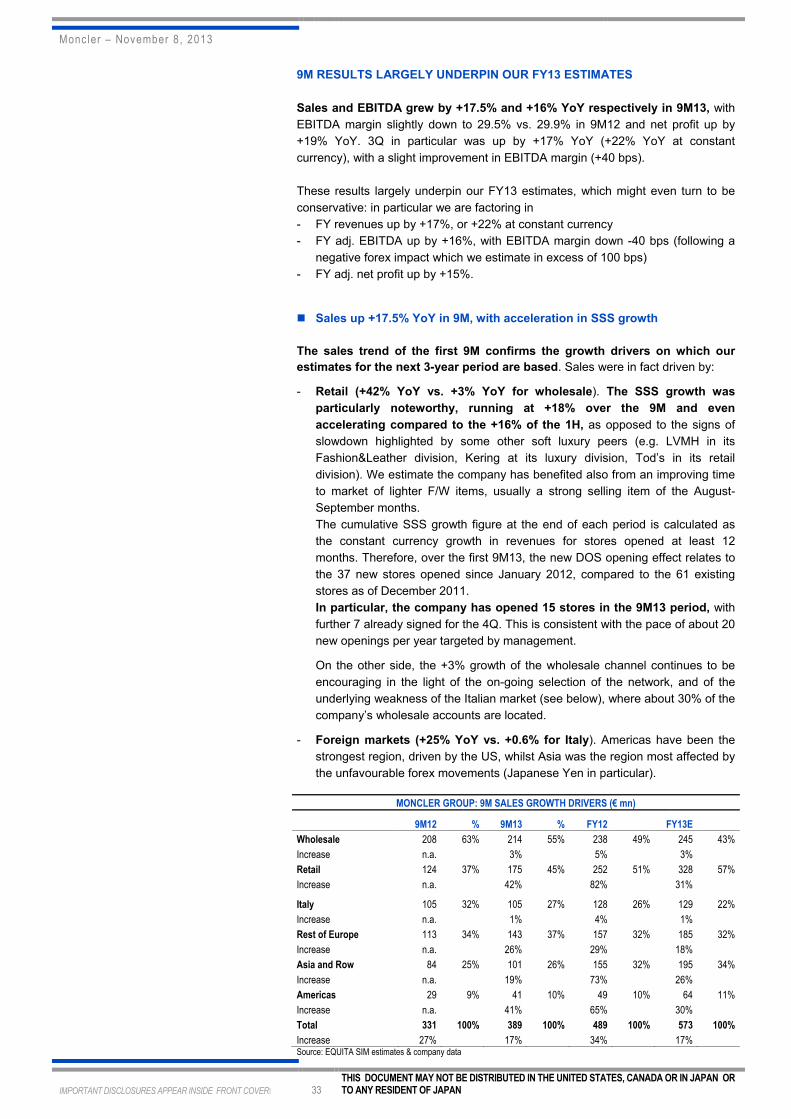
Moncler – November 8, 2013
IMPORTANT DISCLOSURES APPEAR INSIDE FRONT COVER� 33 THIS DOCUMENT MAY NOT BE DISTRIBUTED IN THE UNITED STATES, CANADA OR IN JAPAN OR TO ANY RESIDENT OF JAPAN
9M RESULTS LARGELY UNDERPIN OUR FY13 ESTIMATES
Sales and EBITDA grew by +17.5% and +16% YoY respectively in 9M13, with
EBITDA margin slightly down to 29.5% vs. 29.9% in 9M12 and net profit up by
+19% YoY. 3Q in particular was up by +17% YoY (+22% YoY at constant
currency), with a slight improvement in EBITDA margin (+40 bps).
These results largely underpin our FY13 estimates, which might even turn to be
conservative: in particular we are factoring in
- FY revenues up by +17%, or +22% at constant currency
- FY adj. EBITDA up by +16%, with EBITDA margin down -40 bps (following a
negative forex impact which we estimate in excess of 100 bps)
- FY adj. net profit up by +15%.
� Sales up +17.5% YoY in 9M, with acceleration in SSS growth
The sales trend of the first 9M confirms the growth drivers on which our
estimates for the next 3-year period are based. Sales were in fact driven by:
- Retail (+42% YoY vs. +3% YoY for wholesale). The SSS growth was
particularly noteworthy, running at +18% over the 9M and even
accelerating compared to the +16% of the 1H, as opposed to the signs of
slowdown highlighted by some other soft luxury peers (e.g. LVMH in its
Fashion&Leather division, Kering at its luxury division, Tod’s in its retail
division). We estimate the company has benefited also from an improving time
to market of lighter F/W items, usually a strong selling item of the August-
September months.
The cumulative SSS growth figure at the end of each period is calculated as
the constant currency growth in revenues for stores opened at least 12
months. Therefore, over the first 9M13, the new DOS opening effect relates to
the 37 new stores opened since January 2012, compared to the 61 existing
stores as of December 2011.
In particular, the company has opened 15 stores in the 9M13 period, with
further 7 already signed for the 4Q. This is consistent with the pace of about 20
new openings per year targeted by management.
On the other side, the +3% growth of the wholesale channel continues to be
encouraging in the light of the on-going selection of the network, and of the
underlying weakness of the Italian market (see below), where about 30% of the
company’s wholesale accounts are located.
- Foreign markets (+25% YoY vs. +0.6% for Italy). Americas have been the
strongest region, driven by the US, whilst Asia was the region most affected by
the unfavourable forex movements (Japanese Yen in particular).
MONCLER GROUP: 9M SALES GROWTH DRIVERS (€ mn)
9M12 % 9M13 % FY12 FY13E
Wholesale 208 63% 214 55% 238 49% 245 43%
Increase n.a. 3% 5% 3%
Retail 124 37% 175 45% 252 51% 328 57%
Increase n.a. 42% 82% 31%
Italy 105 32% 105 27% 128 26% 129 22%
Increase n.a. 1% 4% 1%
Rest of Europe 113 34% 143 37% 157 32% 185 32%
Increase n.a. 26% 29% 18%
Asia and Row 84 25% 101 26% 155 32% 195 34%
Increase n.a. 19% 73% 26%
Americas 29 9% 41 10% 49 10% 64 11%
Increase n.a. 41% 65% 30%
Total 331 100% 389 100% 489 100% 573 100%
Increase 27% 17% 34% 17% Source: EQUITA SIM estimates & company data
Moncler – November 8, 2013
IMPORTANT DISCLOSURES APPEAR INSIDE FRONT COVER� 34 THIS DOCUMENT MAY NOT BE DISTRIBUTED IN THE UNITED STATES, CANADA OR IN JAPAN OR TO ANY RESIDENT OF JAPAN
The revenue performance of the first 9M would apparently mark a sharp
slowdown compared to the +32% CAGR of the 2011-12 period, but we have to
bear in mind:
- The different impact from forex: -5% YoY in 9M13 as opposed to +4% reported
in 2012 and +1% reported in 2011.
- The additional contribution stemming in 2012 from the conversion to DOS of
the two big franchised stores located in Hong Kong, with the additional mark-
up on the respective volume sold accounting for about 4% of the 2012 reported
growth rate.
Having said that, the 9M sales trend fully underpins our +17% estimate for
the FY, with 4Q implicitly keeping the pace of the previous 9M.
Our estimate might even turn to be conservative: 4Q should in fact theoretically
mark an acceleration simply because of the seasonality peak of retail, which is the
fastest growing channel.
However, for the sake of prudence, we have taken into consideration:
a) The particularly challenging comparison base, with 4Q12 up by +55% YoY vs.
+27% YoY of 9M12 and +18% YoY of the 3Q12 alone.
b) The likely even heavier negative forex impact to be suffered in 4Q, as the
strongest depreciation is relative to Japan, where most of revenues are in the
retail channel and therefore concentrated in 4Q.
c) The lack of advanced visibility on a quarter with 80% of revenues driven by retail.
d) The signs of slowdown surfaced by some luxury players at the end of 3Q. Our
SSS growth estimate of +15% for the FY prudently allows for a similar
slowdown also at Moncler (we actually do not know the 2012 comparison
base by quarter for the SSS growth figure, which might also possibly play
against 4Q this year). As a matter of fact however, the exit speed of 3Q and
the month of October have been consistent with the +18% trend of the
first 9M.
� Profitability improving in 3Q (EBITDA margin +50 bps)
EBITDA posted a +16% YoY growth in the 9M13, with a slight margin dilution,
which resulted from:
- An improving gross margin, thanks to the evolution of the channel mix (with
growing weight of retail and of foreign markets). The negative forex effect
(which we estimate at about -120 bps) was partly offset by the price lists hikes
implemented by the company as from the F/W season, particularly in the
Japanese market (prices up by +8%).
- A growing incidence of selling expenses (+29% YoY), linked to the
development of the store network.
Based on the 9M margin performance, our FY estimate might again appear
somehow conservative, with -40 bps adj. EBITDA margin, implying a 4Q
trend similar to the 9M.
Following the seasonality of the retail business already commented, not only
revenue growth but also the progress of profitability is in fact usually more skewed
towards the 2H and 4Q in particular.
The growing weight of retail in the group’s sales is in fact dilutive for margins
in the first part of the year (EBITDA margin was actually down by -130 bps in
1H13) - as this is the period of lowest seasonality for the stores - whilst it become
strongly accretive in the period of highest seasonality, i.e. the 2H (were Fall/Winter
sales are concentrated) and in particular the fourth quarter. EBITDA margin was in
fact already up by +50 bps in 3Q13.

Moncler – November 8, 2013
IMPORTANT DISCLOSURES APPEAR INSIDE FRONT COVER� 35 THIS DOCUMENT MAY NOT BE DISTRIBUTED IN THE UNITED STATES, CANADA OR IN JAPAN OR TO ANY RESIDENT OF JAPAN
However, also in this case, for the sake of prudence, we have taken into
consideration:
a) The heavier forex impact expected in 4Q
b) The possibly more challenging comparison base, consistently with the revenue
trend of 4Q last year
c) Our prudent assumption of a slowing SSS growth in 4Q
d) An expected acceleration in the increase of G&A costs in 4Q, where we
assume strengthening of the corporate structure has been concentrated, with
addition of key management (in the financial and retail department, as well as
for direct management of Moncler Enfant).
MONCLER GROUP: 9M AND 4Q IMPLICIT P&L ( € mn)
9M12 Margin 9M13 Margin 4Q12 Margin 4Q13E Margin
Sales 331 100.0% 389 100.0% 158 100.0% 184 100.0%
increase 27% 17% 55% 17%
Gross margin 224 67.6% 269 69.2% 117 74.2% 136 74.0%
increase n.a. 20% n.a. 16%
Marketing (74) -22.5% (96) -24.8% (41) -12.3% (47) -12.2%
Selling expenses (38) -11.3% (43) -11.0% (14) -4.1% (18) -4.7%
G&A costs (24) -7.3% (29) -7.5% (5) -1.5% (6) -1.5%
Adj. EBIT 88 26.5% 101 25.9% 58 36.7% 65 35.2%
increase n.a. 15% n.a. 12%
Non recurring (1) 3 Reported EBIT 88 26.5% 100 25.7% 58 36.7% 68 36.8%
increase n.a. 14% n.a. 17% Fin. Charges (13) (14) (4) (6) Pre-tax profit 75 22.6% 86 22.2% 54 34.2% 61 33.3%
increase n.a. 16% n.a. 14%
Taxes (28) (31) (16) (20) Minorities (3) (3) 1 () Net profit 44 53 38 24.1% 42 22.7%
increase n.a. 19% n.a. 10%
Depr (11) (14) (5) (7) Adj. Ebitda 99 29.9% 115 29.5% 62 39.6% 72 39.2%
increase n.a. 16% n.a. 15% Source: EQUITA SIM estimates & company data
Net profit of the 9M benefited from a slightly lower tax rate compared to last year
(36% vs. 37% of 9M12) but FY tax rate is expected to remain in the 34-35% range
(FY12 = 34%), which is what we have factored into our model.
Our FY estimate for reported net profit also include two non-recurring items
which should be posted in 4Q:
- € 3 mn positive non-recurring item above EBIT resulting from the sale of the
group’s store in Paris - relocated to a larger space
- € 2/3 mn negative non-recurring item among financials. These are the one-off
renegotiation costs just borne by the company to renew its existing term loan
while reducing the amount from the previous € 180 mn to the current € 120 mn
(maturity June 2018, with € 30 mn annual repayments on average from
December 2014 till June 2018).
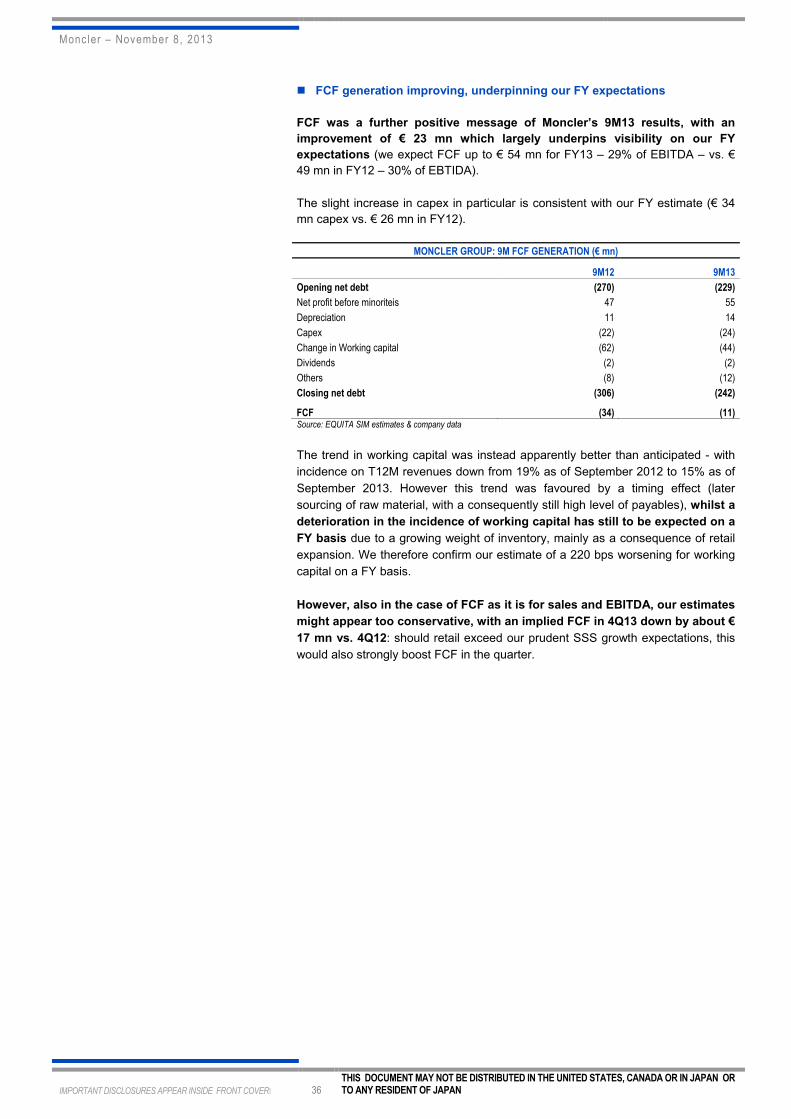
Moncler – November 8, 2013
IMPORTANT DISCLOSURES APPEAR INSIDE FRONT COVER� 36 THIS DOCUMENT MAY NOT BE DISTRIBUTED IN THE UNITED STATES, CANADA OR IN JAPAN OR TO ANY RESIDENT OF JAPAN
� FCF generation improving, underpinning our FY expectations
FCF was a further positive message of Moncler’s 9M13 results, with an
improvement of € 23 mn which largely underpins visibility on our FY
expectations (we expect FCF up to € 54 mn for FY13 – 29% of EBITDA – vs. €
49 mn in FY12 – 30% of EBTIDA).
The slight increase in capex in particular is consistent with our FY estimate (€ 34
mn capex vs. € 26 mn in FY12).
MONCLER GROUP: 9M FCF GENERATION (€ mn)
9M12 9M13
Opening net debt (270) (229)
Net profit before minoriteis 47 55
Depreciation 11 14
Capex (22) (24)
Change in Working capital (62) (44)
Dividends (2) (2)
Others (8) (12)
Closing net debt (306) (242)
FCF (34) (11) Source: EQUITA SIM estimates & company data
The trend in working capital was instead apparently better than anticipated - with
incidence on T12M revenues down from 19% as of September 2012 to 15% as of
September 2013. However this trend was favoured by a timing effect (later
sourcing of raw material, with a consequently still high level of payables), whilst a
deterioration in the incidence of working capital has still to be expected on a
FY basis due to a growing weight of inventory, mainly as a consequence of retail
expansion. We therefore confirm our estimate of a 220 bps worsening for working
capital on a FY basis.
However, also in the case of FCF as it is for sales and EBITDA, our estimates
might appear too conservative, with an implied FCF in 4Q13 down by about €
17 mn vs. 4Q12: should retail exceed our prudent SSS growth expectations, this
would also strongly boost FCF in the quarter.

Moncler – November 8, 2013
IMPORTANT DISCLOSURES APPEAR INSIDE FRONT COVER� 37 THIS DOCUMENT MAY NOT BE DISTRIBUTED IN THE UNITED STATES, CANADA OR IN JAPAN OR TO ANY RESIDENT OF JAPAN
2014-2016 ESTIMATES: +20% CAGR IN EARNINGS, DRIVEN BY RETAIL AND
FOREIGN MARKETS
We expect 3-year 2014-2016E CAGR of +15% for sales, +16% for EBITDA, and
+20% for earnings, primarily driven by:
- The retail channel, with its share of group sales increasing from 51% in 2012
to 68% exp. in 2016E.
- International markets, with the incidence of the Italian market decreasing
from 26% in 2012 to 17% exp. in 2016E.
These are also the most profitable businesses: we therefore expect EBITDA margin
to improve by almost 100 bps in the period compared to our FY13 estimate, in spite
of about 50 bps further negative impact from forex expected in 2014 and of the
underlying increase in G&A costs envisaged to strengtheng the corporate’s
structure. In the meanwhile, EPS should benefit from deleveraging, thanks to
accelerating FCF.
MONCLER P&L ESTIMATES (€ mn)
2011 margin 2012 margin 2013E margin 2014E margin 2015E margin 2016E margin 3-Y CAGR
Sales 364 100% 489 100% 573 100% 666 100% 768 100% 872 100% 15%
Increase 29% 34% 17% 16% 15% 14%
Gross margin 244 67.0% 341 69.7% 406 70.8% 477 71.7% 558 72.6% 638 73.2% 16%
Increase n.a. 40% 19% 18% 17% 14%
Reported Ebit 102 28.0% 146 29.8% 168 29.3% 188 28.2% 221 28.7% 252 28.9% 14%
Increase 20% 43% 15% 12% 18% 14%
Net profit 56 15.4% 82 16.9% 94 16.4% 114 17.1% 139 18.1% 164 18.8% 20%
Increase n.a. 47% 14% 21% 22% 18%
Adjusted net profit 58 15.9% 82 16.9% 95 16.5% 114 17.1% 139 18.1% 164 18.8% 20%
Increase n.a. 43% 15% 20% 22% 18%
D&A (10) -2.7% (16) -3.2% (21) -3.7% (27) -4.1% (33) -4.3% (39) -4.5%
Other non recurring costs (3) 2
Adj. EBITDA 114 31.5% 162 33.0% 187 32.6% 215 32.2% 254 33.0% 291 33.4% 16%
Increase 26% 41% 16% 15% 18% 15% Source: EQUITA SIM estimates & company data
Sales CAGR of +15% in the period, driven by retail and foreign markets
� Retail
Our model incorporates a +22% 3Y CAGR for retail as the effect of:
- New openings: about 20 openings/year, close to the pace of previous years,
and an increase of average store size (+3/4% per annum), leading to an
overall increase in total selling surface at +19% CAGR in the 3Y period
- +8% SSS growth CAGR, prudently below the +12% 3Y CAGR of 2011-2013E,
and should stem from:
1) Growing volume (about +3/4%), particularly in the larger stores which, as
they handle a more complete assortment, can also count on a greater
number of selling opportunities.
2) Price/mix effect (about +4/5%), driven by rising product value in terms of
quality and materials, plus an increasingly favourable geographical mix,
with new openings concentrated in foreig markets (particularly Eastern
Europe, US and Asia), where mark-ups are higher.
- On the negative side, a negative currency impact, which we estimate at
about 5% for retail in 2014, based on current forex rates.
As already mentioned, the SSS growth figure is calculated as the constant
currency growth in revenues for stores opened at least 12 months. This
means, for example, that SSS growth at the end of 2014 applies only to stores
opened before the end of 2012, with a consequent new space effect relating to the
new openings of both 2013 and 2014.

Moncler – November 8, 2013
IMPORTANT DISCLOSURES APPEAR INSIDE FRONT COVER� 38 THIS DOCUMENT MAY NOT BE DISTRIBUTED IN THE UNITED STATES, CANADA OR IN JAPAN OR TO ANY RESIDENT OF JAPAN
MONCLER: SALES BREAK-DOWN BY CHANNEL (€ mn)
2011 % 2012 % 2013E % 2014E % 2015E % 2016E % 3-Y CAGR
Wholesale 226 62% 238 49% 245 43% 254 38% 265 34% 275 32% 4%
Increase 9% 5% 3% 4% 4% 4%
Retail 138 38% 252 51% 328 57% 411 62% 504 66% 597 68% 22%
Increase 81% 82% 31% 25% 22% 19%
SSS growth 9% 13% 15% 10% 8% 7% 8%
new openings 22 22 22 20 18 18
Final # of stores 61 83 105 125 143 161
Total sales 364 100% 489 100% 573 100% 666 100% 768 100% 872 100% 15%
Increase 29% 34% 17% 16% 15% 14% Source: EQUITA SIM estimates & company data
� Wholesale
For this channel, we estimate a +4% CAGR, mainly driven by per-store sales,
whilst the number of multibrand customers should remain almost unchanged as a
result of further minor rationalization in Italy/Europe (the process has instead
already been completed in Japan) offset by new accounts in markets still
underpenetrated such as US, Canada, Eastern Europe.
Also this channel, as well as retail, will benefit from the brand’s strategy of
enlarging product offering. On top of this, wholesale usually can rely on narrower
assortment, more focused on best-selling items. However, for the sake of
prudence, we are assuming a per-door performance below the like-for-like growth
of DOS due to possibly less effective retail management and store format.
The historical double digit growth rates in per-store sales between 2011 and 2012
(and even more so in the previous 2009-10) were temporarely fuelled by the
process of upgrading and enhancement of the network of multibrand customers.
This process, however, can be considered substantially completed.
MONCLER: FUTURE EVOLUTION OF THE SALES MIX
Source: Company data and EQUITA SIM estimates
Adj. EBITDA 3-Y CAGR +16% in 2014-16.
We expect EBITDA margin to increase by almost +100 bps in the 3-year
period (with a flat EBIT margin) in spite of about 50 bps negative impact from
forex expected in 2014 and in spite of the underlying increase in G&A costs
envisaged to strengtheng the corporate’s structure: this is thanks to the expected
positive impact from the sales mix which will be driven by retail and foreign
markets.
26% 22% 20% 18% 17%
32% 32% 33% 34% 35%
32% 34% 35% 35% 34%
10% 11% 12% 14% 15%
2012 2013E 2014E 2015E 2016E
Italy Emea ex Italy Asia and RoW Americas
49% 43% 38% 34% 32%
51% 57% 62% 66% 68%
2012 2013E 2014E 2015E 2016E
Wholesale Retail
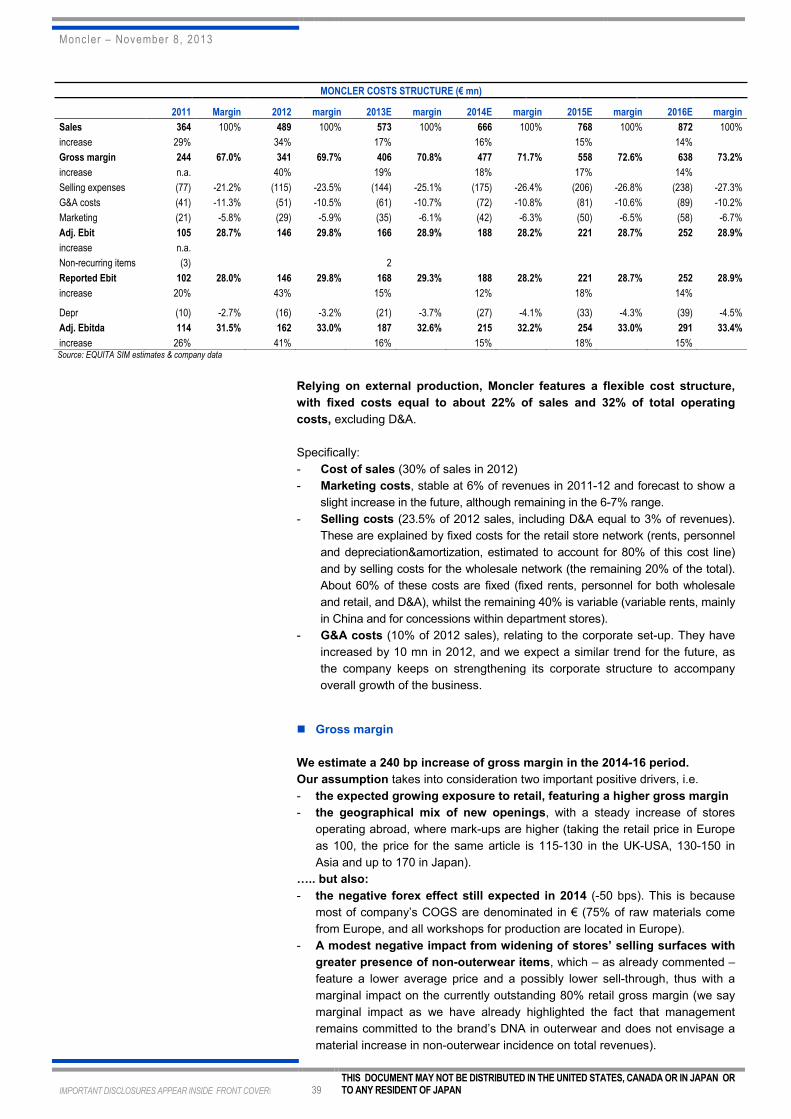
Moncler – November 8, 2013
IMPORTANT DISCLOSURES APPEAR INSIDE FRONT COVER� 39 THIS DOCUMENT MAY NOT BE DISTRIBUTED IN THE UNITED STATES, CANADA OR IN JAPAN OR TO ANY RESIDENT OF JAPAN
MONCLER COSTS STRUCTURE (€ mn)
2011 Margin 2012 margin 2013E margin 2014E margin 2015E margin 2016E margin
Sales 364 100% 489 100% 573 100% 666 100% 768 100% 872 100%
increase 29% 34% 17% 16% 15% 14%
Gross margin 244 67.0% 341 69.7% 406 70.8% 477 71.7% 558 72.6% 638 73.2%
increase n.a. 40% 19% 18% 17% 14%
Selling expenses (77) -21.2% (115) -23.5% (144) -25.1% (175) -26.4% (206) -26.8% (238) -27.3%
G&A costs (41) -11.3% (51) -10.5% (61) -10.7% (72) -10.8% (81) -10.6% (89) -10.2%
Marketing (21) -5.8% (29) -5.9% (35) -6.1% (42) -6.3% (50) -6.5% (58) -6.7%
Adj. Ebit 105 28.7% 146 29.8% 166 28.9% 188 28.2% 221 28.7% 252 28.9%
increase n.a.
Non-recurring items (3) 2
Reported Ebit 102 28.0% 146 29.8% 168 29.3% 188 28.2% 221 28.7% 252 28.9%
increase 20% 43% 15% 12% 18% 14%
Depr (10) -2.7% (16) -3.2% (21) -3.7% (27) -4.1% (33) -4.3% (39) -4.5%
Adj. Ebitda 114 31.5% 162 33.0% 187 32.6% 215 32.2% 254 33.0% 291 33.4%
increase 26% 41% 16% 15% 18% 15% Source: EQUITA SIM estimates & company data
Relying on external production, Moncler features a flexible cost structure,
with fixed costs equal to about 22% of sales and 32% of total operating
costs, excluding D&A.
Specifically:
- Cost of sales (30% of sales in 2012)
- Marketing costs, stable at 6% of revenues in 2011-12 and forecast to show a
slight increase in the future, although remaining in the 6-7% range.
- Selling costs (23.5% of 2012 sales, including D&A equal to 3% of revenues).
These are explained by fixed costs for the retail store network (rents, personnel
and depreciation&amortization, estimated to account for 80% of this cost line)
and by selling costs for the wholesale network (the remaining 20% of the total).
About 60% of these costs are fixed (fixed rents, personnel for both wholesale
and retail, and D&A), whilst the remaining 40% is variable (variable rents, mainly
in China and for concessions within department stores).
- G&A costs (10% of 2012 sales), relating to the corporate set-up. They have
increased by 10 mn in 2012, and we expect a similar trend for the future, as
the company keeps on strengthening its corporate structure to accompany
overall growth of the business.
� Gross margin
We estimate a 240 bp increase of gross margin in the 2014-16 period.
Our assumption takes into consideration two important positive drivers, i.e.
- the expected growing exposure to retail, featuring a higher gross margin
- the geographical mix of new openings, with a steady increase of stores
operating abroad, where mark-ups are higher (taking the retail price in Europe
as 100, the price for the same article is 115-130 in the UK-USA, 130-150 in
Asia and up to 170 in Japan).
….. but also:
- the negative forex effect still expected in 2014 (-50 bps). This is because
most of company’s COGS are denominated in € (75% of raw materials come
from Europe, and all workshops for production are located in Europe).
- A modest negative impact from widening of stores’ selling surfaces with
greater presence of non-outerwear items, which – as already commented –
feature a lower average price and a possibly lower sell-through, thus with a
marginal impact on the currently outstanding 80% retail gross margin (we say
marginal impact as we have already highlighted the fact that management
remains committed to the brand’s DNA in outerwear and does not envisage a
material increase in non-outerwear incidence on total revenues).
Moncler – November 8, 2013
IMPORTANT DISCLOSURES APPEAR INSIDE FRONT COVER� 40 THIS DOCUMENT MAY NOT BE DISTRIBUTED IN THE UNITED STATES, CANADA OR IN JAPAN OR TO ANY RESIDENT OF JAPAN
� Selling expenses
For the part of selling expenses relating to the internal sales force, we have
incorporated growth a bit less than proportional to group’s wholesale sales.
As instead regards the part concerning the stores’ costs (personnel, rents), we
have factored in a CAGR of about 21%, consistently with the expected increase in
total selling space following the expansion of the network and the increase of the
average per-store area.
Overall, we expect the impact of this cost line on sale to grow continuously, albeit
at a gradually declining rate, thanks to gradual normalization of new openings
(which normally takes place within 2-3 years after inauguration).
Bottom line +20% CAGR expected in 2014-16
Our earnings estimates assume:
- An average cost of debt stable at about 7% in the period. The cost of the new
term loan is expected to remain in line with the previous financing (Euribor +
spread), at about 7%.
- A tax rate stable at around 34-35%, which management has indicated as
sustainable (34-35% was also the tax rate in 2011-12)
- Marginal incidence of minorities (0.1% as from 2014), down vs. 0.5% of 2012
and 2013E following the termination of the JV with Altana for Moncler Enfant
effective as from January 2014.
We therefore expect that estimated EBIT growth will be magnified at bottom-
line level by the steady decline of finance expenses, thanks to the FCF
expected for the group in the 3-year period.
Average annual Free Cash Flow generation above € 100 mn
Company’s debt is mostly the result of the € 150 mn dividends distributed in 2011,
before the entry of Eurazeo. Already in 2012 the group showed good cash
generation capacity, with FCF of € 49 mn, i.e. 30% of EBITDA, which rises to € 61
mn (38% of Ebitda) in terms of unlevered FCF, i.e. excluding financial costs. This
is close to sector’s average (34% FCF/Ebitda, excluding Brunello Cucinelli which
reported a negative FCF in 2012).
Our 2013 estimate also points to a healthy FCF of € 54 mn, i.e. € 69 mn unlevered
(37% of Ebitda), in line with sector’s average (still excluding Brunello Cucinelli,
which is expected to report a negative FCF also in 2013E).
For the 3-year period we expect an on-going improvement of FCF, up to
about € 140 mn in 2016E, turning NFP positive at the end of the period, as a
result of:
- increasing EBITDA
- stable capex at around € 35 mn, in line with the last few years average, being
the pace of new openings also similar. Capex in fact consist almost entirely of
investments in the store network, with marginal IT & Corporate investments.
Production is entirely outsourced and warehouses too are owned by third
parties, meaning that industrial capex is virtually absent
- dividend pay–out of 25% (this is our assumption as the company has not yet
decided on the matter)
- rising incidence of working capital.
Working capital incidence in 2012 was 7%, in line with the sector’s best
practice (vs. average for all peers of 19%). However this was already up by +270
bps vs. the 2011 figure, and we have factored in a similar deterioration also in
2013, as already commented, with a further worsening going forward (working
capital at 14% on sales in 2016E).

Moncler – November 8, 2013
IMPORTANT DISCLOSURES APPEAR INSIDE FRONT COVER� 41 THIS DOCUMENT MAY NOT BE DISTRIBUTED IN THE UNITED STATES, CANADA OR IN JAPAN OR TO ANY RESIDENT OF JAPAN
This is mainly the result of ever earlier purchases of raw materials (with the aim of
accelerating the production process and shortening time to market), which
translate into a lower level of payables at the end of the year compared to the
past. We nevertheless expect this dynamic to become gradually less important as
long as the company achieves its ideal time to market in the production process.
At the same time, a negative impact on inventory at year-end also comes from
expansion into retail, as group’s stores still carry some stock of Fall/Winter
products at the end of December to be sold full price during the months of January
and February (opposite to wholesale revenues, for which credit collection is mostly
completed within the end of the year).
MONCLER: FCF GENERATION (€ mn)
2011 2012 2013E 2014E 2015E 2016E
Net profit 58 85 94 114 139 164
Depreciations 10 16 21 27 33 39
Change in Wkc 3 -19 -19 -26 -22 -18
Cash flow provided by Operations 72 82 96 115 150 185
Capex (35) (26) (34) (34) (35) (35)
Others (10) (7) (8) (8) (8) (8)
Total FCF 26 49 54 72 108 142
Other investments
Disposals 6 27
Distribution of Dividends (153) (8) (2) (24) (28) (35)
Capital Increase
Total Change in cash (127) 41 58 75 79 107
Opening net debt (143) (270) (229) (171) (96) (17)
Closing net debt (270) (229) (171) (96) (17) 90 Source: EQUITA SIM estimates & company data
MONCLER: EVOLUTION OF TRADE WORKING CAPITAL (€ mn)
2011 2012 2013E 2014E 2015E 2016E
Receivables 52 71 82 92 102 112
Incidence on T12M sales 14.3% 14.5% 14.3% 13.8% 13.3% 12.8%
Inventories 50 60 73 88 106 124
Incidence on T12M sales 13.7% 12.3% 12.8% 13.3% 13.8% 14.3%
Payables (84) (94) (100) (99) (105) (114)
Incidence on T12M COGS -70.0% -63.7% -59.5% -52.2% -49.7% -48.9%
Total trade net working capital 18 37 56 82 104 122
Incidence on T12M sales 4.9% 7.5% 9.7% 12.3% 13.5% 14.0% Source: EQUITA SIM estimates & company data
Disposal of the Casual Wear division included in our estimates
Our estimates for NFP in the 2013-16 period also include the impact of the recent
disposal of the Casualwear division to the private equity group Emerisque Brands.
The deal has been signed on October 31st, with closing on November 8
th.
The agreement envisages a potential total consideration of € 22.1 mn to be paid in
three instalments of which two by the end of this year (€ 8.6 mn) plus a potential
price adjustment up to further € 13.5 mn next year, depending on certain P&L and
BS performance achieved by the disposed business in 2013.
Including the cost of the transaction and the fiscal advantage stemming from the
loss on the disposal value, the total net cash-in expected is of about € 5.6 mn
in 2013 and further € 17.2-26.6 mn in 2014 (depending on the price-adjustment
mechanism) – see the line “disposals” in our Cash Generation table above (our
estimates are factoring in the scenario of full price adjustment).
The total disposal consideration might be increased by a further earn-out
component to be paid in 2015, which however we are not including in our
estimates for the moment, for the sake of prudence.
The P&L impact of this transaction, which we have not illustrated for the sake of
simplicity, will be shown in company’s reporting as “discontinued operations”
below net profit.
Moncler – November 8, 2013
IMPORTANT DISCLOSURES APPEAR INSIDE FRONT COVER� 42 THIS DOCUMENT MAY NOT BE DISTRIBUTED IN THE UNITED STATES, CANADA OR IN JAPAN OR TO ANY RESIDENT OF JAPAN
SWOT ANALYSIS
Strenghts
- Strong positioning of the Moncler brand in the luxury arena: uniqueness,
strong heritage, exclusiveness, very high quality, strong recognisability and
international vocation
- Global and multichannel distribution network
- Best-in-class performance in retail
- Excellent track record of growth (3Y CAGR of +30% for revenues and +36%
for EBITDA in 2010-12), mainly driven by retail and internationalisation
- High margins (33% Ebitda margin in 2012) and cash generation (€ 61 mn
unlevered FCF in 2012, equal to 38% of EBITDA).
Weaknesses
- Low product diversification: notwithstanding the evident improvements of the
last few years, sales are still concentrated in winter outerwear, which is clearly
the historical core of the brand.
- High seasonality of the business, which make results more volatile as
influenced by weather conditions, either positively or negatively.
- Still high incidence of “logo” products, although decreasing. This is in fact the
riskier part of the offering for the sustainability of the brand positioning and
momentum in the longer term
- Still wide reliance on the wholesale channel in Italy/Europe, featuring
lower momentum.
- Long time to market, which reduces company’s degree of freedom in quickly
adjusting to market trends.
Opportunities
- Strong growth potential in terms of:
1) Expansion of retail (only 98 DOS stores as of September 2013)
2) Increased penetration of international markets, where new openings
will be concentrated
- Opportunities in non-outerwear, which still accounts for only 15% of
revenues, with leather goods in particular estimated at 5% on revenues.
- Opportunities to improve the supply chain: management focus will be on
efficiency and time to market, on a dedicated platform for knitwear and on an
engineering team to raise innovation and technological content of products.
- Slight improvement of profitability (EBITDA margin up from 32.6% in 2013E
to 33.4% estimate in 2016E, in spite of the further toll from currencies factored
in for 2014), driven by the more than proportional growth expected for the retail
channel and for foreign markets.
- Increase of cash flows, thanks to the expected growth of EBITDA and to
substantially stable capex: est. 2016E FCF of € 140 mn vs. € 49 mn in 2012.
Threats
- Risk of dilution of retail performance and lengthening of breakeven times with
the increase of average store size (and the introduction of new product
categories with a lower average price and possibly lower sell-through)
- Strong reliance on Mr. Ruffini, as Chairman, CEO and creative director of
the company. The company boasts a strong management team (see
appendix) which has shown its execution skills in the recent past; however,
when looking instead to the development of collections and to the product
strategy, we believe Mr. Ruffini is a key factor of group’s success, in spite of
the several people working in the design department (5 internal people and
about 20 external stylists and designers who collaborate with the group).

Moncler – November 8, 2013
IMPORTANT DISCLOSURES APPEAR INSIDE FRONT COVER� 43 THIS DOCUMENT MAY NOT BE DISTRIBUTED IN THE UNITED STATES, CANADA OR IN JAPAN OR TO ANY RESIDENT OF JAPAN
VALUATION HINTS
Luxury at fair valuations, with some risk on estimates; growing importance
of stock picking
Once more in 2013, the Luxury sector has outperformed the overall SXXP
Index thanks to better resiliency in estimates (earnings revision basically nil for
luxury companies YtD vs. -10% for SXXP Index companies), thus confirming its
anti-cyclical nature, as it has been the case since the 2008-09 downturn (see the
chart below). This is the result of:
- the sector’s strong underlying long term growth drivers (see appendix 1) -
particularly with the support of Asia-Pacific growth in 2008-12
- the relatively flexible costs structure of luxury companies compared to other
sectors
- the florid M&A context (Bulgari in 2011 and Loro Piana in 2013, both acquired
by LVMH, Brioni bought by Kering in 2011, Valentino sold to the Qatar
Sovereign Fund in 2012).
LUXURY SECTOR VS. SXXP INDEX
MARKET PERFORMANCE EPS GROWTH
Source: Equita SIM elaborations on Bloomberg & Companies data
In our view, the consistency and resiliency shown by the sector, together
with its still healthy growth prospects, will continue to drive investors’
appetite for luxury stocks, thus justifying a premium of the sector vs. the rest of
the market.
ABSOLUTE AND RELATIVE LUXURY SECTOR’S VALUATION
Source: Bloomberg and Equita Sim elaborations
-70%
-50%
-30%
-10%
10%
30%
50%
70%
2004
2005
2006
2007
2008
2009
2010
2011
2012
2013 YTD
SXXP index
Luxury
-80%
-60%
-40%
-20%
0%
20%
40%
60%
80%
100%
2004
2005
2006
2007
2008
2009
2010
2011
2012
2013E
SXXP index
Luxury
20%
40%
60%
80%
100%
120%
140%
160%
180%
200%
5x
7x
9x
11x
13x
15x
17x
19x
21x
1Q06
2Q06
3Q06
4Q06
1Q07
2Q07
3Q07
4Q07
1Q08
2Q08
3Q08
4Q08
1Q09
2Q09
3Q09
4Q09
1Q10
2Q10
3Q10
4Q10
1Q11
2Q11
3Q11
4Q11
1Q12
2Q12
3Q12
4Q12
1Q13
2Q13
3Q13
Today
P/E T+1 (LHS)
Hist avg P/E T+1
Premium to SXXP index (RHS)
Historical average

Moncler – November 8, 2013
IMPORTANT DISCLOSURES APPEAR INSIDE FRONT COVER� 44 THIS DOCUMENT MAY NOT BE DISTRIBUTED IN THE UNITED STATES, CANADA OR IN JAPAN OR TO ANY RESIDENT OF JAPAN
However history (2010-2011) tells us that this premium might be wider during
phases of economic downturn as the market factors in better visibility and lower
risks for luxury companies’ results; on the other side, we believe this premium will
likely remain below the historical 60% average level in the short term, as the
market is anticipating:
- a more general improvement in the overall economic outlook (switch to more
cyclical stocks)
- a risk of slowdown in luxury growth following some weakness signs in current
trading (several companies, including Tod’s, LVMH, Kering, and to a lesser
extent Prada and Ferragamo, have reported a softer sales trend in
September/October, in spite of a generally easier comparison base).
These are also in our view the reasons why the luxury sector has recently
slightly underperformed the rest of the market.
EUROPEAN LUXURY STOCKS LAST 3M PERFORMANCE VS. SXXP INDEX
Source: Bloomberg
Now looking to the near future, we see little room for the luxury sector to
outperform the market in the light of:
- fair absolute valuations, already close to the historical average of 19x P/E
T+1
- risk of downward adjustment in consensus estimates. As a matter of fact,
based on current forex rates, the consensus expectation of +9% reported
revenue growth for 2013 implies +11.5% at constant forex, with an implicit
acceleration in the 2H (+14% YoY after the +9% on average for the 1H)
theoretically underpinned by an easier comparison but now less realistic
following the weakness in current trading surfaced in 3Q reporting. The 2014
expected growth rate, at +12% constant currency implicit, also might turn to be
slightly optimistic.
Having said that, we believe stock picking continues to be highly important, as
already experienced in 2012-13, with a wide variance in companies’ results and in
their respective stocks’ performances (see the charts on the left).
As shown in the bottom chart, the market has been rewarding in particular
companies boasting faster growth momentum (Ferragamo) or greater
sustainability for the long term (Brunello Cucinelli), two key elements that we
also see in Moncler’s equity story.
STOCKS’ PRICES VS. EPS REVISIONS (2012)
Source: Bloomberg
STOCKS’ PRICES VS. EPS REVISIONS (2013)
Source: Bloomberg
Burberry
Hermes
LVMH
Tod's
Ferragamo
Prada
Kering
AVG
-10%
-5%
0%
5%
10%
15%
20%
25%
-10% 10% 30% 50% 70% 90%
2013 EPS (revision in the last year)
Stock performance (abs - 1Y to Februrary 14th, 2013)
Burberry
Hermes
LVMH
Tod's
Ferragamo
Prada
Kering
Brunello Cucinelli
AVG
-15%
-10%
-5%
0%
5%
10%
15%
0% 20% 40% 60% 80%
2013 EPS (revision year to date)
Stock performance (abs, YtD)

Moncler – November 8, 2013
IMPORTANT DISCLOSURES APPEAR INSIDE FRONT COVER� 45 THIS DOCUMENT MAY NOT BE DISTRIBUTED IN THE UNITED STATES, CANADA OR IN JAPAN OR TO ANY RESIDENT OF JAPAN
How to value Moncler: quality and extra-growth deserve some premium
In our view, Moncler represents one of the best quality and fastest growth
story in the luxury sector today.
In terms of quality, in particular, Moncler boasts some features which are common
to other few luxury peers, which are in fact trading at premium vs. the average. We
refer in particular to:
- Moncler’s strong retail skills, similarly to Prada (very high full-price sell-
through, high sales densities, fast break-even times). This, together with
underpenetration, provides visibility to the company’s plan to expand its store
network.
- The company’s disciplined approach to growth, both in terms of product
expansion strategy (always very consistent with the brand’s DNA, and
therefore with a prudent approach to growth of non-outerwear and in particular
of accessories) and of retail expansion (20 stores per annum, without
acceleration compared to the past, in spite of the brand’s huge potential for
greater penetration). These features are common to Brunello Cucinelli, and
ensure higher sustainability of group’s growth prospects.
- The low fashion content of Moncler products: they are contemporary but
not fashion, and tend to represent an investment for consumers. Also this
feature, which is a strong loyalty building element for consumers, recalls
Brunello Cucinelli as well as Tod’s products.
- Highly recognizable and iconic products, which can be changed in few
details or in fabrics and colours - offering consumers always new occasions to
buy – while remaining always recognizable and up to date. This is a feature
common to Tod’s.
- Best in class profitability (Ebitda margin at 33% on revenues, similarly to
Prada, compared to a 27% average for the sector) and high FCF generation
(37% unlevered FCF/Ebitda exp. in 2013E).
- Pure luxury play status, compared to other leading global brands such as
Gucci or Louis Vuitton, which are within big conglomerates.
MULTIPLE COMPARISON
Price Perf. EV/EBITDA Ebitda margin Sales growth P/E EPS Cagr Asia
€ 3M 2013E 2014E 2015E 2013E 2014E 2015E 2013E 2014E 2015E 2013E 2014E 2015E 2014E-15E Ex-Jap
Hermes 255 -2% 19.1 16.9 14.7 36% 36% 36% 9% 11% 12% 32.9 29.5 26.1 12% 32%
Brunello Cucinelli 23 9% 27.7 23.6 20.1 18% 19% 19% 14% 13% 13% 54.7 45.1 38.4 19% 12%
LVMH 140 1% 10.0 8.6 7.9 25% 25% 25% 8% 12% 9% 19.1 16.3 14.7 14% 28%
Richemont 93 0% 13.0 11.5 10.1 28% 29% 29% 8% 10% 9% 19.1 17.0 15.3 12% 41%
Tiffany 78 -4% 11.0 9.8 8.8 24% 24% 25% 5% 8% 9% 21.6 19.1 16.9 13% 21%
Burberry 1,494 -4% 10.4 9.2 8.2 26% 27% 24% 16% 14% 19% 17.8 15.5 14.1 12% 31%
Kering (luxury) 165 -8% 9.9 8.6 7.7 29% 29% 29% 1% 7% 9% 16.0 14.7 13.1 10% 31%
Swatch 575 3% 11.8 10.2 8.8 28% 29% 30% 12% 10% 9% 18.1 16.1 14.4 12% 49%
Tod's 124 -9% 14.1 12.7 11.1 26% 26% 27% 4% 7% 10% 25.2 22.5 19.7 13% 25%
Prada 77 7% 14.8 12.1 10.2 34% 35% 36% 12% 15% 13% 25.6 21.1 18.2 19% 36%
Ferragamo 25 -2% 15.5 13.3 11.0 22% 22% 24% 10% 11% 11% 28.6 24.5 20.5 18% 37%
Average 14.3 12.4 10.8 27% 27% 28% 9% 11% 11% 25.3 22.0 19.2 14% 31%
Average ex-BC & RMS -2% 12.3 10.7 9.3 27% 27% 28% 9% 10% 11% 21.2 18.5 16.3 Moncler 33% 32% 33% 17% 16% 15% 21% 16% Source: Bloomberg consensus and EQUITA SIM estimates. Closure prices of Nov 7th , 2013
Moncler also deserves a premium in our view for its faster growth prospects,
with expected EPS CAGR in 2014-15 of +21% vs. 14% average for the sector.
For this reason, we would focus valuation on 2015 rather than on 2013-14, in
order to try to capture most of the company’s extra-growth potential.
Overall, for all the reasons just mentioned, we think the company should
merit a multiple above the luxury sector average.
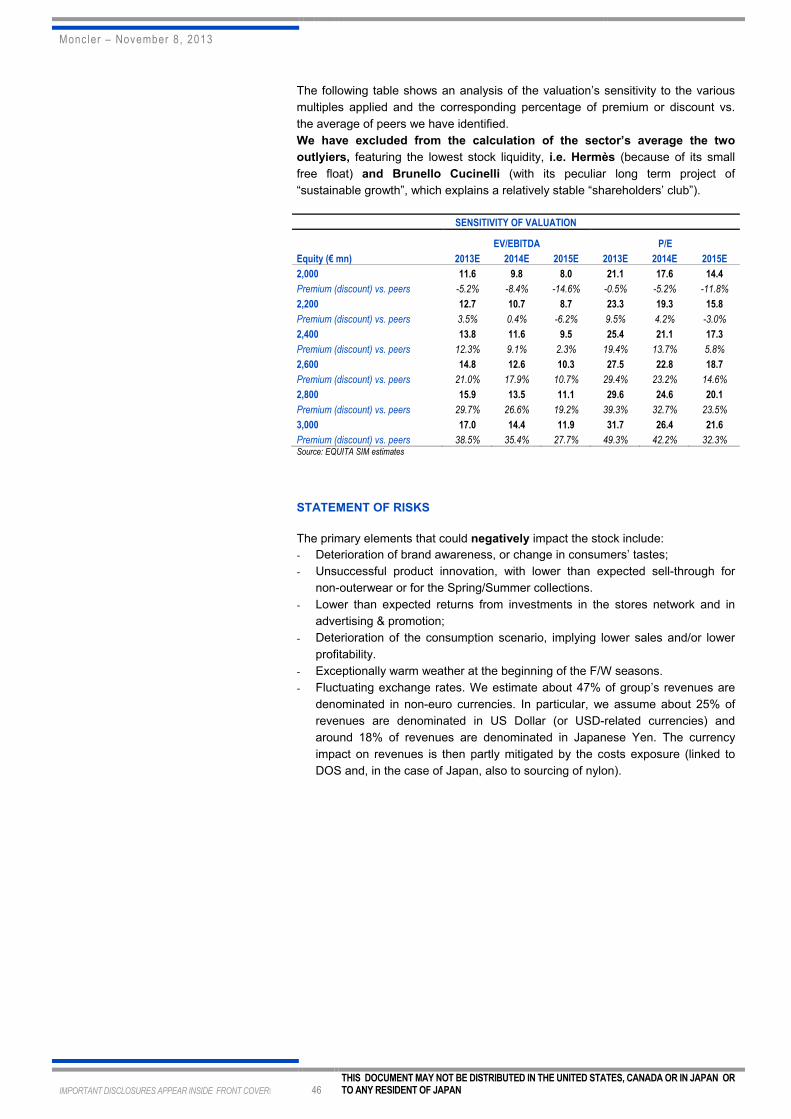
Moncler – November 8, 2013
IMPORTANT DISCLOSURES APPEAR INSIDE FRONT COVER� 46 THIS DOCUMENT MAY NOT BE DISTRIBUTED IN THE UNITED STATES, CANADA OR IN JAPAN OR TO ANY RESIDENT OF JAPAN
The following table shows an analysis of the valuation’s sensitivity to the various
multiples applied and the corresponding percentage of premium or discount vs.
the average of peers we have identified.
We have excluded from the calculation of the sector’s average the two
outlyiers, featuring the lowest stock liquidity, i.e. Hermès (because of its small
free float) and Brunello Cucinelli (with its peculiar long term project of
“sustainable growth”, which explains a relatively stable “shareholders’ club”).
SENSITIVITY OF VALUATION
EV/EBITDA P/E
Equity (€ mn) 2013E 2014E 2015E 2013E 2014E 2015E
2,000 11.6 9.8 8.0 21.1 17.6 14.4
Premium (discount) vs. peers -5.2% -8.4% -14.6% -0.5% -5.2% -11.8%
2,200 12.7 10.7 8.7 23.3 19.3 15.8
Premium (discount) vs. peers 3.5% 0.4% -6.2% 9.5% 4.2% -3.0%
2,400 13.8 11.6 9.5 25.4 21.1 17.3
Premium (discount) vs. peers 12.3% 9.1% 2.3% 19.4% 13.7% 5.8%
2,600 14.8 12.6 10.3 27.5 22.8 18.7
Premium (discount) vs. peers 21.0% 17.9% 10.7% 29.4% 23.2% 14.6%
2,800 15.9 13.5 11.1 29.6 24.6 20.1
Premium (discount) vs. peers 29.7% 26.6% 19.2% 39.3% 32.7% 23.5%
3,000 17.0 14.4 11.9 31.7 26.4 21.6
Premium (discount) vs. peers 38.5% 35.4% 27.7% 49.3% 42.2% 32.3% Source: EQUITA SIM estimates
STATEMENT OF RISKS
The primary elements that could negatively impact the stock include:
- Deterioration of brand awareness, or change in consumers’ tastes;
- Unsuccessful product innovation, with lower than expected sell-through for
non-outerwear or for the Spring/Summer collections.
- Lower than expected returns from investments in the stores network and in
advertising & promotion;
- Deterioration of the consumption scenario, implying lower sales and/or lower
profitability.
- Exceptionally warm weather at the beginning of the F/W seasons.
- Fluctuating exchange rates. We estimate about 47% of group’s revenues are
denominated in non-euro currencies. In particular, we assume about 25% of
revenues are denominated in US Dollar (or USD-related currencies) and
around 18% of revenues are denominated in Japanese Yen. The currency
impact on revenues is then partly mitigated by the costs exposure (linked to
DOS and, in the case of Japan, also to sourcing of nylon).

Moncler – November 8, 2013
IMPORTANT DISCLOSURES APPEAR INSIDE FRONT COVER� 47 THIS DOCUMENT MAY NOT BE DISTRIBUTED IN THE UNITED STATES, CANADA OR IN JAPAN OR TO ANY RESIDENT OF JAPAN
APPENDIX 1: STILL POSITIVE LONG TERM PROSPECTS FOR LUXURY
Luxury revenues are expected to continue to outperform the global GDP
trend, as happened in the past (average multiplier above 3x in 2007-12 – source
Altagamma & Bain - and even 4x for listed players only): Altagamma is anticipating
a 3-5% CAGR in 2014-16 for the whole sector, whilst consensus for main listed
peers is indicating a 10% CAGR (which is consistent with our own expectations).
GROWTH IN LUXURY REVENUES VS. GDP GROWTH
Source: Bloomberg consensus for main listed players, Bain&Co.- Altagamma for the whole sector
Sector’s growth should continue to be underpinned by a few long term drivers:
- The rising number of HNWI (+4.9% CAGR in 2005-12, vs. +2.4% for real
GDP), which even accelerated in 2012, helped by the global recovery in the
equity and real estate markets (source: World Wealth Report 2013, Cap
Gemini, June 2013). Global HNWI wealth is expected to grow by +6.5%
annually over the next three years (vs. +2.6% annual average since 2008),
still led by Asia-Pacific.
- The growth potential offered by new markets, such as Latin America,
Africa (Nigeria, Angola), Middle East (growing importance also as a tourist
destination for Russians, Indians, Africans), South East Asian Countries
(Indonesia, Malaysia, Thailand, Philippines), Australia (9th highest
concentration of HNWI’s with increasing appetite for luxury among young
generations).
- The potential offered by North America, with relative underpenetration of
main European luxury brands (particularly in 2nd tier cities), a growing appetite
for luxury from the local consumers, and the advanced stage of digital
integration achieved by main department stores (e-commerce penetration up
to 10-20% of total revenues vs. 5% for the luxury market overall). United
States are also the region with the highest HNWI population worldwide, and
also among the fastest growing (+12% in 2012).
- Sector high exposure to tourism (estimated to account for almost 40% of
luxury spending), still driven by a persisting price-gap, particularly between
Europe and Asia. If we look to the geographic breakdown of luxury spending
by nationalities, this will be much different from the breakdown by country (see
following page).
Tourists flows are clearly affected by currency movements (the strong yen
devaluation this year has redirected Japanese consumptions locally) or visa
procedures (UK and Spain are benefiting from a higher affluence of Chinese
tourists thanks to new simpler visa procedures), as well as by changing
travelling habits (Chinese people increasingly exploing new destinations such
as the US West Coast, South East Asia or Australia).
HNWI POPULATION BY GEOGRAPHY (2012)
Source: World Wealth Report 2013, Cap Gemini, June 2013
GROWTH OF HNWIs: FASTEST REGIONS (2012)
Hong Kong 36%
India 22%
Australia 15%
China 14%
Thailand 13%
United States 12%
South Korea 11%
Total HNWI 9% Cap Gemini (World Wealth Report 2012)
-10%
-5%
0%
5%
10%
15%
20%
25%
30%
2007 2008 2009 2010 2011 2012 2013E 2014E 2015E
Luxury growth const. curr. (main listed players)
Luxury growth const. curr. (whole sector)
World real GDP
Europe29%
North America31%
Japan16%
Latin America4%
China6%
Rest of Asia9%
Africa1%
Middle East4%
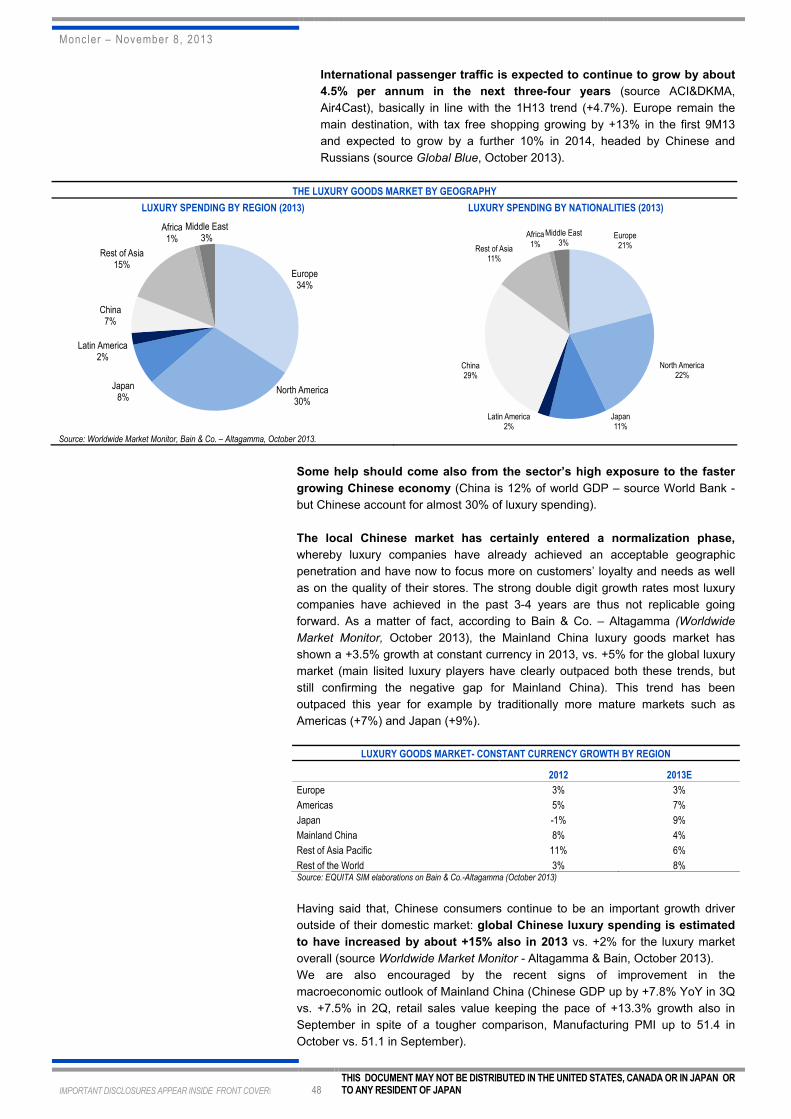
Moncler – November 8, 2013
IMPORTANT DISCLOSURES APPEAR INSIDE FRONT COVER� 48 THIS DOCUMENT MAY NOT BE DISTRIBUTED IN THE UNITED STATES, CANADA OR IN JAPAN OR TO ANY RESIDENT OF JAPAN
International passenger traffic is expected to continue to grow by about
4.5% per annum in the next three-four years (source ACI&DKMA,
Air4Cast), basically in line with the 1H13 trend (+4.7%). Europe remain the
main destination, with tax free shopping growing by +13% in the first 9M13
and expected to grow by a further 10% in 2014, headed by Chinese and
Russians (source Global Blue, October 2013).
THE LUXURY GOODS MARKET BY GEOGRAPHY
LUXURY SPENDING BY REGION (2013) LUXURY SPENDING BY NATIONALITIES (2013)
Source: Worldwide Market Monitor, Bain & Co. – Altagamma, October 2013.
Some help should come also from the sector’s high exposure to the faster
growing Chinese economy (China is 12% of world GDP – source World Bank -
but Chinese account for almost 30% of luxury spending).
The local Chinese market has certainly entered a normalization phase,
whereby luxury companies have already achieved an acceptable geographic
penetration and have now to focus more on customers’ loyalty and needs as well
as on the quality of their stores. The strong double digit growth rates most luxury
companies have achieved in the past 3-4 years are thus not replicable going
forward. As a matter of fact, according to Bain & Co. – Altagamma (Worldwide
Market Monitor, October 2013), the Mainland China luxury goods market has
shown a +3.5% growth at constant currency in 2013, vs. +5% for the global luxury
market (main lisited luxury players have clearly outpaced both these trends, but
still confirming the negative gap for Mainland China). This trend has been
outpaced this year for example by traditionally more mature markets such as
Americas (+7%) and Japan (+9%).
LUXURY GOODS MARKET- CONSTANT CURRENCY GROWTH BY REGION
2012 2013E
Europe 3% 3%
Americas 5% 7%
Japan -1% 9%
Mainland China 8% 4%
Rest of Asia Pacific 11% 6%
Rest of the World 3% 8% Source: EQUITA SIM elaborations on Bain & Co.-Altagamma (October 2013)
Having said that, Chinese consumers continue to be an important growth driver
outside of their domestic market: global Chinese luxury spending is estimated
to have increased by about +15% also in 2013 vs. +2% for the luxury market
overall (source Worldwide Market Monitor - Altagamma & Bain, October 2013).
We are also encouraged by the recent signs of improvement in the
macroeconomic outlook of Mainland China (Chinese GDP up by +7.8% YoY in 3Q
vs. +7.5% in 2Q, retail sales value keeping the pace of +13.3% growth also in
September in spite of a tougher comparison, Manufacturing PMI up to 51.4 in
October vs. 51.1 in September).
Europe21%
North America22%
Japan11%
Latin America2%
China29%
Rest of Asia11%
Africa1%
Middle East3%
Europe34%
North America30%
Japan8%
Latin America2%
China7%
Rest of Asia15%
Africa1%
Middle East3%

Moncler – November 8, 2013
IMPORTANT DISCLOSURES APPEAR INSIDE FRONT COVER� 49 THIS DOCUMENT MAY NOT BE DISTRIBUTED IN THE UNITED STATES, CANADA OR IN JAPAN OR TO ANY RESIDENT OF JAPAN
We therefore anticipate a mid to high single digit growth of main listed
luxury brands in China going forward.
In particular, we expect high-end and sophisticated luxury to have the
greatest growth potential.
The fast evolution of the Chinese luxury consumer has in fact led to a polarization
of luxury consumptions in this region, with:
- a growing preference for high-end and sophisticated luxury
- a decline of the aspirational segment in the middle of the luxury pyramid,
testified by the recent fatigue of the logo products
- faster growth of accessible luxury and premium brands, which should continue
to benefit from a rising new middle class: the number of affluent consumers
(disposable income between 20k and 1mn USD) is in fact expected to double
in China by 2020, with their spending growing fivefold (source: Boston
Consulting Group, November 2012).
We remain instead more sceptical about Japan: the surge in luxury
consumptions experienced in 2013 has resulted from the first year of “Abenomics”,
and has been mainly driven by older generations, whilst luxury brands are
apparently still struggling to capture younger generations. This makes recent
growth rates not replicable going forward and puts also some question marks on
the sustainability of current luxury spending levels in the medium term.
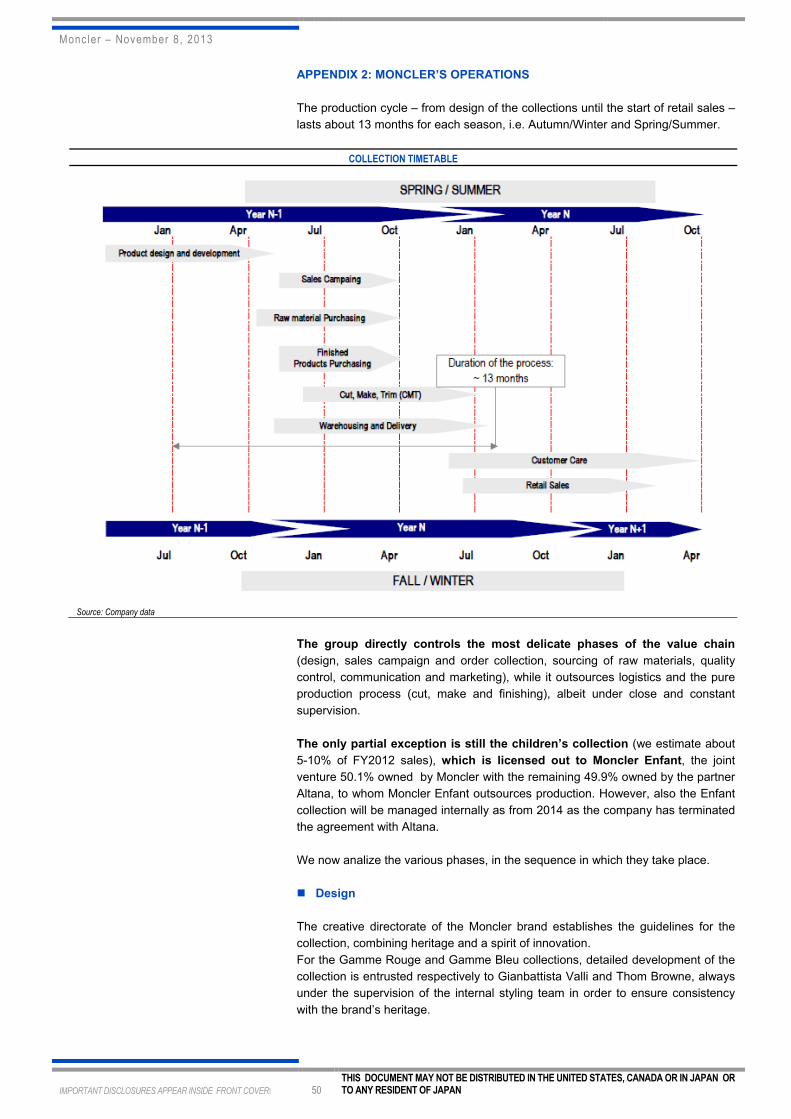
Moncler – November 8, 2013
IMPORTANT DISCLOSURES APPEAR INSIDE FRONT COVER� 50 THIS DOCUMENT MAY NOT BE DISTRIBUTED IN THE UNITED STATES, CANADA OR IN JAPAN OR TO ANY RESIDENT OF JAPAN
APPENDIX 2: MONCLER’S OPERATIONS
The production cycle – from design of the collections until the start of retail sales –
lasts about 13 months for each season, i.e. Autumn/Winter and Spring/Summer.
COLLECTION TIMETABLE
Source: Company data
The group directly controls the most delicate phases of the value chain
(design, sales campaign and order collection, sourcing of raw materials, quality
control, communication and marketing), while it outsources logistics and the pure
production process (cut, make and finishing), albeit under close and constant
supervision.
The only partial exception is still the children’s collection (we estimate about
5-10% of FY2012 sales), which is licensed out to Moncler Enfant, the joint
venture 50.1% owned by Moncler with the remaining 49.9% owned by the partner
Altana, to whom Moncler Enfant outsources production. However, also the Enfant
collection will be managed internally as from 2014 as the company has terminated
the agreement with Altana.
We now analize the various phases, in the sequence in which they take place.
� Design
The creative directorate of the Moncler brand establishes the guidelines for the
collection, combining heritage and a spirit of innovation.
For the Gamme Rouge and Gamme Bleu collections, detailed development of the
collection is entrusted respectively to Gianbattista Valli and Thom Browne, always
under the supervision of the internal styling team in order to ensure consistency
with the brand’s heritage.

Moncler – November 8, 2013
IMPORTANT DISCLOSURES APPEAR INSIDE FRONT COVER� 51 THIS DOCUMENT MAY NOT BE DISTRIBUTED IN THE UNITED STATES, CANADA OR IN JAPAN OR TO ANY RESIDENT OF JAPAN
The same criterion is applied for the development of special projects in
collaboration with top international stylists, aimed to give freshness and energy to
the brand.
Overall, the design department, headed by Mr. Ruffini, includes further 5 internal
people but involves about 20 external designers offering their collaboration to the
company.
� Sales Campaign
For the sales campaign and collection of orders from the wholesale network, the
group uses a direct sales force who meet customers at the group’s showrooms,
located in Milan, New York, Paris and Munich.
The sales force is first appropriately briefed about the collection’s technical
content, in order to communicate it effectively to the network of wholesale retailers
and to the retail staff. At the same time the creative and merchandising
department defines a master order (80% of wholesaler customers and of DOS
stores budget) including the must-have items of the collection, with the aim of
conveying a unique image of the brand and piloting sales and mix according to the
strategy established by the group.
Order collection lasts about 4-5 months, approximately from June to October for
the next year’s Spring/Summer collection, and from November to April for the
Autumn/Winter collection.
� Sourcing of Raw Materials
Raw material procurement is managed directly by the group by means of a
dedicated team that selects the best down, yarns, fabrics and accessories.
The main procurement markets are Italy (above all for accessories), France
(above all for down) and Japan (above all for nylon).
Once they have been purchased, the raw materials go to the group’s warehouse in
Castel San Giovanni (province of Piacenza, Italy) for quality control, and are then
assigned to the various outside workshops that handle production.
LOGISTIC NETWORK
Source: Company data

Moncler – November 8, 2013
IMPORTANT DISCLOSURES APPEAR INSIDE FRONT COVER� 52 THIS DOCUMENT MAY NOT BE DISTRIBUTED IN THE UNITED STATES, CANADA OR IN JAPAN OR TO ANY RESIDENT OF JAPAN
� Production
The actual production process is entrusted to about 20 core workshops, located
mainly in East Europe (in Italy in the case of Gamme Rouge and Gamme Bleu).
As indicated, the group provides them with the down, fabrics and accessories and
the workshops handle cutting, making and finishing.
Top ten producers account for about 15% of total COGS.
Quality control relies on an internal team of 14 people as well as on quality
controls made by workshops themselves.
Once the production process has been completed, the garments return from the
external workshop to the group warehouses in Piacenza for final quality control,
before being sent to the group’s other warehouses and then allocated to the other
end-user markets.
Production scheduling takes place based on analysis of past sales trends.
The first commitment for purchase of raw materials starts before the order
campaign starts, based on the Open To Buy approach for retail and on the
wholesale budget.
The first production shift starts after about two months of sales campaign, based
on the projections provided by the order backlog.
The second production shift is launched while the order campaign is still
underway, while the third and last production shift starts when the sales campaign
has been completed.
The lead time for each production launch is about five weeks.
This organization of the production process’s timing makes it possible to
minimize inventory risk, at least for production earmarked for the wholesale
channel, as it corresponds perfectly to demand, consisting of orders.
A marginal buffer of raw materials always remains at the group’s warehouse, for
any further production launches for best-selling items in retail. The impact of such
replenishments is in any case marginal. Given production lead time, it would in
fact be necessary to identify the best seller only 4-6 weeks after the start of the
retail selling season – but sales trends are unlikely to become sufficiently
indicative in such a short time.
MONCLER PRODUCTION PLAN
Source: Company data
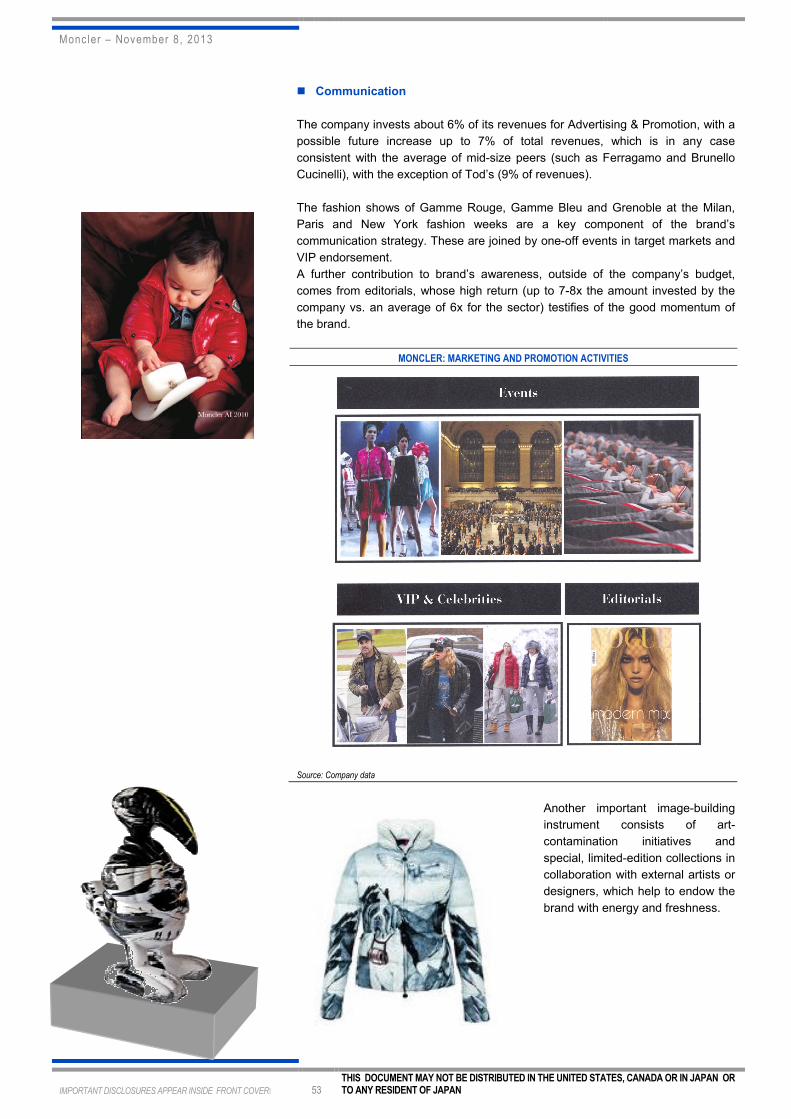
Moncler – November 8, 2013
IMPORTANT DISCLOSURES APPEAR INSIDE FRONT COVER� 53 THIS DOCUMENT MAY NOT BE DISTRIBUTED IN THE UNITED STATES, CANADA OR IN JAPAN OR TO ANY RESIDENT OF JAPAN
� Communication
The company invests about 6% of its revenues for Advertising & Promotion, with a
possible future increase up to 7% of total revenues, which is in any case
consistent with the average of mid-size peers (such as Ferragamo and Brunello
Cucinelli), with the exception of Tod’s (9% of revenues).
The fashion shows of Gamme Rouge, Gamme Bleu and Grenoble at the Milan,
Paris and New York fashion weeks are a key component of the brand’s
communication strategy. These are joined by one-off events in target markets and
VIP endorsement.
A further contribution to brand’s awareness, outside of the company’s budget,
comes from editorials, whose high return (up to 7-8x the amount invested by the
company vs. an average of 6x for the sector) testifies of the good momentum of
the brand.
MONCLER: MARKETING AND PROMOTION ACTIVITIES
Source: Company data
Another important image-building
instrument consists of art-
contamination initiatives and
special, limited-edition collections in
collaboration with external artists or
designers, which help to endow the
brand with energy and freshness.

Moncler – November 8, 2013
IMPORTANT DISCLOSURES APPEAR INSIDE FRONT COVER� 54 THIS DOCUMENT MAY NOT BE DISTRIBUTED IN THE UNITED STATES, CANADA OR IN JAPAN OR TO ANY RESIDENT OF JAPAN
APPENDIX 3: STRONG AND LOYAL MANAGEMENT TEAM
Together with Mr. Ruffini, a solid management team is behind the group’s success
and its future growth strategy. Most of key managers also boast a long career
within the company.
Following the IPO, a stock option incentive plan will be in place, amounting
to 3% of total share capital of the company.
Sergio Buongiovanni. Mr. Sergio Buongiovanni serves as director since 2008.
Mr. Buongiovanni received a degree in economics and business from Università
Commerciale Luigi Bocconi of Milan. He later worked for six years as an auditor
with the Milan office of KPMG followed by three years at Pa.fin as supervisor of
venture capital activities. Mr. Buongiovanni also occupied a series of management
roles with Marina Yachting S.p.A. (as chief executive officer); at Best Company
S.r.l. (as chief executive officer) and at Industries (chief financial officer, operations
director and chief executive officer). Since 2008, he is also chairman of the board
of directors of the Moncler Enfant subsidiary. Additionally, Mr. Buongiovanni, is the
effective owner of 625,000 of Moncler Ordinary Shares through his participation in
Goodjohn & Co. S.r.l.
Luciano Santel. Mr. Luciano Santel serves as Chief Corporate Officer since 2013.
He holds a degree in economics and business from the Università Ca’ Foscari of
Venice. He began his career with audit firms Arthur Andersen and then Reconta
Ernst & Young and subsequently joined the finance and administration
departments of IVG and Rossignol. From 1996 to 1999, Mr. Santel was chief
operating officer of the Retail Brand Alliance. From 2001 to 2009, he was chief
corporate officer at Geox and in 2009, he was chief executive officer of Stefanel.
Monica Sottana. Ms. Monica Sottana, with the company since 1986, has been the
Director of the Moncler Division since 2003. Ms. Sottana received a diploma from
the Technical Institute of Venice. She has served in a variety of managerial
positions within the group, including Export Area Manager of our children’s division
and Brand Manager at Cerruti Jeans (part of the recently spun-off business). Ms.
Sottana is general manager of the company; she also holds the position of director
of the Moncler Division’s wholesale distribution network and serves as a manager
of marketing for the same division. In addition, she is the general manager and
director of the Moncler Enfant subsidiary, as well as director of Moncler Lunettes.
Andrea Tieghi. Mr. Tieghi obtained a degree in Business Administration from the
University of Evansville in Indiana, USA. He served as CEO of Wrangler Italia S.r.l
in 1994 and as Manager of the Retail division and member of the executive
committee of Victorian S.r.l. (Stefanel group) in 1996. In 1995 he co-founded
Freeland S.r.l., the first Italian company dedicated to the development of factory
outlets. He served as Director of Sales of the Coin group and then Director of retail
at the same group, between from 1999 and 2003. From 2004 until 2005, he served
as director of Industries (the recently spun-off business). He currently serves as
Director of the Group Retail network.

Moncler – November 8, 2013
IMPORTANT DISCLOSURES APPEAR INSIDE FRONT COVER� 55 THIS DOCUMENT MAY NOT BE DISTRIBUTED IN THE UNITED STATES, CANADA OR IN JAPAN OR TO ANY RESIDENT OF JAPAN
P&L 2011 2012 2013E 2014E 2015E 2016E
Revenues 364 489 573 666 768 872
Growth 29% 34% 17% 16% 15% 14%
Total opex -252 -328 -384 -451 -515 -581
Growth 31% 30% 17% 17% 14% 13%
Margin -69% -67% -67% -68% -67% -67%
EBITDA 112 162 189 215 254 291
Growth 23% 45% 17% 14% 18% 15%
Margin 31% 33% 33% 32% 33% 33%
Depreciation& amortization -10 -16 -21 -27 -33 -39
Provisions 0 0 0 0 0 0
Depreciation&provison -10 -16 -21 -27 -33 -39
EBIT 102 146 168 188 221 252
Growth 20% 43% 15% 12% 18% 14%
Margin 28% 30% 29% 28% 29% 29%
Net financial profit/Expenses -12 -17 -20 -13 -8 -1
Profits/exp from equity inv na na na na na na
Other financial profit/Exp na na na na na na
Total financial expenses -12 -17 -20 -13 -8 -1
Non recurring pre tax -3 0 -1 0 0 0
Profit before tax 89 129 148 175 213 251
Growth n.a. 44% 15% 18% 22% 18%
Taxes -31 -44 -51 -60 -73 -87
Tax rate 35% 34% 35% 35% 35% 35%
Minoritiy interests -2 -2 -3 -1 -1 -1
Non recurring post tax na na na na na na
Net income 56 82 94 114 139 164
Growth n.a. 47% 14% 21% 22% 18%
Margin 15% 17% 16% 17% 18% 19%
Adj. net income 58 82 95 114 139 164
Growth n.a. 43% 15% 20% 22% 18%
Margin 16% 17% 17% 17% 18% 19%
CF Statement 2011 2012 2013E 2014E 2015E 2016E
Operating Free Cash Flow 68 101 115 141 172 203
(Increase) decrease in OWC 3 -19 -19 -26 -22 -18
(Purchase of fixed assets) -35 -26 -34 -34 -35 -35
(Other net investments) 0 0 6 27 0 0
(Distribution of dividends) -153 -8 -2 -24 -28 -35
Rights issue 0 0 0 0 0 0
Other -10 -7 -8 -8 -8 -8
(Increase) Decrease in Net Debt -127 41 58 75 79 107
Source: Company data and EQUITA SIM estimates

Moncler – November 8, 2013
IMPORTANT DISCLOSURES APPEAR INSIDE FRONT COVER� 56 THIS DOCUMENT MAY NOT BE DISTRIBUTED IN THE UNITED STATES, CANADA OR IN JAPAN OR TO ANY RESIDENT OF JAPAN
INFORMATION PURSUANT TO ARTICLE 69 ET SEQ. OF CONSOB (Italian securities & exchange commission) REGULATION no. 11971/1999 This publication has been prepared by Paola Carboni on behalf of EQUITA SIM SpA (licensed to practice by CONSOB resolution no. 11761 of December 22nd 1998 and registered as no. 67 in the Italian central register of investment service companies and financial intermediaries)
In the past EQUITA SIM has not published studies on Moncler
EQUITA SIM intends to provide continuous coverage of the financial instrument forming the subject of the present publication, with a semi-annual frequency and, in any case, with a frequency consistent with the timing of the issuer’s periodical financial reporting and of any exceptional event occurring in the issuer’s sphere of activity. The information contained in this publication is based on sources believed to be reliable. Although EQUITA SIM makes every reasonable endeavour to obtain information from sources that it deems to be reliable, it accepts no responsibility or liability as to the completeness, accuracy or exactitude of such information. If there are doubts in this respect, EQUITA SIM clearly highlights this circumstance. The most important sources of information used are the issuer’s public corporate documentation (such as, for example, annual and interim reports, press releases, and presentations) besides information made available by financial service companies (such as, for example, Bloomberg and Reuters) and domestic and international business publications. It is EQUITA SIM’s practice to submit a pre-publication draft of its reports for review to the Investor Relations Department of the issuer forming the subject of the report, solely for the purpose of correcting any inadvertent material inaccuracies. This note has not been submitted to the issuer. EQUITA SIM has adopted internal procedures able to assure the independence of its financial analysts and that establish appropriate rules of conduct for them.
Furthermore, it is pointed out that EQUITA SIM SpA is an intermediary licensed to provide all investment services as per Italian Legislative Decree no. 58/1998. Given this, EQUITA SIM might hold positions in and execute transactions concerning the financial instruments covered by the present publication, or could provide, or wish to provide, investment and/or related services to the issuers of the financial instruments covered by this publication. Consequently, it might have a potential conflict of interest concerning the issuers, financial issuers and transactions forming the subject of the present publication.
Equita SIM S.p.A. participates, or has participated in the last 12 months, in the placement syndicate for financial instruments issued by MONCLER S.p.A. In addition, it is also pointed out that, within the constraints of current internal procedures, EQUITA SIM’s directors, employees and/or outside professionals might hold long or short positions in the financial instruments covered by this publication and buy or sell them at any time, both on their own account and that of third parties.
The remuneration of the financial analysts who have produced the publication is not directly linked to corporate finance transactions undertaken by EQUITA SIM.
The recommendations to BUY, HOLD and REDUCE are based on Expected Total Return (ETR – expected absolute performance in the next 12 months inclusive of the dividend paid out by the stock’s issuer) and on the degree of risk associated with the stock, as per the matrix shown in the table. The level of risk is based on the stock’s liquidity and volatility and on the analyst’s opinion of the business model of the company being analysed. Due to fluctuations of the stock, the ETR might temporarily fall outside the ranges shown in the table.
EXPECTED TOTAL RETURN FOR THE VARIOUS CATEGORIES OF RECOMMENDATION AND RISK PROFILE
RECOMMENDATION/RATING Low Risk Medium Risk High Risk
BUY ETR >= 10% ETR >= 15% ETR >= 20%
HOLD -5% <ETR< 10% -5% <ETR< 15% 0% <ETR< 20%
REDUCE ETR <= -5% ETR <= -5% ETR <= 0%
The methods preferred by EQUITA SIM to evaluate and set a value on the stocks forming the subject of the publication, and therefore the Expected Total Return in 12 months, are those most commonly used in market practice, i.e. multiples comparison (comparison with market ratios, e.g. P/E, EV/EBITDA, and others, expressed by stocks belonging to the same or similar sectors), or classical financial methods such as discounted cash flow (DCF) models, or others based on similar concepts. For financial stocks, EQUITA SIM also uses valuation methods based on comparison of ROE (ROEV – return on embedded value – in the case of insurance companies), cost of capital and P/BV (P/EV – ratio of price to embedded value – in the case of insurance companies).
MOST RECENT CHANGES IN RECOMMENDATION AND/OR IN TARGET PRICE (OLD ONES IN BRACKETS):
Date Rec. Target Price (€) Risk Comment
nil
DISCLAIMER The purpose of this publication is merely to provide information that is up to date and as accurate as possible. The publication does not represent to be, nor can it be construed as being, an offer or solicitation to buy, subscribe or sell financial products or instruments, or to execute any operation whatsoever concerning such products or instruments. EQUITA SIM does not guarantee any specific result as regards the information contained in the present publication, and accepts no responsibility or liability for the outcome of the transactions recommended therein or for the results produced by such transactions. Each and every investment/divestiture decision is the sole responsibility of the party receiving the advice and recommendations, who is free to decide whether or not to implement them. Therefore, EQUITA SIM and/or the author of the present publication cannot in any way be held liable for any losses, damage or lower earnings that the party using the publication might suffer following execution of transactions on the basis of the information and/or recommendations contained therein. The estimates and opinions expressed in the publication may be subject to change without notice.
EQUITY RATING DISPERSION AS OF SEPTEMBER 30, 2013 (art. 69-quinquies c. 2 lett. B e c. 3 reg. Consob 11971/99)
COMPANIES COVERED COMPANIES COVERED WITH BANKING RELATIONSHIP
BUY 44.9% 50.0%
HOLD 46.0% 44.2%
REDUCE 8.5% 5.8%
NOT RATED 0.6% 0.0%