Nevada takes flight with MONAHRQ Center for Health Information Analysis (CHIA) Joseph A. Greenway.

MONAHRQ Design Improvement Final Report (Public) Prepared for:
Agency for Healthcare Research and Quality Prepared by:
Diane Stollenwerk, NQF The Lewin Group, Inc. January 31, 2011

Final Report (Public) MONAHRQ Improvement Report January 31, 2011
i
Acknowledgements The author and sponsors wish to thank the following people from organizations across the country for providing their insights and suggestions regarding MONAHRQ. In addition, special appreciation to Carol Sniegoski, Anne Elixhauser, and Peggy McNamara of the Agency for Healthcare Research and Quality, and Jennifer Kuo and Allison Yudt at The Lewin Group for their insights and invaluable contributions to the creation of this resource.

Final Report (Public) MONAHRQ Improvement Report January 31, 2011
ii
Table of Contents
Executive Summary ......................................................................................................................................... 1
I. Introduction and Methods ..................................................................................................................... 4
II. MONAHRQ Offers Great Value Today............................................................................................. 6
III. MONARHQ v2.0 Observations and Suggestions by Content Area ............................................ 9
A. Overall Design ................................................................................................................................... 9
1. Define Your Audience First ......................................................................................................... 9 2. Restructure: Create Separate Sites for Consumers and Analysts, or One Website for the
Public with Drilldown to More Technical Data for Analysts .................................................. 9 3. For the Public, Structure information Around Questions Consumers Naturally Ask ........... 10
B. Explanations and Word Choice ................................................................................................... 11
1. Need to Provide and Explain Context to Consumers ............................................................... 11 2. Need to Clarify or Explain Elements for Professionals ............................................................. 12 3. Simplifying Text is Crucial for the Public (and many professionals too!) ............................... 12
C. Landing Page and Navigation ..................................................................................................... 13
1. Create a Compelling Homepage ................................................................................................. 13 2. Improving the Search Function ................................................................................................. 14
D. Charts ................................................................................................................................................ 14
1. Icons Get Mixed Reviews (fortunately there are tested best practices to rely on) ................... 14 2. Other Ideas for Improving the Charts ....................................................................................... 15 3. Addressing When There is “Not Enough Data”: Consumers Interpret it as Negative ....... 16 4. Measures: Need More Measures, Within a Framework ........................................................... 16 5. Display When There is a Tight Distribution: Consistency is Most Important ....................... 18
E. Maps and Underlying Charts ....................................................................................................... 18
1. Very Popular But Could Be Better ............................................................................................ 18 2. Regions: Defining and Allowing Customization is Important ................................................ 19 3. Race and Ethnicity Information is a High Priority .................................................................. 19
F. Data ................................................................................................................................................... 20
1. Accessing State Data May be a Barrier, but MONAHRQ Can Help ..................................... 20 2. Data Dates and Format ............................................................................................................. 20 3. Trending or Multiple Years is Very Important ........................................................................ 20 4. Housing the Data: Website-Database Connection Preference is Split ..................................... 21
G. Customization ................................................................................................................................. 22
1. Needed Customization to Enable Uptake by Certain States..................................................... 22 2. Customizing Charts, Maps and Other Areas ........................................................................... 22
H. Technical Issues ............................................................................................................................... 23

Final Report (Public) MONAHRQ Improvement Report January 31, 2011
iii
IV. Report Websites to Review and Potentially Emulate Certain Aspects ..................................... 24
V. Encouraging Uptake and Use of MONAHRQ ................................................................................ 25
VI. Recommendations from Current Research ...................................................................................... 28
VII. Summary of Top Recommendations ................................................................................................. 37
Attachment 1: Brief Profiles of Reporting Status in Selected States ............................................... 39
Attachment 2: Short-term Suggestions for Potential Changes to MONAHRQ v1.0 based on User Interviews (sent to AHRQ November 2010) .................................... 43

Final Report (Public) MONAHRQ Improvement Report January 31, 2011
1
Executive Summary
Described as “too good to believe” and “one of the best tools coming out of AHRQ,” the MONAHRQ on-line analytic and website development tool (monahrq.ahrq.gov) is perceived by state and community leaders as a diamond in the rough, worth shaping and improving over time. The downloadable software, developed by the Agency for Healthcare Research and Quality (AHRQ), is available in the public domain and was designed to enable State agencies and others engage in analysis and public reporting within a very short timeframe.
To develop a plan for future refinements and potential expansion of MONAHRQ, interviews about MONAHRQ were conducted with leaders from five Chartered Value Exchanges and eight states, plus two consumers and five individuals known for their expertise in public reporting for consumer audiences. The discussions explored current and future usefulness of MONAHRQ overall, in addition to specifics about the analytics, technical process, and website design and content. An environmental scan was also conducted to glean insights from recommendations in seven research papers and online resources devoted to successful measurement and public reporting efforts.
Overall, the findings show that MONAHRQ offers value today that would certainly increase in the future with updates and improvements. Recommendations from both the research and the interviews revealed that defining the core audience is paramount. The likely focus will be on consumers as the primary audience for the design of the public website, while recognizing that state and community leaders, analysts and health professionals will also find value in the site. Given this, the recommended structure for an updated version of MONAHRQ will involve creating a compelling home page for the general public, with drill-down capability to get to a wider array of statistically specific measure results.
To do this will require discipline at the top-level to apply a tested framework to explain quality health care in simple terms, with a smaller number of measures presented in the context of questions that consumers typically ask or the issues in which they are already interested. For example, some of the information that could be of interest to consumers is currently imbedded deep in the “professionals” area of MONAHRQ – such as the cost savings associated with reducing avoidable hospitalizations for certain conditions like diabetes. By taking a consumer-focused approach to looking at the array of information, MONAHRQ designers could connect various information elements and bring them together to approach the issues or answer the questions that consumers are asking. How can I get more affordable health care? What can I do to ensure that my hospital stay is safe? Where is the best hospital for having a baby? By finding the intersection between the issues of interest to consumers and the data available (now or in the future) in MONAHRQ, the website could present a more compelling and comprehensive picture to help lead the public to a better understanding of key aspects of health care quality, in a way that makes sense to them. If the topic matters to them and they understand the information, consumers will be far more likely to use it for informed health care decision-making.
Even before the basic structure of MONARHQ is refined to be on the leading edge, several recommendations can be applied right away to improve value and usefulness of the software. Such changes include: use icons in the charts that have been tested and proven to increase consumer understanding of performance results; and, create the ability to customize certain fields or titles, such as defining a region or renaming the cost-to-charge ratio if it conflicts with

Final Report (Public) MONAHRQ Improvement Report January 31, 2011
2
local definitions. The report includes an array of comments and suggestions for improvements such as these, organized into categories including: navigation, search function, charts, measures and frameworks, maps, customization, data sources, trending and technical issues.
Ultimately the purpose of a public report on health care is for it to be used in decision-making. Before it can be used, people need to know about it and feel compelled to look at it. Therefore, the report also recommends drawing from existing AHRQ materials – such as portions of the content of the Talking Quality website and the Communication Toolkit developed for Chartered Value Exchanges – to create a customized set of supportive materials for use by states and others who want to measure and/or and publicly report using MONAHRQ. Some of the materials would explain to MONAHRQ users the logic and research behind the overall approach and design features, to help state and community users of MONAHRQ understand why the approach was taken. This is useful in cases where the approach preferred by a health care analyst or policy leader differs from the approach that has been tested and proven to be more effective in communicating with consumers. In addition, AHRQ could provide MONARHQ-related communication materials with suggested key messages, templates and checklists to give state and community leaders a jump start in promoting their public report generated through MONAHRQ.
The analytic capabilities of MONAHRQ should not be overlooked. Several interviewees noted that they value the ability to run their data using MONARHQ to conduct internal analyses, whether or not they publish it to a MONAHRQ-generated website. The analyses could be used by a small team, published on an existing non-MONAHRQ website, or shared by some other means. In this light, many users had suggestions about new sources of data to add, additional measures, new ways to look at the information and a variety of ways they would like to customize the approach to fit their unique situation. Given the priority on improving health and health care over time, adding the ability to track multiple years of data or look at trending is very popular.
Recommendations in this paper are intended for AHRQ to use when creating a schedule of future updates to MONAHRQ, plus supportive materials, in order to keep the online tool on the leading edge of best practices. This report is structured as a robust checklist, enabling easy assessment of user input, to see where there is agreement or dissention and where best practices research might have a recommendation for approaching the issue. Throughout the report, where research signals a recommended approach to a particular topic, it is noted. Giving the evolving nature of this field, there are several areas for which there is not yet a best practice to recommend. To supplement ideas and decisions about MONAHRQ updates, the report lists websites that were mentioned by interviewees as presenting good examples of certain features or functions. In a separate section, a summary of the key recommendations from the best practices research and resources is included.
The timing of this work presents a unique opportunity for AHRQ and the MONAHRQ tool. Given the impending release of the HHS National Quality Strategy, MONAHRQ could be modified to reflect the elements such as the “Triple Aim” to result in better care, more affordable care, and better health for individuals and communities. Given that States will need to meet national reporting requirements and will be affected by payment incentives – each of which are required by the Accountable Care Act to take into consideration recommended measures from National Quality Forum (NQF) – AHRQ should consider working directly with NQF to position MONAHRQ as the centerpiece for pulling these elements together. Together, AHRQ and NQF could plan and design future MONAHRQ versions with imbedded national

Final Report (Public) MONAHRQ Improvement Report January 31, 2011
3
frameworks and NQF-endorsed measures to provide the best support possible to current and future reporting organizations across the country. Given tools in development within NQF – such as the Quality Positioning System (to enable searching and combining NQF-endorsed measures based on broad categories and national frameworks) and the Dashboard of Core Measures to be used as roadmap for starting or expanding public reporting – MONAHRQ could reflect the leading edge thinking and capabilities in measurement and public reporting.
MONAHRQ is a tool still at an early stage, yet the value of this diamond in the rough is most notable in its ‘quick usefulness’ and ease of producing the content and website. As the leader of a Chartered Value Exchange noted, “we couldn’t do this in-house as we are not steeped in resources. It’s an amazing tool and we are very grateful that it’s out there for free.” Another simply said, “This is my federal tax dollars at work? Wow, this is great!” There is clear support and enthusiasm for AHRQ continuing to develop the software tool so that state and community leaders can reap even more value from the low-cost approach to measurement, analysis and public reporting of information to help improve health and heath care across the county.

Final Report (Public) MONAHRQ Improvement Report January 31, 2011
4
I. Introduction and Methods
While once considered a rare activity, State and community leaders across the country are seeking ways to measure and report on aspects of health and health care in order to motivate improvement. The barriers to doing include practical issues such as a lack of resources, data sources and technical expertise. Softer types of barriers are related to the cultural challenges of building buy-in from providers, health plans and others, and helping the public and other audiences understand the purpose of the report, the content and how to use it.
The software tool, MONAHRQ, developed by the Agency for Healthcare Research and Quality (AHRQ) has been designed to enable State agencies and others engage in analysis and public reporting within a very short timeframe. Given the evolving state of the leading edge thinking and experience in measurement and public reporting in health care, AHRQ commissioned this project to elicit responses from current and potential users of MONAHRQ to gather ideas from the field about how MONAHRQ can better serve the needs at the state and community level. The information in this report is based on interviews with representatives from twenty organizations, grouped into four categories: Chartered Value Exchanges, State agencies, experts in public reporting for consumers, and individual consumers.
The purpose of this report is to provide AHRQ organized feedback and a checklist of suggestions from the field regarding future directions for development of MONAHRQ. More than 450 individual substantive comments and suggestions were made during the course of the discussions about MONAHRQ, each of which was conducted during an online review of the MONAHRQ user pages on the AHRQ website, examples of current MONAHRQ websites in Nevada and Hawaii, and a detailed walk-through of a beta site of version 2.0 of MONAHRQ. The content of the report is intentionally presented in outline and bulleted form, to enable easier review and application of specific comments and suggestions. The source of specific comments or recommendations is noted with an abbreviation for the reviewer’s organization.
To maximize the value of this input from current and potential users of MONARHQ, the report also notes, where available, insights and recommendations drawn from key research available at this time regarding measurement and public reporting on health care. The information incorporated into this report is based on an environmental scan of the following applied resources:
Model Public Report Elements: A Sampler -Final Report prepared for AHRQ May 27, 2010
CVE Public Reporting Series by Hibbard and Sofaer:
Best Practices in Public Reporting No. 1: How to Effectively Present Health Care Performance Data to Consumers
Best Practices in Public Reporting No. 2: Maximizing Consumer Understanding of Public Comparative Quality Reports: Effective Use of Explanatory Information
Best Practices in Public Reporting No. 3: How to Maximize Public Awareness and Use of Comparative Quality Reports Through Effective Promotion and Dissemination Strategies

Final Report (Public) MONAHRQ Improvement Report January 31, 2011
5
Understanding Who Visits and Uses Your Public Report ― presentation to MONAHRQ Learning Network, R. Adams Dudley, November 2010.
Tested Messages for Effectively Communicating with the Public, Robert Wood Johnson Foundation – Aligning Forces for Quality, November 2007
Talking Quality website, AHRQ, www.talkingquality.ahrq.gov
While the number of tested and proven approaches to effective measurement and public reporting is slim at best, the body of evidence is growing. According to “Model Report Elements: A Sampler,” there are no real best practices. As reporting approaches evolve at the national, state and local levels, new lessons are learned. The potential for improving health and health care through the use of measurement and public reporting will increase as:
Technology and its capabilities expand and improve in health care, on the web and in use by consumers;
New data sources become available to assess health care and population health;
More evidence is gathered to identify effective patient-centered health care that results in improved health;
New measures are developed, tested, evaluated and nationally endorsed for use at the national, state and local levels; and,
More effective approaches to engaging consumers in using comparative reports on health care for informed decision-making are designed, tested and refined over time.
At this point, what we know for sure is that the most promising approaches to measurement and public reporting are those which are developed and maintained by organizations committed to continuing to update and improve their reports over time. In that regard, to the degree that AHRQ continues to improve MONAHRQ in 2011 and beyond, MONAHRQ will continue to be on the leading edge of measurement and public reporting.

Final Report (Public) MONAHRQ Improvement Report January 31, 2011
6
II. MONAHRQ Offers Great Value Today
The comments and suggestions from many of the organizations indicate strong enthusiasm about MONAHRQ and its current and potential value for organizations that want to measure and publicly report on health care. To ensure that there is no doubt in the mind of the readers of this report, all of the comments on the value of MONAHRQ have been included below, rather than being summarized or combined.
A. Cost-Effective Way to Analyze and Report on Health Care
Comments:
“This is my federal tax dollars at work? Wow! This is great!”
“This is one of the best tools coming out of AHRQ”
Enables people to easily use MONAHRQ to display data especially in cash-strapped states and other organizations
Biggest challenge for communities is to create a website so MONAHRQ is an excellent tool
Being able to do some kind of hospital reporting using national data is very valuable. With 31 hospitals that are all very close together, MONAHRQ would allow them to do county or regional scores or mapping.
Really like the quick usefulness of MONARHQ, don't want to duplicate in-house what they can do with MONAHRQ
They couldn't do this as well in-house as “CVEs are not steeped in resources.” It's an amazing tool and they are "very grateful that it's out there for free"
Ease of producing the content and website as they “don’t have the staff to do this” and “don't have the software.” Love the speed of being able to get this up and running and get the data out to the public
Primary reason for interest in MONAHRQ: make best use of staff time (ease of producing and reducing expenses)
Ability to get the web-based report up quickly
Ease of producing the content and website is great value; “MONAHRQ automates a laborious process and that pleases me enormously.”
Suggestions
Analytics are valuable: consider allowing bare bones access to the core analytics and data presentation so state can get up and running quickly
B. Specific Functions are Particularly Useful
Comments
Analytics are a “huge” value for them "-- almost instant gratification. The mapping capability is of great interest.
Ability to generate the statistics through MONAHRQ is “too good to believe”
Costs: cost-to-charge ratio is useful and of great interest to the public too! Cost savings estimator is very interesting and will be useful to policy analysts

Final Report (Public) MONAHRQ Improvement Report January 31, 2011
7
They use MONAHRQ to ‘double check’ / validate the reports they are producing; ‘error’ identification in MONAHRQ helps them to identify issues in their own data and analysis to see if everything is okay.
Utilization statistics are very helpful to answer questions about policies or concerns about certain issues “We would LOVE to have that information to use”
Opens up new methodologies that have been discussed but not yet applied
Great content, quality indicators by conditions is very useful
MONAHRQ has aspects they don't do now: assess burden of illness; AHRQ QIs, PQIs; generate rates and maps; estimated cost savings is “big deal to us and we intend to use that information” need to decide whether to incorporate the process or simply use end data
Like the potentially avoidable hospitalization information, especially conditions treatable by primary care providers and Emergency Department visits
Love the cost savings and reduction data associated with avoidable hospital admissions
Download and copying of data to other software is a great feature
Suggestions
Mapping capabilities are most important; “It would be awesome to be able to input your own data and map that out” for example, licensed MDs and other providers for workforce issues
Cost savings chart under the maps is extremely helpful -- any way to highlight this more?
Exporting data is great; would be good to always enable exporting to Excel plus copy and paste
Utilization for all patients: reorder which totals are listed, either biggest to smallest (USA, region, state) or put STATE at the top with region and USA at the very bottom of chart
C. The Content is Useful for Many Different Audiences
Comments
Overall, great site. There is great stuff in here.
“Our stakeholders would be blown away if we produced a site like this. They'd say, ‘Wow! How'd you do this?’ ”
MONAHRQ has great promise for integrating data sources from federal agencies, also for state policy makers to bring together their various tools which is very important. DOH, Family Health Admin, MHCC, Environmental Health Epidemiologists are ALL looking at how to use MONAHRQ
Information is useful for local economic development councils, local politicians, HR staff recruiting employees ― “they will all focus on the ‘for the public’ side, not on the medically-heavy, statistical side of MONARHQ;” it's very useful for the community overall
Health insurance exchanges will likely be interested in this and will want other information in here too. Analysts, QIOs, state policy people will use this site.
It is great that this is being made available for consumers, excited to see what v3.0 will be
Looking at MONAHRQ to expand certain aspects of hospital reporting; would use the site if it were great and super consumer-friendly. “We have a big interest in seeing MONAHRQ improve and succeed”

Final Report (Public) MONAHRQ Improvement Report January 31, 2011
8
CCS statistics can be very useful, allowing an organization to serve as a data warehouse for the region (basic info for grants, agencies, etc.)
Using MONAHRQ to bring CMS' hospital compare information into their website would be great. “CMS reporting can help local people get over their fear of individual hospital reporting.” It's a great tool to move along with public reporting
Common platform for sharing information across the different areas of our DOH. It ensures people are looking at a consistent set of measures
Maps for avoidable admissions: strong interest in cost savings charts, have used these in analyses for the State.
Avoidable stays by county: very useful for local health department to be able to look it up by county
Suggestions
Already have a website for ambulatory measures “but if MONAHRQ website were awesome for that, we would use it instead and save a ton of money”
Add measures to show to hospitals and other providers the cost to them if they don't meet quality goals. A formula like “for every 1% (or X%) improvement, income increases by X dollars". "This information will appeal to providers' enlightened self interest.”
Maps: for the underlying table for hospital readmissions, show what percentage over the average they are and what would be saved if they just improve to be average.
Add a self-driven value analysis using the cost-to-charge ratio and hospital admission data. “What if we picked this condition in this county/region/area and reduced it by X%?” then the result could show savings. Repeat as many times as needed to allow people to create their own strategic chart of potential cost savings across a state.

Final Report (Public) MONAHRQ Improvement Report January 31, 2011
9
III. MONARHQ v2.0 Observations and Suggestions by Content Area
A. Overall Design
1. Define Your Audience First
It is not clear who the primary audience is for this website.
Select a type of user which will define the strategic path for layout and content (hard to serve multiple audiences that are so different)
Audience labels are off-putting: who is a "professional?" Implies different sets of information or that one audience isn’t as smart as the other. Instead of "stats for professionals" what about "detailed statistics"?
Appears to be designed for health professionals; challenging to migrate to making it consumer friendly as the information needs are radically different
2. Restructure: Create Separate Sites for Consumers and Analysts, or One
Website for the Public with Drilldown to More Technical Data for Analysts
Layer data with a link to showing details at the bottom, don't segment the site by audience (see www.abouthealthquality.org); give "work" and layperson same navigation; don't have to relearn how to use if in different parts of the site
Create a unified site, with drilling down to details (rather than a separate public / professional path)
“Make it as simple as possible with a single path that gets to more detail the deeper you go, just like the late night infomercials: 'but wait! There's more!"
Consider setting up the website so it's all public, but you get different views based on how you enter the site. Don't have to create several websites this way.
Most people want the big picture: who is good? Who is not? Where is it safe? Where is it not? Put basic information on top and let people drill deeper if they want.
If targeted to patients, it must be useful to patients. Be specific to what you want them to know and what they need.
If it's for professionals, provide everything you can to them, with ability to export a SQL table
Create a consumer site and a site for health professionals
Create one homepage with side-by-side boxes for public and professionals, with content under each being different; or, create a separate site for the public (this will force strong consideration about who the audience is)
‘Best Practices’ Commentary: User input and research agrees that it is important to define your primary and secondary audiences. Such clarity will drive the design and content of the entire website. Consumers are primary, with the secondary audience being analysts, policy experts and others in health care. See research findings 2-4.

Final Report (Public) MONAHRQ Improvement Report January 31, 2011
10
3. For the Public, Structure information Around Questions Consumers Naturally Ask
Structure homepage from the patient's perspective: “If I am going to have a hip replacement, where can I get information about this?” Pull together the information from across the current MONAHRQ buckets. Calls from reporters are also usually about a topic like this. “People end up poking around to see what's there rather than letting the website guide them to information they want around a topic.” This approach can help identify gaps and where more information is needed.
Create an interactive introduction for consumers to have them select WHY they are interested in hospital information (e.g., what type of hospitalization matters to you?); Research shows people's experience differs depending on why they are in the hospital; similar to a roll-up, helps people see a context for what they look at
People are looking for health information based on a condition or topic THEY want information about. Rather than a site on “quality” it's got to be about “conditions” that leads to quality information as a subset. Let audience know that this website is about topics they want, based on questions they are asking when changing health plans, have newly diagnosed with conditions, are seeking certain treatments. Put the other stuff behind a curtain or make it available to people who are interested in that level of detail
Key to engaging consumers: educate about what can go wrong, what are the most prevalent quality problems (explain what the information is, how it can be used by consumers). People are also interested in comparing across care settings “What do I do with Mom?” Nursing home? Assisted living? Look at this from the perspective of what consumers are actually asking
Consumers are interested in trends ― who's getting better? Who's trying to improve? “Consumers want to see progress” and who's getting there in terms of quality (especially true when they have no choice of hospital)
Consumers would value just-in-time actionable information about conditions: “here's what you can do about your care / your condition. Here's where to get more information.” Info about specific conditions
Expand content beyond hospital reporting: cross conditions, specialty, ambulatory care for people with chronic conditions, maternity and pediatric (“it's huge, as you can do research when you are pregnant”) and health insurance plans; “we are moving into a phase of accountability and transparency so data on all aspects of the health care system is very important”
‘Best Practices’ Commentary: User input and research point in several directions; however, the strongest theme is to develop one website with the homepage focused on consumers, with the ability to drill down to information that is useful for secondary audiences such as analysts, policy experts and others in health care. Most users leaned in this direction, as does the research findings. See research findings 2-4.

Final Report (Public) MONAHRQ Improvement Report January 31, 2011
11
Add to avoidable hospitalizations chart the number of people who don't end up in the hospital if there is an X% reduction (in addition to savings in dollars) ― public would be very interested in this
B. Explanations and Word Choice
1. Need to Provide and Explain Context to Consumers
Overall presentation is highly complex. “I'd be surprised if consumers would understand it.”
Items that need to be explained more clearly so consumers will understand:
Why is each measure important?
What consumers can use the information FOR: “choose a hospital” “ask your doctor”
Utilization, because it's important that they know about it as a policy issue
“Good results”
Surgical, non-surgical, etc. – what is it and why does it matter.
Add information to maps regarding the cost-savings to note that it’s about over-use, to help people understand that it's not a good thing
Length of stay, as it can send the wrong message because people assume that longer is better
Link quality and cost to provide context, provide information in the tables about what each means
‘Best Practices’ Commentary: User input and research are consistent regarding developing the website with a vision of how the site supports the goal of improving health and health care, from the angle of issues in which consumers are interested. Restructure the top level data to answer questions that consumers are asking. Cover several conditions and more provider types than just hospitals. See research finding 7.
Drill-down information can show the more detailed technical perspective, with confidence intervals and other information that would be of stronger interest to analysts and providers engaged in quality improvement.
The challenge will be to structure the site to include information of interest to researchers, analysts and providers, but which has little immediate value to consumers. It could be structured into the homepage under a separate tab.
‘Best Practices’ Commentary: User input and research agrees that more explanations need to be added to MONAHRQ. In addition, and potentially more important, is to simplify the text and descriptions to use ‘everyday’ language understandable for consumers. Aim for 8th grade reading level or lower, if possible. See researching finding 27.
While cost issues, including Length of Stay data at hospitals, are crucial to report, they can be misinterpreted by consumers so caution is needed as there is no evidence on how best to approach those important topics. Perhaps test the messages and presentation of cost and length of stay data with consumers to help with the leading edge of messaging and presentation. For more, see research findings 52-55.

Final Report (Public) MONAHRQ Improvement Report January 31, 2011
12
2. Need to Clarify or Explain Elements for Professionals
“Doctors need to see things as simply as normal mortals do. They'll say 'just tell me what you want me to do ‘or’ what are you trying to say?”
What is CCS? MCD? DRG? Need to define and choose better terms for the tabs. What is the source of the data?
Would like to know which specific codes are in each category of procedure or diagnosis codes
Is MONAHRQ using “mean” or “median”? It's not clear and should be easy to determine
95% confidence interval isn't clear on the chart: need to know how to get to the explanation of what this means
Need to know how rates are calculated, either to ensure that it's the same as the State does or to modify to fit the State requirements
Utilization stats are complicated and hard to interpret; “total for selected region” and need to note that the stats below are for that particular region
Maps of avoidable hospitalizations: define numerator and denominator
3. Simplifying Text is Crucial for the Public (and many professionals too!)
"Joe consumer won't understand most of this website" - "they will look and say 'Oh, this isn't for me' and walk away"
Health literacy level is too high; need to simplify text to no more than a 6th grade reading level.
"The words are doctor-speak or tech-speak, not person-speak" need to research what patients want in a site. Will boards of directors of provider organizations understand this? "Package this so that mere mortals can understand it."
Cerebrovascular is too big a word. Medical terms are hard for people.
“We are always editing measure names" have (1) formal name; (2) internal name; and (3) public-friendly name
Simplify "figures presented are percentages". Unclear
“Other is not a good way to define something". Surgical vs. non-surgical: need to be more specific
Less text is better, as people don't read much
Wording Suggestions
Put in plain language “this is information that will help you get better health care.” needs motivational information: WHY should people look at it? (this has been done by some of the AF4Q sites) Need a purposeful review of the whole site to turn it into plain language

Final Report (Public) MONAHRQ Improvement Report January 31, 2011
13
Utilization: right care at the right time is a hook to get people interested in it
Hospital readmissions: avoid going to the hospital if you don't need to, don't want to end up back in the hospital if it can be avoided (avoidable hospital admissions is really about care coordination and how primary care practices are doing)
Instead of “utilization” what about “diagnostic categories?”
The button “data now” gives the impression that raw data is being given (and data is very confidential). Instead use “see results” or “go” or “see report” or “get report”
‘Patient experiences’ sounds like stories; mortality should be death rate
Maps of avoidable hospitalizations: use “too few” instead of “c” in the charts as “confidentiality of patients” scares people; describe that in the methods instead
C. Landing Page and Navigation
1. Create a Compelling Homepage
Overall website is too medical in nature so consumers will look at it and say “this website is not for me”
Homepage isn't engaging or incites interest for consumers; design needs to be more inviting; tabs and framing are good. Pictures should tell you what the words mean; “people don't like to read”
Consumers won’t be sure where to start, too many options. Create a gateway to take you to a spot that is of interest /value to you. “A portal that shows ‘this is what people like you are typically interested in.’”
Give consumers a clear idea why they should use the site and how they can use the information
Ratings for the public is a box within a box, others are more prominent; swap that so the stats for professionals are smaller and the public ratings boxes bigger
Change the photo for public as it “looks like a shot from any zombie movie”
Drop-down for tabs: add one for “Maps of Quality” otherwise it looks like it's not functioning right
Need to be able to enlarge the text to larger than 10 point font; less text more white space is good
‘Best Practices’ Commentary: User input and research agrees that text for consumers must differ from that targeted at analysts and others in health care. For ideas, draw from the several examples of specific and tested wording for quality, frameworks and AHRQ quality indicators in the applied resources reviewed in the environmental scan. For specific suggestions, see research findings 29-33.
‘Best Practices’ Commentary: User input and research agrees on the importance of a compelling homepage. As noted above, create a home page that is aimed at the questions that consumers are asking already. Tie that information to quality data to show the connection. Ensure that the text is simple, there is a lot of white space, the photos (not too many) are compelling, and the navigation structure is clear and consistent. See research findings 9 and 10.

Final Report (Public) MONAHRQ Improvement Report January 31, 2011
14
2. Improving the Search Function
Homepage boxes imply different buckets, but quality area has three buckets that are actually connected steps; make them vertical or add step 1, 2, 3
Don’t change the ability for people to search by zip code, as they are used to being able to search that way
For the current drop down list, the quality indicator names should be in alphabetical order or it should be made more obvious why they are listed in this order
Put the text above the drop down box so you can read the text when the drop down is being used
Don't make user go back to the search page to get to other parts of the website
In terms of searching or sorting the data, it would be great to add a function that allows users to query their own data with custom questions
D. Charts
1. Icons Get Mixed Reviews (fortunately there are tested best practices to rely on)
“Red says 'stop, don't go there' and yellow says 'caution' when in reality all might be fine” (especially when the results reflect a tight distribution) so this sends a difficult message especially for consumers who may have no choice of hospitals. Using these particular images for icons seem like a step backward.
It will be hard for color-blind people to know the difference (red, green). Need to think about both color and contrast. Consider stars or 1,2,3.
Confusing. “Is the yellow with the line a minus sign or a middle of the road?”
Symbols are really good ― Red X is very clear.
People know the meaning of green/yellow/red. Like the idea of only top 10% getting green
“"Harsh” but ok; being consistent in how they are applied is important
Simple and good
“Our customers are the health care facilities and the consumers. They won’t agree on the right icons.” Color scheme is useful, but this is a drawback for facilities.
‘Best Practices’ Commentary: User input and research agrees that consumers need to be able to narrow their search to those things that are most important to the individual consumer. This might include narrowing by geography (e.g., zip code), health condition or even by performance result such as seeing only the hospitals that performed above average. Ensure that the search function is intuitive and very easy to use. See research findings 11-22.

Final Report (Public) MONAHRQ Improvement Report January 31, 2011
15
Icons can be seen as judgmental. Only show data when there isn't consensus about the 'right' level. If there is consensus, use icons too.
Consumers need icons to help with a clear thumbs-up/thumbs-down; make the icons smaller so there is white space around them (easier to see across a row)
Consumer Experts All Suggest Specific Icons
Good to move away from numbers, but need to use icons that help people see the pattern of the data. Choose what to highlight (e.g., high and low performers) and let the icons focus on that. Reduces cognitive overload. See Oregon website that compares scores for doctors offices or medical groups as great example (www.partnerforqualitycare.org/results.php).
Professionals need this too as they benefit from being able to recognize patterns
2. Other Ideas for Improving the Charts
Showing national average and state average in the chart is good, but there are too many different colors. Consider a horizontal line to show the national and state average. Or only show the comparator chosen.
Would like option to show five icon levels.
Add ability to hide the legend (toggle to show or hide it)
Icon size and bar and text size in chart are mismatched. Need to right size these things (icon and bar smaller, font bigger)
Fit icon and font size: use 10% bigger font; placement of icon box says "this is important" yet tiny font size says ignore me
Bar chart: is it possible to show deviation between top and bottom performers?
Not obvious how to get to the bar charts (icon isn't clear)
Clarify that you can sort by clicking on measure titles (not clear without an underline or a sort icon)
Create the option to compare to other state averages (e.g., AR vs. TX, TN etc.)?
‘Best Practices’ Commentary: User input and research are in conflict on this issue. The research findings strongly suggest the best icons help people see the pattern in the data. Use icons that include a shape, color and imbedded word. See comparisons of doctors offices and medical groups on the Oregon Quality Corporation website (www.partnerforqualitycare.org) as an example of the use of the consumer-tested icons.
Note: These icons, while easy to understand and interpret, are based on statistically solid analysis that reflects the confidence interval around each score. AHRQ is more likely to be able to show hospital scores in MONAHRQ using the tested icons because of ability to access the raw data from CMS, including confidence intervals. This level of statistical specificity may not currently be publicly available in the downloadable data on the CMS Hospital Compare website, which is why the websites in Oregon and elsewhere use bar charts rather than more consumer-friendly icons for the hospital comparisons.

Final Report (Public) MONAHRQ Improvement Report January 31, 2011
16
Create way to look up a single hospital and see several topics or measures for that hospital or for several hospitals (1 hospital: many indicators; 1 indicator: many hospitals); click on hospital name to pull up all indicators for that hospital
3. Addressing When There is “Not Enough Data”: Consumers Interpret it as
Negative
People will interpret this like there's something bad about the hospital. This is being tested now to come up with a good solution. In meantime, must have explanation about this so the hospital is protected as it’s only fair. Suppress the cells; add a footnote about why some don’t appear.
Ensure that users can configure the cut-off for minimum data by measure and even by facility
Why is a hospital getting "not enough data" in one measure but enough data in another? What does it mean about the quality of the hospital or the importance of the measure?
If there are no cases at all, does a hospital still appear? If so, it's confusing to show hospitals that don't provide certain types of care
Suggestion for better approach
Explain that some hospitals just don’t do certain procedures (e.g., specialty hospitals): identify when someone doesn’t do the procedure (e.g., "not applicable"). How many are not enough? What is the minimum number of cases?
Remove the blue from the label as it’s hard to read
4. Measures: Need More Measures, Within a Framework
More on Hospitals
Add infection reporting to help states and communities meet requirements
Would like to see hospital and ASC outpatient measures
Ambulatory / Beyond Hospital Walls
Need more information for care outside a hospital (outpatient, medical groups). This is very important for consumers.
‘Best Practices’ Commentary: User input and research: Use icons where a legend is not needed (see icon section above). Allow for sorting by results. Make chart intuitive. Explain chart elements. See research findings 11-22.
‘Best Practices’ Commentary: User input and research differs in approach to when there is not enough data. Based on researching findings, whether the provider name is suppressed or not, explain when it is not appearing because the provider is not licensed to provide the service, there is an insufficient number of patients, or the provider opted to not provide the information. For more, see research finding 56.

Final Report (Public) MONAHRQ Improvement Report January 31, 2011
17
Add patient experience in medical groups / CG-CAHPS.
Would like to see ambulatory measures added. If it’s in MONAHRQ, that will provide guidance to states from AHRQ as right now there is no standardized approach to this.
Would LOVE to have HEDIS indicators in MONARHQ so they can run raw data against it
Add nursing homes and LTC data and measures from Nursing Home Compare
Cross-cutting measures
Add measures of medical complications -- this is very interesting for consumers to get an overall sense of the hospital quality
In anticipation of the creation of Accountable Care Organizations (ACOs), need to plan for adding a "total value" report: combined data, experience to create the whole patient/ ACO experience (quality, cost, patient experience for a multi-faceted ACO: hospital, outpatient, ambulatory, LTC). Utimately need outcome measures across ACOs not silos.
Economic data: cost /price of procedures is a big gap at this point. Would love to have payment information but don't have that yet.
Framework of Measures for Consumers
How to reduce the amount of data that people have to look at? Use frameworks and conceptual buckets to help people understand and not have to view information in ten different ways. There a cost to providing people with too many options: “cognitive overload” especially when only small number of consumers will want this level of detail; Options take time away from the real purpose and use of the site. There is virtue in simplicity.
People are most likely interested in cost, quality, satisfaction and safety. Integrate the value-proposition for people into four questions: Is this a safe place to go? Do patients like it? Can I afford it? What results do patients get from care at this hospital? Then give a numeric rating for value in these four areas.
Want an overall rating for hospitals (but none are good at everything, so start with big buckets such as cancer care, heart care, patient experience, diabetes) so you don't have to drill down if you don't want

Final Report (Public) MONAHRQ Improvement Report January 31, 2011
18
5. Display When There is a Tight Distribution: Consistency is Most Important
Tradeoffs with the icon cut-offs when the results are in a tight distribution. “No win, no matter what you do”
It’s fine showing it the way it is. Only way to differentiate is to use colors/icons. If there is no distinction, it is of no interest to consumers. Consistency is most important. Explain it.
Focus on the low performers, for a rare event, this is a differentiation worth making (if top and bottom is 99%-87%, that a 3x difference: people want to avoid a low performer (human nature = avoid risk stronger than looking for the best); use this to explain how to use the ratings. Decide when it’s time to retire the measure.
Add what the standard or expectation is. What is the benchmark or expected performance? Everyone above this should be green.
E. Maps and Underlying Charts
1. Very Popular But Could Be Better
Very useful to compare regions visually. Excellent. Great. Really like this.
Maps of avoidable hospitalizations could be important to consumers if presented in the context of what consumers already care about, including avoiding the risk and
‘Best Practices’ Commentary: User input and research present a dual challenge: while more measures are desired and would be useful for analysts and others, the homepage and higher-level entry points to the report need to be structured around a simplified framework that limits the number of measures consumers must consider. When available, use summary (not composite) measures to help consumers understand the issues and make informed choices. The drill-down elements can then reveal more detailed and varied measures for others. The tested and suggested framework has three elements: (1) Effective – “uses treatments proven to get results” or “care that works”; (2) Safe – “uses safeguards to protect patients from medical errors” or “protects patients from medical errors”; and, (3) Patient-focused – “responsive to patients' needs and preferences”. See research findings 40-46.
Consider working into MONAHRQ elements that reflect the elements of the HHS National Quality Strategy including the “Triple Aim”: better care, affordable care, better health for individuals and communities. Given that States will need to meet reporting requirements and will be affected by payment incentives – each of which are required by the Accountable Care Act to take into consideration recommended measures from National Quality Forum (NQF) – AHRQ has a unique opportunity to position MONAHRQ as the centerpiece for pulling these elements together. Working in collaboration with NQF, AHRQ could plan and design future MONAHRQ versions with imbedded national frameworks and NQF-endorsed measures to provide the best support possible to current and future reporting organizations across the country.
‘Best Practices’ Commentary: User input and research reach no shared conclusion. Research points to putting a priority on consistency in presenting results is the most important to aid in consumer understanding. As noted earlier, ensure that chart elements are intuitive, based on website testing with consumers, and any needed explanations use simple, everyday words. See research finding 19.

Final Report (Public) MONAHRQ Improvement Report January 31, 2011
19
cost associated with being in the hospital. Help them understand why it’s better to stay out of the hospital and what they can do to reduce their chances of ending up in the hospital.
Maps on avoidable admissions, conditions, and procedures are really about community health: "how are we doing as a community overall?" How's our community doing?
Border issues: need to be able to alter text to include disclaimers for border counties as people cross some state lines for their care
Add state average to each map
Is there a way to layer the maps to enable clicking back and forth to see if there is a correlation between issues (ARC.GIS tool -- ESRI website can be used to create maps and publish for interactive public use)
White text on beige background is too hard to see (on county maps data page)
2. Regions: Defining and Allowing Customization is Important
Presenting information "by region" in various charts or maps makes the meaning hard to understand. For example, reference to region as "south" in the CSS and other data charts for Maryland and in the search area for the quality measures. Unclear what it means in each instance. (Several suggested using county as a clear default, but it’s not useful for some states, see below).
Need to be able to set regions for the maps of avoidable admissions. For some states, using counties doesn’t work because there may be only one hospital in a county so that is too specific or the county is too large a unit of analysis given the state geography. For other states, zip codes are the ideal regions. All in all, it would be best to allow users to customize their own defined 'regions.'
3. Race and Ethnicity Information is a High Priority
The "race" categories don’t appear to be the current US census categories used by OMB (e.g., Asian / Pacific Islander should be separate). This is not useful and the categories chosen are very important in order for analysis to support work to reduce disparities. Would like race and ethnicity categories to be broken out in detail. A state that sends in detailed data on race and ethnicity categories, should be able to get that detail back from AHRQ.
Need to know how race categories are defined so they can compare to their other work on disparities; need to be able to "crosswalk" race categories. Add "ethnicity" to race. Use approach consistent with CDC. Need to add a note about "Hispanic" and how it's defined, add "multiracial" as a category
For any chart where it’s possible, including total patient numbers, include the demographic break out (payer type, age, gender, race) to create overall summary
Strong interest in stratifying measures by race / ethnicity; Seeing this in MONAHRQ in the future was a topic of discussion at a recent RWJF AF4Q meeting;

Final Report (Public) MONAHRQ Improvement Report January 31, 2011
20
every AF4Q coalition will be interested in this as they are required by RWJF to report on this
F. Data
1. Accessing State Data May be a Barrier, but MONAHRQ Can Help
There is the impression that MONAHRQ would require hospitals to submit more data, when actually 48 states already collect the information needed for MONAHRQ. The hospital voice is loud and clear that they don't want to have to collect and report more data for use in the AHRQ indicators. Some state hospital associations control and protect the data.
Need Federal agencies to work together to make information available seamlessly. It is much less likely to happen if each state is left to do this on their own.
Much interest in adding new data to MONAHRQ:
CMS ambulatory data and other sources of federal data
Add ability to put all datasets through one program; different data streams, one analytic set, all in a cohesive presentation
Ability to add other state data sources (any data source with a Medicare provider ID could be linked into it)
Imbed HCUPnet components into MONAHRQ to enable states to query their own datasets (VHI would like to help design that)
2. Data Dates and Format
Encourage MONAHRQ users to use data that is as current as possible. Imbed into MONARHQ a way to see the dates of the data so it’s clear how recent it is. If the data are 2-4 years old, it's not useful
When Hospital Compare changes data set format, MONAHRQ will stay up to date with that “That would be great!”
If a user is wants to roll-up data or results generated through MONAHRQ, it would be helpful to have guidelines for best practices in formatting and applying this meta data.
3. Trending or Multiple Years is Very Important
Trending is #1 need: year by year, or show multiple years, without wiping out the previous years' data. Three to five years of data is ideal.
Hospitals likely want to see trends too.
‘Best Practices’ Comments: The research consulted for this report are silent on data issues listed above. With the priority on making MONAHRQ as useful as possible for as many as possible, attention is needed to enabling customization in mapping elements and other areas, and addressing race and ethnicity issues noted above.
Final Report (Public) MONAHRQ Improvement Report January 31, 2011
21
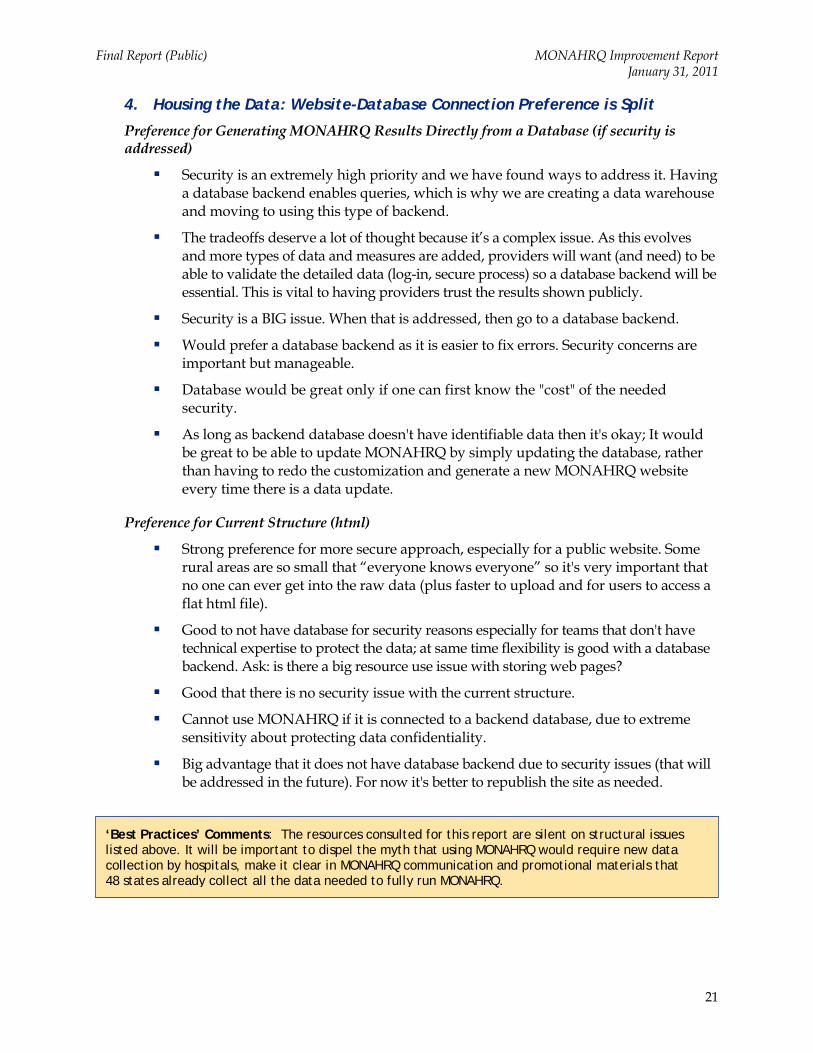
4. Housing the Data: Website-Database Connection Preference is Split
Preference for Generating MONAHRQ Results Directly from a Database (if security is addressed)
Security is an extremely high priority and we have found ways to address it. Having a database backend enables queries, which is why we are creating a data warehouse and moving to using this type of backend.
The tradeoffs deserve a lot of thought because it’s a complex issue. As this evolves and more types of data and measures are added, providers will want (and need) to be able to validate the detailed data (log-in, secure process) so a database backend will be essential. This is vital to having providers trust the results shown publicly.
Security is a BIG issue. When that is addressed, then go to a database backend.
Would prefer a database backend as it is easier to fix errors. Security concerns are important but manageable.
Database would be great only if one can first know the "cost" of the needed security.
As long as backend database doesn't have identifiable data then it's okay; It would be great to be able to update MONAHRQ by simply updating the database, rather than having to redo the customization and generate a new MONAHRQ website every time there is a data update.
Preference for Current Structure (html)
Strong preference for more secure approach, especially for a public website. Some rural areas are so small that “everyone knows everyone” so it's very important that no one can ever get into the raw data (plus faster to upload and for users to access a flat html file).
Good to not have database for security reasons especially for teams that don't have technical expertise to protect the data; at same time flexibility is good with a database backend. Ask: is there a big resource use issue with storing web pages?
Good that there is no security issue with the current structure.
Cannot use MONAHRQ if it is connected to a backend database, due to extreme sensitivity about protecting data confidentiality.
Big advantage that it does not have database backend due to security issues (that will be addressed in the future). For now it's better to republish the site as needed.
‘Best Practices’ Comments: The resources consulted for this report are silent on structural issues listed above. It will be important to dispel the myth that using MONAHRQ would require new data collection by hospitals, make it clear in MONAHRQ communication and promotional materials that 48 states already collect all the data needed to fully run MONAHRQ.

Final Report (Public) MONAHRQ Improvement Report January 31, 2011
22
G. Customization
1. Needed Customization to Enable Uptake by Certain States
Data views are high priority: Help users see how they can easily suppress AHRQ indicators to only show Hospital Compare (and any other elements for which there is federal data available). This is especially important for states that don't have hospital data or can't show individual scores.
Enable users to customize the colors and how the report looks (replace the logo, etc.) as that is very important. Some need to make it look as consistent as possible with the existing website so they don’t run afoul with branding parameters
Need to be able to suppress zip code because it's too specific given their state law against individual hospital reporting
Need to be able to allow users to select their preferred term instead of ‘charges’ because it has a specific meaning in their state. The data is great but can’t use it with that title.
2. Customizing Charts, Maps and Other Areas
Would like to create a custom or aspirational benchmark, not just state or national averages.
When tight distribution maybe set what is an acceptable level and if the lower scores are still acceptable, then they should not be red. Give states the flexibility to set that benchmark.
Can we use quartiles for the map zones and colors? Can this be done in a different way?
Allow customization, and base the default on best practice/ guidance then communicate to users that IF they change it, they do so at their peril
Would like to be able to rename or customize tab labels.
Would like to be able to modify measures such as technical specifications.
Can an organization add their own pages to customize the site, for example, to imbed with other types of data, links to sites like Leapfrog, or explanatory materials?
Allow users to be able to customize the cost-to-charge ratio so can they insert that into MONAHRQ to use that in the cost calculator.
Enable users to customize the table that shows potential dollar savings for reducing the avoidable hospitalization. If they can set the savings (e.g., 5%, 23% to reach the regional average, etc.) at customized levels, this becomes a useful tool for custom analyses reflecting a state’s unique situation, or unique situation for each area of avoidable hospitalizations.
In the avoidable hospital stays by county, would like to be able to define custom groupings (e.g., by hospital catchment area, by zip code)

Final Report (Public) MONAHRQ Improvement Report January 31, 2011
23
H. Technical Issues
When the right code doesn’t show up in a hospital’s data, their cost-to-charge ratio shows up as zero. What do to about this?
Need help with getting hospitals to report their data consistently. For example, some hospitals report the "procedure date" as the day of admission and others use the billing date
Need to accept birth weights over 7,000 grams, remove cap on acceptable data range (200 gm as low is ok). MONAHRQ currently forces them to change the data and that's not good.
Need help getting the site up, want to get it onto a laptop without SQL server
Need help trying to figure out how to integrate the analytics with their existing website
Would like to see links in MONARHQ that connect to summaries of what's going on now and where policy is headed. "Spoon feed information to folks so they can prepare and be informed." e.g., neonatal quality indicators
‘Best Practices’ Comments: The resources consulted for this report are silent on customization issues listed above.
o Tread carefully when considering allowing the ability to customize measures (e.g., modify the measure specifications), as that could undermine the standard use of national measures which is a core feature of MONAHRQ.
o Highlight in promotional materials the fact that users can customize the cost-to-charge ratio to fit their state or organization’s needs.
‘Best Practices’ Comments: The resources consulted for this report are silent on technical issues listed above.
o In promotional or supportive information, ensure that users have the [email protected] email address to get technical support.
o In the promotional or supportive information, ensure that users have answers to the questions listed above (where such answers exist).

Final Report (Public) MONAHRQ Improvement Report January 31, 2011
24
IV. Report Websites to Review and Potentially Emulate Certain Aspects
When asked to name the best reporting websites available, Jaz-Michael King of IPRO prefaced his comments by explaining, “No one has it 100% right yet.” Fortunately, many sites have done certain elements very well. Learn from them, emulate them where appropriate, but never forget that you need to take a holistic view of your website depending on the specific purpose of the website. This is especially important to keep in mind, given the unique characteristics of MONAHRQ as a standard site for use by States and communities to adapt for use in their own region.
Several websites were mentioned as worthy of emulation during the interviews:
Website URL What It Does Well
CA Healthcare Foundation
www.calhospitalcompare.org icons and contextual information
CA Office of the Patient Advocate
www.opa.ca.gov Overall impression of a good site
MA Health Quality Partners
www.mhqp.org Overall impression of a good site
Maine www.healthweb.maine.gov/claims/healthcost
Shows tradeoff between precision and variability
MN Community Measurement
www.mnhealthscores.org Overall impression of a good site
New Hampshire www.nhhealthcosts.org Shows tradeoff between precision and variability
OR Quality Corporation
partnerforqualitycare.org Icons and simple text
Puget Sound Health Alliance
www.wacommunitycheckup.org Overall impression of a good site
Virginia Health Information
www.vhi.org How to show tight distribution; click through to table; see charts by different years using tabs; contextual guide about obstetrics
Virginia Health Information
www.vhi.org/aqidata.asp allows creating a report for a city or county of all indicators, plus multiyear

Final Report (Public) MONAHRQ Improvement Report January 31, 2011
25
V. Encouraging Uptake and Use of MONAHRQ
For measurement and reporting to be effective in improving health and health care across the country, States and communities need to have a reason to begin to engage in that work. This report verifies that MONAHRQ currently offers a clear value-proposition to those interested in reporting and holds tremendous promise for many others to use the online tool to begin or expand their measurement and public reporting. In addition to the content above, the following ideas can increase the potential for expanded uptake:
Identify current and new data sources then imbed them in MONAHRQ so it can be used by States where they don't have access to hospital data for the AHRQ indicators
Highlight and promote current public sites created using MONAHRQ. Make sure that they are working well, because if the MONAHRQ site that someone else has created isn’t working well, it sends a bad message about MONAHRQ overall.
Enable ways for current and potential MONAHRQ users to share information about the problems that others have run into in using MONAHRQ, so others don’t do the same thing. (e.g., Nevada public report has too many null rows: why?)
Communicate with organizations that are using or want to use MONARHQ regarding WHY the consumer side of the website needs to be simpler so the organization doesn’t decide to 'customize' it and make it more complex or conflict with best practices.
Promote the fact that this has been developed by AHRQ. Consumers trust information from government more than an individual organization or an unaffiliated non-profit that they don’t know.
Most consumers don't realize that quality varies and they don’t see the value-proposition for quality in terms of their own health and health care. Engage in public education about quality issues, in the same way that it’s been done for smoking and obesity.
Recommended Best Practice: Support Uptake and Promotion of MONAHRQ
In addition to the ideas listed above, the resources on AHRQ’s Talking Quality website provide a tremendous array of ideas for developing and promoting a public website. AHRQ, as the developer of MONAHRQ, has a unique relationship with the users who will be finalizing the production and promotion of their MONAHRQ websites. Just as AHRQ developed MONAHRQ as a tool for use by states and communities, materials to accompany MONAHRQ could be provided to organizational users so they don’t need to reinvent the wheel when they are developing key messages, offering other information to complement the report, and encourage consumers to use the report.
As shown below, some of the elements promoted on the Talking Quality website could be used by AHRQ itself when developing the plans for the schedule of updates to MONAHRQ in 2011 and beyond. Other elements on the Talking Quality website are appropriate for the organizational users of the MONAHRQ tool. Some elements will be done by both, during the stages that MONAHRQ is developed by AHRQ and later as the organizational user customizes elements during their MONAHRQ website production process.

Final Report (Public) MONAHRQ Improvement Report January 31, 2011
26
The chart below, based on the Talking Quality Checklist, shows a potential division of labor between AHRQ and MONAHRQ users for report planning, development and promotion. Some of the elements will be built by AHRQ into MONAHRQ itself (e.g., determining the audience, developing the content – measures, descriptions, frameworks, etc – to satisfy what the audience needs, add an evaluation tool / survey) while others may be best developed by AHRQ to provide to users as supplemental documents to create the foundation for explaining and disseminating the MONAHRQ-generated website within their own state or region.
Topic AHRQ Address MONAHRQ User Address Plan Your Reporting Project
Your Audience X - general, based on national data and indicators
X - specific, based on regional circumstances and data sources
Your Objectives X – define and clarify X – to customize The Health Care Environment X Your Partners X The Subject of Your Report Card X X – to customize Quality Measures X X Your Role as a Sponsor X Paying for the Project X Managing the Project X Gaining Trust of Providers and Plans X Testing Report Materials X – site design and tools
Planning Your Evaluation X – imbed in site design X – measure regional uptake
Translate Data Into Information Showing Differences in Performance X X Describing Measure X Organizing Measures X Choosing a Point of Comparison X X – to customize Displaying the Data X X – to fit regional circumstances Taking Advantage of Web Functionalities X X Explain and Motivate Delivering Key Messages X – developing suggestions X - implementation Providing Details X X Offering Other Information X - suggested tools X – augmenting information Supporting Consumers in Using Information X – suggested tools X – augmenting information Disseminate Selecting a Medium X Getting Quality Information to Your Audience
X
Promoting Your Report X Assess Deciding What To Evaluate X – imbed in website X – augmenting Producing an Evaluation Plan X – provide suggestions X Using Evaluation Findings X – use feedback from sites X
‘Best practices’ recommendation: AHRQ could develop a set of materials customized to MONAHRQ, based on the best practice approaches and checklists in the Talking Quality website. This set of materials will save state leaders and others time and money, while improving the chances that the MONAHRQ sites will be promoted, used and have an impact on improving health and health care in the local community. Read on for more specifics …

Final Report (Public) MONAHRQ Improvement Report January 31, 2011
27
Supportive materials based on best practices will encourage and support the efforts of State and other leaders to promote and motivate the use of their local MONAHRQ website. In addition, the customized materials will help to meet a need identified by several interviewees for AHRQ to explain why the approach in the default version of MONAHRQ makes sense based on best practices and user input (target audiences, structure, wording, etc.) and to reinforce that customization should only be done when necessary. This way, all MONAHRQ users, plus consumers and others who visit the local MONAHRQ websites, will reap the benefits the state-of-the-art approach to public reporting. High priority materials to be created by AHRQ could draw from the Talking Quality website, in addition to the templates in the CVE Communication Toolkit materials, might include:
Planning the Reporting Project. To help users understand the importance of the approach taken, develop a standard description of intended audience(s) and logic behind the drill-down structure, simplified text, selected framework and measure groupings, specific icons, etc. Include suggestions for additional information to be collected and assessed by the MONAHRQ user (specific objectives, local health care environment, potential partners, role as a local sponsor, gaining the trust of partners and plans, planning evaluation, etc.)
Translating Data into Information. To help users understand the importance of the approach taken, describe the logic behind the selected quality indicators and other measures and display elements. Include suggestions for issues that MONAHRQ users should consider determining whether local customization is needed.
Explain and Motivate. Develop and suggest a set of core communication materials (e.g., key messages, Q&As, links or tools to share with consumers) with the logic behind the wording and concepts. Include suggestions for additional information or actions for the MONAHRQ users to create or take to build buy-in to the use of the messages, then finalize and make best use of the communication materials.
Disseminate. Provide a planning template and/or a short checklist for the MONAHRQ users to consider as they plan for how to promote their MONAHRQ website in their state or region.
Assess. Create a description of any evaluation elements built into MONAHRQ, such as user feedback forms, surveys, and the AHRQ-sponsored reporting website evaluation tool being developed by Dr. Adams Dudley. Include suggestions for MONAHRQ users so they can get maximum value from the evaluation findings locally and by sharing feedback with AHRQ to factor into plans for future updates of the MONAHRQ tool.

Final Report (Public) MONAHRQ Improvement Report January 31, 2011
28
VI. Recommendations from Current Research
Even though there is still much to explore, test and learn in order to identify best practices in health care measurement and public reporting, each of these resources provide a wealth of insights about the best thinking available at this time. A summary of the key insights from each resource is listed below.
Topic / Recommendation A1 B2 C3 D4 E5 F6 G7
Best Practices are those that Continue to Grow and Evolve.
1 Available examples are 'better practices' or 'common practices' but it is not yet possible to delineate 'best practices' in the area of public reporting, as such programs are relatively novel and evaluations are still being developed on the impact of websites and our understanding of how to maximize their impact. The most effective public reporting websites are those that are continually in a state of growth - actively reevaluating, refining and enhancing their offerings.
X
Identify and Know Your Audience
2 Consumer use of reports can influence quality in at least three ways:
informed choices make it more likely that consumers will obtain high-quality health care for themselves and their family members;
collective effort of many informed choices may stimulate quality improvement among providers; and
public reports that affect providers' public images may encourage providers to improve the quality of care they provide to protect or enhance their reputations.
X X X
3 It is important to determine how the report will improve health and health care performance. The answer to that can help define the primary audience.
If it’s inducing providers to improve, then the audience will be providers.
If it’s changing where patients go, then the audience will be consumers.
If it’s creating incentives for consumers to improve health care decision-making and actions, then the report should also be useful to employers, unions and health plans to shape what they do with “their” consumers (employees, union members, health plan enrollees).
X X
4 Understand who is visiting the website, do they find what they need, and changes needed to maximize the report’s impact and sustainability. Use that information to improve the public report. The survey being developed to imbed in public report websites should be added to the default version of MONAHRQ.
X X
1 Model Public Report Elements: A Sampler 2 Best Practices #1: How to Effectively Present Health Care Performance Data to Consumers 3 Best Practices #2: Maximizing Consumer Understanding of Public Comparative Quality Reports: Effective Use of Explanatory Information 4 Best Practices #3: How to Maximize Public Awareness and Use of Comparative Quality Reports Through Effective Promotion and Dissemination Strategies 5 Tested Messages for Effectively Communicating with the Public (RWJF- AF4Q) 6 “Understand Who Visits and Uses Your Public Report” (R. Adams Dudley, UCSF) 7 Talking Quality website (www.talkingquality.ahrq.gov)

Final Report (Public) MONAHRQ Improvement Report January 31, 2011
29
Topic / Recommendation A1 B2 C3 D4 E5 F6 G7
Homepage
5 The landing page - the first view of the website - is key and can either invite users in or drive them away. The homepage can be used to motivate the use of the information, to help consumers understand what the benefits are to them when they use the comparative performance data, and to help them understand how to apply the information to their choices.
X
6 Public reports should help consumers easily access and use the information that is most relevant to them, and present the information in terms that resonate with their concerns and preferences. Until consumers overtly care about quality, reports about ‘quality’ will continue to be ineffective in engaging them. As product marketers know all too well, start with concepts that matter to the consumer then present the product in those terms first (e.g., a bar of soap as a source of relaxed happiness for women, and for men soap is about attracting women). Once consumers are engaged based on their existing interests they can make the connection to quality, but the essential first step is to engage them.
X X X X
7 A few concisely stated key messages, emphasizing why this information is important and relevant to the consumer can effectively capture the consumer’s attention. Examples include:
Quality of care among [insert facility type / community] can vary widely
Consumers who don’t look at provider ratings are more likely to make a poor choice
A poor choice may have serious consequences for a person's health and finances
Information in the report can be useful in selecting a high quality or high value provider
Information can be used in other ways (e.g., to help loved ones make a choice, to start a conversation with your doctor or other health professional)
X
8 Consumers and health professionals understanding of quality issues in health care is different as is their ability to interpret technical, clinical and statistical details like confidence intervals. Professionals typically see health care quality as multifaceted. Consumers generally aren't familiar with evidence that links clinical processes to patient outcomes, which consumers care deeply about (e.g., avoiding another heart attack through specific interventions).
X X X X
Format for Consumers
9 To enhance understanding, interest and visual appeal, the layout should have adequate white space with not too much text or pictures. Streamlined layout helps to efficiently direct the users' attention to what is important on the page.
X X
10 A good website has several features to help people know where they are and to get to where they want to go:
set of tabs at the top to get to the main sections from anywhere in the report;
set of tabs at the side to help users navigate within report sections; and,
internal links from one part of the report to another.
X
11 Using comparative data to make a choice can be cognitively burdensome. Making it easier to understand makes it more likely that the data will be used. Making it easier actually increases the individual's motivation to use the data.
X X X X
12 make relevant choices visible on one screen X X

Final Report (Public) MONAHRQ Improvement Report January 31, 2011
30
Topic / Recommendation A1 B2 C3 D4 E5 F6 G7
13 use symbols with affective labels (e.g., good, average, below) instead of numbers as consumers generally have more limited numeric skills
X X
14 highlight better performers by having the good or above average icons stand out X X
15 use symbols that don't require a legend X X
16 use language and terms that consumers understand (don't require people to look up a definitions) X X X
17 don't assume people will understand advanced statistical concepts as it introduces ambiguity for people who don't understand them and can result in being less likely that consumers trust the data
X X X
18 use fewer reporting categories (e.g., 5 vs. 9) X
19 be consistent in the approach to using metrics across provider types and measures. Always make it clear whether a high value means good or bad performance. (e.g., high LOS is bad, high rate of HbA1C testing is good)
X X X
20 allow people to narrow their options by geography, level of quality (e.g., only high performers), and/or health condition or procedure
X X
21 summarize information (using overall summary measures) X X X
22 order by performance (or a function that allows this such as sorting from best to worst) X X X
23 Always test the information with consumers, ideally using cognitive interview with 10-15 individuals.
Get people to say in their own words what they think a label means.
Ask them to find the top three and bottom three performers. This will show how easy it is to understand and interpret the data.
Ask about whether they would use this information [to choose a doctor or hospital]. This will show how much the information is valued.
X X
Explain the Report in Everyday Language
24 Whether online or in print, the right kind of explanatory information will:
engage and motivate consumers to explore and use reports;
deepen consumers' understanding of quality and measurement;
legitimize the report's sponsor and credibility;
help with understanding of the importance, meaning and interpretation of specific measures;
help understanding of the implications of resource use information;
help avoid common pitfalls that lead to misinterpretation;
provide guidance and support in using the information; and,
provide appropriate access to more detailed technical information
X X X
25 It is better to use consumer-friendly language (that has undergone cognitive testing), rather than technical terms even if they are linked to a glossary.
X X X

Final Report (Public) MONAHRQ Improvement Report January 31, 2011
31
Topic / Recommendation A1 B2 C3 D4 E5 F6 G7
26 Consumers react against being called "consumers" unless it is in the context of people making choices about the best provider or facility for their care.
Use "people" when referring to the public.
Use "patients" when referring to people who are actively being treated by a doctor.
X
27 If technical terms are used they need to be defined in everyday language that will be understood by individuals at 8th grade reading level or lower (as low as 6th grade). It is better to use a common term followed by the technical term in parentheses, such as “breast cancer screening (mammography)”. Microsoft Word includes a function that will reveal the reading/grade level of text.
X X X X
28 When consumers have a better understanding of the larger concept of quality and elements that make up good quality care, they have a better understanding of quality indicators and view the comparative information as more useful.
X X X
29 Messages that test well with consumers regarding the quality of care problem, in order of priority to consumers. Note that the primary message is about the relationship with a doctor, rather than about hospitals or facilities:
Most doctors are pressed for time and patients feel like they don't have time to really talk and ask questions.
Rushed doctor visits can leave people with lingering concerns about their treatment or medications, or not having received a full explanation of their condition or treatment.
Getting good medical care is a worry for many people.
There are too many choices and there is not enough clear, trustworthy information.
In every community, both good and bad care is provided in hospitals and doctors offices.
X
30 Include a brief description of what high quality care is -- referred to as "care that works best." X X
31 Tested messages to explain the effort to measure of quality of care: “[name of group] is looking at different parts of health care to see how hospitals and doctors are doing on the quality of our health care, and helping them identify where they can make improvements. This can help people become better health care consumers by being better partners in their own care. [Note: the reports cannot be used for choosing a doctor until individual physician scores are available]
X
32 Tested message to explain public reporting: “Our team is taking action to improve the quality of health care by providing information on the quality of care provided by doctors and hospitals so consumers can make better decisions about where to get care for themselves and their family.”
X
33 Tested message about quality improvement: “This helps to pinpoint areas in the health care system where medical errors often occur and develop solutions to reduce these errors.”
X
34 Everyday language is important. Example: "effective and appropriate treatment" is easier to understand than "use of ACE inhibitors"
X

Final Report (Public) MONAHRQ Improvement Report January 31, 2011
32
Topic / Recommendation A1 B2 C3 D4 E5 F6 G7
35 Explanatory information is best located under links or at the back of a report. The first two are most important, but this explanatory information can include:
technical details associated with the measures;
methods;
letters of endorsement;
more detailed information about how to use the report;
caveats;
links to other reports that cover different aspects of quality;
additional resources or links;
contact information of providers in the report (if only a few providers); and
feedback method to show sponsor is open to improving the report
X X
36 Consider including "What does this measure show" to describe how different entities influence the results. For example, low mammography rates are not just because of physician behavior. The results may show a combination of things such as whether doctors advise mammograms, whether patients follow-up on doctor’s advice, whether health plans cover mammography, etc.
X
37 The public wants to know that the report is being fair to those who are being rated. Do this by:
noting that measure results aren't the sole responsibility of the entity being measured;
describing the interactions with the providers being rated (e.g., providers have the opportunity to review and/or comment on the findings)
X X
38 The public mistrusts quality information if they think the source of that information has an interest in the ratings, especially a financial interest.
Advertising, especially from providers and health plans, is so ubiquitous that people are naturally wary of a report that might be a marketing ploy.
When sponsors are not well known to consumers, it is important to include a brief description or mission statement up front (e.g., a tag line).
Give full information about sponsorship and methods, as well as access to the more granular data. This should not be "top layer" but should be available and made known to be available, in a drill-down layer
X X X X

Final Report (Public) MONAHRQ Improvement Report January 31, 2011
33
Topic / Recommendation A1 B2 C3 D4 E5 F6 G7
Search Function
39 The search function should be quick and easy to locate from the landing page, with a clear sequence of steps leading to an easy-to-find box to click to see the scores. For example:
X
Framework
40 Use an abbreviated IOM framework (Safe, Timely, Effective, Efficient, Equitable, Patient-centered) for communicating what quality is, which has the advantages of using only three categories and having undergone cognitive testing. When using a framework like this, quality indicators can be displayed within each of the three categories of performance. This can make each easier to understand and, at the same time, convey that "quality" incorporates three different, but important dimensions:
(1) effective - uses treatments proven to get results; (care that is proven to work)
(2) safe - uses safeguards to protect patients from medical errors; (care that causes no harm)
(3) patient-focused - responsive to patients' needs and preferences (care that is responsive to the patient’s needs)8
X X X
Measures
41 Consumers understand risk adjustment based on age or severity of illness, but react negatively to adjustments based on social factors such as education level. Risk adjustment should not hide disparities in racial, ethnic or income groups.
X
8 RWJF-funded study on Giving Consumers a Framework for Understanding Quality

Final Report (Public) MONAHRQ Improvement Report January 31, 2011
34
Topic / Recommendation A1 B2 C3 D4 E5 F6 G7
42 Patient experience measures: people seem to naturally understand this kind of measure and most, but not all, value and will use rating information from other patients and consumers.
X
43 People's interest in disease- or procedure-specific measures depends upon whether they care about that disease or procedure.
X
44 Describe clinical process measures so that the importance is clear (e.g., “patient given the right medication at the right time”). The label should explicitly make the connection between the process and the outcome.
X
45 Include caveats for measures that could be misleading. Caution should be exercised when interpreting certain measures (e.g., serious reportable events that are extremely rare). They should not reach a conclusion about a provider's overall performance by looking at just a few measures. Ways to address this include:
excluding some measures from the report;
combining data over multiple years to reduce noise;
aggregate data over related measures (e.g., mortality rates from low-risk surgeries or procedures); and
add a statement of caution about using just one measure to compare facilities or providers.
X X
46 Summary measures (summary across different types of measures such as “highest quality hospitals” or “safest hospitals”) are not the same as composites (roll-up of related measures such as “diabetes care”). While summary measures are most useful for consumers, there is no best practice for weighting measures in summary measures. Different consumers would weight sets of measures differently.
X
Charts
47 Use tested icons: symbols that use a color, a shape, and a word embedded in the symbol. Average scores are faded, so that the higher and lower performers "pop" out for the user to see a pattern. Embedded words in the symbols means that the user doesn't need to rely as much on a legend and also help the user by interpreting the information for them. For example:
X X X
48 Find the right balance between technical details and summary information. This can be addressed by providing technical details in a special section with links so it is clear that the detail is available. Health professionals are more likely to look at it, but it should be made available to everyone, regardless. Most important, it must be written as clearly and simply as possible and unfamiliar terms should be defined.
X X
49 Even though it is often technically correct to present confidence intervals when presenting comparative data, it should be avoided. Report sponsors have the responsibility to determine what constitutes meaningful differences among providers, or put labels on performance, indicating what levels of performance should be interpreted as good or poor. Consumers should not be burdened with interpreting statistical concepts.
X X

Final Report (Public) MONAHRQ Improvement Report January 31, 2011
35
Topic / Recommendation A1 B2 C3 D4 E5 F6 G7
50 Technical details should include:
time period covered
the data source
whether the data were validated or audited in some way
the nature of the sample, if a survey (e.g., survey was random and reasonably large, conducted and scored by an independent entity)
how the measure results were determined
X
51 For consumers, it is good if the information shows variation, that is, all providers should not be “average.” X
Reporting on Cost and Length of Stay (LOS)
52 Longer LOS and higher re-admissions are intended to indicate poor performance; however, consumers will view these as measures of access and interpret them in the opposite way -- they may think that a high score shows that patients are able to stay in the hospital for as long as they need or be readmitted when necessary.
X X
53 Reports that show quality within cost strata, or cost within quality strata, can help consumers see that it is possible to get good quality at a good price.
X
54 There is little to no evidence on how to display measures of resource use in a public report. X X
55
"Efficiency" as a term doesn't resonate well with consumers. It evokes concerns about medical care that is cutting corners or saving money for the insurer or the employer at the consumer's expense. Labeling a provider as "efficient" will not be viewed as a positive attribute. More consumer testing is needed. Consider:
"uses health care dollars wisely"
"is careful with your health care dollars"
"is a high-value provider".
X
Addressing the Issue of “Not Enough Data”
56 When there is not enough data, it is important to let the consumer know that the lack of a score does not reflect poorly on the provider's quality of care. Example text includes:
"If the hospital you have chosen is not on the list, it is not licensed to perform [fill in service name such as CABG surgery]."
"This hospital did not participate in this report."
"Too few patients (<25) whose care met the criteria for this specific measure to meaningfully report for this hospital"
X
Trending
57 Trend data can be presented in a number of ways:
Provide multiple years of data in separate screens that are easily accessed from a single page : http://www.vhi.org/cardiac_reports.asp
Provide data on multiple years in a single screen (e.g., trend over time graph or table)
X

Final Report (Public) MONAHRQ Improvement Report January 31, 2011
36
Topic / Recommendation A1 B2 C3 D4 E5 F6 G7
Improving Uptake of the Report
58 The number of people who are aware of comparison information for hospitals, doctors or insurance plans is about 30%, but only 14% have used that information. The upside is that these figures are higher than in previous years. [can lead a horse to water, but it needs to be something they want to drink]
X X
59 Simply publishing quality data is not enough to engage consumers in using information to make health care decisions. In absence of physician-specific performance information, which is what consumers would prefer, reports can still provide guidance on steps that consumers can take to gather available information and make good decisions.
X X
60 Five approaches to help consumers use the report information to make decisions:
list of what consumers can think about when making certain decisions;
identify which choice is the best score or best value (if costs are included);
call out key differences in performance;
provide examples of how consumers can use the information; and,
list actions that consumers can take to protect themselves from poor-quality care.
X X
61 Use AHRQ tools such as The Guide checklists,9 questions, charts and other tools such as Questions are the Answer.10
X X
62 Some consumers will want to share data with family or friends or send an excerpt of the report to themselves for a personal file. Permit outgoing emails that link to a webpage or by allowing the selected data to be forwarded via email.
X X
63 Provide an opportunity for the website users to provide feedback, ask questions or ask for help. Examples: feedback forms, contact us email addresses, surveys.
X X X
64 Ways to improve the uptake of a public report:
plan from the outset for promotion and dissemination;
identify your audience as early as possible;
engage those who can help you learn about and reach your audience;
use insights of social marketing;
be strategic about timing;
be strategic about positioning;
actively work with the media to promote the report;
use advertising to promote the report;
use outreach to promote the report and facilitate its use; and,
gather and analyze feedback on the report and its promotion [Given States lack of resources, several of these items could be prepared as templates by AHRQ to save time for users of MONAHRQ. See page 30]
X X
9 Talking Quality website from AHRQ www.talkingquality.ahrq.gov 10 http://www.ahrq.gov/questionsaretheanswer/

Final Report (Public) MONAHRQ Improvement Report January 31, 2011
37
VII. Summary of Top Recommendations
In the growing field of measurement and reporting on health and health care, there is an intense level of interest in finding the perfect solution to engage consumers, support the work of analysts and other policy makers, and motivate health care providers to focus on improving cost and quality resulting in better value for patients and public and private purchasers. This is no small surprise, given the tremendous budget problems across the country, and the pressure to cut health care costs while improving safety and patient health. Unfortunately, the field of research to show exactly how to do this well is slim at best. Comments from the current and potential users of MONAHRQ, combined with – and sometimes reflected against – the lessons from the research sources reviewed for this paper give some insight for next steps.
At this point, the single most leading-edge attribute of MONAHRQ is based on AHRQ’s commitment to keep improving the software tool and its output. As research and lessons evolve and improve, so will MONAHRQ.
In the meantime, based on the information reviewed for this report and the practical experience of the author in working with communities and states in public reporting, the following actions rise to the surface as the top priority:
Be clear that consumers are the primary audience, and design the website interface with them in mind. This means conducting or assessing research to define the topics that matter most to consumers. Present the quality and cost improvement information in that context, rather than spinning wheels trying to tell consumers why they should care about quality. Start with what they do care about and attach quality to that.
Approach this with frameworks and icons that have been tested with consumers, along with everyday language that most people easily understand. Be a leader by example to use text that is no more than 8th grade level (10th at most – even that will be a challenge). When the website has been developed, test it with consumers. Ask them, listen and adapt the website to reflect their interests and views.
Structure the website to enable providers, analysts and researchers to drill down to get to more technical views of the information provided to consumers. Structure sections of the website that present results or tables that are clearly valued by analysts and other State and community leaders. To the degree possible enable customization to meet user needs as specified in this report; however, approach this with extreme caution in areas where standardization is important (e.g., measure specifications, icons and wording based on consumer research).
Develop support materials for MONAHRQ users that explain the overall strategy and approach to the MONAHRQ website, to help users understand the thinking behind the tool (to help with the ‘if you are inclined to customize, proceed with caution’ message). This should include key messages, template materials and suggestions for how the MONAHRQ users can promote their report to engage consumers and increase uptake of the report. Document who is using MONAHRQ and use those stories to show (and create!) momentum.
Work with key partners to capitalize on this historic time when the National Quality Strategy from HHS will set the stage for improved coordination across national, state

Final Report (Public) MONAHRQ Improvement Report January 31, 2011
38
and community measurement and reporting efforts. Build into the MONAHRQ framework the Triple Aims of better care, more affordable care, and improved health of individuals and communities. Collaborate with the National Quality Forum to keep MONAHRQ on the leading edge of NQF-endorsed measures that will be recommended to HHS for use in reporting requirements and payment reform, national frameworks and e-measures that will be increasingly important as electronic data sources expand due to growth in state information exchanges and health information technology.
Anyone who uses MONAHRQ should be able to do so with confidence that the tool reflects the leading edge of national policy and research regarding the most effective measurement and public reporting. Using MONAHRQ should also mean that the region is well-positioned for satisfying national requirements for reporting and payment incentives. Potential areas of research and coordination could include measures for meaningful use, Medicaid and those associated with payment incentives as recommended by NQF.
The current and future value of MONAHRQ is clear. No one else has created a resource like this that is and will continue to be available in the public domain, with a sustained commitment to improvement over time. With MONAHRQ, there is no reason that every community in every state in the country shouldn’t have a public report that helps consumers compare key aspects of hospital care and other elements of the health care system.

Final Report (Public) MONAHRQ Improvement Report January 31, 2011
39
Attachment 1: Brief Profiles of Reporting Status in Selected States
The following descriptions are summaries gleaned from informal comments made during the interviews about MONAHRQ and its current and potential future functionality. These snapshots are provided as context to consider when reviewing input from the interviewees; however, please note that neither research nor verification were conducted to confirm whether the information below is accurate or complete.
Arkansas Department of Health (AR)
Produce a public report at the statewide level, with private reports to hospitals on utilization. They are thinking of following Hawaii’s lead by showing only county maps so people can see and realize "Hey, there is information out there!"
State law prohibits releasing hospital-specific information to the public; however, the State legislature is interested in HAI reporting.
California Office of Statewide Health Planning & Development (CA)
They are working on preparing AHRQ Quality Indicators for reporting but might use MONARHQ instead or at least in parallel.
Since 1999, the State has mandated the production of nine risk-adjusted outcome measures (volume, utilization) and mandates public reports on CABG surgery by surgeon (every other year) and hospital (annual).
They already produce a lot of quality-related information: 15 AHRQ volume, utilization, and quality measures; hospital data (patient-level data, emergency department); ambulatory surgery centers; financial data (hospital, long term care, clinics); utilization data (in Excel pivot tables); and discharges.
These reports are used by a technical, research-focused audience including providers, but not by the public or consumers. They are not trying to be all things to all people. They have changed their reports over the years to “move up the value chain” starting with reports for the public but now they focus on technical audiences. They started to run MONAHRQ to conduct an internal comparison but found that they don't have staffing or time available right now, so it's in limbo.
State law requires public reporting.
e-Health Connecticut (CT) - CVE
They provided reports using 2007 HEDIS / administrative data to providers at the patient-level, pulled from five large payers. These were private, secure log-in quality reports for 3,700 individual providers in CT using eight measures. The project was funded by health plans. Currently, the effort is stalled as people wait to see which organization (e-health CT, CT DOH or CT Hospital Association [CHIME]) emerges as "the” trusted source for public reporting. One of the challenges in CT is a difficult political landscape.
Hawaii Health Information Corporation (HI)
They currently use MONAHRQ for public reporting information that is not hospital specific. The HHIC was formed in 1994 by stakeholders (hospitals, HI medical

Final Report (Public) MONAHRQ Improvement Report January 31, 2011
40
association, Kaiser, and BlueCross BlueShield).Their data suppliers prohibit use of the data to name individual hospitals in the public reports. The HHIC business obligation is to their paying members, and the commitment to the public is implicit. “Our goal is to get the public to come to our website".
There is no State mandate for public reporting.
Massachusetts Healthcare for All (MA) – consumer group
They are a statewide consumer advocacy organization, with all volunteer staff. In Massachusetts, “My HC Options” ( http://hcqcc.hcf.state.ma.us) is the website where people go for hospital reporting. Also, the local CVE, MA Health Quality Partners (www.mhqp.org), just started with ambulatory care reporting. “I have no family who've been in the hospital so haven't used hospital reporting sites. Those who do use such sites haven't found them easy to use. This is a challenge for all reports."
Maryland Healthcare Commission (MD)
Maryland has a rate setting commission for hospital inpatient and outpatient care. The Maryland Healthcare Commission currently produces public reports on insurance, hospital Certificate of Need and electronic health record information, in addition to cost and quality for hospital and other health care sectors (e.g., physician spending and utilization), medical homes, and the health expenditure account.
They have been reporting on hospitals since 2002. It evolved from CMS measures to include all patients beyond Medicare. They receive the MD data from the IOWA Foundation for Medical Care warehouse. They do not see it as competing with what could be done with MONAHRQ. They would like to integrate CMS quality measures with information from IOWA warehouse.
There is a State legislative mandate to publicly report on hospitals.
Greater Detroit Area Health Council (MI) - CVE
GDAHC currently reports on ambulatory quality (process measures) and low-back pain (efficiency/cost). They also share Leapfrog data and have recently achieved more meaningful reporting efforts. "We would sign up with MONAHRQ tomorrow but in the process we need to work with the Michigan Hospital Association as they have control over access to the hospital data." GDAHC gets some hospital results from Leapfrog and have a contract with WebMD to provide their website. They are currently considering using a new website vendor because the WebMD contract ends in March.
New Mexico Department of Health (NM)
They report on quality and utilization and just went live with a website with indicator-based content (//ibis.health.state.nm.us). It doesn’t yet include ambulatory care and emergency department information. For their hospital inpatient reporting they’d like to add a query module like in MONAHRQ. They just received a grant for NM Health Information Collaborative to address health care disparities by race and ethnicity, with the primary audience for that effort being consumers. Currently they create separate websites for different views.
Final Report (Public) MONAHRQ Improvement Report January 31, 2011
41
There is a State mandate that the DOH reports on emergency departments and that the NM Health Policy Commission reports hospital inpatient discharge data at the county level and by MDC category. The statute does not allow hospital- or provider-identifiers in the public reporting, but recently the statute was changed to allow DOH to access record-level data.
Nevada Partnership for Value-Driven Healthcare (NV) - CVE
The Center for Health Information Analysis at UNLV created the MONAHRQ site. HealthInsight is the Quality Improvement Organization for Nevada, Utah and New Mexico. They create rankings based on CMS Hospital Compare dataset to create those national rankings. They tried to create similar physician rankings "but ran into snags." They would like to use MONAHRQ to show what the State or University of Nevada at Las Vegas cannot as Health Insight may be more nimble and less political. They don’t have a funding stream for this kind of reporting, so they are very pleased to have MONAHRQ.
There are State mandates on public reporting of data.
Oklahoma Department of Health (OK)
They don’t yet have a public website, and only have three people in the division dealing with public reporting. They’ve decided to devote an entire workstation to MONAHRQ. They recently tried to install MONAHRQ but had technical problems with the script. They have a lot of ideas, and have high quality data (<2% error rate), but they lack resources. “We latched onto MONAHRQ as quickly as possible.”
There is a State mandate to report publicly (utilization statistics by statewide, by county and region, plus patient safety indicators by hospital).
Oregon Quality Corporation, Q-Corp (OR) – CVE
Q-Corp publicly reports a subset of the CMS Hospital Compare measures, some HCUP measures, plus ambulatory measures using claims data. The OR State Office of Policy and Research reports hospital discharge data but it’s not very informative because it’s buried in thei website, and is hard to find and use. Currently the OR Hospital Association gives data to the State, and may give it to Q-Corp in the future.
There is a State mandate to report race /ethnicity and discharge data for ASCs and hospitals.
York County Libraries (PA) – consumer
The local CVE is the South Central Pennsylvania Aligning Forces for Quality collaborative (www.aligningforhealthpa.org/communitycheckup.aspx) which just added hospital data to their website. There are only four hospitals in the region, so people primarily go to hospitals dictated by their health plans.
Utah Partnership for Value-Driven Healthcare (UT) - CVE
They produce a hospital comparison report, with prevention indicators, which is now available fto the public. There are four basic reports with indicators that fit what

Final Report (Public) MONAHRQ Improvement Report January 31, 2011
42
consumers are interested in (heart/stroke, maternity / newborn; knee surgery; pneumonia).
The process to produce the reports now is “ugly” and they want to make it more efficient.
The UT Department of Health plans to replace their current reporting with MONAHRQ and the Utah CVE doesn't want to duplicate that work, but they will crosslink.
The Utah Office of Health Statistics and the Utah Department of Health (DOH) have a long history of reporting on cost. The Utah CVE is very focused on reporting for consumers and would like to take the analytic results from MONAHRQ and plug it into a consumer site being developed by WOWZA. It’s scheduled to be up in early 2011, showing quality and satisfaction data (hospitals and health plans). They will add utilization later, clinic-level reporting in July, and individual-level private reports to providers.
The Utah CVE is run by HealthInsight (QIO in UT, NV & NM) and they’ve installed MONAHRQ to run the indicators against data they receive from the UT DOH.
There is a State mandate for hospital reporting (quality, cost, safety) using nationally recognized indicators.
Virginia Health Information (VA)
VHI produces health information for many departments in VA state government. For fifteen years, they’ve been reporting on hospitals, health plans, physicians, nursing facilities, assisted living, and ambulatory surgery centers, using customized, homegrown systems. “Once there is local buy-in, it’s hard to change due to investment in legacy system.”
VHI uses NQF-endorsed measures, which duplicates some of MONAHRQ’s content. There are a number of NQF-endorsed measures in MONAHRQ that they want to add to their report. VHI buys the data and it's very expensive, so hesitancy to make the information public is "more about the business model than any problem with transparency."
There is a State legislative mandate for health care public reporting on quality and cost on all providers. VHI holds the contract with DOH to do this.

Final Report (Public) MONAHRQ Improvement Report January 31, 2011
43
Attachment 2: Short-term Suggestions for Potential Changes to MONAHRQ v1.0 based on User Interviews (sent to AHRQ November 2010)
Home page
Is it possible to customize the colors of the website and add the organization’s logo so it can be made to blend in with the rest of the organization’s web-presence? This is a big deal to a few organizations who have strict rules for branding (color, overall appearance) for any websites they produce.
Photos on the home page should tell you what the words mean. A couple of people didn’t like the photo for the consumer part of the website in particular.
Hosp Quality Ratings (for public) http://monahrq.net/Demos/11052010/Quality.html?op=0
Clarity needed for the following topic names:
1. Non-surgical
2. Surgical
3. Surgical and non-surgical (if it’s not simply combining the two items above, what is it?)
4. Cerebrovascular (too long a word)
5. All mortality and readmissions (death is more understandable than mortality)
Change text on the “data now” button as no raw data is provided anywhere on this website. This is a very sensitive subject to some groups, as ‘data’ needs to be kept confidential. Consider: “see report” or “get report” or “go”
Unclear that if you click on the measure title that it will sort the results for that measure. Maybe add tiny text that says “sort” with a hyperlink? Or make the sort arrow always there to indicate it?
For the icons: Hibbard and Sofaer have tested icons and came up with these three with the words “above” “average” and “below” in the icon. Here’s one example of it being put to use (with minor modification).

Final Report (Public) MONAHRQ Improvement Report January 31, 2011
44
For results with tight distribution, add a sentence to describe that sometimes there isn’t much of a distinction because all hospitals are doing about the same in this area. (something like that) It is understood that consumers will want to see the color-coded distinction, but hospitals may not like it.
For “not enough data” maybe add a line at the end of the chart (or where the icon box is?) that explains why there might not be enough data, e.g., could be a specialty hospital that rarely or never provides that kind of care
Overall, use the www.plainlanguage.gov and talkingquality websites to get ideas for making the consumer portion of the website easier to understand
Utilization Statistics http://monahrq.net/Demos/11052010/Utilization.html?op=0
On tab names: unclear what the difference is between “all combined” and “all patients”. Suggest “All combined” should be “All hospitals” and then keep “all patients”
Add a short description of “CSS”. Or change the tab to be consistent with the “MDC/DRG” tab, such as “Diagnosis/Procedure” (may be too long for a tab)