Monaco SUMO Tra c (MoST) Scenario: A 3D Mobility Scenario ...
13
Engineering EPiC Series in Engineering Volume 2, 2018, Pages 43–55 SUMO 2018- Simulating Autonomous and Intermodal Transport Systems Monaco SUMO Traffic (MoST) Scenario: A 3D Mobility Scenario for Cooperative ITS Lara CODEC ´ A 1 and J´ erˆ ome H ¨ ARRI 1 EURECOM - Communication Systems Department 06904 Sophia-Antipolis, France [codeca, haerri]@eurecom.fr Abstract Cooperative Intelligent Transportation Systems (C-ITS) are a viable solution when it comes to the optimization of the ever-growing population moving in the cities. C-ITS studies have to deal with telecommunications issues and location errors due to the urban environment, while keeping into account realistic mobility patterns. A detailed and state of the art scenario is complex to generate and validate. There is a trade-off between precision and scalability. Additionally, precise information may be problematic to obtain or use due to privacy issues. There are some general-purpose freely-available scenarios, but none of them provides a 3D environment with intermodal traffic. Nonetheless, the 3D environment is a requirement to have reliable C-ITS simulations in a realistic setting, and the importance of intermodal mobility cannot be overlooked in planning the future of smart cities. The Monaco SUMO Traffic (MoST) Scenario aims to provide a state of the art 3D playground with various kind of vehicles, vulnerable road users and public transports to test C-ITS solutions. This paper presents the data requirements, characteristics, possible use cases, and finally, the limitations of MoST Scenario. Keywords 3D Traffic Scenario, Intermodal Transport Planning, Cooperative Intelligent Transportation Systems 1 Introduction Our cities are complex systems in constant evolution. The information that is collected from various sources is enhancing our view and understanding of their dynamics. C-ITS are using mobility information from vehicles and vulnerable road users to improve traffic and the quality of life in the cities and their surroundings. This objective requires understanding not only of traffic flows theory and telecommunications, but also human behavior and social interactions. We are always looking for methods and tools to test theories and develop state of the art C-ITS protocols and applications, improving road traffic, safety, and security. Mobility patterns influence telecommunications in a critical way and they must be evaluated together to provide realistic and robust solutions. A simulation environment capable of providing an interactive smart city scenario has limitations and requirements coming from both mobility and E. Wießner, L. L¨ ucken, R. Hilbrich, Y.-P. Fl¨otter¨od, J. Erdmann, L. Bieker-Walz and M. Behrisch (eds.), SUMO2018 (EPiC Series in Engineering, vol. 2), pp. 43–55
Transcript of Monaco SUMO Tra c (MoST) Scenario: A 3D Mobility Scenario ...

EngineeringEPiC Series in Engineering
Volume 2, 2018, Pages 43–55
SUMO 2018- Simulating Autonomousand Intermodal Transport Systems
Monaco SUMO Traffic (MoST) Scenario:
A 3D Mobility Scenario for Cooperative ITS
Lara CODECA1 and Jerome HARRI1
EURECOM - Communication Systems Department06904 Sophia-Antipolis, France[codeca, haerri]@eurecom.fr
Abstract
Cooperative Intelligent Transportation Systems (C-ITS) are a viable solution when itcomes to the optimization of the ever-growing population moving in the cities. C-ITSstudies have to deal with telecommunications issues and location errors due to the urbanenvironment, while keeping into account realistic mobility patterns. A detailed and stateof the art scenario is complex to generate and validate. There is a trade-off betweenprecision and scalability. Additionally, precise information may be problematic to obtainor use due to privacy issues. There are some general-purpose freely-available scenarios,but none of them provides a 3D environment with intermodal traffic. Nonetheless, the 3Denvironment is a requirement to have reliable C-ITS simulations in a realistic setting, andthe importance of intermodal mobility cannot be overlooked in planning the future of smartcities. The Monaco SUMO Traffic (MoST) Scenario aims to provide a state of the art 3Dplayground with various kind of vehicles, vulnerable road users and public transports totest C-ITS solutions. This paper presents the data requirements, characteristics, possibleuse cases, and finally, the limitations of MoST Scenario.
Keywords 3D Traffic Scenario, Intermodal Transport Planning, Cooperative IntelligentTransportation Systems
1 Introduction
Our cities are complex systems in constant evolution. The information that is collected fromvarious sources is enhancing our view and understanding of their dynamics. C-ITS are usingmobility information from vehicles and vulnerable road users to improve traffic and the qualityof life in the cities and their surroundings. This objective requires understanding not only oftraffic flows theory and telecommunications, but also human behavior and social interactions.
We are always looking for methods and tools to test theories and develop state of theart C-ITS protocols and applications, improving road traffic, safety, and security. Mobilitypatterns influence telecommunications in a critical way and they must be evaluated togetherto provide realistic and robust solutions. A simulation environment capable of providing aninteractive smart city scenario has limitations and requirements coming from both mobility and
E. Wießner, L. Lucken, R. Hilbrich, Y.-P. Flotterod, J. Erdmann, L. Bieker-Walz and M. Behrisch (eds.),SUMO2018 (EPiC Series in Engineering, vol. 2), pp. 43–55

Monaco SUMO Traffic Scenario Codeca and Harri
telecommunication simulators, and their possible interaction. In literature we can find surveyssuch as [1] and [2] that are able to provide a good overview on the different mobility and networksimulators available to the scientific community, with their pros and cons, depending on thetask at hand.
To appeal at the largest audience, we chose Simulator of Urban MObiltiy (SUMO) [3] asmobility simulator because its community is very active on Intelligent Transportation Systems(ITS) topics and it provides a socket interface that allows easy communication with other sim-ulators. For example, OMNet++ and NS3 are network simulators widely used in the VehicularAd Hoc Network (VANET) community, and they both can be interfaced with SUMO usingrespectively Vehicles in Network Simulation (VEINS) [4] and iTETRIS [5].
1.1 C-ITS Requirements
An interactive mobility scenario for C-ITS has to provide a complete playground that inte-grates different aspects. We need a multidimensional environment to work on geo-location andtelecommunication aspects. It has to be highly populated, with congested traffic patterns towork on alternative and intermodal mobility optimizations. Last but not least, it has to bescalable and controllable.
An environment able to provide all the above-mentioned features is the Principality ofMonaco. The city itself covers an area of 2 km2 and the greater area (composed of Frenchcities adjacent to Monaco) is about 70 km2. The size of the city provides a small and morecontrollable environment, reasonable to model with a microscopic mobility simulator.
Some of the reasons why this kind of interactive mobility playground is important, areavailable at [6], but here we will discuss them further, explaining how the MoST Scenario isimplemented and can be used.
Mobility Traffic patterns in Monaco follow the typical behavior seen in many Europeancapitals. Most of the people that work in the city are commuters and they live in the greaterarea, for both economical and logistic reasons. In the morning, there is a directional trafficcongestion converging to city, and during the evening, the city experience a congested trafficoutflow. Monaco is a well-organized city. In order to accommodate all the commuters, itprovides many parking areas with a fairly developed public transports network. Nonetheless,the infrastructures in place are not able to alleviate traffic congestion during rush hours. Hence,Monaco city presents a perfect playground to study city-scale advanced parking managementsolutions, intermodal and alternative transport modes applications.
Territory Monaco is built on the mountains’ slope, facing the Mediterranean sea. Likemany coastal cities close to a mountain region, it has a layered topology full of tunnels andbridges. These features present a multidimensional environment more realistic compared to aflat surface. This kind of topology allows the study of precise positioning and three-dimensionalpropagation models, and their impact on C-ITS. Additionally, these multidimensional features,in conjunction with realistic emission models, can be useful in studying eco-routing based ondifferent factors, such as energy consumption and/or environmental impact.
Pedestrians Tourism in Monaco is an important source of revenue. On top of the pedestriancommuters that are headed to work, there are waves of tourists that reach the city mainly bytour buses and public transports. A large scale mobility scenario able to integrate vulnerableusers, can be locally coupled with specific crowds and multi-agents simulators (e.g.: Menge
44

Monaco SUMO Traffic Scenario Codeca and Harri
Crowd Simulator [7]), that given their complexity, would not be otherwise scalable over anentire city.
In the following sections, we are going to provide detailed information on the MoST Scenario,its features, possible use cases, and the road ahead, with the future work. The MoST Scenariois freely available to the community under GPLv3 license. It can be downloaded fromhttps://github.com/lcodeca/MoSTScenario.
2 Related Works
Discussing the state of the art on the mobility scenarios, we decided to focus only on the oneavailable for SUMO.
Cologne One of the most cited mobility scenario for sumo is the TAPAS Cologne [8] Scenario,which includes road networks imported from OpenStreetMap (OSM) and two possible trafficdemands: one from 6:00 to 8:00 in the morning, and the other over 24 hours. Unfortunately,this scenario is cumbersome and requires additional work to improve the network quality, toverify how routes are mapped onto both the network and the traffic demand. Additionally,the buildings definition is not meant for a network simulator, making it not directly usable inC-ITS simulations.
Bologna A realistic traffic scenario from the city of Bologna [9, 10], and built in the iTETRIS[5] framework, provides a very good starting point for the community, but it has some limita-tions. The traffic demand is only defined over one hour, and the size of the scenario, which isrelatively small, provides only one neighborhood. In this setting, the elevation does not matter,given that the modeled area is flat.
Austria On a completely different scale, the ITS Austria West scenario [11] presents a reallife traffic monitoring system that uses a mesoscopic version of SUMO [12]. This scenario is avery good example of the effort required to build and maintain a large scale traffic scenario. Theproject monitors an infrastructure with around 245,000 nodes and 320,000 edges with a totallength of 27,000 km. They have five different traffic information sources providing floating cardata and a traffic demand model for the simulation of 1.2 million routes and 1.6 million vehicles.Unfortunately this scenario is not freely available to the community as it relies on proprietaryinformation. Nonetheless, it is a very good example of the performances capabilities of SUMO.
Luxembourg From the country of Luxembourg two possible scenarios are available. VehiLux[13] is a general purpose scenario that presents the same issues as TAPAS Cologne. Additionally,the scenario has been discontinued. More recently, the Luxembourg SUMO Traffic (LuST)Scenario [14] has been created with the focus on C-ITS and telecommunications. The LuSTScenario is based on the same tools and sources of information used by VehiLux, but it has beenfine tuned and hand-checked in order to provide realistic and reliable data. And finally, themobility has been enhanced and validated. Although this scenario is widely used in VANETsimulations, it does not provide any elevation information and the multimodal capabilities areonly partial, focusing only on vehicles and not pedestrians.
45

Monaco SUMO Traffic Scenario Codeca and Harri
At the best of our knowledge, MoST Scenario is the first freely-available mobility scenariowith elevation information for streets and buildings, and fully functional intermodal mobilityfor pedestrian.
3 Monaco SUMO Traffic Scenario Features
The initial dataset is extracted from OSM and it provides many of the data required to buildthe scenario. OSM is a collection of crowd-sourced information and the accuracy is not alwaysconsistent [15]. A more detailed version of the geographical information is extracted from theInstitut Geographique National (IGN)1 BD TOPO R© database under the ISNPIRE licence2.Here we can find detailed data concerning altitude and the land registry. This informationis integrated with the street topology and the Points Of Interest (POIs) dataset to obtain areliable multidimensional model of the city.
This initial dataset is then integrated and refined using data provided by public websitesfrom the Monaco and France. Public transports are gathered from OSM, Compagnie desAutobus de Monaco (CAM)3, and Provence-Alpes-Cote d’Azur (PACA) Mobilite4, where itcan be found location and schedule for buses and trains, and the location of the electric bicyclestations with their availability.
In the data extracted from OSM we find the location of parking lots, train stations, bus stops,taxi stands, and bicycle sharing points; these POIs will be used to build the main infrastructurefor multimodality and public transportation. The location of additional POIs (e.g.: museums,tourist attractions and parks, shops and restaurants, offices and facilities, and schools) is usedto improve the realism of the activity-based mobility we are going to generate. The MonacoParking website5 provides location, capacity, schedule, prices and availability for many of theparking lots in the city.
Total Area 73.64 km2
Edges length 587,452.37 mEdges with 1 lane 653Edges with 2 lanes 2,935Edges with 3 lanes 661
Total Junctions 4,667Priority 487
Traffic Light 831Roundabouts 24
Motorway 16,817.64 m (5,458.85 m)Primary 44,824.26 m (4,665.59 m)
Secondary 90,782.24 m (5,778.83 m)Tertiary 67,571.56 m (2,787.15 m)Service 3,789.67 m
Residential 278,468.31 m
Pedestrian 21,867.88 mSteps 17,946.28 m
Railway 26,694.11 m
Table 1: MoST Scenario network topology.
3.1 Network Topology
The above-mentioned information have been processed and merged in an OSM-like file in orderto be handled with tools such as JOSM [16] and netconvert [17]. In Table 1 we present a sum-mary of the static network information. The MoST Scenario covers an area of approximatively
1https://geoservices.ign.fr2Since May 9, 2011, the INSPIRE directive requires the release of data for research purposes, in accordance
with the requirements of the CE Regulation n 976/20093http://cam.mc4https://www.pacamobilite.fr5https://monaco-parking.mc
46

Monaco SUMO Traffic Scenario Codeca and Harri
73 km2, it includes all the road types from motorway to residential, and model both pedestrianpaths and stairways (steps).
Intersections In order to have a working SUMO simulation, the intersections were checkedmanually for correctness using an iterative process with JOSM, netconvert and SUMO toensure that they did not represent an unrealistic bottleneck for the traffic flows. Additionally,the default size for roads and sidewalks had to be reduced in order to be closer to reality.Concerning the tunnels, we introduced new categories in OSM in order to tag them and importthem in SUMO. Even if this information is not important for SUMO, it is very important forthe telecommunication simulator.
In the Principality of Monaco the vast majority of intersections is priority based, with alimited number of Traffic Light Systems (TLS) in place. Nonetheless, in the scenario it has beennecessary to regulate most of the intersections with a TLS to simulate a more realistic interactionbetween pedestrian and vehicles. In SUMO, vehicles always stop to let the pedestrians waitingat the zebra crossroad to pass, creating unrealistic congestion when it comes to dense scenarios.In reality, there will be a mutual understanding between vehicles and pedestrians, and theircrossing will happen in waves. In simulation, this behavior is better modeled with a TLSregulated intersection.
Figure 1: Traffic Assignment Zones (TAZ) col-ored by areas.
Figure 2: MoST Scenario road topology col-ored by priority.
Areas The MoST Scenario is divided in various Traffic Assignment Zone (TAZ)6, and theycoincide with the administrative boundaries of the territory in question. In Figure 1 all theTAZ are numbered and they are colored by logical areas (from 1 to 3). The reference for theTAZ enumeration is in Table 2. Area 1 is the Principality of Monaco, Area 2 is composedby the French villages on the border, and Area 3 is composed by the French villages furtheraway. Figure 2 shows the topology of MoST Scenario with the streets colored by priority. Forexample, the motorway (in blue) runs in the outskirts of the urban area, and the railway (inwhite) goes through all the villages, following the coastline.
6In this context, a traffic assignment zone is a geographical area used to model the traffic patterns and thetraffic demand.
47

Monaco SUMO Traffic Scenario Codeca and Harri
Based on Figures 1 and 2 we can discuss and understand the topology in detail. In Area 1we find the Principality of Monaco, with all its neighborhoods. In Table 2 it is possible to findthe number of Points of Interest (PoIs) extracted from the datasets associated with each TAZand the area it covers. In Area 2 we find the French villages on the border with Monaco. Areas1 and 2 are the most detailed and close to reality. Area 3 is fundamental to model the trafficpatterns in in the area, but its level of detail is limited. Only the main roads are representedto allow the correct inflow (outflow) to (from) the inner areas and the proper definition of thepublic transports. In both Areas 1 and 2 we can find the pedestrian areas, but the stairwaysdefinition can be found mainly in Area 1.
Area TAZ TAZ Name PoIs Area [m2]
1 1 Monaco 21,150 3,150,797
1 2 Sainte Devote 296 29,6961 3 Les Monegetti 1,482 137,4581 4 Jardin Exotique 2,492 304,7801 5 Monte Carlo 5,303 568,8481 6 Larvotto 1,243 385,0321 7 La Rousse 2,968 263,3331 8 La Condamine 2,072 589,8461 9 Monaco Ville 1,627 242,8371 10 Fontvieille 2,302 438,647
2 11 La Turbie 36,039 10,457,1352 12 Cap d’Ail 15,831 2,905,4702 13 Beausoleil 27,372 3,711,4302 14 Roquebrune 51,991 13,046,118
3 15 Peille 6,158 12,554,6843 16 La Trinite 3,734 4,229,1123 17 Eze 12,839 5,388,2253 18 Sainte Agnes 605 278,6273 19 Gorbio 5,576 4,215,2473 20 Menton 4,472 1,928,595
Table 2: TAZ definition and weights.
Public Transports Public transports and parking lots are defined for the entire scenario.This allows to model the intermodal traffic in detail, following the P+R (Park and Ride)paradigm already available in many cities. In the MoST Scenario we have 176 bus stopscovered by 24 routes, and 12 train stations, covered by 2 routes. The coverage of the publictransports is shown in Figure 3, in red. It is easy to notice that only the coastline is served bypublic transports, and this is a well-known issue in this area. In the scenario we defined 131parking lots, and for each of them, we computed which are the three closest alternatives in casea parking lot is full.
3D Environment The multidimensional environment in which we live heavily influence dailydecisions. For example, hybrid and electric vehicles are getting more common in our cities: it is
48

Monaco SUMO Traffic Scenario Codeca and Harri
Figure 3: Public Transports coverage (in red).Figure 4: Network topology colored by eleva-tion.
common knowledge that they reduce the pollution and help us save money on fuel. Nonetheless,it is complicated to find a study on the efficiency of hybrid (or electric) vehicles when it comesto city with mountain-like elevation and slopes. Additionally, when it comes to smart andinterconnected cities planning, telecommunications tend to be a given. In the study of C-ITS,it is well known that elevation, slopes and obstacles pose challenging issues that are complicatedto study in simulation, due to models complexity and lack of data. For these reasons, in theMoST Scenario there are about 15,000 buildings with their shape and elevation, 96 bridgesand a total of 74 tunnels. The elevation map has been extracted from BD TOPO R© database,and averaged out in the tunnels and where the information was missing. Figure 4 shows theelevation of the streets in the scenario. As expected, streets near the coast are at sea-level, butthe slope change rapidly from 0 to 600 meters.
3.2 Traffic Demand
The MoST Scenario provides, by default, a mobility for the morning rush hour. The trafficpatterns are characterized by inbound traffic congestion directed to the Principality of Monaco.Due to the lack of live traffic data and real traffic counters, we generated a synthetic trafficdemand based on statistical information on the population, and a simplified activity-basedmobility generation model [18].
We identified the TAZ as shown in Table 2, and in order to compute their absolute weight,we divided the number of PoIs (4th column) by the area (5th column) in question. The Origin-Destination (OD) matrices are defined over the three areas and for each different type of trans-port. For example, it can be defined such as 2500 trucks from Area 3 to Area 1; hence, the realweight of a TAZ must be normalized in the pool of origin (or destination) area in question.
Figure 5 shows the traffic demand over the morning, divided by type of vehicles. This trafficdemand of 20,000 entities has been generated as a normal distribution with mean around 08h15AM and a standard deviation of 1 hour and 30 minutes. Figure 6 shows the summarized resultof the SUMO simulation. The relative speed is computed taking into account the maximumspeed allowed on the streets. The waiting time is defined as the amount of time in which thevehicles are slower than 0.1 m/s. Analyzing the graphs in Figure 6 with the running vehicles (1st
graph) and the mean relative speed (3st graph), it is observable that the scenario is congested,but given that there are virtually no waiting vehicles (2nd graph), the scenario is not saturated.
49

Monaco SUMO Traffic Scenario Codeca and Harri
Figure 5: Traffic Demand by vTypes. Figure 6: Simulation results summary.
(a) Route length distribution. (b) Time lost distribution.
Figure 7: Route length and time loss distribution of all the vehicles in the simulation.
Figure 7 shows route length and time loss distribution of all the vehicles in the simulation.More precisely, the distribution of the route length is shown in Figure 7(a). where the two bellsshaped curve represents the traffic internal to the Principality of Monaco (less than 5 km) andthe traffic coming from France (Area 2 and 3). The distribution of the time lost by each vehicleis presented in Figure 7(b). Here we can notice that the vast majority of the vehicles has toendure delays due to the traffic congestion that are shorter than 20 minutes.
Figure 8 shows the impact of intermodal mobility for pedestrians. More precisely, Figure8(a) shows the route length distribution for the walking part of the trip. The majority of thepedestrian are able to reach their destination walking less than 1 km. Note that a share of thepedestrians moving inside the city were purposefully not allowed to use public transports, torepresent tourists moving around in the Principality of Monaco. The route length distributionof the part of the trip spent riding public transports is presented in Figure 8(b). Here wecan notice a spike in the shorter distances (less than 2.5km), and it coincides with the publictransports inside the Principality of Monaco itself. This is partially an artifact of the simulation,but reflect the lack of public transport routes away from the coastline. Finally, Figure 8 showsthe distribution of the time spent at the stop waiting for the public transports. In this specificscenario, we decided to schedule the public transports with a frequency of 15 minutes to better
50
Monaco SUMO Traffic Scenario Codeca and Harri
(a) Walking length distribution. (b) Route length distribution of thepublic transport rides.
(c) Public transports waiting timedistribution.
Figure 8: Route length distribution and average speed distribution of all the vehicles in thesimulation.
represent the morning rush hour timetable. This decision is reflected in the distribution of thewaiting time, where the vast majority of the people has to wait less than 15 minutes.
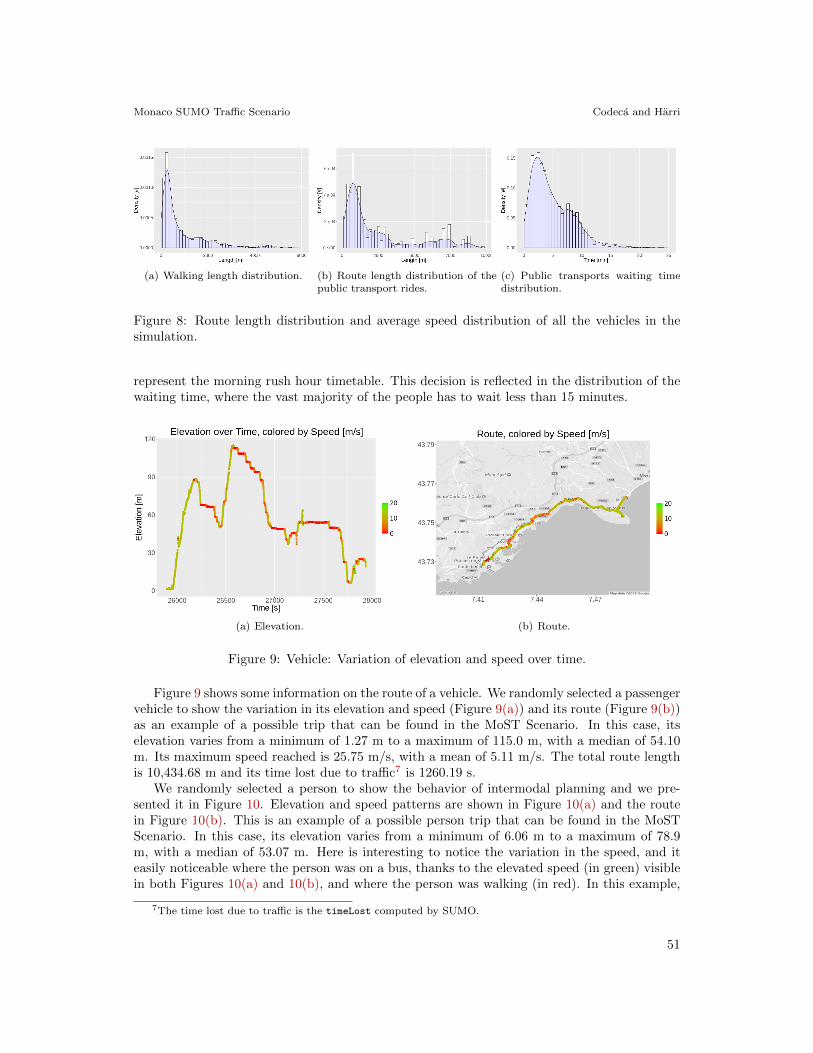
(a) Elevation. (b) Route.
Figure 9: Vehicle: Variation of elevation and speed over time.
Figure 9 shows some information on the route of a vehicle. We randomly selected a passengervehicle to show the variation in its elevation and speed (Figure 9(a)) and its route (Figure 9(b))as an example of a possible trip that can be found in the MoST Scenario. In this case, itselevation varies from a minimum of 1.27 m to a maximum of 115.0 m, with a median of 54.10m. Its maximum speed reached is 25.75 m/s, with a mean of 5.11 m/s. The total route lengthis 10,434.68 m and its time lost due to traffic7 is 1260.19 s.
We randomly selected a person to show the behavior of intermodal planning and we pre-sented it in Figure 10. Elevation and speed patterns are shown in Figure 10(a) and the routein Figure 10(b). This is an example of a possible person trip that can be found in the MoSTScenario. In this case, its elevation varies from a minimum of 6.06 m to a maximum of 78.9m, with a median of 53.07 m. Here is interesting to notice the variation in the speed, and iteasily noticeable where the person was on a bus, thanks to the elevated speed (in green) visiblein both Figures 10(a) and 10(b), and where the person was walking (in red). In this example,
7The time lost due to traffic is the timeLost computed by SUMO.
51

Monaco SUMO Traffic Scenario Codeca and Harri
(a) Elevation. (b) Route.
Figure 10: Person: Variation of elevation and speed over time.
the person:
• walked 322.35 m,
• waited 270 s for the bus,
• rode it for 56 s (334.62 m)
• waited for another bus for 87 s
• rode it for 1339 s (4876.21 m)
• and finally walked for 240.5 m to reach the desired destination.
Figures 10 and 9 are meant to provide an example of what kind of trips are available in themobility provided by MoST Scenario. In the following section, we are going to discuss a toolmeant to easily generate other mobility traces.
3.3 Mobility Generator
Given the impossibility at the moment to validate the traffic mobility, we wanted to have andprovide a tool able to easily generate various traffic demands. Starting from a population andan OD definition, it generates the SUMO trip definition for the mobility. These definitionsshould be validated with duarouter, a tool provided by SUMO.
A snippet of traffic demand definition is shown in Listing 1. Starting from the populationsize (line 2), a percentage (line 5) of it is given to each vType or vTypeDistribution, and moreprecisely, it is divided among the OD defined (line 6, composition). This imply that the sumof all the perc (line 11 and 17) must be 1, and for each vType, the sum of all the percentages(line 5) must be 1. The possible options depend on the vehicle (or person) in question. Itis possible to have person trips based on public transports (line 14) or just walking (line 8).Concerning the vehicles, it is possible to set the destination to a parking lot, and keep themthere until the end of the simulation.
The range of vehicles (and persons) supported by this scenario is the one provided by SUMOand specified in Table 3.
Additionally, it is possible to define which percentage of the population comes from insidethe area covered by the scenario, and which percentage comes from specific gateways (usually
52

Monaco SUMO Traffic Scenario Codeca and Harri
. . .” populat ion ” : 20000 ,” d i s t r i b u t i o n ” : {
” pede s t r i an ” : {” percentage ” : 0 . 30 ,” compos it ion ” : {
”1” : {”withPT ” : f a l s e ,” from ” : ”Area1 ” ,” to ” : ”Area1 ” ,” perc ” : 0 . 3} ,
”2” : {”withPT ” : true ,” from ” : ”Area2 ” ,” to ” : ”Area1 ” ,” perc ” : 0 . 7
}} ,. . .
Listing 1: Simplified example of a trafficdemand definition.
vClass Description
evehicle Special vehicles withuser-defined characteristics.
bus Part ofrail public transports.
pedestrian Vulnerablebicycle road users.
motorcycle In the vTypeDistribution
moped for two-wheelers.
Normal vehiclespassenger (defined as vTypeDistribution
with five different types of vehicle).
emergencytaxi
coach In the vTypeDistribution
delivery for extra mobility.trucktrailer
Table 3: vType and vClasses definition.
motorways and/or external edges). Finally, the traffic demand must be defined over a timeinterval (defined in seconds) and the rush hour is defined specifying mean and standard deviationof a normal distribution.
4 Use Cases and Future Work
MoST is a general-purpose traffic scenario. Its aim is to be a simple and reliable tool tosupport scientific research. Our plan is to use it to work on intermodal mobility planning andoptimization, eco-routing for hybrid vehicles, parking optimization for P+R solutions and wewant to explore the impact of elevation on C-ITS.
(a) Simple, only three classes. (b) Larger standard deviation. (c) Smaller standard deviation.
Figure 11: Examples of various traffic demands.
Some examples of the traffic demands that can be generated with the tool discussed inSection 3.3 are shown in Figure 11. Figure 11(a) shows a traffic demand containing onlypedestrians, passenger vehicles and public transport. This kind of demands can be used tooptimize the presence of public transports and to study their impact on the traffic congestion.
53

Monaco SUMO Traffic Scenario Codeca and Harri
Figures 11(b) and 11(c) are an example of a traffic demand with different standard deviationsin the departure times. Given that the size of the population is still the same, this kind ofvariation in the traffic demand can be used to study the impact of varying the departure timeon the traffic congestion and travel times while respecting constraints (such as the arrival time).
This 3D intermodal traffic scenario is still in active development and the future work willbe driven by the community that is using it and their necessity.
The primary enhancement will focus on intermodal mobility integration. At the momentonly buses and trains are considered as public transports. In the future, we want to includetaxis and shared rides. Additionally, the only means of parking available at the moment arethe parking lots. We would like to find a reliable source for the location of car parks along theroad and integrate them in the scenario.
Another enhancement concerns the vulnerable road users and the integration of the two-wheelers in the traffic. The MoST Scenario is not bicycles friendly at the moment, and it is dueto lack of information. We decided to have pedestrians and cyclists share the pedestrian paths,but we would like to gather precise information to increase the realism. Additionally, we wantto work on the two-wheelers model to explore this option when it comes to intermodal traffic.
Last but not least, we are actively looking for real and precise traffic information fromthe area in order to generate and validate a realistic mobility that reflects the Principality ofMonaco and its surroundings.
5 Conclusions
We presented the Monaco SUMO Traffic (MoST) Scenario in details, starting with the datasetused in the generation, through the decisions made to have a scenario that works out of thebox, and finally we presented a tool to generate various traffic demands starting from the oneprovided. The MoST Scenario provides a state of the art 3D playground with various kindof vehicles, vulnerable road users and public transports to work on Cooperative IntelligentTransportation Systems (C-ITS) solutions.
The MoST Scenario covers an area of approximatively 70 km2, that includes three logicalareas and 20 Traffic Assignment Zone (TAZ). It provides the location of Points of Interest (PoIs),shape and location for the buildings, and elevation of buildings and streets. Public transportsare based on buses and trains, with more than 150 stops and more than 20 routes. The scenariois provided with mobility traces that represents a morning rush hour with intermodal traffic,and a tool is available to easily modify the traffic demand to obtain the desired traffic conditions.
The MoST Scenario is the first freely-available mobility scenario with elevation informationfor streets and buildings, and fully functional multimodal mobility for pedestrian. The scenariois available to the community under GPLv3 license, and it can be downloaded fromhttps://github.com/lcodeca/MoSTScenario.
Acknowledgements
This work was partially funded by the French Government (National Research Agency, ANR) through the“Investments for the Future”, ref. #ANR-11-LABX-0031-01. EURECOM acknowledges the support of itsindustrial members, namely BMW Group, IABG, Monaco Telecom, Orange, SAP, ST Microelectronics andSymantec.
54

Monaco SUMO Traffic Scenario Codeca and Harri
References
[1] Jeome Harri, Fethi Filali, and Christian Bonnet. Mobility models for vehicular ad hoc networks:a survey and taxonomy. Communications Surveys & Tutorials, IEEE, 11(4):19–41, 2009.
[2] Francisco J Martinez, Chai Keong Toh, Juan-Carlos Cano, Carlos T Calafate, and Pietro Manzoni.A survey and comparative study of simulators for vehicular ad hoc networks (VANETs). WirelessCommunications and Mobile Computing, 11(7):813–828, 2011.
[3] Daniel Krajzewicz, Jakob Erdmann, Michael Behrisch, and Laura Bieker. Recent Developmentand Applications of SUMO - Simulation of Urban MObility. International Journal On Advancesin Systems and Measurements, 5(3&4):128–138, December 2012.
[4] Christoph Sommer, Reinhard German, and Falko Dressler. Bidirectionally coupled network androad traffic simulation for improved IVC analysis. Mobile Computing, IEEE Transactions on,10(1):3–15, 2011.
[5] Daniel Krajzewicz, Robbin J Blokpoel, Fabio Cartolano, Pasquale Cataldi, Ainara Gonzalez, OscarLazaro, Jeremie Leguay, Lan Lin, Julen Maneros, and Michele Rondinone. iTETRIS - A Systemfor the Evaluation of Cooperative Traffic Management Solutions. In Advanced Microsystems forAutomotive Applications 2010, pages 399–410. Springer, 2010.
[6] Lara Codeca and Jerome Harri. Towards multimodal mobility simulation of C-ITS: The MonacoSUMO traffic scenario. In VNC 2017, IEEE Vehicular Networking Conference, Torino, ITALY,11 2017.
[7] Sean Curtis, Andrew Best, and Dinesh Manocha. Menge: A modular framework for simulatingcrowd movement. Collective Dynamics, 1:1–40, 2016.
[8] Sandesh Uppoor and Marco Fiore. Large-scale urban vehicular mobility for networking research.In Vehicular Networking Conference (VNC), 2011 IEEE, pages 62–69. IEEE, 2011.
[9] Laura Bieker, Daniel Krajzewicz, AntonioPio Morra, Carlo Michelacci, and Fabio Cartolano. Traf-fic simulation for all: a real world traffic scenario from the city of Bologna. In SUMO2014 -Modeling Mobility with Open Data. Deutsches Zentrum fur Luft- und Raumfahrt e.V. Institut furVerkehrssystemtechnik, 2014.
[10] Luca Bedogni, Marco Gramaglia, Andrea Vesco, Marco Fiore, Jerome Harri, and Francesco Fer-rero. The Bologna Ringway dataset: improving road network conversion in SUMO and validatingurban mobility via navigation services. Vehicular Technology, IEEE Transactions on, 64(12):5464–5476, 2015.
[11] Karl-Heinz Kastner and Petru Pau. Experiences with SUMO in a Real-Life Traffic MonitoringSystem. In SUMO2015 - Intermodal Simulation for Intermodal Transport. Deutsches Zentrum furLuft- und Raumfahrt e.V. Institut fur Verkehrssystemtechnik, 2015.
[12] MESO: mesoscopic version of SUMO. (Last access: March 2018).
[13] Agata Grzybek, Gregoire Danoy, and Pascal Bouvry. Generation of realistic traces for vehicularmobility simulations. In Proceedings of the second ACM international symposium on Design andanalysis of intelligent vehicular networks and applications, pages 131–138. ACM, 2012.
[14] Lara Codeca, Raphael Frank, Sebastien Faye, and Thomas Engel. Luxembourg SUMO Traffic(LuST) Scenario: Traffic Demand Evaluation. IEEE Intelligent Transportation Systems Magazine,9(2):52–63, 2017.
[15] Mordechai Haklay. How good is volunteered geographical information? A comparative study ofOpenStreetMap and Ordnance Survey datasets. Environment and planning. B, Planning & design,37(4):682, 2010.
[16] JOSM wiki page. https://josm.openstreetmap.de/. (Last access: March 2018).
[17] NETCONVERT wiki page. http://sumo.dlr.de/wiki/NETCONVERT. (Last access: March 2018).
[18] Michael Balmer, Kay Axhausen, and Kai Nagel. Agent-based demand-modeling framework forlarge-scale microsimulations. Transportation Research Record: Journal of the Transp. Res. Board,(1985):125–134, 2006.
55