
mome-wp1-0406-d11 state of interoperability
73
Monitoring and Measurement Cluster – 001990 Document Info Document Reference MOME-WP1-0406-D11_STATE_OF_INTEROPERABILITY Document Type Deliverable Deliverable Type Report Deliverable Status Submitted Delivery Date Contractual: 30/06/2004, Actual: 30/06/2004 Dissemination Level Public Editing Author Carsten Schmoll, FHG Contributing Author(s) Jürgen Quittek, NEC Antal Bulanza, ULB Sebastian Zander, Carsten Schmoll, FHG Michael Kundt, Elisa Boschi, FHG Jaroslaw Sliwinski, WUT Workpackage(s) WP1 D11 - State of Interoperability Abstract This deliverable documents a taxonomy for measurement and analysis tools classification. It also presents the most common standards in use for tools interaction and shows the applicability of these standards. A number of measurement and analysis tools have been reviewed, and the results of these reviews are documented. There are many other useful tools in this area, therefore tool reviews will be an ongoing process during the MOME project. The current results will build the starting set of information that MOME will put into its future online tools database. Keywords MOME, Deliverable D11, State of Interoperability, IST Projects, Measurement Taxonomy/Tools
Transcript of mome-wp1-0406-d11 state of interoperability
Monitoring and Measurement Cluster – 001990
Document Info
Document Reference MOME-WP1-0406-D11_STATE_OF_INTEROPERABILITY
Document Type Deliverable
Deliverable Type Report
Deliverable Status Submitted
Delivery Date Contractual: 30/06/2004, Actual: 30/06/2004
Dissemination Level Public
Editing Author Carsten Schmoll, FHG
Contributing Author(s) Jürgen Quittek, NEC
Antal Bulanza, ULB
Sebastian Zander, Carsten Schmoll, FHG
Michael Kundt, Elisa Boschi, FHG
Jaroslaw Sliwinski, WUT
Workpackage(s) WP1
D11 - State of Interoperability
Abstract
This deliverable documents a taxonomy for measurement and analysis tools classification. It also
presents the most common standards in use for tools interaction and shows the applicability of these
standards. A number of measurement and analysis tools have been reviewed, and the results of these
reviews are documented. There are many other useful tools in this area, therefore tool reviews will be
an ongoing process during the MOME project. The current results will build the starting set of
information that MOME will put into its future online tools database.
Keywords
MOME, Deliverable D11, State of Interoperability, IST Projects, Measurement Taxonomy/Tools
MOME-WP1-0406-D11_STATE_OF_INTEROPERABILITY 001990
Deliverable D11 Monitoring and Measurement Cluster
30/06/2004 Page 2 of 73
Table of Contents
1 Tools Interaction...............................................................................................................................7 1.1 Applicability of Interaction .......................................................................................................7 1.2 Standards in Use for Interaction................................................................................................8
1.2.1 IPFIX..................................................................................................................................9 1.2.2 PSAMP ..............................................................................................................................9 1.2.3 sFlow................................................................................................................................10 1.2.4 CRANE ............................................................................................................................10 1.2.5 IPDR ................................................................................................................................10 1.2.6 SNMP and SMIv2............................................................................................................10 1.2.7 RTFM...............................................................................................................................10 1.2.8 MeterMIB ........................................................................................................................11 1.2.9 IPPM ................................................................................................................................11 1.2.10 Netconf.............................................................................................................................11 1.2.11 RMONMIB SMIv2 ..........................................................................................................12
1.3 Applicability Summary ...........................................................................................................13 2 Tool Taxonomy ..............................................................................................................................14 3 Tool Reviews..................................................................................................................................16
3.1 Analyzer ..................................................................................................................................16 3.2 AutoFocus ...............................................................................................................................17 3.3 Bing .........................................................................................................................................18 3.4 bprobe/cprobe..........................................................................................................................19 3.5 Bro...........................................................................................................................................19 3.6 CMToolset...............................................................................................................................20 3.7 DAG card ................................................................................................................................21 3.8 Distributed Benchmark System (DBS) ...................................................................................22 3.9 Distributed Internet Traffic Generator (D-ITG) ......................................................................23 3.10 Dsniff ...................................................................................................................................24 3.11 E2ETT .................................................................................................................................25 3.12 eHealth – Concord ...............................................................................................................25 3.13 Ethereal................................................................................................................................26 3.14 Ettercap................................................................................................................................27 3.15 Initial Gap Increasing and Packet Transmission Rate (IGI/PTR)........................................28 3.16 Internet2 Detective ..............................................................................................................29 3.17 Ipband ..................................................................................................................................30 3.18 Iperf .....................................................................................................................................30 3.19 JFFNMS...............................................................................................................................31 3.20 Libpcap ................................................................................................................................32 3.21 LFT ......................................................................................................................................33 3.22 MGEN .................................................................................................................................34 3.23 Multi Router Traffic Grapher (MRTG) ...............................................................................35 3.24 MSA ....................................................................................................................................36 3.25 Nagios..................................................................................................................................37 3.26 Netio ....................................................................................................................................37 3.27 nBox86.................................................................................................................................38 3.28 NetFlow ...............................................................................................................................39 3.29 NetMate ...............................................................................................................................40 3.30 NetPipe ................................................................................................................................41 3.31 nProbe..................................................................................................................................41 3.32 Ntop .....................................................................................................................................42 3.33 OpenIMP .............................................................................................................................43 3.34 OpenView............................................................................................................................44 3.35 Packetyzer............................................................................................................................45

MOME-WP1-0406-D11_STATE_OF_INTEROPERABILITY 001990
Deliverable D11 Monitoring and Measurement Cluster
30/06/2004 Page 3 of 73
3.36 PathChirp.............................................................................................................................46 3.37 Pathload ...............................................................................................................................47 3.38 Ping......................................................................................................................................48 3.39 Rude/Crude..........................................................................................................................48 3.40 Skitter...................................................................................................................................49 3.41 Snort ....................................................................................................................................50 3.42 SProbe..................................................................................................................................51 3.43 Spruce ..................................................................................................................................52 3.44 Sting.....................................................................................................................................52 3.45 Tcpdstat ...............................................................................................................................53 3.46 Tcpdump..............................................................................................................................54 3.47 Tcptrace ...............................................................................................................................55 3.48 tcptraceroute ........................................................................................................................56 3.49 Thrulay.................................................................................................................................56 3.50 Traceroute............................................................................................................................57 3.51 Treno....................................................................................................................................58 3.52 Traffic Generator (TG) ........................................................................................................59 3.53 Tstat .....................................................................................................................................60 3.54 TTCP ...................................................................................................................................60 3.55 WinDump ............................................................................................................................61 3.56 WinPcap...............................................................................................................................62 3.57 Viznet...................................................................................................................................63 3.58 Xtraceroute ..........................................................................................................................64
4 Tool Database Use Cases ...............................................................................................................65 5 Appendix A - References ...............................................................................................................67 6 Appendix B - Glossary ...................................................................................................................68 7 Appendix C - Complete List of Tools ............................................................................................72

MOME-WP1-0406-D11_STATE_OF_INTEROPERABILITY 001990
Deliverable D11 Monitoring and Measurement Cluster
30/06/2004 Page 4 of 73
List of Figures
Figure 1: Generic Traffic Measurement Process .....................................................................................8 Figure 2: Applicability of Standards to the Measurement Process........................................................13 Figure 3: Use Cases for Tools Database................................................................................................66
List of Tables
Table 1: Tools Taxonomy......................................................................................................................15 Table 2: Abbreviations used for Reference to Internet Tool Repositories.............................................16 Table 3: User Operations on Tools Database ........................................................................................65 Table 4: Web-Links for evaluated Tools ...............................................................................................73

MOME-WP1-0406-D11_STATE_OF_INTEROPERABILITY 001990
Deliverable D11 Monitoring and Measurement Cluster
30/06/2004 Page 5 of 73
List of Acronyms
CAIDA The Cooperative Association for Internet Data Analysis
CLI Command Line Interface
GPL General Public License
IETF Internet Engineering Task Force
IPDV IP Packet Delay Variation
IPFIX Internet Protocol Flow Information Export
IPPM Internet Protocol Performance Metrics
IPv4 Internet Protocol version 4
IPv6 Internet Protocol version 6
IST Information Society Technologies
ITU International Telecommunication Union
OWD One Way delay
QoS Quality of Service
RTT Round Trip Time
SLA/SLS Service Level Agreement / Service Level Specification
SLAC Stanford Linear Accelerator Center
SMP Symmetric Multiprocessing
SNMP Simple Network Management Protocol

MOME-WP1-0406-D11_STATE_OF_INTEROPERABILITY 001990
Deliverable D11 Monitoring and Measurement Cluster
30/06/2004 Page 6 of 73
Executive Summary
During our work on tools, standards and interoperability we found that there exists a huge amount of
tools in that area. We identified more than 350! Many of these have been the result of research within
universities and national research organisations. Most of those tools are freely available including
source code. The other (mostly commercially licensed) tools originate from big vendors such as Cisco
or from younger start-up companies which are selling services for QoS surveillance, accounting1 and
billing.
The application of standards in these tools is quite rare. Many tools rely on proprietary command line
interfaces or GUIs for control and also produce proprietary data output in human readable ASCII
format. A lot of tools also lack the ability for remote control and data export. Thus interoperation often
relies on the execution of scripts for control and the application of converters to parse the tools' output.
Control input for some tools makes use of SNMP to access an internal MIB or HTTP featuring an
internal web-server. Data input is often achieved via the UNIX pcap library making the tools
applicable to live packet capture as well as for offline analysis by reading tcpdump trace files.
This document describes the opportunities for interaction between tools in the area of traffic
measurement and analysis. For this purpose it is structured into the following chapters:
Chapter 1 shows the possible interaction scenarios emphasizing in what combination different tools
can interact and what kind of information is exchanged during the process. The chapter contains an
overview about the current and emerging standards that are applicable for interoperation of tools and
points out where these standards are applicable.
Chapter 2 prepares the following tools review by defining a taxonomy which allows to classify the
tools under inspection into certain categories. The taxonomy builds the basis for the tools evaluation
and lists the attributes of interest and the characteristics that will be evaluated.
Chapter 2 evaluates a number of tools which were evaluated during our tools survey. For this survey
58 tools have been selected for closer inspection in the first round. Each tool has been categorized and
its most important attributes are noted. A summary about the evaluation concludes this chapter.
Chapter 4 prepares our work for the upcoming development of a common repository for storing the
results of our tools evaluation, further on called the MOME tools database. In this chapter we define
the basic functionalities that the MOME tools database will have. This database will store the collected
meta-data about the measurement and analysis tools and provide links to those tools and a searchable
information base to use for people looking for a suitable tool for their specific measurement problems.
Chapter 5 lists the references used within this document. For any request for comments (RFC)
documents please obtain the document via the web, e.g. at http://www.rfc-editor.org/rfcsearch.html
Chapter 6 gives an extensive glossary describing the most used entities from within this document.
Chapter 7 lists evaluated tools with name and URL in tabular format for a quick linkage to the web.
1 words which appear in the deliverables' glossary are formatted in italics the first time they appear

MOME-WP1-0406-D11_STATE_OF_INTEROPERABILITY 001990
Deliverable D11 Monitoring and Measurement Cluster
30/06/2004 Page 7 of 73
1 Tools Interaction
Almost all software tools in the area of IP traffic measurement and analysis only perform a small
subset of the functionalities required to capture, filter and classify, store, analyze traffic and prepare
the results for graphical display or for export into a database or other framework.
For using complimentary tools together in such an evaluation chain it is therefore crucial to have well-
defined interfaces and agreed data structures between them. Yet in common practice such interaction
is achieved with different levels of sophistication and work-load, for instance:
• convert a measurement result list by means of an editor and some scripting to a format suitable
to read the result into tools such as gnuplot for preparation of a graphical image
• write and attach a script which automatically converts tool output for reading with a plot tool
• implement an extension for the existing tool so that its output can be read directly that tool
• implement the data export conforming to a standard for input data of plotting tools
It can clearly be seen that the non-standard solutions are often prone to error due to lack of exhaustive
documentation. Such approach is also problematic since data formats and exchange protocols may
change without further notice thus breaking the conversion routines when updating one of the involved
software tools to a newer version.
When using tools which are compliant to a standard these problems are much less dominant because
documentation is publicly available. Standards are also often designed to be backward compatible
when a new version is deployed. Unfortunately the barrier to implement conformance to a standard is
often quite high because some standards have a wide scope and supporting them in a tool can mean a
considerable implementation effort. The big advantage is that it is possible to use any tool (e.g. select
one of the plotting tools) from a set of conformant tools and choose the one best suited for processing
the existing data sets.
Our evaluation work documented in this deliverable shows that most publicly available tools do not
adhere to some of the standards listed in section 1.2 but instead rely on proprietary control input and
analysis data output/export. Only for reading stored traffic traces the tcpdump file format has become
a quasi-standard since most tools make use of the pcap library which enables them to capture live
traffic and to read packet data from a pre-recorded tcpdump trace file.
Therefore the next subsection shows in what circumstances would be advisable to conform to a given
standard for data input, control input, as well as results formatting and data transfer. The subsequent
subsections then describe the mentioned standards.
1.1 Applicability of Interaction
Interaction between a pair of (possibly remotely located) tools is commonly used for purposes such as:
• control: where the controlling tool tells the other what it shall do
• data querying: such as used for fetching a status or a small set of values,
e.g. bytes counters from a router for each of its interface cards
• bulk data upload: to put data somewhere remote, e.g. on a file server
• bulk data download: to retrieve information, e.g. from a web server
For interaction between tools aimed at traffic capture, measurement, and analysis the transmitted
information usually contains either: (a) raw packet data (full or headers), (b) accounting flow records,
or (c) QoS-related records per link or flow.
MOME-WP1-0406-D11_STATE_OF_INTEROPERABILITY 001990
Deliverable D11 Monitoring and Measurement Cluster
30/06/2004 Page 8 of 73
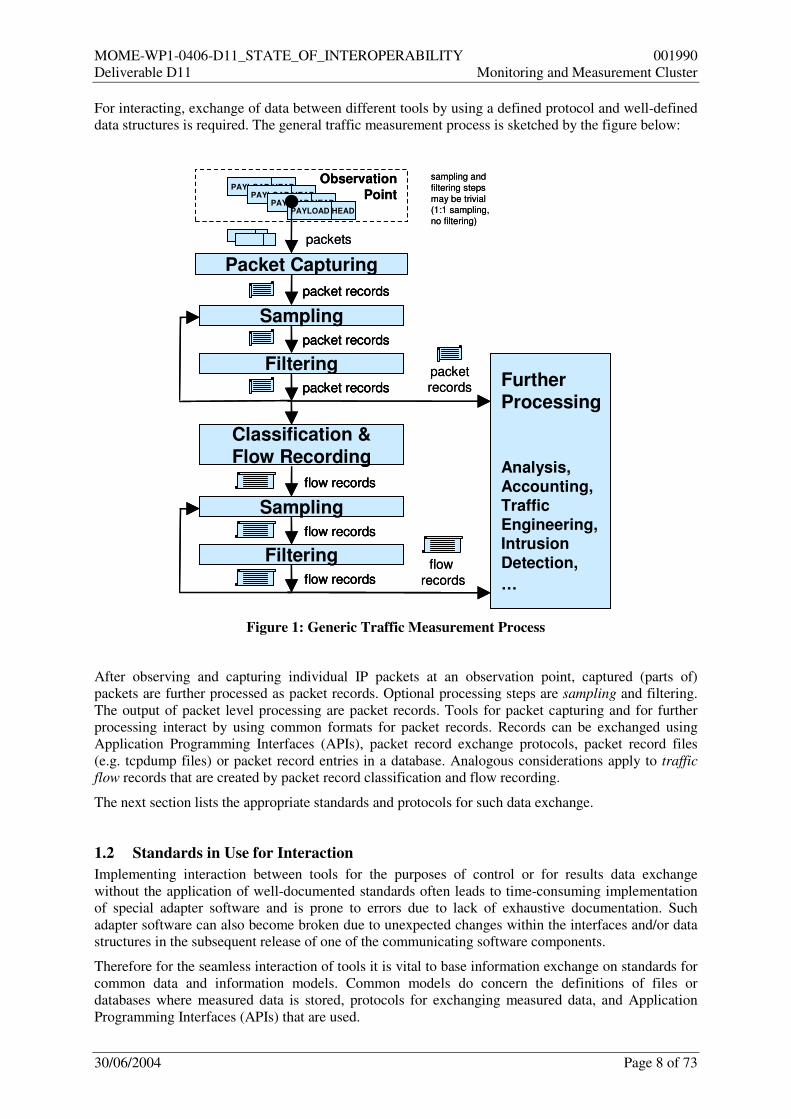
For interacting, exchange of data between different tools by using a defined protocol and well-defined
data structures is required. The general traffic measurement process is sketched by the figure below:
Classification &Flow Recording
Observation
PointPAYLOAD HEAD
PAYLOAD HEADPAYLOAD HEAD
PAYLOAD HEAD
Packet Capturing
Filtering
Sampling
packets
flow
records
sampling and
filtering steps
may be trivial (1:1 sampling,
no filtering)
Filtering
Sampling
flow records
packet records
packet records
packet records
flow records
flow records
packetrecords Further
Processing
Analysis,
Accounting,Traffic
Engineering,Intrusion
Detection,
…
Classification &Flow Recording
Observation
PointPAYLOAD HEAD
PAYLOAD HEADPAYLOAD HEAD
PAYLOAD HEAD
PAYLOAD HEADPAYLOAD HEADPAYLOAD HEADPAYLOAD HEAD
PAYLOAD HEADPAYLOAD HEADPAYLOAD HEADPAYLOAD HEAD
Packet Capturing
Filtering
Sampling
packets
flow
records
sampling and
filtering steps
may be trivial (1:1 sampling,
no filtering)
Filtering
Sampling
flow recordsflow records
packet recordspacket records
packet recordspacket records
packet recordspacket records
flow recordsflow records
flow recordsflow records
packetrecords Further
Processing
Analysis,
Accounting,Traffic
Engineering,Intrusion
Detection,
…
Figure 1: Generic Traffic Measurement Process
After observing and capturing individual IP packets at an observation point, captured (parts of)
packets are further processed as packet records. Optional processing steps are sampling and filtering.
The output of packet level processing are packet records. Tools for packet capturing and for further
processing interact by using common formats for packet records. Records can be exchanged using
Application Programming Interfaces (APIs), packet record exchange protocols, packet record files
(e.g. tcpdump files) or packet record entries in a database. Analogous considerations apply to traffic
flow records that are created by packet record classification and flow recording.
The next section lists the appropriate standards and protocols for such data exchange.
1.2 Standards in Use for Interaction
Implementing interaction between tools for the purposes of control or for results data exchange
without the application of well-documented standards often leads to time-consuming implementation
of special adapter software and is prone to errors due to lack of exhaustive documentation. Such
adapter software can also become broken due to unexpected changes within the interfaces and/or data
structures in the subsequent release of one of the communicating software components.
Therefore for the seamless interaction of tools it is vital to base information exchange on standards for
common data and information models. Common models do concern the definitions of files or
databases where measured data is stored, protocols for exchanging measured data, and Application
Programming Interfaces (APIs) that are used.
MOME-WP1-0406-D11_STATE_OF_INTEROPERABILITY 001990
Deliverable D11 Monitoring and Measurement Cluster
30/06/2004 Page 9 of 73
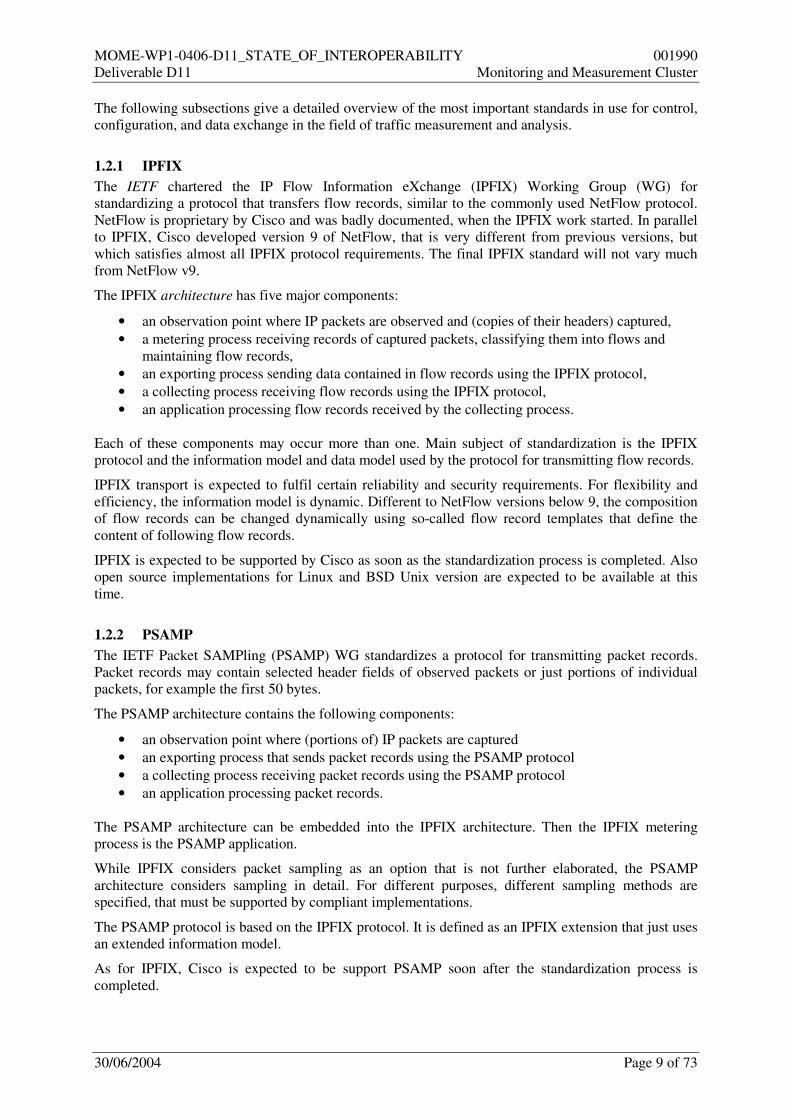
The following subsections give a detailed overview of the most important standards in use for control,
configuration, and data exchange in the field of traffic measurement and analysis.
1.2.1 IPFIX
The IETF chartered the IP Flow Information eXchange (IPFIX) Working Group (WG) for
standardizing a protocol that transfers flow records, similar to the commonly used NetFlow protocol.
NetFlow is proprietary by Cisco and was badly documented, when the IPFIX work started. In parallel
to IPFIX, Cisco developed version 9 of NetFlow, that is very different from previous versions, but
which satisfies almost all IPFIX protocol requirements. The final IPFIX standard will not vary much
from NetFlow v9.
The IPFIX architecture has five major components:
• an observation point where IP packets are observed and (copies of their headers) captured,
• a metering process receiving records of captured packets, classifying them into flows and
maintaining flow records,
• an exporting process sending data contained in flow records using the IPFIX protocol,
• a collecting process receiving flow records using the IPFIX protocol,
• an application processing flow records received by the collecting process.
Each of these components may occur more than one. Main subject of standardization is the IPFIX
protocol and the information model and data model used by the protocol for transmitting flow records.
IPFIX transport is expected to fulfil certain reliability and security requirements. For flexibility and
efficiency, the information model is dynamic. Different to NetFlow versions below 9, the composition
of flow records can be changed dynamically using so-called flow record templates that define the
content of following flow records.
IPFIX is expected to be supported by Cisco as soon as the standardization process is completed. Also
open source implementations for Linux and BSD Unix version are expected to be available at this
time.
1.2.2 PSAMP
The IETF Packet SAMPling (PSAMP) WG standardizes a protocol for transmitting packet records.
Packet records may contain selected header fields of observed packets or just portions of individual
packets, for example the first 50 bytes.
The PSAMP architecture contains the following components:
• an observation point where (portions of) IP packets are captured
• an exporting process that sends packet records using the PSAMP protocol
• a collecting process receiving packet records using the PSAMP protocol
• an application processing packet records.
The PSAMP architecture can be embedded into the IPFIX architecture. Then the IPFIX metering
process is the PSAMP application.
While IPFIX considers packet sampling as an option that is not further elaborated, the PSAMP
architecture considers sampling in detail. For different purposes, different sampling methods are
specified, that must be supported by compliant implementations.
The PSAMP protocol is based on the IPFIX protocol. It is defined as an IPFIX extension that just uses
an extended information model.
As for IPFIX, Cisco is expected to be support PSAMP soon after the standardization process is
completed.

MOME-WP1-0406-D11_STATE_OF_INTEROPERABILITY 001990
Deliverable D11 Monitoring and Measurement Cluster
30/06/2004 Page 10 of 73
1.2.3 sFlow
The sFlow protocol (RFC 3176) was developed by the InMon Corporation, a spin-off of Hewlett
Packard. The sFlow protocol can be used for transmitting information extracted from observed
packets. SFlow specifically supports packet sampling. The standard definition consists of two main
parts: a MIB module for configuring the meter, particularly the sampling functions to apply, and a
packet format specification for transmitting sampled packet headers.
A particular property of the sFlow protocol is that no timestamps are transmitted. Time stamping is
expected to be performed by the collector of sFlow packet records when receiving the records. The
sFlow protocol is unreliable, using UDP as transport protocol, and it does not have any protection by
security mechanisms for authentication, integrity protection or encryption.
SFlow is well suited for monitoring high-speed links. Unfortunately, the sFlow documentation in RFC
3176 is quite poor. Very few companies other than InMon have implemented the protocol.
1.2.4 CRANE
The Common Reliable Accounting for Network Elements (CRANE) protocol (RFC 3423) serves for
reliable transfer of flow records. It was developed by XACCT for the integration into accounting an
charging systems for IP services. It is flexible by using templates as IPFIX does. RFC 3421 is a pure
transport protocol specification. It does not make assumptions on how flow records were measured
and processed before transmitting them. CRANE does not have any protection by security
mechanisms for authentication, integrity protection or encryption.
1.2.5 IPDR
The IP Detailed Record is a standard for exchanging usage and control data between network and
hosting elements and operations and business support systems. IPDR is standardized by IPDR.org, an
open consortium of service providers, equipment vendors, system integrators, and billing and
mediation vendors.
The IPDR standard defines an information model for flow records (IP detail records), two data models
for encoding the information model either using the eXtensible Markup Language (XML) or using the
eXternal Data Representation (XDR, RFC 1832). IPDR can be used for APIs for passing or receiving
flow records, in databases for storing flow records and in protocols for transmitting flow records. The
latter one is the main target of standardization at IPDR.org. They have defined two transport protocols.
One is the plain transfer of IPDR data structures via the File Transfer Protocol (FTP), the other defines
a streaming protocol for flow record using templates, which is similar to Cisco NetFlow v9.
IPDR is intended to be used by accounting and charging applications for IP services,
1.2.6 SNMP and SMIv2
The Simple Network Management Protocol (SNMP, RFCs 3410-3417) allows a client, called
‘manager’, to read and write managed objects at a server, called ‘agent’. Managed objects are defined
as Management Information Base (MIB) modules using a specification language called Structure of
Management Information version 2 (SMIv2, RFC 2578). In addition to read and write operations
initiated by the manager, an agent can sent asynchronous notifications, for example for indicating a
malfunction or the passing of a pre-defined threshold. SNMP version 3 offers full security protection
achieving secure authentication, integrity protection and encryption of messages.
1.2.7 RTFM
The Real-Time Flow Measurement (RTFM) architecture (RFC 2722, RFC 2724) was an early attempt
by the IETF to standardizing traffic metering. The RTFM architecture standardizes much more than
the IPFIX architecture. In RTFM also configuring the traffic meter is standardized. The RTFM
architecture contains a manager, a meter and a reader. The manger configures the meter by rules for
filtering and aggregating observed packets into flows. It also configures the meter concerning the
readers that may receive flow records. For different readers, different rules can be chosen. The
MOME-WP1-0406-D11_STATE_OF_INTEROPERABILITY 001990
Deliverable D11 Monitoring and Measurement Cluster
30/06/2004 Page 11 of 73
manager also configures the readers by telling them which meter produces which records for them.
The reader contacts the meters in order to receive flow records by polling.
There are only two known implementations of the RTFM architecture, an open source implementation
called NeTraMet by the author of the standard and (a not commercially available) one by IBM. Both
used another standard, the Meter MIB (RFC 2720) for implementing the RTFM meter.
The RTFM attempt is considered to have failed. The problem of the RTFM architecture was its mighty
capabilities that required high implementation effort and were difficult to use. The rules for the meter
are written as programs for a packet-metering engine defined by the architecture. The programming
language has jumps and loops. Since this (assembler) language was hard to use, the RTFM standard
was extended by a higher level programming language called Simple Ruleset Language (SRL, RFC
2723).
1.2.8 MeterMIB
The Meter MIB module (RFC 2720) defines a set of managed objects that can be remotely accessed
via SNMP. The objects define three interfaces of a RTFM meter. A first set of objects allow a manager
(the RTFM manager) to set traffic metering rule sets for a meter as defined by the RTFM architecture.
A second set allows a manager (again the RTFM manager) to define sets of readers that have access to
metering results produced using certain rule sets. The third and last group of managed objects allow a
manager (the RTFM reader) to read the measurement results produced using certain rule sets.
There are only two known implementations of the Meter MIB module (see the RTFM section). The
open source NeTraMet implementation was used in several research projects, but for a real world
applications it is not usable. The implementation is not suited for high speed links (a 100Mbit Fast
Ethernet link can already be too fast for NeTraMet) and the stability of the implementation is limited.
1.2.9 IPPM
The IETF IP Performance Metrics (IPPM) working group aims at developing a set of standard metrics
to provide a quantitative measure of performance of Internet data delivery services. The metrics
already completed and published are:
Connectivity, one-way delay and loss, round-trip delay and loss, delay variation, loss patterns, packet
reordering, bulk transport capacity, and link bandwidth capacity.
For each of them a document has been written, defining the metric and the procedures to accurately
measure and document it.
Another goal of the WG is to produce documents that describe how the above-mentioned metrics
characterize features that are important to different service classes, such as bulk transport, periodic
streams, or multimedia streams. For several service classes the performance characteristics are
discussed, identifying the set of metrics that describe them, and the methodologies necessary to collect
them.
Current work focuses on the production of a MIB to retrieve the results of IPPM metrics, to facilitate
the communication of metrics to existing network management systems, and on the definition of a
protocol to enable communication among test equipment that implements the one-way metrics.
Following the IPPM procedures and definitions, allows measurement and meaningful performance
comparison in heterogeneous environments. Analysis tools can thus obtain standardized values from
different measurement tools. In addition, tools featuring the IPPM MIB provide a standardized way to
collect measured data, independently from the tool used.
1.2.10 Netconf
Netconf [1] is an IETF working group chartered to produce a protocol [2] suitable for network
configuration, i.e. to access, query and configure network devices. The goal is to develop and apply a
common protocol to transfer configuration data to and from a device, and for examining device state
information which may impact the configuration. Each of these mechanisms shall be covered by the

MOME-WP1-0406-D11_STATE_OF_INTEROPERABILITY 001990
Deliverable D11 Monitoring and Measurement Cluster
30/06/2004 Page 12 of 73
Netconf protocol regarding the different aspects, such as session establishment, user authentication,
configuration data exchange, and error responses. The protocol uses the remote procedure call (RPC)
paradigm to access information on the remote device (e.g. router, switch, network monitor).
Transferred messages are encoded using XML syntax for data encoding purposes.
The Netconf protocol shall also be able to integrate with existing user authentication methods,
configuration database systems, and configuration transactions (with features such as locking and
rollback capability). It is designed to be as transport-independent as possible and will provide support
for asynchronous notifications. Therefore several Netconf-over-some-transport-protocol drafts are
currently in work (for BEEP, SOAP, and SSH).
The current work has produced a protocol draft [2] specification which defines the operational model,
protocol operations, transaction model, data model, requirements, security requirements, and transport
layer requirements.
For interoperability between network monitoring, measurement, and analysis tools Netconf can play a
vital role in two applications: (a) querying of network devices by monitoring tools and (b) configu-
ration of devices as well as tools by network management systems using the Netconf protocol.
1.2.11 RMONMIB SMIv2
RMONMIB is a Management Information Base (MIB) definition for use via network management
protocols such as SNMP in TCP/IP-based internets. The RMONMIB can be installed in network
devices such as routers, switches, and networking software products.
It defines objects for managing remote network monitoring devices, often called monitors or probes.
These objects are necessary to provide the ability to monitor multiple network layers of traffic in
remote networks; providing fault, configuration, and performance management, and are consistent
with the SNMP framework and existing SNMP standards.
RMONMIB also addresses issues such as standardisation of metrics and interoperability of protocols.
For example, in transport performance measurement, there is a need for standardized means to collect
and report selectable performance metrics and statistics derived from the monitoring of network
packets and transport protocol states. The monitoring covers both passive and active traffic generation
sources. Monitoring support for these measurements can provide a drill-down capability to provide
insight into the performance of the lower-level transactions which comprise the overall performance of
a network application.
RMONMIB provides a common framework and set of MIB objects within the current RMON
framework, for the identification and characterization of application responsiveness and availability,
and the reporting of test results produced by such mechanisms. Common metrics and derived metrics
will be characterized and reported in a manner consistent with the IP Performance Metrics Framework
(see IPPM).
RMONMIB allows application performance measurements to be retrieved via SNMP. Every RMON2
implementation has the capability to parse certain types of packets and identify their protocol type at
multiple levels. The protocol directory presents an inventory of those protocol types. The probe is
capable of monitoring, and allows the addition, deletion, and configuration of protocol types in this
list.

MOME-WP1-0406-D11_STATE_OF_INTEROPERABILITY 001990
Deliverable D11 Monitoring and Measurement Cluster
30/06/2004 Page 13 of 73
1.3 Applicability Summary
The following figure again depicts the generic traffic measurement process, this time also showing the
aforementioned standards highlighting where in the process these can be applied:
Classification &
Flow Recording
Observation
PointPAYLOAD HEAD
PAYLOAD HEAD
PAYLOAD HEAD
PAYLOAD HEAD
Packet Capturing
Filtering
Sampling
packets
flow
records
sampling and filtering
steps may be trivial (1:1 sampling, no filtering)
Filtering
Sampling
flow records
packet records
packet records
packet records
flow records
flow records
packet
records
Flow Record Export:
• IPFIX• CRANE• SNMP (Meter-MIB)• IPPM-conformant
QoS values
Packet Record Export:
• PSAMP• sFlow
Tool Control:
• NetConf
• SNMP (PSAMP-MIB,RMON-MIB)
Classification &
Flow Recording
Observation
PointPAYLOAD HEAD
PAYLOAD HEAD
PAYLOAD HEAD
PAYLOAD HEAD
PAYLOAD HEADPAYLOAD HEAD
PAYLOAD HEADPAYLOAD HEAD
PAYLOAD HEADPAYLOAD HEAD
PAYLOAD HEADPAYLOAD HEAD
Packet Capturing
Filtering
Sampling
packets
flow
records
sampling and filtering
steps may be trivial (1:1 sampling, no filtering)
Filtering
Sampling
flow recordsflow records
packet recordspacket records
packet recordspacket records
packet recordspacket records
flow recordsflow records
flow recordsflow records
packet
records
Flow Record Export:
• IPFIX• CRANE• SNMP (Meter-MIB)• IPPM-conformant
QoS values
Packet Record Export:
• PSAMP• sFlow
Tool Control:
• NetConf
• SNMP (PSAMP-MIB,RMON-MIB)
Figure 2: Applicability of Standards to the Measurement Process
MOME-WP1-0406-D11_STATE_OF_INTEROPERABILITY 001990
Deliverable D11 Monitoring and Measurement Cluster
30/06/2004 Page 14 of 73
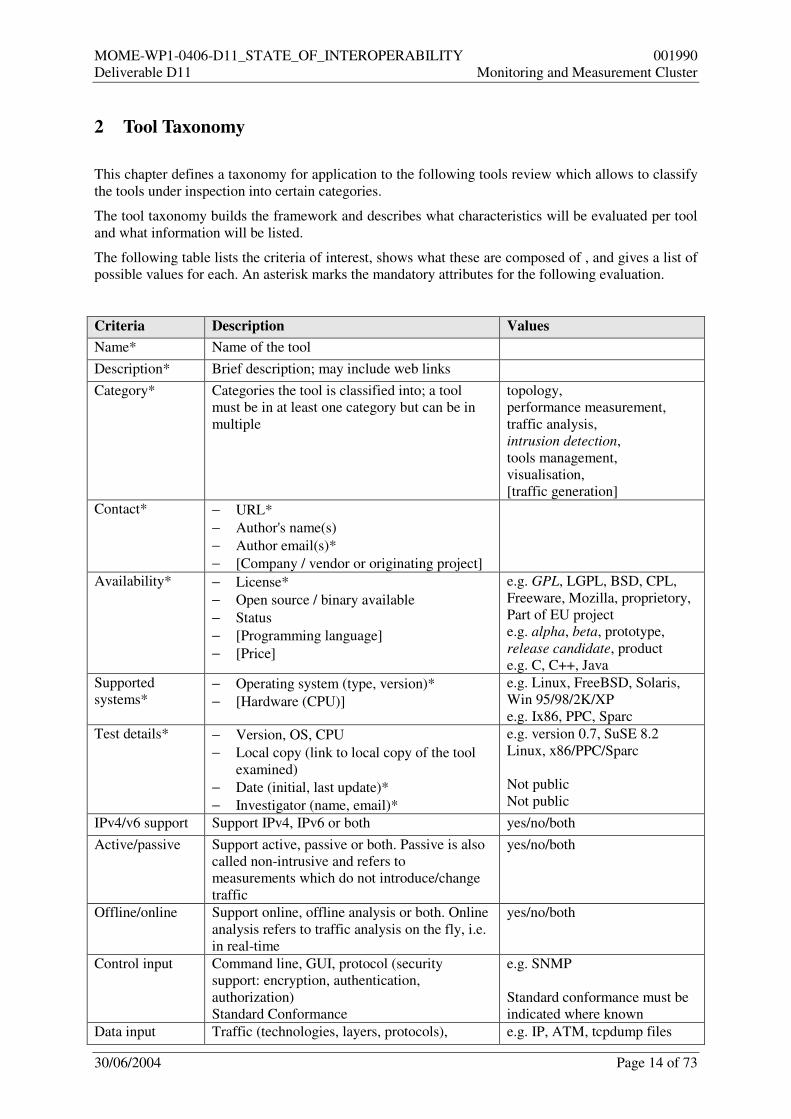
2 Tool Taxonomy
This chapter defines a taxonomy for application to the following tools review which allows to classify
the tools under inspection into certain categories.
The tool taxonomy builds the framework and describes what characteristics will be evaluated per tool
and what information will be listed.
The following table lists the criteria of interest, shows what these are composed of , and gives a list of
possible values for each. An asterisk marks the mandatory attributes for the following evaluation.
Criteria Description Values
Name* Name of the tool
Description* Brief description; may include web links
Category* Categories the tool is classified into; a tool
must be in at least one category but can be in
multiple
topology,
performance measurement,
traffic analysis,
intrusion detection,
tools management,
visualisation,
[traffic generation]
Contact* − URL*
− Author's name(s)
− Author email(s)*
− [Company / vendor or originating project]
Availability* − License*
− Open source / binary available
− Status
− [Programming language]
− [Price]
e.g. GPL, LGPL, BSD, CPL,
Freeware, Mozilla, proprietory,
Part of EU project
e.g. alpha, beta, prototype,
release candidate, product
e.g. C, C++, Java
Supported
systems* − Operating system (type, version)*
− [Hardware (CPU)]
e.g. Linux, FreeBSD, Solaris,
Win 95/98/2K/XP
e.g. Ix86, PPC, Sparc
Test details* − Version, OS, CPU
− Local copy (link to local copy of the tool
examined)
− Date (initial, last update)*
− Investigator (name, email)*
e.g. version 0.7, SuSE 8.2
Linux, x86/PPC/Sparc
Not public
Not public
IPv4/v6 support Support IPv4, IPv6 or both yes/no/both
Active/passive Support active, passive or both. Passive is also
called non-intrusive and refers to
measurements which do not introduce/change
traffic
yes/no/both
Offline/online Support online, offline analysis or both. Online
analysis refers to traffic analysis on the fly, i.e.
in real-time
yes/no/both
Control input Command line, GUI, protocol (security
support: encryption, authentication,
authorization)
Standard Conformance
e.g. SNMP
Standard conformance must be
indicated where known
Data input Traffic (technologies, layers, protocols), e.g. IP, ATM, tcpdump files

MOME-WP1-0406-D11_STATE_OF_INTEROPERABILITY 001990
Deliverable D11 Monitoring and Measurement Cluster
30/06/2004 Page 15 of 73
Criteria Description Values
trace files (format)
Standard Conformance
Standard conformance must be
indicated where known
Metrics/functions Lists the metrics or functions the tools
performs
Standard conformance
Direct/indirect measurement (indirect means
estimation based on certain assumptions)
topology, routing analysis,
capacity, available bandwidth,
utilisation (bandwidth, protocol,
ports), protocol analysis, jitter (
IPDV, payload), delay (OWD,
RTT), loss (RT,OW), packet
capturing, accounting,
throughput/goodput, bulk
transfer capacity, reachability,
app-specific (availability,
response time), packet
reordering, multicast
For each metric the standard
conformance must be indicated
if known e.g. IPPM, ITU
Indicate this for each metric if
necessary
Data output Files (binary/ASCII), GUI, database
Protocol (security support: encryption,
authentication, authorization)
Standard Conformance
e.g. file format, DB format
e.g. SNMP, IPFIX
Standard conformance must be
indicated where known
Time scope When/how often are metrics computed and
exported
e.g. real-time, every x
seconds/minutes/hours…
Aggregation Aggregation of the data e.g. filtering, classification,
flow detection, aggregation
granularity, threshold/alarms,
prefix/AS
Sampling Sampling functionality (if any) e.g. yes/no, before/after
classification, algorithm and
parameters
Comments Comments about the tool from the investigator
Performance Measurement/analysis speed e.g. packets per second,
rules/tasks
Rating Rating of the tool (popularity, vitality etc.)
Table 1: Tools Taxonomy

MOME-WP1-0406-D11_STATE_OF_INTEROPERABILITY 001990
Deliverable D11 Monitoring and Measurement Cluster
30/06/2004 Page 16 of 73
3 Tool Reviews
This chapter documents the current evaluation results for tools which have been under closer
inspection within MOME. For each of those 58 tools, selected from more than 350 measurement
related tools found, a short description is given, following its categorization, attributes, and finally
testing results
The complete list with links to tool home pages is published at:
http://www.ip-meausrement.org (select "Tools", "available Tools" from the menu bar).
A number of tool repositories and overview pages on the web have been identified during our research
process which also give lists of measurement tools and some additional comments on these. The
column "listed in" within the tools description gives a pointer to the appropriate repository if one was
identified.
listed in URL
CAIDA http://www.caida.org/tools/taxonomy/
SLAC http://www.slac.stanford.edu/xorg/nmtf/nmtf-tools.html
http://www.slac.stanford.edu/comp/net/wan-mon/netmon.html
TD http://www.csm.ornl.gov/~dunigan/netperf/netlinks.html
TG http://www.caip.rutgers.edu/~arni/linux/tg1.html
HS http://www.cs.columbia.edu/~hgs/internet/tools.html
NLANR http://dast.nlanr.net/NPMT/
FMEAT http://freshmeat.net/
SF http://sourceforge.net/
Table 2: Abbreviations used for Reference to Internet Tool Repositories
An overview listing the evaluated tools' names and the URL of their home page on the Internet is
given in the Appendix below chapter 7. (See page 72 ff.)
3.1 Analyzer
Description
Analyzer is a configurable network analyzer program for Win32 environment. Analyzer is able to
capture packets on all platforms (and link-layer technologies) supported by WinPcap, except for
Windows 95.It has the ability to parse network packets according to the protocol description contained
into some external files, which can be modified at run-time by the user. These files are written in the
NetPDL language.
Basic Info
Name Analyzer
URL http://analyzer.polito.it
listed in SLAC
Classification
Category Traffic analysis
Active/passive Passive
Offline/online Both
Control input GUI

MOME-WP1-0406-D11_STATE_OF_INTEROPERABILITY 001990
Deliverable D11 Monitoring and Measurement Cluster
30/06/2004 Page 17 of 73
Data input Packets captured online and saved in files
Metrics/functions Packets capturing
Data output Text, GUI
IPv4/v6 support Both
Time scope Real time or at intervals
Aggregation Filtering by protocol (MAC, LLC, IP, IP6…)
Sampling
Availability Alpha v3.0; BSD
Supported
systems
Win32 platforms except windows 95, CE
Contact [email protected]
Evaluation
Test details Windows 2000, v 3.0, June 2004
Performance
Rating
Comments
3.2 AutoFocus
Description
AutoFocus is a traffic analysis and visualization tool that describes the traffic mix of a link through
textual reports and time series plots. The traffic reports are computed automatically. They describe the
traffic mix by giving the traffic of selected traffic clusters (aggregates) defined using the source and
destination IP address, source and destination ports and protocol field. There are separate reports that
measure the traffic in bytes, packets and flows.
Basic Info
Name AutoFocus
URL http://www.caida.org/tools/measurement/autofocus/
listed in CAIDA
Classification
Category Traffic Analysis
Active/passive passive
Offline/online offline
Control input CLI
Data input sflow or tcpdump traces
Metrics/functions separation by source and destination IP address,
source and destination ports and protocol field
Data output text output plus interoperability with RRDTool
IPv4/v6 support IPv4
Aggregation configurable, by source and destination IP address,
source and destination ports and protocol field
Sampling yes
Availability Beta-Version 0.3.6 free for download
Supported systems Linux, UNIX
Contact Christian Estan, http://www.cs.ucsd.edu/~cestan/, [email protected]

MOME-WP1-0406-D11_STATE_OF_INTEROPERABILITY 001990
Deliverable D11 Monitoring and Measurement Cluster
30/06/2004 Page 18 of 73
Evaluation
Test details version 0.3.6, Carsten Schmoll, 25.06.2004
Performance
Rating
Comments
3.3 Bing
Description
Bing is a point-to-point bandwidth measurement tool (hence the 'b'), based on ping. Bing determines
the real (raw, as opposed to available or average) throughput on a link by measuring ICMP echo
requests roundtrip times for different packet sizes for each end of the link.
Basic Info
Name bing
URL http://www.cnam.fr/reseau/bing.html
http://ai3.asti.dost.gov.ph/sat/bing.html
listed in CAIDA
Classification
Category bandwidth measurement
Active/passive active
Offline/online online
Control input CLI
Data input
Metrics/functions
Data output
IPv4/v6 support
Time scope
Aggregation
Sampling
Availability open source
Supported systems FreeBSD, Linux, NetBSD, SunOS 4.1.3, AIX, HP-UX 9, Solaris 2, BSDI 1.0,
Ultrix (DECstation), OSF/1
Contact
Evaluation
Test details Carsten Schmoll 28.6.2004
Performance
Rating
Comments

MOME-WP1-0406-D11_STATE_OF_INTEROPERABILITY 001990
Deliverable D11 Monitoring and Measurement Cluster
30/06/2004 Page 19 of 73
3.4 bprobe/cprobe
Description
The tool consists of a line giving the name, version and target followed by a line reporting either the
measured bottleneck bandwidth (bprobe) or the measured available bandwidth (cprobe).
Basic Info
Name brobe, cprobe
URL http://cs-people.bu.edu/carter/tools/Tools.html
listed in
Classification
Category performance
Active/passive active
Offline/online online
Control input CLI
Data input
Metrics/functions stated: available and bottleneck bandwidth over ICMP protocol
in fact: asymptotic dispersion rate, which is not available bandwidth
Data output text at console
IPv4/v6 support
Time scope real-time
Aggregation
Sampling
Availability source code, written in C
Supported systems all Unix derivates
Evaluation
Test details missing c headerfiles
Performance
Rating
Comments Cprobe was the first tool to attempt to measure bandwidth. It measures the
dispersion of packet trains which has been proofed to measure the asymptotic
dispersion rate which is not the same as the available bandwidth [3].
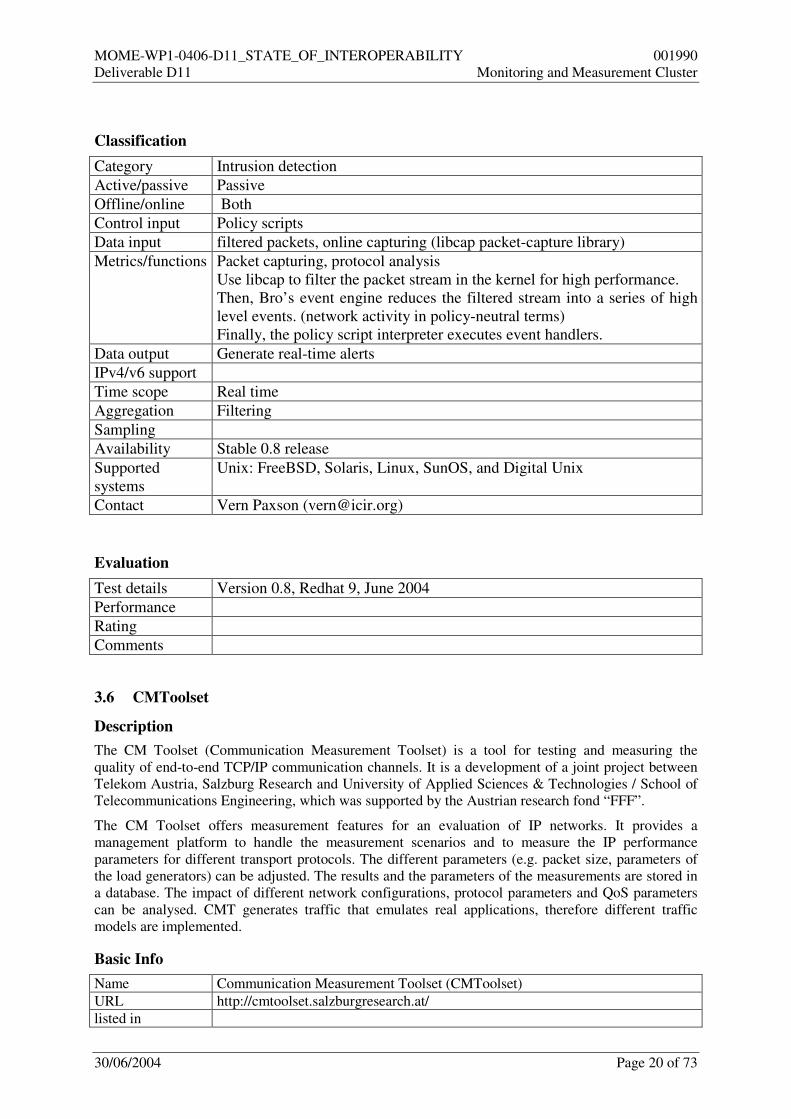
3.5 Bro
Description
Bro is a stand-alone system for detecting network intruders in real-time by passively monitoring a
network link over which the intruder's traffic transits. Bro targets high-speed (Gbps), high-volume
intrusion detection. By judiciously leveraging packet filtering techniques, Bro is able to achieve the
performance necessary to do so while running on commercially available PC hardware, and thus can
serve as a cost effective means of monitoring a site's first source of attacks: its Internet connection.
Basic Info
Name Bro
URL http://www.icir.org/vern/bro.html
listed in SLAC
MOME-WP1-0406-D11_STATE_OF_INTEROPERABILITY 001990
Deliverable D11 Monitoring and Measurement Cluster
30/06/2004 Page 20 of 73
Classification
Category Intrusion detection
Active/passive Passive
Offline/online Both
Control input Policy scripts
Data input filtered packets, online capturing (libcap packet-capture library)
Metrics/functions Packet capturing, protocol analysis
Use libcap to filter the packet stream in the kernel for high performance.
Then, Bro’s event engine reduces the filtered stream into a series of high
level events. (network activity in policy-neutral terms)
Finally, the policy script interpreter executes event handlers.
Data output Generate real-time alerts
IPv4/v6 support
Time scope Real time
Aggregation Filtering
Sampling
Availability Stable 0.8 release
Supported
systems
Unix: FreeBSD, Solaris, Linux, SunOS, and Digital Unix
Contact Vern Paxson ([email protected])
Evaluation
Test details Version 0.8, Redhat 9, June 2004
Performance
Rating
Comments
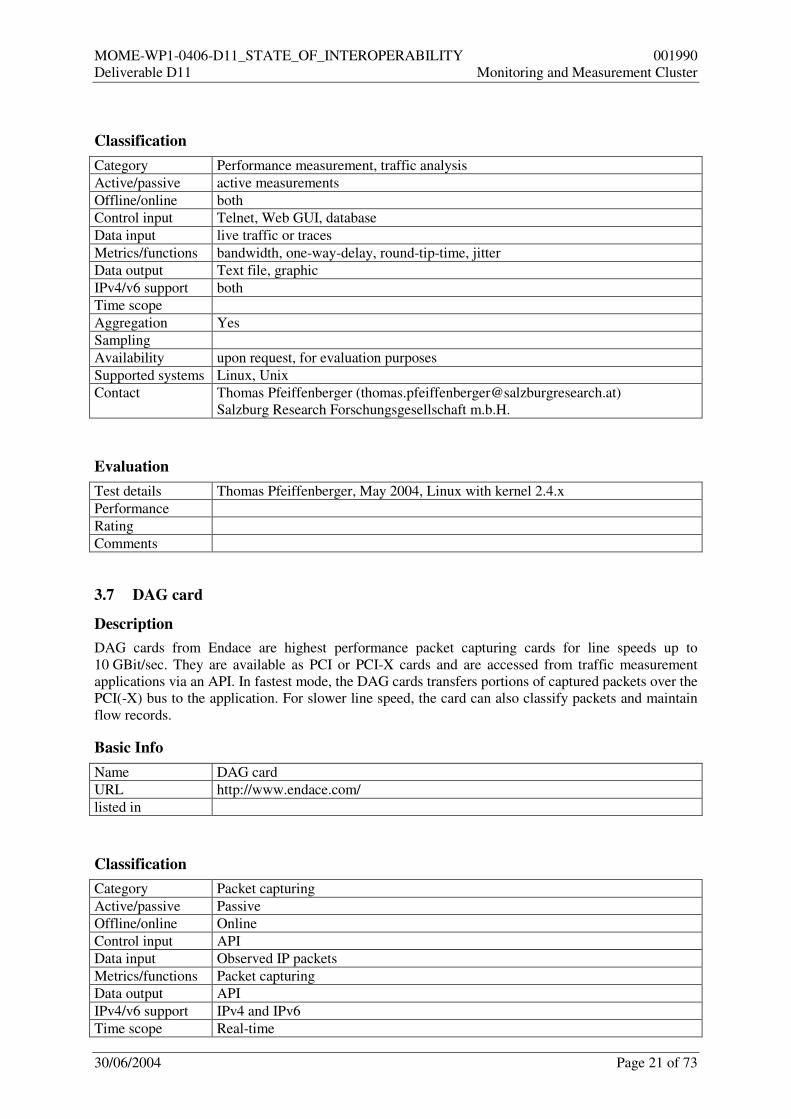
3.6 CMToolset
Description
The CM Toolset (Communication Measurement Toolset) is a tool for testing and measuring the
quality of end-to-end TCP/IP communication channels. It is a development of a joint project between
Telekom Austria, Salzburg Research and University of Applied Sciences & Technologies / School of
Telecommunications Engineering, which was supported by the Austrian research fond “FFF”.
The CM Toolset offers measurement features for an evaluation of IP networks. It provides a
management platform to handle the measurement scenarios and to measure the IP performance
parameters for different transport protocols. The different parameters (e.g. packet size, parameters of
the load generators) can be adjusted. The results and the parameters of the measurements are stored in
a database. The impact of different network configurations, protocol parameters and QoS parameters
can be analysed. CMT generates traffic that emulates real applications, therefore different traffic
models are implemented.
Basic Info
Name Communication Measurement Toolset (CMToolset)
URL http://cmtoolset.salzburgresearch.at/
listed in
MOME-WP1-0406-D11_STATE_OF_INTEROPERABILITY 001990
Deliverable D11 Monitoring and Measurement Cluster
30/06/2004 Page 21 of 73
Classification
Category Performance measurement, traffic analysis
Active/passive active measurements
Offline/online both
Control input Telnet, Web GUI, database
Data input live traffic or traces
Metrics/functions bandwidth, one-way-delay, round-tip-time, jitter
Data output Text file, graphic
IPv4/v6 support both
Time scope
Aggregation Yes
Sampling
Availability upon request, for evaluation purposes
Supported systems Linux, Unix
Contact Thomas Pfeiffenberger ([email protected])
Salzburg Research Forschungsgesellschaft m.b.H.
Evaluation
Test details Thomas Pfeiffenberger, May 2004, Linux with kernel 2.4.x
Performance
Rating
Comments
3.7 DAG card
Description
DAG cards from Endace are highest performance packet capturing cards for line speeds up to
10 GBit/sec. They are available as PCI or PCI-X cards and are accessed from traffic measurement
applications via an API. In fastest mode, the DAG cards transfers portions of captured packets over the
PCI(-X) bus to the application. For slower line speed, the card can also classify packets and maintain
flow records.
Basic Info
Name DAG card
URL http://www.endace.com/
listed in
Classification
Category Packet capturing
Active/passive Passive
Offline/online Online
Control input API
Data input Observed IP packets
Metrics/functions Packet capturing
Data output API
IPv4/v6 support IPv4 and IPv6
Time scope Real-time
MOME-WP1-0406-D11_STATE_OF_INTEROPERABILITY 001990
Deliverable D11 Monitoring and Measurement Cluster
30/06/2004 Page 22 of 73
Aggregation filtering, classification, flow detection
Sampling Yes
Availability commercial license
Supported systems Linux 2.4.x, FreeBSD 4.x
Evaluation
Test details
Performance
Rating
Comments
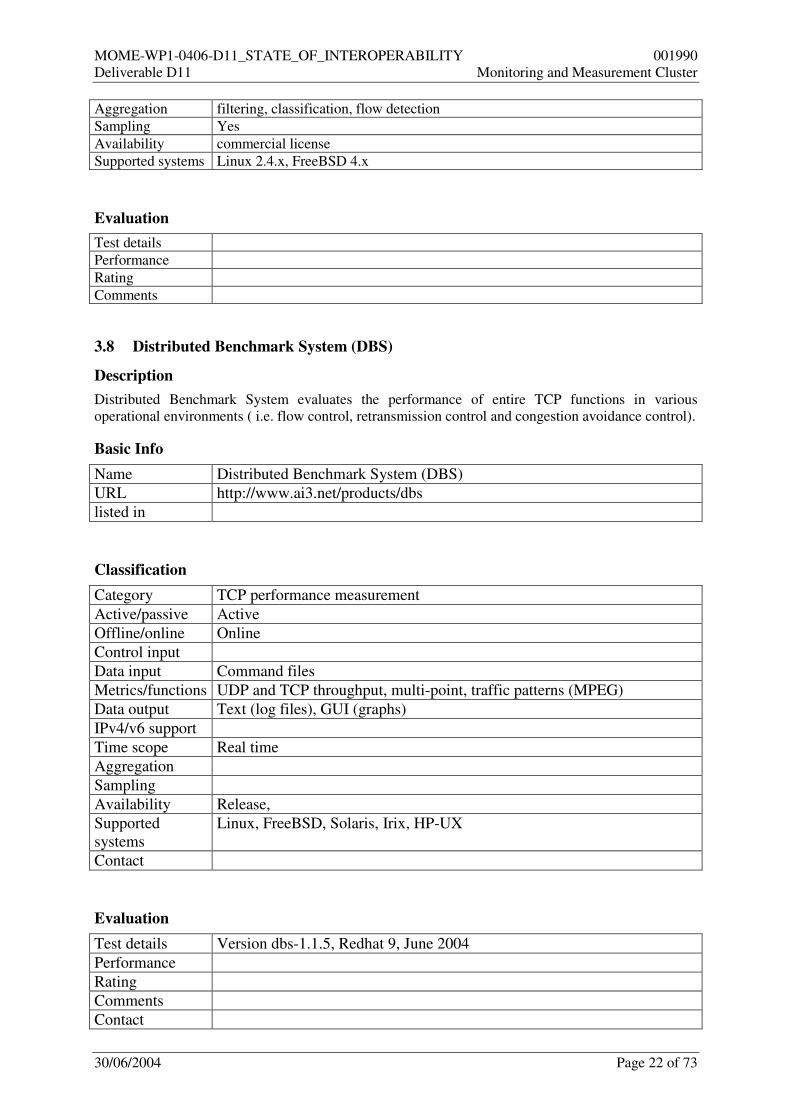
3.8 Distributed Benchmark System (DBS)
Description
Distributed Benchmark System evaluates the performance of entire TCP functions in various
operational environments ( i.e. flow control, retransmission control and congestion avoidance control).
Basic Info
Name Distributed Benchmark System (DBS)
URL http://www.ai3.net/products/dbs
listed in
Classification
Category TCP performance measurement
Active/passive Active
Offline/online Online
Control input
Data input Command files
Metrics/functions UDP and TCP throughput, multi-point, traffic patterns (MPEG)
Data output Text (log files), GUI (graphs)
IPv4/v6 support
Time scope Real time
Aggregation
Sampling
Availability Release,
Supported
systems
Linux, FreeBSD, Solaris, Irix, HP-UX
Contact
Evaluation
Test details Version dbs-1.1.5, Redhat 9, June 2004
Performance
Rating
Comments
Contact

MOME-WP1-0406-D11_STATE_OF_INTEROPERABILITY 001990
Deliverable D11 Monitoring and Measurement Cluster
30/06/2004 Page 23 of 73
3.9 Distributed Internet Traffic Generator (D-ITG)
Description
The Distributed Internet Traffic Generator (D-ITG) is a platform capable to produce traffic (network,
transport and application layer) and accurately replicate appropriate stochastic processes for both IDT
(Inter Departure Time) and PS (Packet Size) random variables (exponential, uniform, cauchy, normal,
pareto, etc.)
Basic Info
Name D-ITG - Distributed Internet Traffic Generator
URL http://www.grid.unina.it/software/ITG/
listed in
Classification
Category traffic generator
Active/passive active
Offline/online online
Control input CLI, web based GUI is planned
Data input text logfile
Metrics/functions D-ITG can perform both one-way-delay (OWD) measurement and round-trip-
time (RTT) measurement, packet loss evaluation, jitter and throughput
measurement.
It presents both a multithread and a multitask implementation.
The supported protocols are: TCP, UDP, ICMP, DNS, Telnet, VoIP (G.711,
G.723, G.729, Voice Activity Detection, Compressed RTP).
Data output In the former, a log server is used by senders and receivers to log data (both
communications sender-log server and receiver-log server are carried out using a
TCP or UDP communication). In the latter, processes of both senders and
receivers use the MPI library.
IPv4/v6 support
Time scope real-time
Aggregation
Sampling
Availability License: no license information (free?),
distribution: binary for windows, source code for linux
current version: 2.3 (april 2004)
Supported systems Linux, Windows and Linux Familiar platform
Evaluation
Test details Michael Kundt, April 2004, SuSE Linux
Performance
Rating
Comments

MOME-WP1-0406-D11_STATE_OF_INTEROPERABILITY 001990
Deliverable D11 Monitoring and Measurement Cluster
30/06/2004 Page 24 of 73
3.10 Dsniff
Description
Dsniff is a collection of tools for network auditing and penetration testing. dsniff, filesnarf, mailsnarf,
msgsnarf, urlsnarf, and webspy passively monitor a network for interesting data (passwords, e-mail,
files, etc.). arpspoof, dnsspoof, and macof facilitate the interception of network traffic normally
unavailable to an attacker (e.g, due to layer-2 switching). sshmitm and webmitm implement active
monkey-in-the-middle attacks against redirected SSH and HTTPS sessions by exploiting weak
bindings in ad-hoc PKI.
dsniff Simple password sniffer. handles FTP, Telnet, HTTP, POP, NNTP, IMAP, SNMP, LDAP, Rlogin,
NFS, SOCKS, X11, IRC, AIM, CVS, ICQ, Napster, Citrix ICA, Symantec pcAnywhere, NAI Sniffer,
Microsoft SMB, and Oracle SQL*Net auth info. goes beyond most sniffers in that it minimally parses
each application protocol, only saving the "interesting" bits. uses Berkeley DB as its output file
format, logging only unique auth info. supports full TCP/IP reassembly, courtesy of libnids (all of the
following tools do, as well).
mailsnarf A fast and easy way to violate the Electronic Communications Privacy Act of 1986 (18 USC 2701-
2711), be careful! Outputs all messages sniffed from SMTP traffic in Berkeley mbox format, suitable
for offline browsing with your favorite mail reader (mail -f, pine, etc.).
urlsnarf Output all requested URLs sniffed from HTTP traffic in CLF (Common Log Format, used by almost
all web servers), suitable for offline post-processing with your favorite web log analysis tool (analog,
wwwstat, etc.).
webspy Sends URLs sniffed from a client to your local Netscape browser for display, updated in real-time (as
the target surfs, your browser surfs along with them, automagically).
Basic Info
Name dsniff
URL http://monkey.org/~dugsong/dsniff/, http://www.datanerds.net/~mike/dsniff.html
listed in
Classification
Category network sniffing toolset
Active/passive passive
Offline/online online
Control input CLI, configuration files
Data input
Metrics/functions decode many application level protocols (see description)
Data output human readable logfiles, ASCII output to terminal
IPv4/v6 support
Time scope
Aggregation
Sampling no
Availability open source
Supported systems OpenBSD, Linux, Solaris, and WIN32
Contact Dug Song <[email protected]>
MOME-WP1-0406-D11_STATE_OF_INTEROPERABILITY 001990
Deliverable D11 Monitoring and Measurement Cluster
30/06/2004 Page 25 of 73
Evaluation
Test details version 2.3, Carsten Schmoll, 25.06.2004
Performance
Rating
Comments
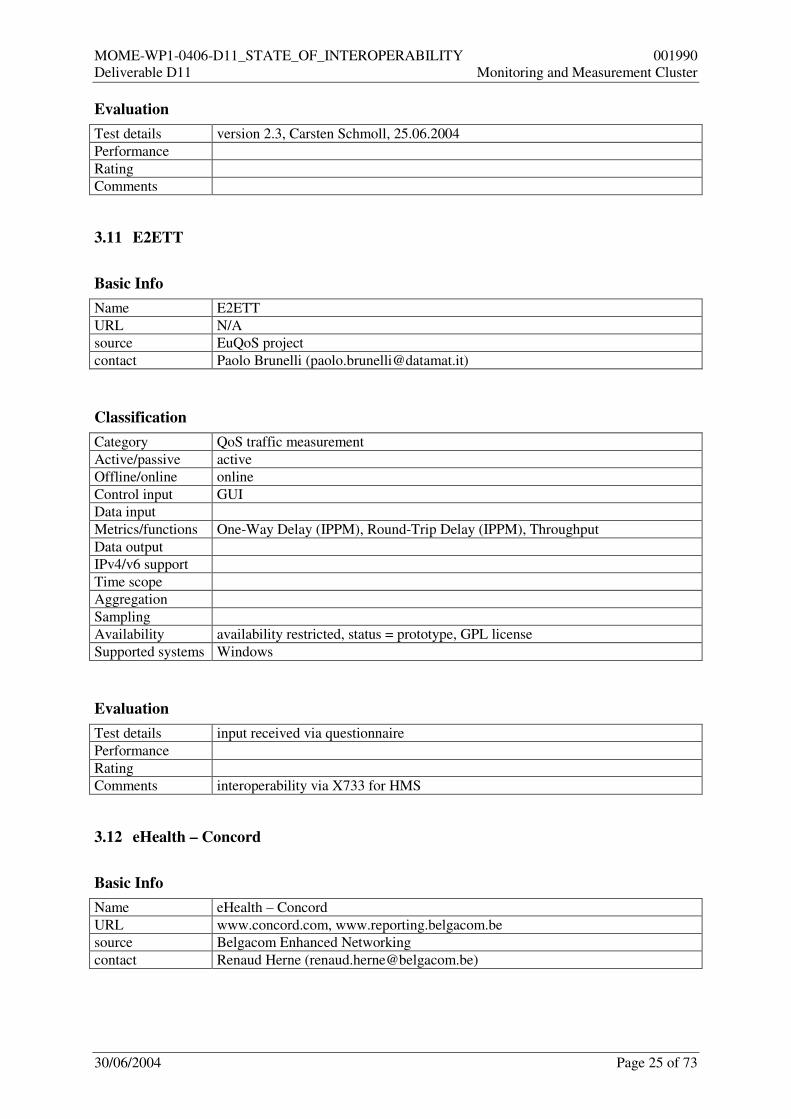
3.11 E2ETT
Basic Info
Name E2ETT
URL N/A
source EuQoS project
contact Paolo Brunelli ([email protected])
Classification
Category QoS traffic measurement
Active/passive active
Offline/online online
Control input GUI
Data input
Metrics/functions One-Way Delay (IPPM), Round-Trip Delay (IPPM), Throughput
Data output
IPv4/v6 support
Time scope
Aggregation
Sampling
Availability availability restricted, status = prototype, GPL license
Supported systems Windows
Evaluation
Test details input received via questionnaire
Performance
Rating
Comments interoperability via X733 for HMS
3.12 eHealth – Concord
Basic Info
Name eHealth – Concord
URL www.concord.com, www.reporting.belgacom.be
source Belgacom Enhanced Networking
contact Renaud Herne ([email protected])

MOME-WP1-0406-D11_STATE_OF_INTEROPERABILITY 001990
Deliverable D11 Monitoring and Measurement Cluster
30/06/2004 Page 26 of 73
Classification
Category WAN, LAN, IT Reporting
Active/passive both, direct measurement
Offline/online both
Control input configuration files (proprietory DCI file), CLI, GUI, SNMP
Data input
Metrics/functions Connectivity (IPPM), One-Way Delay (IPPM), Round-Trip Delay (IPPM), Delay
Variation (IPPM), Packet Loss (IPPM), Throughput, Used Bandwidth, Available
Bandwidth, Bulk Data Transfer Capacity (IPPM), Link Capacity
Data output to files (HTML, PDF, ASCII), stdout, GUI,
IPv4/v6 support IPv4
Time scope
Aggregation yes
Sampling yes
Availability commercial, version 5.6.5 (stable production release),
Company licence based on number of used elements
Supported systems Solaris
Evaluation
Test details input received via questionnaire
Performance
Rating
Comments import/export interoperability available via import/export filters
3.13 Ethereal
Description
Ethereal is a program for troubleshooting, analysis, software and protocol development, and education.
It offers a large variety of protocol analyzer functions. Ethereal can capture packets online or read
them from a file. Online packet capturing is supported for Ethernet, FDDI, PPP, Token-Ring, IEEE
802.11, Classical IP over ATM, and loopback interfaces. Captured network data can be browsed via a
GUI or CLI.
Basic Info
Name Ethereal
URL http://www.ethereal.com/
listed in
Classification
Category performance measurement, traffic analysis, visualisation
Active/passive Passive
Offline/online Online/Offline
Control input GUI, CLI

MOME-WP1-0406-D11_STATE_OF_INTEROPERABILITY 001990
Deliverable D11 Monitoring and Measurement Cluster
30/06/2004 Page 27 of 73
Data input Libpcap, file, gzipped file
Supported file formats: tcpdump; NAI's Sniffer™ (compressed and
uncompressed); Sniffer™ Pro; NetXray™;Sun snoop and atmsnoop;
Shomiti/Finisar Surveyor; AIX's iptrace; Microsoft's Network Monitor; Novell's
LANalyzer; RADCOM's WAN/LAN Analyzer; HP-UX nettl; i4btrace from the
ISDN4BSD project; Cisco Secure IDS iplog; the pppd log (pppdump-format); the
AG Group's/WildPacket's EtherPeek/TokenPeek/AiroPeek; Visual Networks'
Visual UpTime; Lucent/Ascend WAN router traces; Toshiba ISDN router traces;
VMS's TCPIPtrace utility; DBS Etherwatch utility for VMS.
Metrics/functions available bandwidth, utilisation (bandwidth, protocol, ports), protocol analysis,
jitter ( IPDV, payload), loss, packet capturing, accounting, throughput/goodput,
packet reordering, multicast
Data output GUI, CLI, dump files
IPv4/v6 support IPv4 and IPv6
Time scope Real-time
Aggregation filtering, classification, flow detection, aggregation
Sampling No
Availability GPL
Supported systems FreeBSD, OpenBSD, NetBSD, Linux, HP-UX, Solaris, Mac OS X, BeOS AIX,
Windows, Irix, UnixWare
Evaluation
Test details MacOS 10.3, June 2004, Jürgen Quittek
Performance
Rating
Comments
3.14 Ettercap
Description
Ettercap is a suite for man in the middle attacks on LAN. It features sniffing of live connections,
content filtering on the fly and many other interesting tricks. It supports active and passive dissection
of many protocols (even ciphered ones) and includes many features for network and host analysis.
Basic Info
Name Ettercap
URL http://ettercap.sourceforge.net
listed in CAIDA, Sourceforge
Classification
Category Network sniffing
Active/passive Passive
Offline/online online
Control input GUI
Data input GUI
Metrics/functions Packet sniffer, network protocol analyser
Data output GUI, libpcap, text files
IPv4/v6 support
MOME-WP1-0406-D11_STATE_OF_INTEROPERABILITY 001990
Deliverable D11 Monitoring and Measurement Cluster
30/06/2004 Page 28 of 73
Time scope Real-time
Aggregation
Sampling
Availability Release, Opensource
Supported
systems
Windows 9x/NT/2000/XP, Linux 2.x, FreeBSD 4.x 5.x, OpenBSD 2.[789]
3.x, Solaris 2.x, NetBSD 1.5 Mac OS X (darwin 1.3 1.4 5.1 6.x 7.x)
Contact Alberto Ornaghi ([email protected])
Marco Valleri ([email protected])
Evaluation
Test details ettercap-0.6.9, Readhat 9, June 2004
Performance
Rating
Comments
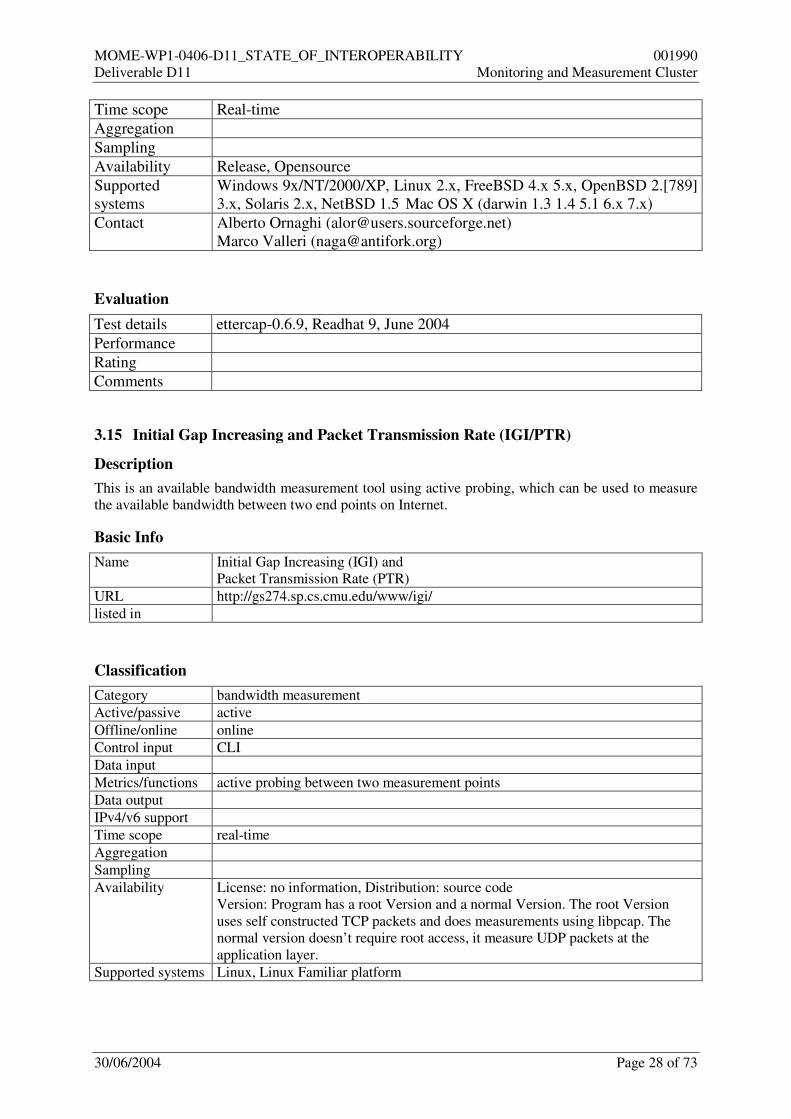
3.15 Initial Gap Increasing and Packet Transmission Rate (IGI/PTR)
Description
This is an available bandwidth measurement tool using active probing, which can be used to measure
the available bandwidth between two end points on Internet.
Basic Info
Name Initial Gap Increasing (IGI) and
Packet Transmission Rate (PTR)
URL http://gs274.sp.cs.cmu.edu/www/igi/
listed in
Classification
Category bandwidth measurement
Active/passive active
Offline/online online
Control input CLI
Data input
Metrics/functions active probing between two measurement points
Data output
IPv4/v6 support
Time scope real-time
Aggregation
Sampling
Availability License: no information, Distribution: source code
Version: Program has a root Version and a normal Version. The root Version
uses self constructed TCP packets and does measurements using libpcap. The
normal version doesn’t require root access, it measure UDP packets at the
application layer.
Supported systems Linux, Linux Familiar platform
MOME-WP1-0406-D11_STATE_OF_INTEROPERABILITY 001990
Deliverable D11 Monitoring and Measurement Cluster
30/06/2004 Page 29 of 73
Evaluation
Test details Michael Kundt, April 2004, SuSE Linux
Performance
Rating
Comments IGI/PTR uses the packet dispersion probing mechanism. Multiple packet pairs are
sent with increasing gap size. The IGI algorithm computes the rate of the
competing traffic while the PTR algorithm computes the available bandwidth.
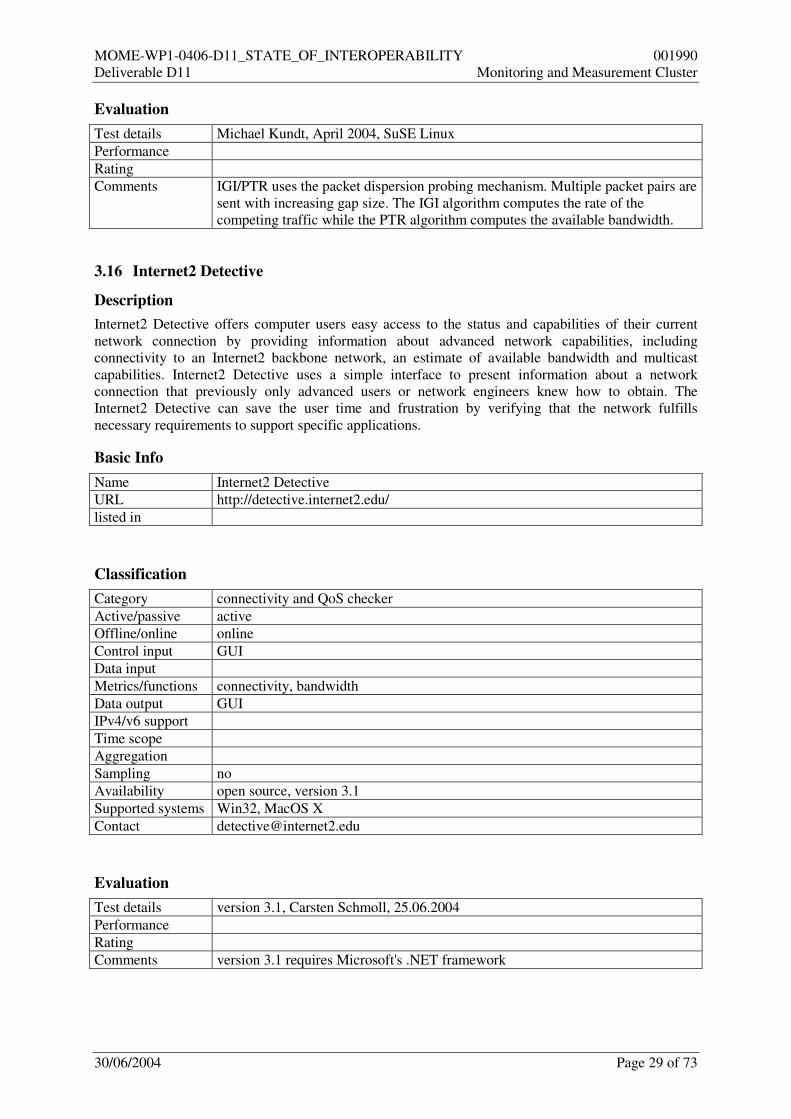
3.16 Internet2 Detective
Description
Internet2 Detective offers computer users easy access to the status and capabilities of their current
network connection by providing information about advanced network capabilities, including
connectivity to an Internet2 backbone network, an estimate of available bandwidth and multicast
capabilities. Internet2 Detective uses a simple interface to present information about a network
connection that previously only advanced users or network engineers knew how to obtain. The
Internet2 Detective can save the user time and frustration by verifying that the network fulfills
necessary requirements to support specific applications.
Basic Info
Name Internet2 Detective
URL http://detective.internet2.edu/
listed in
Classification
Category connectivity and QoS checker
Active/passive active
Offline/online online
Control input GUI
Data input
Metrics/functions connectivity, bandwidth
Data output GUI
IPv4/v6 support
Time scope
Aggregation
Sampling no
Availability open source, version 3.1
Supported systems Win32, MacOS X
Contact [email protected]
Evaluation
Test details version 3.1, Carsten Schmoll, 25.06.2004
Performance
Rating
Comments version 3.1 requires Microsoft's .NET framework

MOME-WP1-0406-D11_STATE_OF_INTEROPERABILITY 001990
Deliverable D11 Monitoring and Measurement Cluster
30/06/2004 Page 30 of 73
3.17 Ipband
Description
ipband is a pcap based IP traffic monitor. It tallies per-subnet traffic and bandwidth usage
and starts detailed logging if specified threshold for the specific subnet is exceeded. If traffic
has been high for a certain period of time, the report for that subnet is generated which can be
appended to a file or e-mailed. When bandwidth usage drops below the threshold, detailed
logging for the subnet is stopped and memory is freed.
This utility could be handy in a limited bandwidth WAN environment (frame relay, ISDN etc.
circuits) to pinpoint offending traffic source if certain links become saturated to the point
where legitimate packets start getting dropped.
Basic Info
Name ipband
URL http://ipband.sourceforge.net/
listed in SourceForge
Classification
Category bandwidth watchdog tool with alerting functions
Active/passive passive
Offline/online online
Control input CLI, configuration file
Data input live traffic
Metrics/functions volume, bandwidth,
Data output human readable ASCII reports or files
IPv4/v6 support IPv4
Time scope seconds, minutes, hours
Aggregation yes
Sampling no
Availability open source, GPL, version 0.7.2
Supported systems UNIX, Linux
Contact not available
Evaluation
Test details version 3.1, Carsten Schmoll, 25.06.2004
Performance
Rating
Comments
3.18 Iperf
Description
Iperf is a tool to measure maximum TCP bandwidth, allowing the tuning of various parameters and
UDP characteristics. Iperf reports bandwidth, delay jitter, datagram loss.

MOME-WP1-0406-D11_STATE_OF_INTEROPERABILITY 001990
Deliverable D11 Monitoring and Measurement Cluster
30/06/2004 Page 31 of 73
Basic Info
Name Iperf
URL http://dast.nlanr.net/Projects/Iperf
listed in CAIDA
Classification
Category QoS & Performance measurement
Active/passive Active
Offline/online Online
Control input CLI, GUI
Data input Live traffic
Metrics/functions TCP and UDP bandwidth performance, datagram delay, jitter, loss
Data output Text
IPv4/v6 support Both
Time scope Real-time
Aggregation
Sampling
Availability Release Version 1.7.0, Free
Supported
systems
Unix; win32
Contact
Evaluation
Test details Version 1.7.0, Redhat 9, June 2004
Performance
Rating
Comments
3.19 JFFNMS
Description
JFFNMS is a Network Management System designed to mantain a IP SNMP / Syslog / Tacacs+
Network. It can be used to monitor any standards compilant SNMP device, Server, TCP port or
Custom Poller, also it has some Cisco oriented features.
Basic Info
Name Just-For-Fun Network Management System (JFFNMS)
URL http://www.jffnms.org/
listed in
Classification
Category network management
Active/passive
Offline/online
Control input WebGUI

MOME-WP1-0406-D11_STATE_OF_INTEROPERABILITY 001990
Deliverable D11 Monitoring and Measurement Cluster
30/06/2004 Page 32 of 73
Data input via GUI (from user), via SNMP (from devices)
Metrics/functions Tacacs+ Authentication and Accounting, Syslog Logging with PCRE Matching,
SNMP Trap Handler, TFTP Configuration Download and Archival (Cisco IOS &
CatOS), Smokeping, MSyslog (custom) and Syslog-NG Support, fping, reach-
ability and Packet Loss, NTP Synchronization Verification, NMAP for TCP Port
Discovery, Linux TC (traffic shapper) via custom net-snmp plugin, for TC Class
Graphing
Data output Status Map, gives you a quick look of all your network
Output in database: MySQL, Postgres, CVS Export
IPv4/v6 support
Time scope
Aggregation
Sampling
Availability written in PHP4, available incl. source code, License: GNU GPL
Supported systems Win32, Linux, FreeBSD
Evaluation
Test details Michael Kundt, May 2004, SuSE Linux
Performance
Rating
Comments
3.20 Libpcap
Description
The system library packet capturing called libpcap is the most commonly used library for capturing IP
packets at network interface cards. It is available for most common PC and workstation operating
systems. Libpcap captures packets by creating copies of portions of the packets, for example the first
60 bytes. Captured portions (or entire packets) are forwarded to the application using libpcap, either
by a callback function or as result of a function polling the library. Libpcap can filter packets. Filtering
is specified using the Berkeley Packet filter syntax. The performance of libpcap varies significantly
between different operating systems. On BSD-based systems, libpcap works highly reliable on most
common network interface cards. Older Linux versions (up to 0.4) of libpcap already start loosing
packets at a speed of a few Megabits due to buffer overruns.
Basic Info
Name libpcap
URL http://www.tcpdump.org/
listed in
Classification
Category Traffic measurement
Active/passive Passive
Offline/online Online
Control input libpcap API
Data input Traffic observed at network interface cards
Metrics/functions packet capturing
Data output libpcap API
IPv4/v6 support IPv4 and IPv6
Time scope Real-time

MOME-WP1-0406-D11_STATE_OF_INTEROPERABILITY 001990
Deliverable D11 Monitoring and Measurement Cluster
30/06/2004 Page 33 of 73
Aggregation Filtering
Sampling No
Availability BSD
Supported systems FreeBSD, NetBSD, OpenBSD, MacOS X, Solaris, SunOS, DEC OSF/1, Digital
UNIX, Tru64 UNIX, Ultrix, HP-UX, AIX, Linux, NeXTSTEP, SINIX, SCO
Unix, UnixWare
Evaluation
Test details Solaris 8 and MacOS 10.3, June 2004, Jürgen Quittek
Performance
Rating
Comments
3.21 LFT
Description
LFT, short for Layer Four Traceroute, is a sort of 'traceroute' that often works much faster (than the
commonly-used Van Jacobson method) and goes through many configurations of packet-filter based
firewalls. More importantly, LFT implements numerous other features including AS number lookups,
loose source routing, netblock name lookups, et al.
Rather than launching UDP probes in an attempt to elicit ICMP TIME_EXCEEDEDs from hosts in
the path, LFT accomplishes substantively the same effect using TCP SYN or FIN probes. Then, LFT
listens for TIME_EXCEEDED messages, TCP RESET, and various other interesting heuristics from
firewalls or other gateways in the path.
Basic Info
Name LFT
URL http://www.mainnerve.com/lft/
listed in FreshMeat
Classification
Category Alternative traceroute
Active/passive active
Offline/online online
Control input CLI
Data input
Metrics/functions connectivity, round trip time
Data output ASCII on terminal
IPv4/v6 support
Time scope
Aggregation
Sampling
Availability open source, version 2.2
Supported systems Linux, Win32 (requires Cygwin), PPC, Zaurus
Contact http://www.mainnerve.com/contactus.html
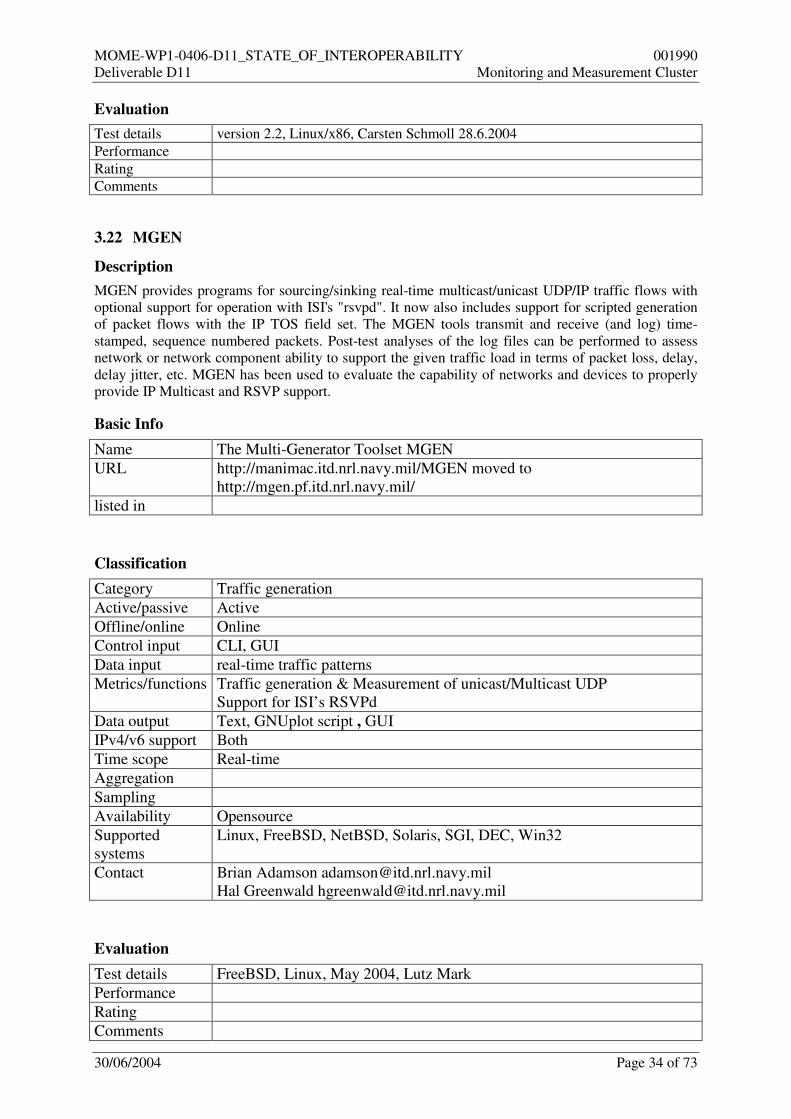
MOME-WP1-0406-D11_STATE_OF_INTEROPERABILITY 001990
Deliverable D11 Monitoring and Measurement Cluster
30/06/2004 Page 34 of 73
Evaluation
Test details version 2.2, Linux/x86, Carsten Schmoll 28.6.2004
Performance
Rating
Comments
3.22 MGEN
Description
MGEN provides programs for sourcing/sinking real-time multicast/unicast UDP/IP traffic flows with
optional support for operation with ISI's "rsvpd". It now also includes support for scripted generation
of packet flows with the IP TOS field set. The MGEN tools transmit and receive (and log) time-
stamped, sequence numbered packets. Post-test analyses of the log files can be performed to assess
network or network component ability to support the given traffic load in terms of packet loss, delay,
delay jitter, etc. MGEN has been used to evaluate the capability of networks and devices to properly
provide IP Multicast and RSVP support.
Basic Info
Name The Multi-Generator Toolset MGEN
URL http://manimac.itd.nrl.navy.mil/MGEN moved to
http://mgen.pf.itd.nrl.navy.mil/
listed in
Classification
Category Traffic generation
Active/passive Active
Offline/online Online
Control input CLI, GUI
Data input real-time traffic patterns
Metrics/functions Traffic generation & Measurement of unicast/Multicast UDP
Support for ISI’s RSVPd
Data output Text, GNUplot script , GUI
IPv4/v6 support Both
Time scope Real-time
Aggregation
Sampling
Availability Opensource
Supported
systems
Linux, FreeBSD, NetBSD, Solaris, SGI, DEC, Win32
Contact Brian Adamson [email protected]
Hal Greenwald [email protected]
Evaluation
Test details FreeBSD, Linux, May 2004, Lutz Mark
Performance
Rating
Comments

MOME-WP1-0406-D11_STATE_OF_INTEROPERABILITY 001990
Deliverable D11 Monitoring and Measurement Cluster
30/06/2004 Page 35 of 73
3.23 Multi Router Traffic Grapher (MRTG)
Description
The Multi Router Traffic Grapher (MRTG) is a tool to monitor the traffic load on network-links. It
graphically represents the data SNMP agents brings to SNMP managers. It generates nice HTML
pages with GIF graphics about inbound and outbound traffic in network interfaces in almost real time.
MRTG is based on Perl and C and works under UNIX and Windows NT.
Basic Info
Name Multi Router Traffic Grapher (MRTG)
URL http://people.ee.ethz.ch/~oetiker/webtools/mrtg
listed in CAIDA
Classification
Category Traffic load monitoring
Active/passive Passive
Offline/online Both
Control input CLI
Data input SNMP packets
Metrics/functions MRTG consists of a Perl script which uses SNMP to read the traffic
counters of routers and a C program which logs the traffic data and creates
graphs representing the traffic on the monitored network connection.
These graphs are embedded into webpages which can be viewed from any
modern Web-browser.
Data output GUI: HTML pages containing GIF images which provide a LIVE visual
representation of the traffic
IPv4/v6 support
Time scope ~ Real-time (10ms timers)
Aggregation
Sampling
Availability Gnu GPL
Supported
systems
*nix and Windows NT, 2k
Contact Tobias Oetiker <[email protected]>
Dave Rand <[email protected]>
Evaluation
Test details
Performance
Rating
Comments

MOME-WP1-0406-D11_STATE_OF_INTEROPERABILITY 001990
Deliverable D11 Monitoring and Measurement Cluster
30/06/2004 Page 36 of 73
3.24 MSA
Description
The MSA tool calculates the value of effective bandwidth for traffic from a trace file. It implements
the numerical solution of the supinf formula of the many sources asymptotic. The tool has five basic
functions to compute:
(1) loss probability for specific capacity, buffer, number of sources, and traffic mix,
(2) maximum number of admissible sources for specific capacity, buffer, target loss probability, and
traffic mix,
(3) minimum buffer for specific capacity, number of sources, target loss probability, and traffic mix,
(4) the minimum capacity for specific buffer, number of sources, target loss probability, and traffic
mix, and
(5) effective bandwidth for specific values of s,t (which are the space and time parameter related with
MSA algorithm)
Basic Info
Name MSA
URL http://www.ics.forth.gr/netgroup/msa/software.html
listed in
Classification
Category traffic analysis
Active/passive N/A
Offline/online offline
Control input CLI
Data input Traces, represented as records of number of bits, packets, or cells, transmitted
within intervals of constant length
Metrics/functions Calculates loss probability, minimum buffer, maximum number of admissible
sources, minimum required capacity
Data output Text
IPv4/v6 support
Time scope N/A
Aggregation
Sampling N/A
Availability Executable files can be downloaded. Web interface (Java) available at
http://www.ics.forth.gr/netgroup/msa/interface.html.
Supported systems Solaris, FreeBSD, SunOS
Contact [email protected]
Evaluation
Test details Evaluation based on manual available at
http://www.ics.forth.gr/netgroup/msa/distr/msa.README.
Performance
Rating
Comments
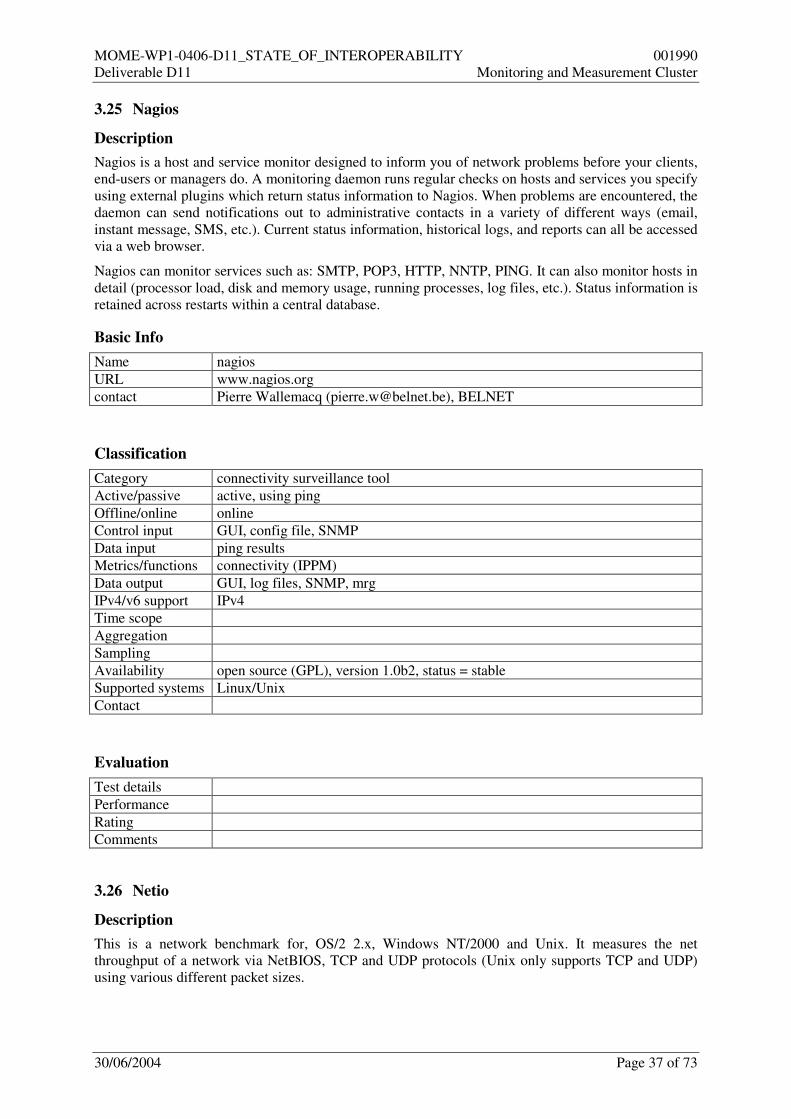
MOME-WP1-0406-D11_STATE_OF_INTEROPERABILITY 001990
Deliverable D11 Monitoring and Measurement Cluster
30/06/2004 Page 37 of 73
3.25 Nagios
Description
Nagios is a host and service monitor designed to inform you of network problems before your clients,
end-users or managers do. A monitoring daemon runs regular checks on hosts and services you specify
using external plugins which return status information to Nagios. When problems are encountered, the
daemon can send notifications out to administrative contacts in a variety of different ways (email,
instant message, SMS, etc.). Current status information, historical logs, and reports can all be accessed
via a web browser.
Nagios can monitor services such as: SMTP, POP3, HTTP, NNTP, PING. It can also monitor hosts in
detail (processor load, disk and memory usage, running processes, log files, etc.). Status information is
retained across restarts within a central database.
Basic Info
Name nagios
URL www.nagios.org
contact Pierre Wallemacq ([email protected]), BELNET
Classification
Category connectivity surveillance tool
Active/passive active, using ping
Offline/online online
Control input GUI, config file, SNMP
Data input ping results
Metrics/functions connectivity (IPPM)
Data output GUI, log files, SNMP, mrg
IPv4/v6 support IPv4
Time scope
Aggregation
Sampling
Availability open source (GPL), version 1.0b2, status = stable
Supported systems Linux/Unix
Contact
Evaluation
Test details
Performance
Rating
Comments
3.26 Netio
Description
This is a network benchmark for, OS/2 2.x, Windows NT/2000 and Unix. It measures the net
throughput of a network via NetBIOS, TCP and UDP protocols (Unix only supports TCP and UDP)
using various different packet sizes.

MOME-WP1-0406-D11_STATE_OF_INTEROPERABILITY 001990
Deliverable D11 Monitoring and Measurement Cluster
30/06/2004 Page 38 of 73
Basic Info
Name netio
URL http://freshmeat.net/projects/netio/
http://ftp.leo.org/pub/comp/os/os2/leo/systools/netio123.zip
listed in FreshMeat
contact Kai-Uwe Rommel
Classification
Category performance measurement
Active/passive active
Offline/online online
Control input none
Data input CLI, captures traffic generated by other netio instance
Metrics/functions throughput of a network via NetBIOS, TCP and UDP
protocols (Unix only supports TCP and UDP) using various different packet sizes
Data output ASCII to console
IPv4/v6 support both
Time scope
Aggregation
Sampling no
Availability free for non-commercial use
Supported systems OS/2 2.x, all Windows versions, Unix/Linux, Solaris
Evaluation
Test details Version 1.23 on SuSE Linux, Michael Kundt, May 2004
Performance
Rating
Comments
3.27 nBox86
Description
NBox86 is a Linux-based operating system for an x86 PC that turns the PC into a NetFlow probe that
can be configured via SSH or a secure web interface.
Basic Info
Name nBox86
URL http://www.ntop.org/nBox86/
listed in
Classification
Category Traffic measurement and export of measured data
Active/passive Passive
Offline/online Online
Control input CLI, web interface
Data input Traffic observed at network interface cards
Metrics/functions packet capturing, accounting

MOME-WP1-0406-D11_STATE_OF_INTEROPERABILITY 001990
Deliverable D11 Monitoring and Measurement Cluster
30/06/2004 Page 39 of 73
Data output NetFlow v5, v9
IPv4/v6 support IPv4 and IPv6
Time scope Real-time
Aggregation Filtering, classification, flow detection
Sampling No
Availability Commercial license
Supported systems x86 PC with i586 processor and up to 3 network interface cards
Evaluation
Test details Pentium 4, 1.4 GHz, 2 x 1GBit NICs, June 2004, Jürgen Quittek
Performance
Rating
Comments
3.28 NetFlow
Description
The NetFlow probe is a module contained in almost all Cisco and Juniper routers. It captures IP
packets at line cards and classifies them into flows based on the 5-tuple (source IP address, destination
IP address, protocol type, source port number, destination port number). Measured flows properties
(timestamp, number of bytes, number of packets) are exported using the NetFlow protocol. NetFlow
versions up to version 8 used a fixed record format. NetFlow version 9 uses a template-based approach
as the IETF IPFIX standard does. The most commonly used version is version 5. NetFlow probes are
considered as highly reliable modules that can be configured such that they hardly miss a packet. On
high speed routers this is achieved by implementing parts of it in hardware. However, the transport of
NetFlow records using UDP is highly unreliable.
Basic Info
Name NetFlow
URL http://www.cisco.com/warp/public/732/Tech/nmp/netflow/index.shtml
listed in
Classification
Category Connectivity checking, performance measurement
Active/passive Active
Offline/online Online
Control input CLI
Data input Observed packets at network interface cards
Metrics/functions Packet capturing
Data output NetFlow
IPv4/v6 support IPv4 and IPv6 (version 9)
Time scope Real-time
Aggregation classification, flow detection
Sampling No
Availability Commercial license, included in IOS, JunOS
Supported systems Almost all Cisco and Juniper routers
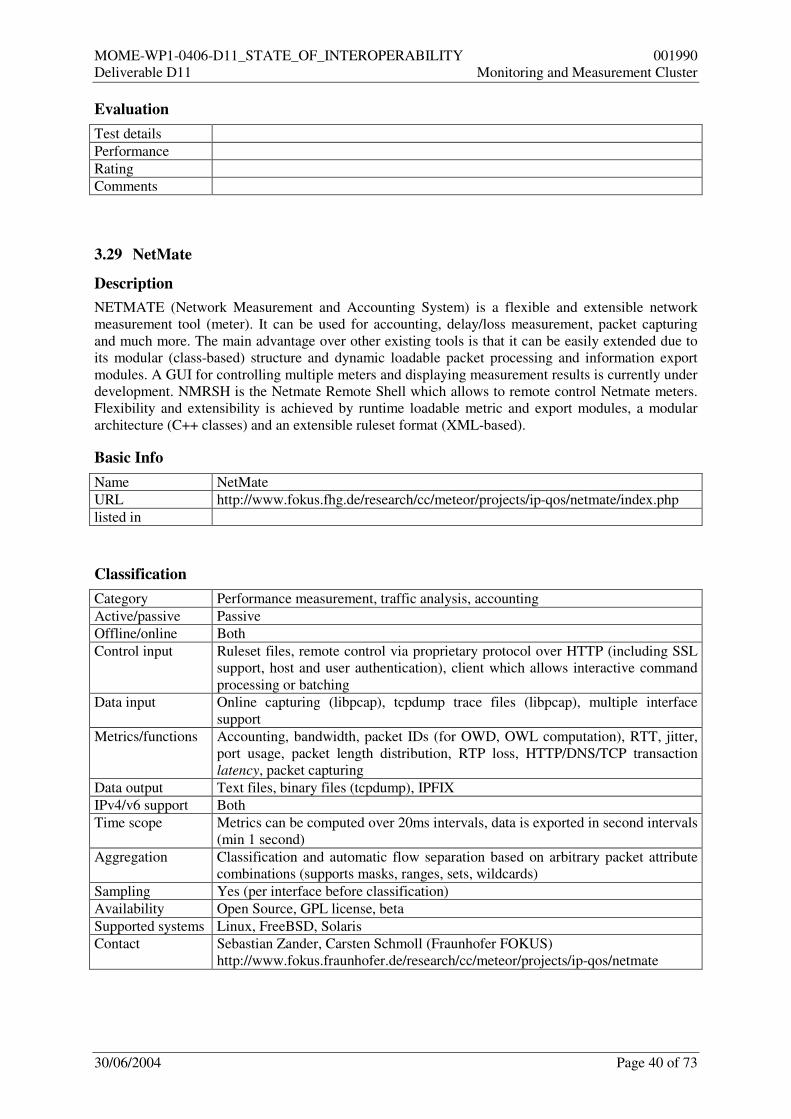
MOME-WP1-0406-D11_STATE_OF_INTEROPERABILITY 001990
Deliverable D11 Monitoring and Measurement Cluster
30/06/2004 Page 40 of 73
Evaluation
Test details
Performance
Rating
Comments
3.29 NetMate
Description
NETMATE (Network Measurement and Accounting System) is a flexible and extensible network
measurement tool (meter). It can be used for accounting, delay/loss measurement, packet capturing
and much more. The main advantage over other existing tools is that it can be easily extended due to
its modular (class-based) structure and dynamic loadable packet processing and information export
modules. A GUI for controlling multiple meters and displaying measurement results is currently under
development. NMRSH is the Netmate Remote Shell which allows to remote control Netmate meters.
Flexibility and extensibility is achieved by runtime loadable metric and export modules, a modular
architecture (C++ classes) and an extensible ruleset format (XML-based).
Basic Info
Name NetMate
URL http://www.fokus.fhg.de/research/cc/meteor/projects/ip-qos/netmate/index.php
listed in
Classification
Category Performance measurement, traffic analysis, accounting
Active/passive Passive
Offline/online Both
Control input Ruleset files, remote control via proprietary protocol over HTTP (including SSL
support, host and user authentication), client which allows interactive command
processing or batching
Data input Online capturing (libpcap), tcpdump trace files (libpcap), multiple interface
support
Metrics/functions Accounting, bandwidth, packet IDs (for OWD, OWL computation), RTT, jitter,
port usage, packet length distribution, RTP loss, HTTP/DNS/TCP transaction
latency, packet capturing
Data output Text files, binary files (tcpdump), IPFIX
IPv4/v6 support Both
Time scope Metrics can be computed over 20ms intervals, data is exported in second intervals
(min 1 second)
Aggregation Classification and automatic flow separation based on arbitrary packet attribute
combinations (supports masks, ranges, sets, wildcards)
Sampling Yes (per interface before classification)
Availability Open Source, GPL license, beta
Supported systems Linux, FreeBSD, Solaris
Contact Sebastian Zander, Carsten Schmoll (Fraunhofer FOKUS)
http://www.fokus.fraunhofer.de/research/cc/meteor/projects/ip-qos/netmate

MOME-WP1-0406-D11_STATE_OF_INTEROPERABILITY 001990
Deliverable D11 Monitoring and Measurement Cluster
30/06/2004 Page 41 of 73
Evaluation
Test details Version 0.8, SUSE Linux 8.1, 18.05.2004, Sebastian Zander
Performance
Rating
Comments Configurable multithreading support
3.30 NetPipe
Description
NetPIPE is a protocol independent performance tool that encapsulates the best of ttcp and netperf and
visually represents the network performance under a variety of conditions. It performs simple ping-
pong tests, bouncing messages of increasing size between two processes, whether across a network or
within an SMP system. Message sizes are chosen at regular intervals, and with slight perturbations, to
provide a complete test of the communication system. Each data point involves many ping-pong tests
to provide an accurate timing. Latencies are calculated by dividing the round trip time in half for small
messages ( < 64 Bytes ).
Basic Info
Name NetPipe - Network Protocol Independent Performance Evaluator
URL http://www.scl.ameslab.gov/netpipe
listed in
Classification
Category performance measurement
Active/passive active
Offline/online online
Control input CLI
Data input
Metrics/functions latency, throughput
Data output chart
IPv4/v6 support both
Time scope
Aggregation
Sampling
Availability No information about license
Supported systems
Evaluation
Test details version 3.6.2, Michael Kundt, May 2004
Performance
Rating
Comments
3.31 nProbe
Description
Nprobe is a program that collects traffic information using libpcap and exports it via the NetFlow
protocol.

MOME-WP1-0406-D11_STATE_OF_INTEROPERABILITY 001990
Deliverable D11 Monitoring and Measurement Cluster
30/06/2004 Page 42 of 73
Basic Info
Name nProbe
URL http://www.ntop.org/nProbe.html
listed in
Classification
Category Traffic measurement and export of measured data
Active/passive Passive
Offline/online Online
Control input CLI
Data input libpcap
Metrics/functions Packet capturing, accounting
Data output NetFlow v5 and v9
IPv4/v6 support IPv4 and IPv6
Time scope Real-time
Aggregation Filtering, classification, flow detection
Sampling No
Availability GPL
Supported systems FreeBD, Linux, Solaris, Irix, AIX, Mac OS X, Windows 95/98/me/NT/2K/XP
Evaluation
Test details Max OS X 10.3, June 2004, Jürgen Quittek
Performance
Rating
Comments
3.32 Ntop
Description
Ntop (network top) is a program that measures, displays and stores IP traffic properties. It is part of
many open source operating system distributions and can be accessed via CLI or web browser. Ntop is
a powerful traffic measurement tool that supports many protocols and can be used for sophisticated
traffic classification and analysis.
Basic Info
Name ntop
URL http://www.ntop.org/
listed in
Classification
Category performance measurement, traffic analysis, visualisation
Active/passive Passive
Offline/online Online, offline possible
Control input CLI, (secure) web interface
Data input libpcap, NetFlow v5, v9, sFlow

MOME-WP1-0406-D11_STATE_OF_INTEROPERABILITY 001990
Deliverable D11 Monitoring and Measurement Cluster
30/06/2004 Page 43 of 73
Metrics/functions Metrics: utilisation (bandwidth, protocol, ports), protocol analysis, packet
capturing, accounting, packet reordering, multicast
Functions:
- Sort network traffic according to many protocols
- Show network traffic sorted according to various criteria
- Display traffic statistics
- Identify the indentity (e.g. email address) of computer users
- Passively (i.e. withou sending probe packets) identify the host OS
- Show IP traffic distribution among the various protocols
- Analyse IP traffic and sort it according to the source/destination
- Display IP Traffic Subnet matrix (who's talking to who?)
- Report IP protocol usage sorted by protocol type
- Act as a NetFlow/sFlow collector for flows generated by routers (e.g.
Cisco and Juniper) or switches (e.g. Foundry Networks)
- Produce RMON-like network traffic statistics
Data output GUI, RDD file format (see http://people.ee.ethz.ch/~oetiker/webtools/rrdtool/),
web frontend (features built-in http server)
IPv4/v6 support IPv4 and IPv6
Time scope Real-time
Aggregation Filtering, classification, flow detection
Sampling No
Availability GPL
Supported systems FreeBD, Linux, Solaris, Irix, AIX, Mac OS X, Windows 95/98/me/NT/2K/XP
Evaluation
Test details Max OS X 10.3, June 2004, Jürgen Quittek
Performance
Rating
Comments
3.33 OpenIMP
Description
The Open Internet Measurement Platform (OpenIMP) has been designed for distributed IP traffic and
quality of service measurements like volume, one-way-delay, jitter and packet loss. It integrates
passive and active measurement components with analysis and visualization functions. It provides
solutions for usage-based accounting, SLA validation, intrusion detection, traffic profiling and other
applications. Due to the modular design and the combination of a variety of components it can be
adapted to the measurement demands of a variety of applications.
A data collector can request measurement result data from several distributed meters and stores it in
the measurement results database. An evaluation server calculates IP QoS metrics like one-way-delay,
jitter and packet loss from these data sets.
Basic Info
Name OpenIMP
URL http://www.fokus.fhg.de/research/cc/meteor/products/content.html
contact Lutz Mark ([email protected])

MOME-WP1-0406-D11_STATE_OF_INTEROPERABILITY 001990
Deliverable D11 Monitoring and Measurement Cluster
30/06/2004 Page 44 of 73
Classification
Category QoS performance measurement, traffic analysis, accounting
Active/passive both
Offline/online online
Control input CLI, web-based GUI
Data input
Metrics/functions Delay Variation (IPPM), Packet Loss (IPPM), Used Bandwidth
Data output write to files (CSV, Space-SV), IPFIX planned
IPv4/v6 support both
Time scope
Aggregation yes
Sampling planned
Availability public, version 1.0, state = prototype, still under development
Supported systems Linux, FreeBSD
Evaluation
Test details FreeBSD, Linux with 2.4 kernel, Lutz Mark, March 2004
Performance
Rating
Comments
3.34 OpenView
Description
OpenView is a commercially available network management system platform by Hewlett Packard. It
offers a network management database, an event handling system, a library for graphical user
interfaces, an SNMP library and a variety of further tools and libraries for implementing network
management functions.
Particularly, OpenView can remotely monitor network traffic at IP interfaces of managed systems by
accessing the corresponding Management Information Base (MIB) modules via the Simple Network
Management Protocol (SNMP). The provided SNMP tools and graphic libraries support graphical
display of measured traffic characteristics, from simple display of all connections at an interface to
display of selected individual TCP or UDP traffic flows between selected hosts.
For OpenView there exists a large number of commercially available network management modules.
A basic and very commonly used one is the Node Manager, also by HP. The Node Manager includes
active topology discovery functions.
Basic Info
Name OpenView
URL http://www.openview.hp.com/
listed in
Classification
Category Topology, performance measurement, traffic analysis,
tools management, visualisation
Active/passive Passive (Node Manager: active)
Offline/online Online, offline possible
Control input GUI, CLI
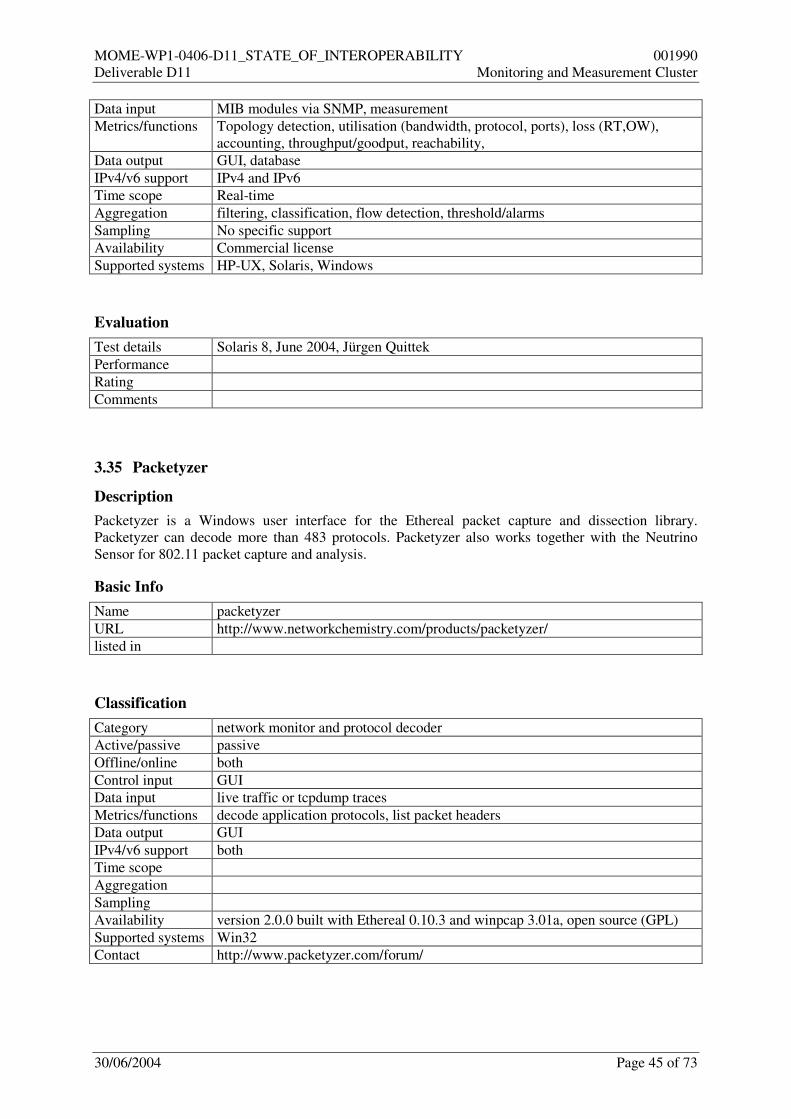
MOME-WP1-0406-D11_STATE_OF_INTEROPERABILITY 001990
Deliverable D11 Monitoring and Measurement Cluster
30/06/2004 Page 45 of 73
Data input MIB modules via SNMP, measurement
Metrics/functions Topology detection, utilisation (bandwidth, protocol, ports), loss (RT,OW),
accounting, throughput/goodput, reachability,
Data output GUI, database
IPv4/v6 support IPv4 and IPv6
Time scope Real-time
Aggregation filtering, classification, flow detection, threshold/alarms
Sampling No specific support
Availability Commercial license
Supported systems HP-UX, Solaris, Windows
Evaluation
Test details Solaris 8, June 2004, Jürgen Quittek
Performance
Rating
Comments
3.35 Packetyzer
Description
Packetyzer is a Windows user interface for the Ethereal packet capture and dissection library.
Packetyzer can decode more than 483 protocols. Packetyzer also works together with the Neutrino
Sensor for 802.11 packet capture and analysis.
Basic Info
Name packetyzer
URL http://www.networkchemistry.com/products/packetyzer/
listed in
Classification
Category network monitor and protocol decoder
Active/passive passive
Offline/online both
Control input GUI
Data input live traffic or tcpdump traces
Metrics/functions decode application protocols, list packet headers
Data output GUI
IPv4/v6 support both
Time scope
Aggregation
Sampling
Availability version 2.0.0 built with Ethereal 0.10.3 and winpcap 3.01a, open source (GPL)
Supported systems Win32
Contact http://www.packetyzer.com/forum/

MOME-WP1-0406-D11_STATE_OF_INTEROPERABILITY 001990
Deliverable D11 Monitoring and Measurement Cluster
30/06/2004 Page 46 of 73
Evaluation
Test details version 2.0.0, winpcap 3.0.1a, Windows2000, Carsten Schmoll 28.6.2004
Performance
Rating
Comments works using ethereal (dlls) as backend, included with installer
3.36 PathChirp
Description
pathChirp is a new active probing tool for estimating the available bandwidth on a communication
network path. Based on the concept of "self-induced congestion," pathChirp features an exponential
flight pattern of probes we call a chirp. Packet chirps offer several significant advantages over current
probing schemes based on packet pairs or packet trains. By rapidly increasing the probing rate within
each chirp, pathChirp obtains a rich set of information from which to dynamically estimate the
available bandwidth.
PathChirp uses packet trains with exponential spaced packets called chirps. It measures interarrival
times and therefore does not require time synchronization. Delay signatures measured are separated
into excursions (segments) where all packets are part of the same busy period.
Basic Info
Name pathChirp
URL http://www.spin.rice.edu/Software/pathChirp/
listed in
Classification
Category
Active/passive
Offline/online
Control input
Data input
Metrics/functions
Data output
IPv4/v6 support
Time scope
Aggregation
Sampling
Availability
Supported systems
Evaluation
Test details
Performance
Rating
Comments

MOME-WP1-0406-D11_STATE_OF_INTEROPERABILITY 001990
Deliverable D11 Monitoring and Measurement Cluster
30/06/2004 Page 47 of 73
3.37 Pathload
Description
Pathload is a measurement methodology that can estimate the available bandwidth of Internet paths.
The basic idea in Pathload is that the one-way delays of a periodic packet stream show increasing
trend when the stream rate is larger than the avail-bw. The measurement algorithm is iterative and it
requires the cooperation of both the sender and the receiver. Pathload in non-intrusive, meaning that it
does not cause significant increases in the network utilization, delays, or losses. The tool has been
verified experimentally, by comparing its results with SNMP utilization data from the path routers.
Pathload implements the self-induces congestion probing methodology. It requires access at both ends
of the path and support a bandwidth range rather than a single estimate. It sends a periodic packet
trains with different rates and measures the one-way delays (OWD). In case of an overload link there
will be an increasing OWD trend (as queue builds up) otherwise there will be a non-increasing trend.
The trends are detected using two algorithms. Because OWD is measured time synchronization of
sender and receiver is required.
Basic Info
Name pathload
URL http://www.cc.gatech.edu/fac/Constantinos.Dovrolis/pathload.html
listed in
Classification
Category
Active/passive
Offline/online
Control input
Data input
Metrics/functions
Data output
IPv4/v6 support
Time scope
Aggregation
Sampling
Availability
Supported systems
Evaluation
Test details
Performance
Rating
Comments

MOME-WP1-0406-D11_STATE_OF_INTEROPERABILITY 001990
Deliverable D11 Monitoring and Measurement Cluster
30/06/2004 Page 48 of 73
3.38 Ping
Description
The ping program sends Internet Control Message Protocol (ICMP) ECHO_REQUEST messages to
specified target hosts and waits for receiving the ICMP ECHO_REPLY message. It measures the
roundtrip time between sending the request and receiving the response. It is available on almost all
operating systems that have an Internet stack.
Basic Info
Name ping
URL http://ftp.arl.mil/~mike/ping.html
listed in
Classification
Category Connectivity checking, performance measurement
Active/passive Active
Offline/online Online
Control input CLI
Data input Received replies
Metrics/functions RTT measurement, reachability
Data output CLI
IPv4/v6 support IPv4 and IPv6
Time scope Real-time
Aggregation None
Sampling No
Availability GNU, BSD, commercial license
Supported systems Included in almost all operation systems with Internet stack
Evaluation
Test details MacOS 10.3, June 2004, Jürgen Quittek
Performance
Rating
Comments
3.39 Rude/Crude
Description
Rude (Real-time UDP Data Emitter) is a tool that generates UDP traffic to the network, which can be
received and logged on the other side of the network with the CRUDE (Collector for RUDE).
Basic Info
Name Rude (Real-time UDP Data Emitter)/ CRUDE (Collector for RUDE)
URL http://rude.sourceforge.net
listed in
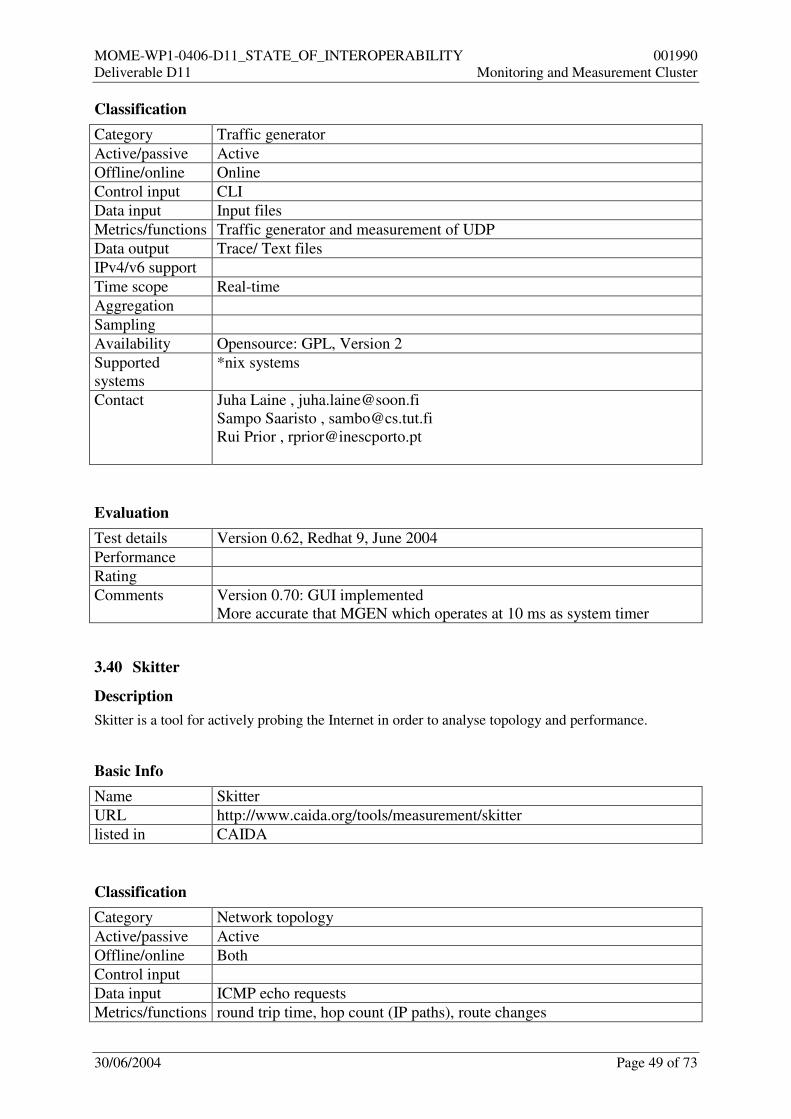
MOME-WP1-0406-D11_STATE_OF_INTEROPERABILITY 001990
Deliverable D11 Monitoring and Measurement Cluster
30/06/2004 Page 49 of 73
Classification
Category Traffic generator
Active/passive Active
Offline/online Online
Control input CLI
Data input Input files
Metrics/functions Traffic generator and measurement of UDP
Data output Trace/ Text files
IPv4/v6 support
Time scope Real-time
Aggregation
Sampling
Availability Opensource: GPL, Version 2
Supported
systems
*nix systems
Contact Juha Laine , [email protected]
Sampo Saaristo , [email protected]
Rui Prior , [email protected]
Evaluation
Test details Version 0.62, Redhat 9, June 2004
Performance
Rating
Comments Version 0.70: GUI implemented
More accurate that MGEN which operates at 10 ms as system timer
3.40 Skitter
Description
Skitter is a tool for actively probing the Internet in order to analyse topology and performance.
Basic Info
Name Skitter
URL http://www.caida.org/tools/measurement/skitter
listed in CAIDA
Classification
Category Network topology
Active/passive Active
Offline/online Both
Control input
Data input ICMP echo requests
Metrics/functions round trip time, hop count (IP paths), route changes

MOME-WP1-0406-D11_STATE_OF_INTEROPERABILITY 001990
Deliverable D11 Monitoring and Measurement Cluster
30/06/2004 Page 50 of 73
Data output Text, GUI; a sample C++ code that processes the skitter traces stored in
raw binary data files and then output them to the normal output channel
(STDOUT) in a Perl-friendly text format.
IPv4/v6 support IPv4
Time scope Real-time
Aggregation aggregate data into a centralized database for correlation and depiction as
top-down, macroscopic view of a cross-section of the Internet
Sampling
Availability
Supported
systems
FreeBSD (from v3.0)
Contact Daniel Anderson ([email protected])
Evaluation
Test details
Performance
Rating
Comments
3.41 Snort
Description
Snort is an intrusion detection program that observes traffic streams for certain patterns. SNORT is
configured by rules specified in a simple proprietary language.
Basic Info
Name Snort
URL http://www.snort.org/
listed in
Classification
Category Traffic analysis, intrusion detection
Active/passive Passive
Offline/online Online/Offline
Control input Intrusion detection rules via CLI and configuration file
Data input libpcap, WinPcap, tcpdump files
Metrics/functions Packet capturing
Data output Packet dumps in logging directory, alerts to applications via socket
IPv4/v6 support IPv4 and IPv6
Time scope Real-time
Aggregation Filtering
Sampling No
Availability GPL
Supported systems OpenBSD, FreeBSD, NetBSD, Solaris, AIX, Linux, Windows, MacOS X

MOME-WP1-0406-D11_STATE_OF_INTEROPERABILITY 001990
Deliverable D11 Monitoring and Measurement Cluster
30/06/2004 Page 51 of 73
Evaluation
Test details Solaris 8, June 2004, Jürgen Quittek
Performance
Rating
Comments
3.42 SProbe
Description
SProbe is fast, accurate and works in uncooperative environments. That is, with SProbe one can
measure the bottleneck bandwidth to any other machine on the Internet in just a few seconds. In
addition, SProbe is scalable, works on asymmetric network paths, flexible to bandwidth changes, and
its code is free.
Basic Info
Name SProbe
URL http://sprobe.cs.washington.edu
listed in
Classification
Category
Active/passive
Offline/online
Control input
Data input
Metrics/functions
Data output
IPv4/v6 support
Time scope
Aggregation
Sampling
Availability
Supported systems
Evaluation
Test details
Performance
Rating
Comments

MOME-WP1-0406-D11_STATE_OF_INTEROPERABILITY 001990
Deliverable D11 Monitoring and Measurement Cluster
30/06/2004 Page 52 of 73
3.43 Spruce
Description
Spruce is a tool for measuring available bandwidth over Internet paths.
Basic Info
Name spruce
URL http://project-iris.net/spruce/
listed in
Classification
Category available bandwidth measurement tool
Active/passive active
Offline/online online
Control input CLI
Data input
Metrics/functions available bandwidth
Data output
IPv4/v6 support
Time scope
Aggregation
Sampling
Availability open source
Supported systems
Contact N/A
Evaluation
Test details Carsten Schmoll 28.6.2004
Performance
Rating
Comments
3.44 Sting
Description
sting is a TCP-based network measurement tool that measures end-to-end network path characteristics.
sting is unique because it can estimate one-way properties, such as loss rate, through careful
manipulation and observation of TCP behavior. In addition, using TCP allows sting to leverage the
existing Internet infrastructure -- any TCP server can be used as a de facto measurement service -- and
it avoids increasing problems with ICMP-based network measurement (blocking, spoofing, rate
limiting, etc).
Basic Info
Name sting
URL http://www.cs.washington.edu/homes/savage/sting/
listed in

MOME-WP1-0406-D11_STATE_OF_INTEROPERABILITY 001990
Deliverable D11 Monitoring and Measurement Cluster
30/06/2004 Page 53 of 73
Classification
Category QoS traffic measurement
Active/passive active
Offline/online online
Control input CLI
Data input
Metrics/functions loss, delay
Data output
IPv4/v6 support
Time scope
Aggregation
Sampling no
Availability source code can be downloaded
Supported systems FreeBSD 3.x, Linux 2.3.x
Evaluation
Test details
Performance
Rating
Comments research paper about used measurement techniques and slides are also available
3.45 Tcpdstat
Description
TCPDSTAT is a simple command line based trace analysis tool allowing to account traffic per
application. The tool classifies traffic accordingly to protocol type (TCP, UDP) and used port number.
It could also be extended due to source code availability.
Basic Info
Name Tcpdstat (tcpdstat-uw)
URL http://staff.washington.edu/dittrich/talks/core02/tools/tools.html
listed in
Classification
Category traffic analysis
Active/passive N/A
Offline/online Offline
Control input CLI
Data input tcpdump trace file (tcpdump -w)
Metrics/functions Bytes/packets sent per application/protocol, packet size histogram, aggregate
statistics
Data output Console (per application data), text file (packet size histogram)
IPv4/v6 support Both
Time scope Trace file
Aggregation Per protocol type and port number
Sampling N/A
Availability Open source, beta
Supported systems Linux, *nix

MOME-WP1-0406-D11_STATE_OF_INTEROPERABILITY 001990
Deliverable D11 Monitoring and Measurement Cluster
30/06/2004 Page 54 of 73
Contact Original source: Kenjiro Cho <[email protected]>
Linux port: Dave Dittrich <[email protected]>
http://staff.washington.edu/dittrich/talks/core02/tools/tools.html
Evaluation
Test details Version 0.9 (tcpdstat-uw), Slackware linux 9.1 (kernel 2.4.24), Jaroslaw
Sliwinski, 22.06.2004
Performance
Rating
Comments Created at WIDE (MAWI) project (http://www.wide.ad.jp/).
Original sources at ftp://tracer.csl.sony.co.jp/pub/mawi/tools/
Linux ported by Dave Dittrich. "-l" parameter should be "-w" in fact.
3.46 Tcpdump
Description
The tcpdump program is the most commonly used Command Line Interface (CLI) program for traffic
measurement. It measures traffic at local interfaces and dumps the results at the CLI or into tcpdump
packet trace files (may also only store packet headers).
Basic Info
Name tcpdump
URL http://www.tcpdump.org/
listed in
Classification
Category Traffic measurement
Active/passive Passive
Offline/online Online
Control input CLI
Data input libpcap
Metrics/functions packet capturing
Data output CLI, tcpdump files
IPv4/v6 support IPv4 and IPv6
Time scope Real-time
Aggregation Filtering
Sampling No
Availability BSD
Supported systems FreeBSD, NetBSD, OpenBSD, MacOS X, Solaris, SunOS, DEC OSF/1, Digital
UNIX, Tru64 UNIX, Ultrix, HP-UX, AIX, Linux, NeXTSTEP, SINIX, SCO
Unix, UnixWare
Evaluation
Test details Solaris 8 and MacOS 10.3, June 2004, Jürgen Quittek
Performance
Rating
Comments
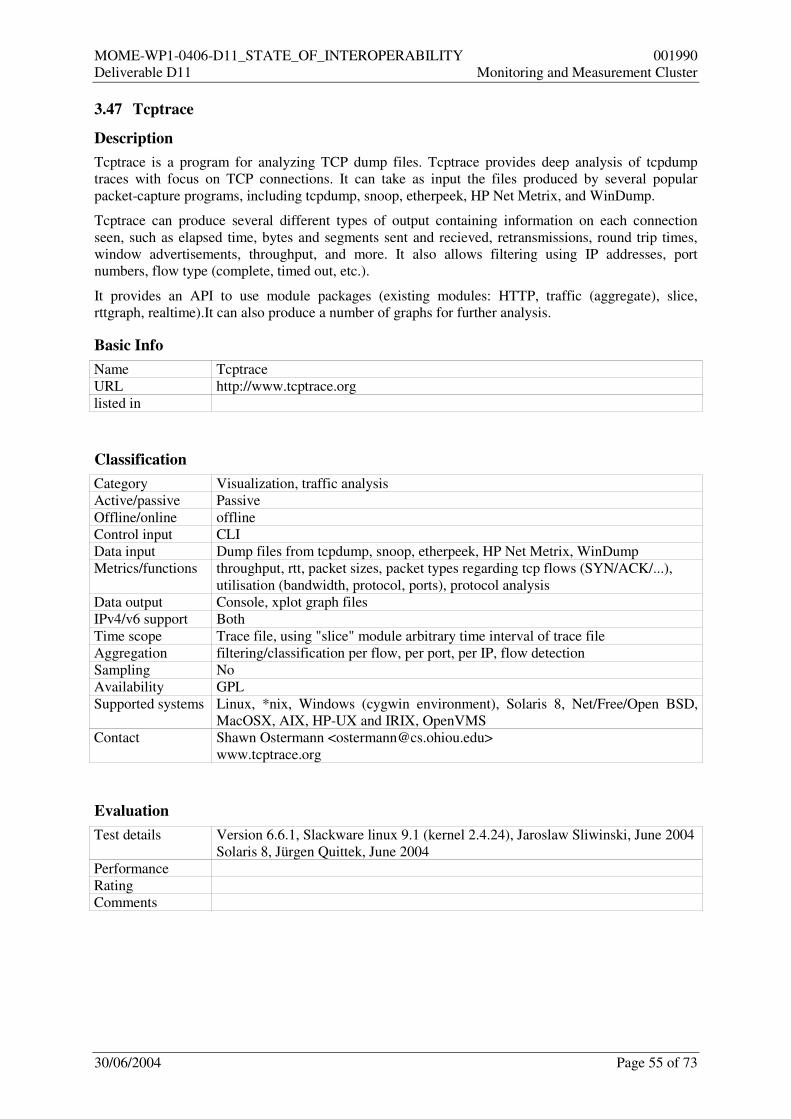
MOME-WP1-0406-D11_STATE_OF_INTEROPERABILITY 001990
Deliverable D11 Monitoring and Measurement Cluster
30/06/2004 Page 55 of 73
3.47 Tcptrace
Description
Tcptrace is a program for analyzing TCP dump files. Tcptrace provides deep analysis of tcpdump
traces with focus on TCP connections. It can take as input the files produced by several popular
packet-capture programs, including tcpdump, snoop, etherpeek, HP Net Metrix, and WinDump.
Tcptrace can produce several different types of output containing information on each connection
seen, such as elapsed time, bytes and segments sent and recieved, retransmissions, round trip times,
window advertisements, throughput, and more. It also allows filtering using IP addresses, port
numbers, flow type (complete, timed out, etc.).
It provides an API to use module packages (existing modules: HTTP, traffic (aggregate), slice,
rttgraph, realtime).It can also produce a number of graphs for further analysis.
Basic Info
Name Tcptrace
URL http://www.tcptrace.org
listed in
Classification
Category Visualization, traffic analysis
Active/passive Passive
Offline/online offline
Control input CLI
Data input Dump files from tcpdump, snoop, etherpeek, HP Net Metrix, WinDump
Metrics/functions throughput, rtt, packet sizes, packet types regarding tcp flows (SYN/ACK/...),
utilisation (bandwidth, protocol, ports), protocol analysis
Data output Console, xplot graph files
IPv4/v6 support Both
Time scope Trace file, using "slice" module arbitrary time interval of trace file
Aggregation filtering/classification per flow, per port, per IP, flow detection
Sampling No
Availability GPL
Supported systems Linux, *nix, Windows (cygwin environment), Solaris 8, Net/Free/Open BSD,
MacOSX, AIX, HP-UX and IRIX, OpenVMS
Contact Shawn Ostermann <[email protected]>
www.tcptrace.org
Evaluation
Test details Version 6.6.1, Slackware linux 9.1 (kernel 2.4.24), Jaroslaw Sliwinski, June 2004
Solaris 8, Jürgen Quittek, June 2004
Performance
Rating
Comments

MOME-WP1-0406-D11_STATE_OF_INTEROPERABILITY 001990
Deliverable D11 Monitoring and Measurement Cluster
30/06/2004 Page 56 of 73
3.48 tcptraceroute
Description
Tcptraceroute is a traceroute implementation using TCP packets.
The more traditional traceroute(8) sends out either UDP or ICMP ECHO packets with a TTL of one,
and increments the TTL until the destination has been reached. By printing the gateways that generate
ICMP time exceeded messages along the way, it is able to determine the path packets are taking to
reach the destination.
The problem is that with the widespread use of firewalls on the modern Internet, many of the packets
that traceroute(8) sends out end up being filtered, making it impossible to completely trace the path to
the destination. However, in many cases, these firewalls will permit inbound TCP packets to specific
ports that hosts sitting behind the firewall are listening for connections on. By sending out TCP SYN
packets instead of UDP or ICMP ECHO packets, tcptraceroute is able to bypass the most common
firewall filters..
Basic Info
Name tcptraceroute
URL http://michael.toren.net/code/tcptraceroute/
listed in
Classification
Category Connectivity checking, performance measurement
Active/passive Active
Offline/online Online
Control input CLI
Data input Received replies
Metrics/functions RTT measurement, reachability
Data output CLI
IPv4/v6 support IPv4 and IPv6
Time scope Real-time
Aggregation None
Sampling No
Availability GPL
Supported systems Linux 2.4
Evaluation
Test details MacOS 10.3, Jürgen Quittek, June 2004
Performance
Rating
Comments
3.49 Thrulay
Description
The program thrulay is used to measure the capacity of a network by sending a bulk TCP stream over
it. Like other tools (such as iperf, netperf, nettest, nuttcp, ttcp, etc.), thrulay can report TCP throughput
periodically so that TCP performance plots can be produced. Unlike other tools, thrulay not only

MOME-WP1-0406-D11_STATE_OF_INTEROPERABILITY 001990
Deliverable D11 Monitoring and Measurement Cluster
30/06/2004 Page 57 of 73
reports goodput, but round-trip delay time as well. The output of thrulay is easy to parse by machine
(in fact, it's ready to be used as a data file for gnuplot).
Basic Info
Name thrulay
URL http://www.internet2.edu/~shalunov/thrulay/
Contact Stanislav Shalunov ([email protected])
Classification
Category bandwidth measurement
Active/passive active
Offline/online online
Control input CLI
Data input
Metrics/functions throughput, goodput, capacity, RTT
Data output ASCII to terminal, can be used as input for gnuplot directly
IPv4/v6 support
Time scope
Aggregation
Sampling no
Availability source code
Supported systems *nix, Linux
Evaluation
Test details
Performance
Rating
Comments
3.50 Traceroute
Description
The Internet is a large and complex aggregation of network hardware, connected together by
gateways. Tracking the route one's packets follow (or finding the miscreant gateway that's discarding
your packets) can be difficult. The traceroute program explores the IP packet path between two hosts
utilizing the IP protocol `time to live' field and attempts to elicit an Internet Control Message Protocol
(ICMP) TIME_EXCEEDED response from each gateway along the path to some host.
Basic Info
Name traceroute (tracert on Windows systems)
URL ftp://ftp.ee.lbl.gov/
listed in
Classification
Category Connectivity checking, performance measurement
Active/passive Active
Offline/online Online
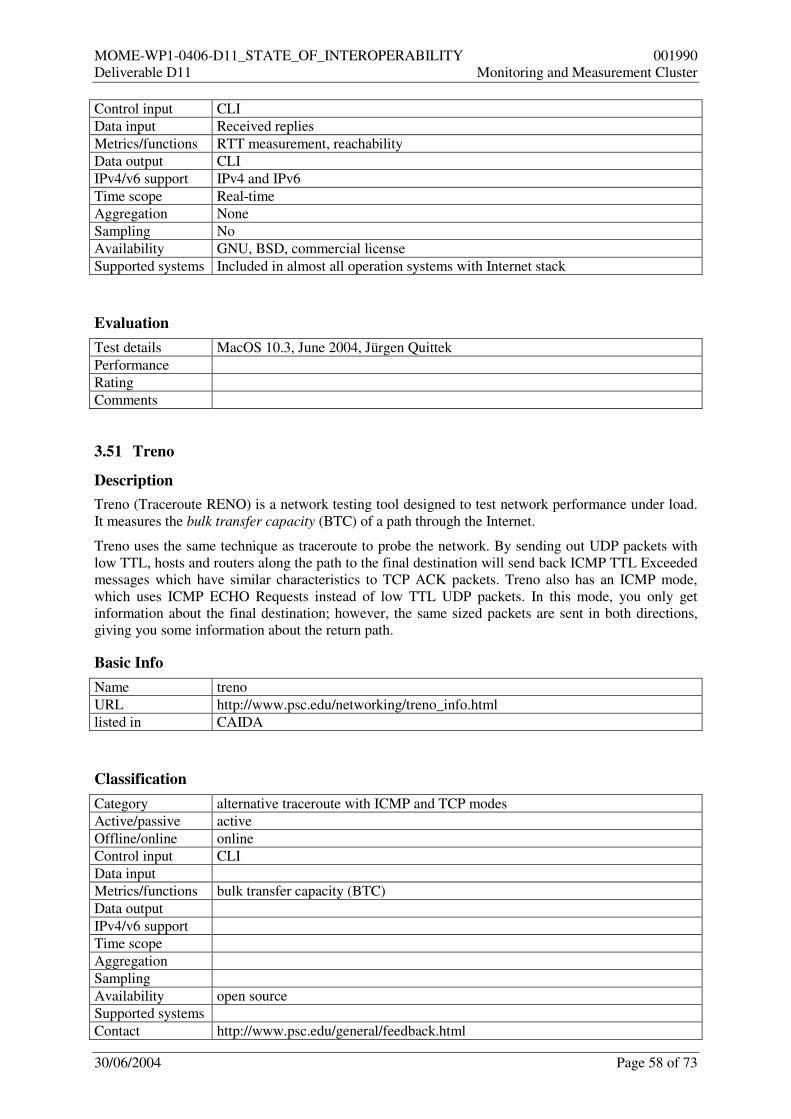
MOME-WP1-0406-D11_STATE_OF_INTEROPERABILITY 001990
Deliverable D11 Monitoring and Measurement Cluster
30/06/2004 Page 58 of 73
Control input CLI
Data input Received replies
Metrics/functions RTT measurement, reachability
Data output CLI
IPv4/v6 support IPv4 and IPv6
Time scope Real-time
Aggregation None
Sampling No
Availability GNU, BSD, commercial license
Supported systems Included in almost all operation systems with Internet stack
Evaluation
Test details MacOS 10.3, June 2004, Jürgen Quittek
Performance
Rating
Comments
3.51 Treno
Description
Treno (Traceroute RENO) is a network testing tool designed to test network performance under load.
It measures the bulk transfer capacity (BTC) of a path through the Internet.
Treno uses the same technique as traceroute to probe the network. By sending out UDP packets with
low TTL, hosts and routers along the path to the final destination will send back ICMP TTL Exceeded
messages which have similar characteristics to TCP ACK packets. Treno also has an ICMP mode,
which uses ICMP ECHO Requests instead of low TTL UDP packets. In this mode, you only get
information about the final destination; however, the same sized packets are sent in both directions,
giving you some information about the return path.
Basic Info
Name treno
URL http://www.psc.edu/networking/treno_info.html
listed in CAIDA
Classification
Category alternative traceroute with ICMP and TCP modes
Active/passive active
Offline/online online
Control input CLI
Data input
Metrics/functions bulk transfer capacity (BTC)
Data output
IPv4/v6 support
Time scope
Aggregation
Sampling
Availability open source
Supported systems
Contact http://www.psc.edu/general/feedback.html

MOME-WP1-0406-D11_STATE_OF_INTEROPERABILITY 001990
Deliverable D11 Monitoring and Measurement Cluster
30/06/2004 Page 59 of 73
Evaluation
Test details Carsten Schmoll 28.6.2004
Performance
Rating
Comments
3.52 Traffic Generator (TG)
Description
TG is a tool used to generate artificial and constant UDP and TCP traffic. TG, and associated utilities,
was originally developed at SRI International with subsequent enhancements supported by the
USC/ISI Postel Center for Experimental Networking. TG is a traffic generator program that creates
one-way UDP or TCP streams between a source and a sink. The traffic is described in terms of
interarrival times and packet lengths. Information regarding the source and sink, such as packet
transmit and receive times, is recorded in a binary log file for later post processing by dcat. Dcat takes
the binary log file and produces an ascii representation. A perl script, gengraph, transforms this data
into a format suitable for viewing via public domain graphing tools such as xplot, xgraph, and gnuplot.
Basic Info
Name Traffic Generator (TG)
URL http://www.caip.rutgers.edu/~arni/linux/tg1.html
http://www.postel.org/tg/tg.htm
listed in
Classification
Category Traffic generator
Active/passive Active
Offline/online online
Control input
Data input Scripts, Text describing traffic to be generated
Metrics/functions UDP & TCP traffic generator
Data output Text, GUI
IPv4/v6 support
Time scope Real-time
Aggregation
Sampling
Availability
Supported
systems
Linux, FreeBSD, Solaris
Contact
Evaluation
Test details
Performance
Rating
Comments Can generate Exponential ON/OFF traffic.

MOME-WP1-0406-D11_STATE_OF_INTEROPERABILITY 001990
Deliverable D11 Monitoring and Measurement Cluster
30/06/2004 Page 60 of 73
3.53 Tstat
Description
Started as evolution of tcptrace, Tstat is able to analyze traces in real time, using common PC
hardware, or start from previously recorded traces in various dump formats.
Basic Info
Name Tstat
URL http://tstat.tlc.polito.it/
listed in
Classification
Category Visualization, traffic analysis
Active/passive Passive
Offline/online Offline/online
Control input Web interface, CLI
Data input libpcap, Dump files from tcpdump, snoop, etherpeek, HP Net Metrix, WinDump
Metrics/functions RTT, bandwidth, utilisation (bandwidth, protocol, ports), protocol analysis
Data output Graphical plots at web browser
IPv4/v6 support IPv4 and IPv6
Time scope Real-time
Aggregation filtering, classification, flow detection
Sampling No
Availability GPL
Supported systems Linux 2.2, Linux 2.4, FreeBSD 4.1, NetBSD 1.3, HP-UX and IRIX
Evaluation
Test details Linux 2.4, Jürgen Quittek, June 2004
Performance
Rating
Comments
3.54 TTCP
Description
ttcp is a tool for measuring TCP and UDP throughput. The tool must be started on sender and receiver
side. The measurement can be configured with a couple of parameters such as number of packets,
packet size, etc. A couple of variants exist. Newer variants like nttcp have more features like inetd
support, checksums, multicast packets etc.
Versions based on Java and on C are available.
Basic Info
Name Test TCP (TTCP)
URL ftp://ftp.arl.mil/pub/ttcp
http://www.ccci.com/tools/ttcp/
listed in CAIDA
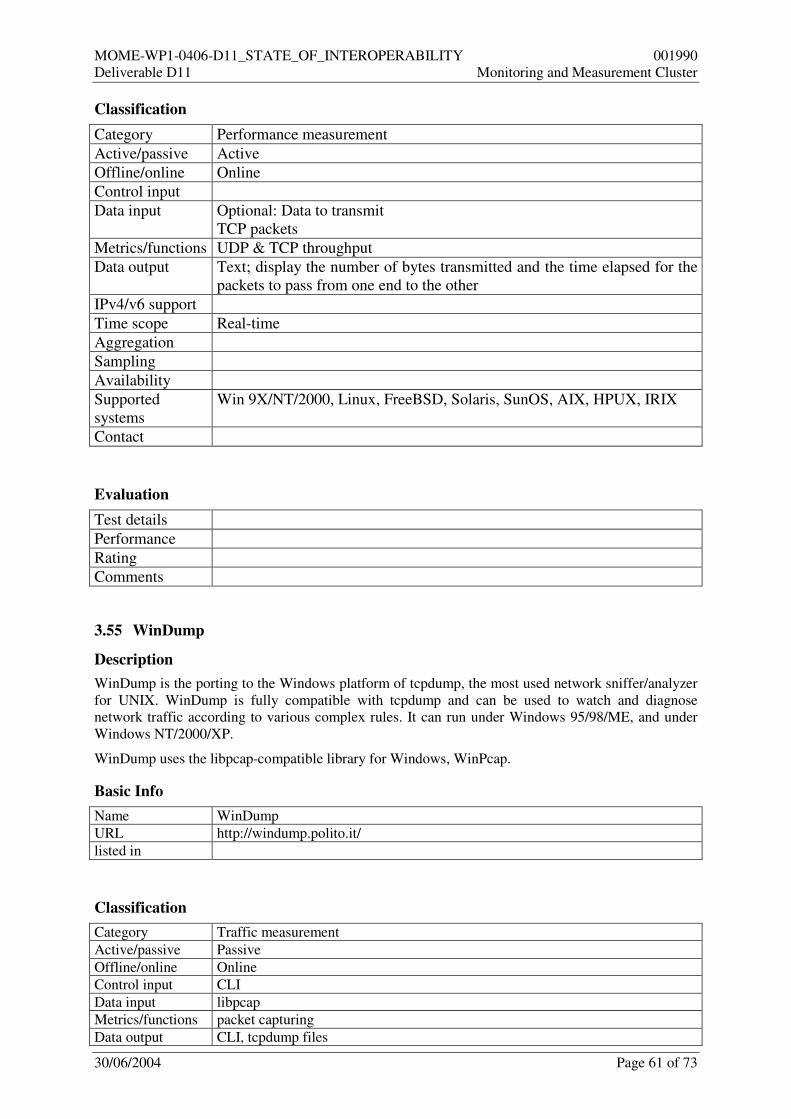
MOME-WP1-0406-D11_STATE_OF_INTEROPERABILITY 001990
Deliverable D11 Monitoring and Measurement Cluster
30/06/2004 Page 61 of 73
Classification
Category Performance measurement
Active/passive Active
Offline/online Online
Control input
Data input Optional: Data to transmit
TCP packets
Metrics/functions UDP & TCP throughput
Data output Text; display the number of bytes transmitted and the time elapsed for the
packets to pass from one end to the other
IPv4/v6 support
Time scope Real-time
Aggregation
Sampling
Availability
Supported
systems
Win 9X/NT/2000, Linux, FreeBSD, Solaris, SunOS, AIX, HPUX, IRIX
Contact
Evaluation
Test details
Performance
Rating
Comments
3.55 WinDump
Description
WinDump is the porting to the Windows platform of tcpdump, the most used network sniffer/analyzer
for UNIX. WinDump is fully compatible with tcpdump and can be used to watch and diagnose
network traffic according to various complex rules. It can run under Windows 95/98/ME, and under
Windows NT/2000/XP.
WinDump uses the libpcap-compatible library for Windows, WinPcap.
Basic Info
Name WinDump
URL http://windump.polito.it/
listed in
Classification
Category Traffic measurement
Active/passive Passive
Offline/online Online
Control input CLI
Data input libpcap
Metrics/functions packet capturing
Data output CLI, tcpdump files
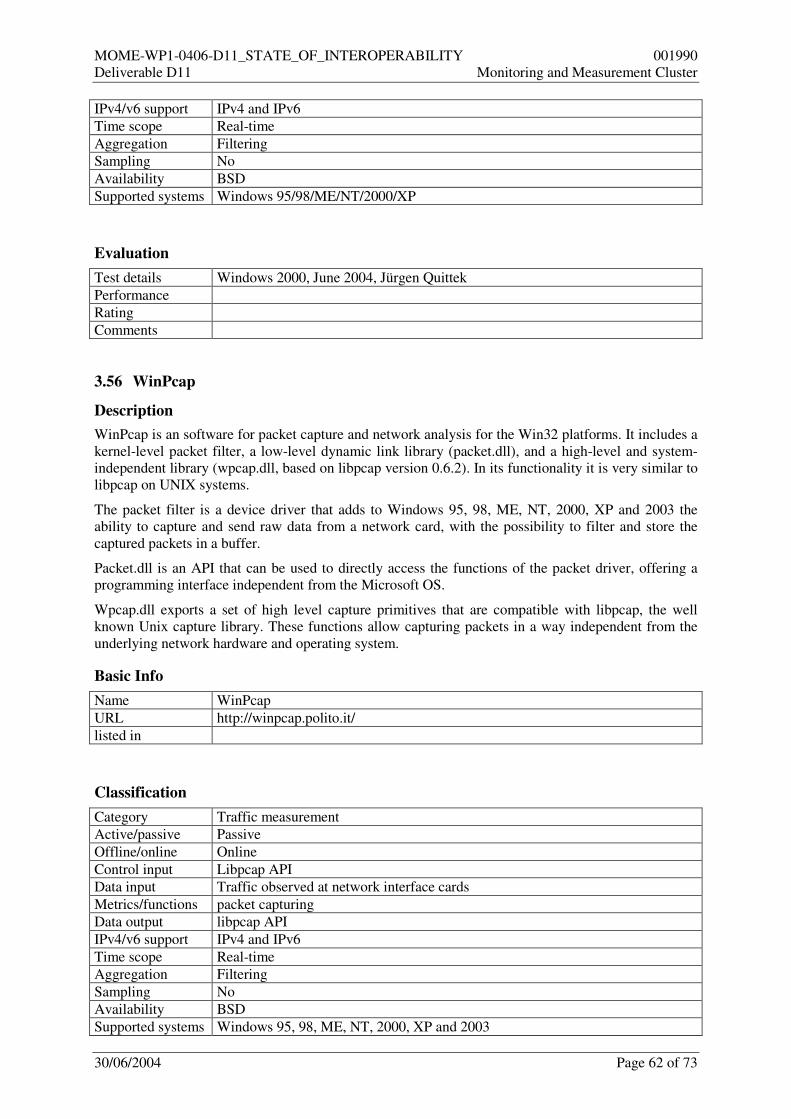
MOME-WP1-0406-D11_STATE_OF_INTEROPERABILITY 001990
Deliverable D11 Monitoring and Measurement Cluster
30/06/2004 Page 62 of 73
IPv4/v6 support IPv4 and IPv6
Time scope Real-time
Aggregation Filtering
Sampling No
Availability BSD
Supported systems Windows 95/98/ME/NT/2000/XP
Evaluation
Test details Windows 2000, June 2004, Jürgen Quittek
Performance
Rating
Comments
3.56 WinPcap
Description
WinPcap is an software for packet capture and network analysis for the Win32 platforms. It includes a
kernel-level packet filter, a low-level dynamic link library (packet.dll), and a high-level and system-
independent library (wpcap.dll, based on libpcap version 0.6.2). In its functionality it is very similar to
libpcap on UNIX systems.
The packet filter is a device driver that adds to Windows 95, 98, ME, NT, 2000, XP and 2003 the
ability to capture and send raw data from a network card, with the possibility to filter and store the
captured packets in a buffer.
Packet.dll is an API that can be used to directly access the functions of the packet driver, offering a
programming interface independent from the Microsoft OS.
Wpcap.dll exports a set of high level capture primitives that are compatible with libpcap, the well
known Unix capture library. These functions allow capturing packets in a way independent from the
underlying network hardware and operating system.
Basic Info
Name WinPcap
URL http://winpcap.polito.it/
listed in
Classification
Category Traffic measurement
Active/passive Passive
Offline/online Online
Control input Libpcap API
Data input Traffic observed at network interface cards
Metrics/functions packet capturing
Data output libpcap API
IPv4/v6 support IPv4 and IPv6
Time scope Real-time
Aggregation Filtering
Sampling No
Availability BSD
Supported systems Windows 95, 98, ME, NT, 2000, XP and 2003

MOME-WP1-0406-D11_STATE_OF_INTEROPERABILITY 001990
Deliverable D11 Monitoring and Measurement Cluster
30/06/2004 Page 63 of 73
Evaluation
Test details Windows 2000, June 2004, Jürgen Quittek
Performance
Rating
Comments
3.57 Viznet
Description
Viznet is a standalone Java application to visualize network bandwidth performance over time. It is
designed to work with the netlog library, bit can also import Cisco Netflow data.
Basic Info
Name Viznet
URL http://dast.nlanr.net/Projects/Viznet/
listed in CAIDA
Classification
Category Bandwidth measurement
Active/passive Passive
Offline/online Online
Control input Script files
Data input Data from netlog/Netflow
Metrics/functions
Data output
IPv4/v6 support
Time scope Real-time
Aggregation
Sampling
Availability Latest release (1.0); copyrighted by the University of Illinois.
Supported
systems
Sun Ultra, Sun Sparc, Linux, FreeBSD, SGI
Contact
Evaluation
Test details
Performance
Rating
Comments

MOME-WP1-0406-D11_STATE_OF_INTEROPERABILITY 001990
Deliverable D11 Monitoring and Measurement Cluster
30/06/2004 Page 64 of 73
3.58 Xtraceroute
Description
Xtraceroute is a graphical version of the traceroute program; which traces the route the IP packets take
to destination.
Basic Info
Name Xtraceroute
URL http://www.dtek.chalmers.se/~d3august/xt/
listed in CAIDA
Classification
Category Visualisation
Active/passive Active
Offline/online Online
Control input CLI, GUI
Data input ICMP packets (incrementing TTL)
Metrics/functions Mesure hop-by-hop connectivity, RTT
Data output GUI
IPv4/v6 support
Time scope Real-time
Aggregation
Sampling
Availability Realease v-0.9.1, Opensource
Supported
systems
Sun Ultra, Sun Sparc, Linux, FreeBSD, SGI
Contact
Evaluation
Test details v-0.9.1, Redhat 9, June 2004
Performance
Rating
Comments

MOME-WP1-0406-D11_STATE_OF_INTEROPERABILITY 001990
Deliverable D11 Monitoring and Measurement Cluster
30/06/2004 Page 65 of 73
4 Tool Database Use Cases
The tools database presents its users different possibilities via a web-based front-end to search, browse
and possibly modify its contents. As not every user in the Internet shall be allowed to modify the
entries of the database we have identified three different roles a user can take on when interacting with
the system:
• Administrators
• Reviewers
• Public Users (any non-registered user)
Each of these user groups can perform some of these operations on the database:
• Add tool entry
• Modify tool entry
• Delete tool entry
• Search database (basic, detailed)
• View list(s)
The following table lists what operation can be performed by which kind of user:
Operation \ Group Admins Reviewers Public (any user)
Add x x
Modify x (all) x (own)
Search x x x
View x x x
Table 3: User Operations on Tools Database
When performing add or modify operations a login operation needs to be performed by the user in
order to authorize use of these functions.
In the first version no front-ends are provided for other operations such as add/remove admin, or
reviewer entry. This can be added later for convenience.

MOME-WP1-0406-D11_STATE_OF_INTEROPERABILITY 001990
Deliverable D11 Monitoring and Measurement Cluster
30/06/2004 Page 66 of 73
The following UML diagram shows an overview of the described use cases:
Figure 3: Use Cases for Tools Database

MOME-WP1-0406-D11_STATE_OF_INTEROPERABILITY 001990
Deliverable D11 Monitoring and Measurement Cluster
30/06/2004 Page 67 of 73
5 Appendix A - References
[1] NetConf charter, see http://www.ietf.org/html.charters/netconf-charter.html
[2] NetConf protocol, see http://www.ietf.org/internet-drafts/draft-ietf-netconf-prot-02.txt
[3] R.L. Carter, M. E. Crivella, “Measuring Bottleneck Link Speed in Racket-Switched Networks,”
Performance Evaluation, vol. 27,28, 1996

MOME-WP1-0406-D11_STATE_OF_INTEROPERABILITY 001990
Deliverable D11 Monitoring and Measurement Cluster
30/06/2004 Page 68 of 73
6 Appendix B - Glossary
Accounting Accounting measures the resources a user consumes during network
access. This can include the amount of system time or the amount of data
a user has sent and/or received during a session. Accounting is carried out
by logging of session statistics and usage information and is used for
authorization control, billing, trend analysis, resource utilization, and
capacity planning activities.
Active measurement Measurement performed by sending packets through the network.
Alpha version Alpha version or alpha release is the first release of a computer program
or other product, likely to be very unstable but useful for demonstrating
internally and to select customers. It is also called "preview or technical
preview''.
Architecture In information technology, especially computers and more recently
networks, architecture is a term applied to both the process and the
outcome of thinking out and specifying the overall structure, logical
components, and the logical interrelationships of a computer, its operating
system, a network, or other conception. An architecture can be a
reference model, such as the Open Systems Interconnection (OSI)
reference model, intended as a model for specific product architectures or
it can be a specific product architecture, such as that for an Intel Pentium
microprocessor or for IBM's OS/390 operating system.
Attributes Characteristics of a given entity.
Available bandwidth Is the unused capacity in a network between a sender and a receiver. It
depends on the link capacity and all existing flows.
Beta version A beta version is not fully debugged or fully functional but satisfies a
majority of the requirements. Beta versions (or just betas) are an
intermediate step of the full development cycle.
BTC The Bulk Transfer Capacity (BTC) is a measure of a network's ability to
transfer significant quantities of data with a single congestion-aware
transport connection (e.g., TCP). The intuitive definition of BTC is the
expected long term average data rate (bits per second) of a single ideal
TCP implementation over the path in question.
Evaluation Refers to the appraisal of the characteristics, significance, importance, or
relative value.
Goodput Goodput is the sum of all application layer payload bits sent by a node
during a defined time divided by that period of time. It is the throughput
actually achieved for each TCP connection.
GPL short for General Public License, the license that accompanies some open
source software that details how the software and its accompany source
code can be freely copied, distributed and modified. The most widespread
use of GPL is in reference to the GNU GPL, which is commonly
abbreviated simply as GPL when it is understood that the term refers to
the GNU GPL. One of the basic tenets of the GPL is that anyone who
acquires the material must make it available to anyone else under the
same licensing agreement.

MOME-WP1-0406-D11_STATE_OF_INTEROPERABILITY 001990
Deliverable D11 Monitoring and Measurement Cluster
30/06/2004 Page 69 of 73
IDS An Intrusion Detection System is a system for detecting such misuse.
IETF Internet Engineering Task Force, a large open international community of
network designers, operators, vendors, and researchers concerned with
the evolution of the Internet architecture and the smooth operation of the
Internet. The actual technical work of the IETF is done in its working
groups, which are organized by topic into several areas (e.g., routing,
transport, security, etc.).
Intrusion Detection Network intrusion detection systems (NIDS) monitor packets on the
network wire and attempts to discover if a hacker/cracker is attempting to
break into a system (or cause a denial of service attack). A NIDS may run
either on the target machine or on an independent machine promiscuously
watching all network traffic.
IST Information Society Technologies. The IST guides European research
activities which are structured around consecutive four-year programmes,
or so-called Framework Programmes.
ITU The International Telecommunication Union (ITU), headquartered in
Geneva, Switzerland is an international organization within the United
Nations System where governments and the private sector coordinate
global telecom networks and services.
Jitter Jitter is the variation or variability of network delay.
Latency, Delay The amount of time it takes a packet to travel from one point in the
network to another point. (maybe also note the different definitions of
when to take the timestamp wrt. start/end of packet)
Measurement An operational definition: what and how the indicators of a variable are
measured in a study. (not quite clear definition to me, Carsten)
Measurement Tool Any device used to measure or collect data on a variable.
Packet Reordering The effect that packets are received by a traffic destination in a different
order than they were sent by the traffic source. Packet reordering can be
the effect of "route fluttering" or due to parallelism in internet routers and
setup of links.
Passive Measurement Measurements performed by listening on the network without sending
packets on it.
QoS Quality of Service (QoS) enables to provide better service to certain flows
in the network. This is done by either raising the priority of a flow or
limiting the priority of another flow. QoS management enables providers
to differentiate treatment of traffic and tune quality according to
engineering or business decisions. Applying QoS management includes
using tools for congestion-management, queue management in routers
and monitoring in order to shape the traffic so that specific flows are
preferred by limiting the throughput of other flows.
Real-time Real time is a level of computer responsiveness that a user senses as
sufficiently immediate or that enables the computer to keep up with some
external process. Real-time is an adjective pertaining to computers or
processes that operate in real time.

MOME-WP1-0406-D11_STATE_OF_INTEROPERABILITY 001990
Deliverable D11 Monitoring and Measurement Cluster
30/06/2004 Page 70 of 73
Release Candidate Release candidate is a final product that can be released unless fatal bugs
are detected. In this stage, all functionalities are done and all showstopper
class bugs fixed. In open source programs, version numbers or the terms
"stable" and "unstable" are more commonly used to distinguish the stage
of development.
Response Time The elapsed time between the end of an inquiry and the beginning of the
response.
Sampling Sampling with regard to network traffic observation means only capturing
and analyzing a portion of the existing traffic (packets), so to reduce
demand on processing performance. It is often used when observing
traffic on high-speed Internet links.
SLA/SLS A service level agreement (SLA) is a contract between a network service
provider and a customer that specifies, usually in measurable terms, what
services the network service provider will furnish. The customers of the
network regions and the owner of the a network region have negotiated a
static contract (service level specification, or SLS) for the transmit
capacity to be provided. Which parameters are available and which values
these parameters can take, is defined in the Service Level Specification
(SLS), which is part of the Service Level Agreement (SLA).
SMP Short for Symmetric Multiprocessing, a computer architecture that
provides fast performance by making multiple CPUs available to
complete individual processes simultaneously (multiprocessing).
SNMP Short for Simple Network Management Protocol, a set of protocols for
managing complex networks. The first versions of SNMP were developed
in the early 80s. SNMP works by sending messages, called protocol data
units (PDUs), to different parts of a network. SNMP-compliant devices,
called agents, store data about themselves in Management Information
Bases (MIBs) and return this data to the SNMP requesters
System Any organized assembly of resources and procedures united and
regulated by interaction or interdependence to accomplish a set of
specific functions.
Test Devices, procedures or sets of items that are used to measure ability, skill,
understanding, knowledge or achievement.
Throughput Throughput between two network entities is the amount of data
transferred from one entity to the other in a specified amount of time. It
can also be thought of as average bandwidth use.
Traffic Control Traffic Control covers techniques to monitor and possibly restrict the
volume of data transmitted by a router or gateway. The goal of traffic
control is to balance the overall use of different protocols and applications
sharing the bandwidth of a common link. Traffic Control uses
prioritization and weighted queuing, often together with differentiated
network services. In a network, traffic control can also be applied by
refusing additional device connections until the flow of traffic has
subsided.
Traffic Engineering Process that enhances overall network utilization by attempting to create
a uniform or differentiated distribution of traffic throughout the network.
An important result of this process is the avoidance of congestion on a
path.

MOME-WP1-0406-D11_STATE_OF_INTEROPERABILITY 001990
Deliverable D11 Monitoring and Measurement Cluster
30/06/2004 Page 71 of 73
Traffic flow A sequence of packets on a link is considered a traffic flow when they
have a certain set of attributes in common. All packets from one source to
one destination can be considered a single traffic flow. When using fine-
grained analysis for TCP/IP traffic usually each unique combination of
source and destination address, protocol, plus source and destination port
number is considered to define a traffic flow.
Validity The extent to which a measurement instrument measures what it is
supposed to measure and measures it accurately.

MOME-WP1-0406-D11_STATE_OF_INTEROPERABILITY 001990
Deliverable D11 Monitoring and Measurement Cluster
30/06/2004 Page 72 of 73
7 Appendix C - Complete List of Tools
This list contains all the web-links from the tools evaluation as a starting point to the extensive tools
documentation on the web. The results of the evaluation can be found in chapter 3, section 3.x where x
is the number preceding the tool name in the following table.
# Tool Name Web URL
1 Analyzer http://analyzer.polito.it
2 AutoFocus http://www.caida.org/tools/measurement/autofocus/
3 bing http://www.cnam.fr/reseau/bing.html
http://ai3.asti.dost.gov.ph/sat/bing.html
4 brobe, cprobe http://cs-people.bu.edu/carter/tools/Tools.html
5 Bro http://www.icir.org/vern/bro.html
6 CMToolset http://cmtoolset.salzburgresearch.at/
7 DAG card http://www.endace.com/
8 DBS http://www.ai3.net/products/dbs
9 D-ITG http://www.grid.unina.it/software/ITG/
10 dsniff http://monkey.org/~dugsong/dsniff/
http://www.datanerds.net/~mike/dsniff.html
11 E2ETT N/A, contact =
Paolo Brunelli ([email protected])
12 eHealth –
Concord
www.concord.com
www.reporting.belgacom.be
13 Ethereal http://www.ethereal.com/
14 Ettercap http://ettercap.sourceforge.net
15 IGI/PTR http://gs274.sp.cs.cmu.edu/www/igi/
16 Internet2
Detective
http://detective.internet2.edu/
17 ipband http://ipband.sourceforge.net/
18 iperf http://dast.nlanr.net/Projects/Iperf
19 JFFNMS http://www.jffnms.org/
20 libpcap http://www.tcpdump.org/
21 LFT http://www.mainnerve.com/lft/
22 MGEN http://mgen.pf.itd.nrl.navy.mil/
23 MRTG http://people.ee.ethz.ch/~oetiker/webtools/mrtg
24 MSA http://www.ics.forth.gr/netgroup/msa/software.html
25 nagios www.nagios.org
26 netio http://freshmeat.net/projects/netio/
http://ftp.leo.org/pub/comp/os/os2/leo/systools/netio123.zip
27 nBox86 http://www.ntop.org/nBox86/

MOME-WP1-0406-D11_STATE_OF_INTEROPERABILITY 001990
Deliverable D11 Monitoring and Measurement Cluster
30/06/2004 Page 73 of 73
# Tool Name Web URL
28 NetFlow http://www.cisco.com/warp/public/732/Tech/nmp/netflow/index.shtml
29 NetMate http://www.fokus.fhg.de/research/cc/meteor/projects/ip-
qos/netmate/index.php
30 NetPipe http://www.scl.ameslab.gov/netpipe
31 nProbe http://www.ntop.org/nProbe.html
32 ntop http://www.ntop.org/
33 OpenIMP http://www.fokus.fhg.de/research/cc/meteor/products/content.html
34 OpenView http://www.openview.hp.com/
35 packetyzer http://www.networkchemistry.com/products/packetyzer/
36 pathChirp http://www.spin.rice.edu/Software/pathChirp/
37 pathload http://www.cc.gatech.edu/fac/Constantinos.Dovrolis/pathload.html
38 ping http://ftp.arl.mil/~mike/ping.html
39 Rude/Crude http://rude.sourceforge.net
40 Skitter http://www.caida.org/tools/measurement/skitter
41 snort http://www.snort.org/
42 SProbe http://sprobe.cs.washington.edu
43 spruce http://project-iris.net/spruce/
44 sting http://www.cs.washington.edu/homes/savage/sting/
45 Tcpdstat http://staff.washington.edu/dittrich/talks/core02/tools/tools.html
46 tcpdump http://www.tcpdump.org/
47 Tcptrace http://www.tcptrace.org
48 tcptraceroute http://michael.toren.net/code/tcptraceroute/
49 thrulay http://www.internet2.edu/~shalunov/thrulay/
50 traceroute ftp://ftp.ee.lbl.gov/
51 treno http://www.psc.edu/networking/treno_info.html
52 TG http://www.caip.rutgers.edu/~arni/linux/tg1.html
http://www.postel.org/tg/tg.htm
53 Tstat http://tstat.tlc.polito.it/
54 TTCP ftp://ftp.arl.mil/pub/ttcp
http://www.ccci.com/tools/ttcp/
55 WinDump http://windump.polito.it/
56 WinPcap http://winpcap.polito.it/
57 Viznet http://dast.nlanr.net/Projects/Viznet/
58 Xtraceroute http://www.dtek.chalmers.se/~d3august/xt/
Table 4: Web-Links for evaluated Tools