Molybdenum - RELATED INFORMATION · · 2013-01-17in hot water storag distributioe and systemsn...
172
Molybdenum The British Columbia Perspective r BCEMPR PAPER 1980-2 EMP ^l^ MAI Ministry of Energy, Mines and Petroleum Resources PAPER 1980-2 MINERAL ECONOMICS DIVISION
Transcript of Molybdenum - RELATED INFORMATION · · 2013-01-17in hot water storag distributioe and systemsn...
Molybdenum
The British Columbia Perspective
r
BCEMPR PAPER 1980-2 E M P ^ l ^ MAI
Ministry of Energy, Mines and Petroleum Resources
PAPER 1980-2
MINERAL ECONOMICS DIVISION
0005037599
MOLYBDENUM THE BRITISH COLUMBIA PERSPECTIVE
Paper 1980-2
J . Clancy and J . Tyhurst M i n e r a l Economics D i v i s i o n
M i n i s t r y of Energy, Mines and Petroleum Resources
June 19 80

I N D E X FOREWORD PAGE INTRODUCTION 1. STRUCTURE OF DEMAND 1.1 H i s t o r i c a l P r o f i l e 1 1.2 End-Use C h a r a c t e r i s t i c s 3 1.3 I n t e r n a t i o n a l Demand and Trade 3 1.4 Factors A f f e c t i n g Demand f o r Molybdenum 16 1.5 Summary 24
2. INTERNATIONAL SOURCES OF SUPPLY 2.1 World Production 31 2.2 Current World Supply S t r u c t u r e 37 2.3 Factors A f f e c t i n g World Supply 50 2.4 Economic E f f e c t s of By-Product Production 54 2.5 I n t e r n a t i o n a l Molybdenum Reserves 57 2.6 Economic Reserves 6 2
3. BC SOURCES OF SUPPLY 3.1 H i s t o r i c a l P r o f i l e 69 3.2 Performance of the BC Molybdenum Industry 71 3.3 Current BC Producers P r o f i l e d 75 3.4 T h e o r e t i c a l G e o l o g i c a l P o t e n t i a l 83 3.5 BC Molybdenum Prospects 8 8
4. MARKET STRUCTURE, PRICES AND PROJECTIONS 4.1 I n d u s t r i a l O r g a n i z a t i o n and Market H i s t o r y 101 4.2 Current Market S t r u c t u r e I l l 4.3 P r o j e c t e d Supply 115 4.4 P r o j e c t e d Demand 120 4.5 Supply/Demand Balance and P r i c e s 126 4.6 Overview Conclusion 129
.2

5. FURTHER PROCESSING 5.1 Areas of Further Processing 135 5.2 Industry Trends i n Further Processing 136 5.3 BC Further Processing O p p o r t u n i t i e s 139 5.4 E v a l u a t i o n of Processing A l t e r n a t i v e s 141
APPENDIX I DEFINITION OF RESERVES 1 4 7
APPENDIX I I BC PROSPECTS - RESERVES, HISTORY & REFERENCES 1 5 1
APPENDIX I I I APPENDIX TABLES 1 6 5
F O R E W O R D
This study i s a mineral commodity i n v e s t i g a t i o n of molybdenum, the production of which has become i n c r e a s i n g l y important to B r i t i s h Columbia. The authors wish to acknowledge t h e i r debt to v a r i o u s sources of i n f o r m a t i o n , as footnoted i n each s e c t o r , and i n p a r t i c u l a r to Mr. J.A. Ganshorn, P l a c e r Development L t d . , Mr. R.C. S t e i n i n g e r , Climax Molybdenum Company, and Dr. N. C a r t e r , G e o l o g i c a l D i v i s i o n , M i n i s t r y of Energy, Mines and Petroleum Resources.
The views expressed and conclusions drawn are those of the authors, and do not r e f l e c t the opinions of these sources.
J . Tyhurst
J . Clancy M i n e r a l Economics D i v i s i o n M i n i s t r y of Energy, Mines and Petroleum Resources
INTRODUCTION Molybdenum i s a s i l v e r - g r e y metal, used p r i n c i p a l l y as an a l l o y to impart hardness, s t r e n g t h , c o r r o s i o n and temperature r e s i s t a n c e to i r o n and s t e e l . The metal i s produced by rec o v e r i n g and co n c e n t r a t i n g molybdenite (molybdenum d i s u l p h i d e , M 0 S 2 ) from ore, the molybdenum concentrate c o n t a i n i n g between 85% to 95% MoS 2, or 51% to 55% molybdenum by weight.
Molybdenum d i s u l p h i d e has few d i r e c t end-use a p p l i c a t i o n s , w i t h the r e s u l t t h a t the concentrate i s u s u a l l y roasted to d r i v e o f f sulphur and produce molybdic oxide (MoO^). The oxide i n t u r n i s used to produce ferromolybdenum, which r e s u l t s from the red u c t i o n of M 0 O 3 f e r r o s i l i c o n i n the presence of i r o n , f l u x (CaO), aluminum and magnesium.
Molybdenum i s second only to copper i n value of production among the metals produced i n B r i t i s h Columbia. The province i s a major world producer of the metal, and supply shortages caused by an i n d u s t r i a l d i s pute i n 197 9 aggravated an i n t e r n a t i o n a l shortage of the metal which had been developing over the l a s t four t o s i x years. This was r e f l e c t e d i n dramatic p r i c e increases i n 1978 and 1979 from the h i s t o r i c a l l y s t a b l e p a t t e r n , and a l s o i n fundamental changes i n the market f o r the metal.
This report examines the background to the molybdenum market s i t u a t i o n and p r o f i l e s supply and demand on a domestic and world s c a l e . An attempt i s made to p r e d i c t market c o n d i t i o n s and p r i c e changes i n the near f u t u r e , and an examination i s

made of o p p o r t u n i t i e s f o r f u r t h e r processing of molybdenum i n B r i t i s h Columbia.

STRUCTURE OF DEMAND
I . STRUCTURE OF DEMAND
I.1 H i s t o r i c a l P r o f i l e Although world production of molybdenum increased by about 4,5 00 tonnes of contained Mo i n 1978, i t was exceeded by demand f o r the s i x t h consecutive year. Non-communist world consumption i n 1978 was approximately 88,000 tonnes of contained Mo, up 6.5 percent from 1977. The growth i n consumption t o such l e v e l s i s a r e l a t i v e l y recent phenomenon, however. While molybdenum was f i r s t d i s covered over 200 years ago, i t was not u n t i l t h i s century t h a t i t s f i r s t i n d u s t r i a l uses were developed, and not u n t i l the 1930's t h a t demand reached s i g n i f i c a n t l e v e l s by today's standards. Consumption of the metal has t r a d i t i o n a l l y been spurred by war; tungsten shortages during the F i r s t World War caused the f i r s t s u b s t a n t i a l use of molybdenum as an a l l o y i n g element i n the production of m i l i t a r y hardware. While demand slumped i n the 192 0's and the world's molybdenum i n d u s t r i e s c o l l a p s e d as a r e s u l t , demand began to grow again by the mid-1930's and was again s t i m u l a t e d by war i n 193 9.
World consumption of molybdenum dur i n g the Second World War, approximately 17 0,000 tonnes of the metal, was s i g n i f i c a n t l y more than t h a t during the F i r s t World War (about 2,300 tonnes). World War I I may have been the most important event i n the h i s t o r y of the metal,

2 given t h a t m i l i t a r y consumption of molybdenum alone during the campaign was greater than cumulative use up t o t h a t time. By 193 9 molybdenum was becoming a widely accepted a l l o y i n g metal, w i t h i t s end-use a p p l i c a t i o n s c o n s t a n t l y
expanding. A f t e r World War I I , r e c o n s t r u c t i o n under the M a r s h a l l Plan kept demand f o r molybdenum from slumping as i t had i n the 192 0's; as a r e s u l t world consumption i n the p e r i o d 1946-50 a c t u a l l y grew by 34 percent t o 14,500 tonnes i n 1950. By the e a r l y 1950's the Korean War had provided a new demand st i m u l u s , w i t h y e a r l y world consumption f o r m i l i t a r y requirements alone growing c l o s e to 14,5 00 tonnes by the war's t h i r d year.^
Another f a c t o r i n the metal's demand growth was the ambitious research and development program of the world's l a r g e s t producer, Climax (now p a r t of AMAX). When the company f i r s t opened the Climax mine i n Colorado i n 1917, research e f f o r t w a s d i r e c t e d p r i m a r i l y at p e r f e c t i n g the metal as an a l l o y i n armament and t o o l s t e e l s , but e v e n t u a l l y other a p p l i c a t i o n s i n the chemical, petroleum and f e r t i l i z e r i n d u s t r i e s were developed.
In the past two decades molybdenum has become p r a c t i c a l l y i ndispensable as a s t e e l a d d i t i v e f o r the nuclear and a e r o n a u t i c a l i n d u s t r i e s . M i n e r a l e x p l o r a t i o n and development, p a r t i c u l a r l y i n the petroleum s e c t o r , has been another growth area w i t h a l l o y s used i n d r i l l - p i p e sampling apparatus and o i l and n a t u r a l gas t r a n s m i s s i o n p i p e l i n e s .
3
World consumption of non-communist molybdenum production has increased at a r a t e of 4.2 percent per year since
2 1966, and at about 6 percent s i n c e 1972.
!•2 End Use C h a r a c t e r i s t i c s 1.2.1 General: Corrosion r e s i s t a n c e , high m e l t i n g p o i n t , h a r d e n a b i l i t y , and d u c t i l e s t rength are p r o p e r t i e s of molybdenum that are developed when the metal i s used i n an a l l o y . I t may be used as e i t h e r the s o l e a l l o y i n g m a t e r i a l or i n conjunction w i t h others such as chromium, n i c k e l and tungsten. The metal i s a l s o used i n pure or near-pure form i n w e a r - r e s i s t a n t products such as c a r b i d e c u t t i n g
edges and e l e c t r o n i c semi-conductor devices. Molybdenum has s e v e r a l important chemical a p p l i c a t i o n s as a c a t a l y s t , chemical reagent, or as an a d d i t i v e i n p a i n t pigments, i n a d d i t i o n , the unique molecular p r o p e r t i e s of M 0 S 2
make i t an e x c e l l e n t l u b r i c a n t a d d i t i v e . These uses are described i n more d e t a i l below . (See a l s o F i g u r e 1-1).
1.2.2 High Strength Low A l l o y (HSLA) S t e e l s : HSLA s t e e l s account f o r about 42-44 percent of molybdenum
consumption d e s p i t e a molybdenum content by weight of 0.5
percent or l e s s . Such s t e e l s are used i n the manufacture of t r a n s p o r t a t i o n equipment, i n d u s t r i a l machinery and i n such s t r u c t u r a l a p p l i c a t i o n s as long-span bridges and o i l and gas p i p e l i n e s . Molybdenum i s used t o impart toughness,

4
and to reduce weight i n favour of s t r e n g t h .
1.2.3 S t a i n l e s s S t e e l s ; S t a i n l e s s s t e e l a p p l i c a t i o n s account f o r about 2 0 percent of consumption. Molybdenum i s added at r a t e s of from 1 to 7 percent to improve c o r r o s i o n r e s i s t a n c e to chemicals and the environment. Recently developed f e r r i t i c s t a i n l e s s s t e e l s , c o n t a i n i n g from 1 to 4 percent molybdenum i n combination w i t h chromium, are already i n commercial use i n hot water storage and d i s t r i b u t i o n systems, s o l a r heat exchangers, power generating and d e s a l i n i z a t i o n equipment and automotive t r i m to p r o t e c t from s a l t s and moisture. The nuclear i n d u s t r y i s a growing user of such s t a i n l e s s s t e e l s i n pressure v e s s e l s and heat t r a n s f e r systems.
1.2.4 Tool S t e e l s ; Tool s t e e l s , c o n t a i n i n g from 4 t o 9.5 percent molybdenum, have captured a good deal of the market i n d r i l l s , t aps, punches, d i e s , shear blades and other t o o l uses. Tungsten, vanadium, t i t a n i u m , c o b a l t and molybdenum are b a s i c a l l y s u b s t i t u t e s i n such a p p l i c a t i o n s , but molybdenum has been
able t o capture much of t h i s end-use area as a r e s u l t of i t s past market s t a b i l i t y and performance, and i t s q u a l i t i e s of h e a t - r e s i s t a n c e and d u r a b i l i t y . For example 2.5 percent molybdenum has replaced a tungsten content of 9 percent i n hot work t o o l s t e e l s . T his use accounts f o r about 9 percent of consumption.
5
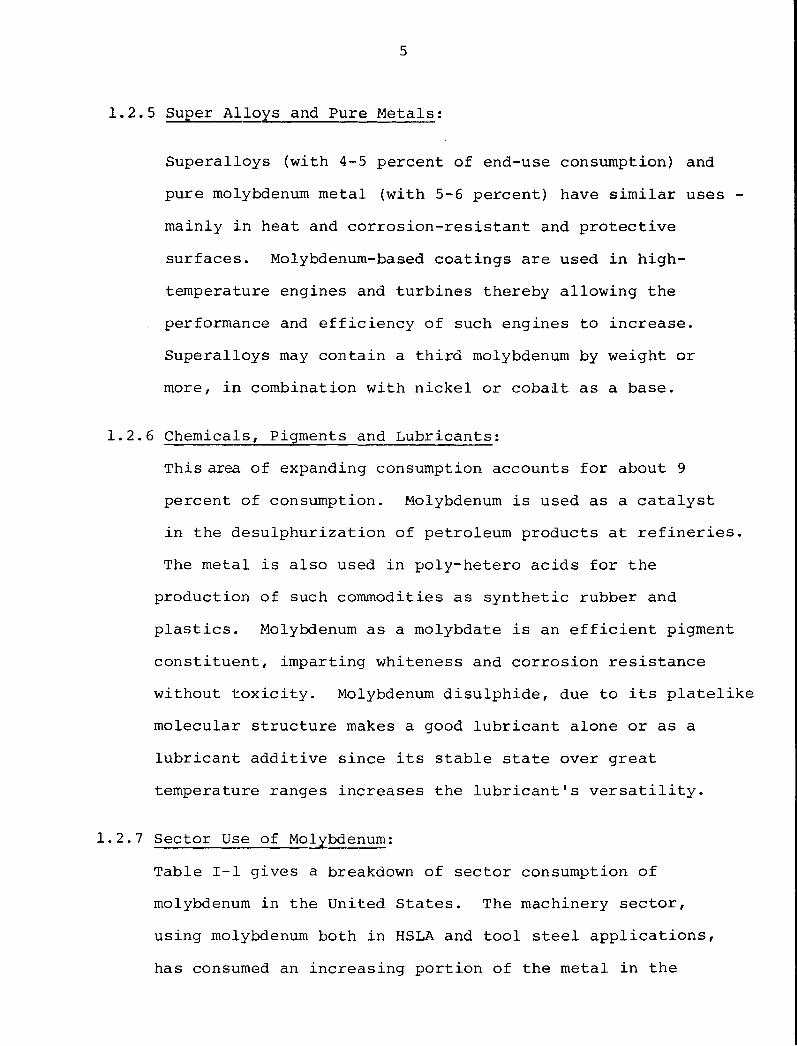
1-2-5 Super A l l o y s and Pure Metals;
Superalloys (with 4-5 percent of end-use consumption) and pure molybdenum metal (with 5-6 percent) have s i m i l a r uses -mainly i n heat and c o r r o s i o n - r e s i s t a n t and p r o t e c t i v e surfaces. Molybdenum-based coatings are used i n high-temperature engines and t u r b i n e s thereby a l l o w i n g the performance and e f f i c i e n c y of such engines to i n c r e a s e . Superalloys may c o n t a i n a t h i r d molybdenum by weight or more, i n combination w i t h n i c k e l or c o b a l t as a base.
1.2.6 Chemicals, Pigments and L u b r i c a n t s ; This area of expanding consumption accounts f o r about 9 percent of consumption. Molybdenum i s used as a c a t a l y s t i n the d e s u l p h u r i z a t i o n of petroleum products at r e f i n e r i e s . The metal i s a l s o used i n poly-hetero a c i d s f o r the
production of such commodities as s y n t h e t i c rubber and p l a s t i c s . Molybdenum as a molybdate i s an e f f i c i e n t pigment c o n s t i t u e n t , imparting whiteness and c o r r o s i o n r e s i s t a n c e without t o x i c i t y . Molybdenum d i s u l p h i d e , due to i t s p l a t e l i k e molecular s t r u c t u r e makes a good l u b r i c a n t alone or as a l u b r i c a n t a d d i t i v e s i n c e i t s s t a b l e s t a t e over great temperature ranges increases the l u b r i c a n t ' s v e r s a t i l i t y .
1.2.7 Sector Use of Molybdenum: Table 1-1 gives a breakdown of sect o r consumption of molybdenum i n the United S t a t e s . The machinery s e c t o r , using molybdenum both i n HSLA and t o o l s t e e l a p p l i c a t i o n s , has consumed an i n c r e a s i n g p o r t i o n of the metal i n the

6
TABLE 1-1
UNITED STATES MOLYBDENUM DEMAND PATTERN BY SECTOR 1964 - 1977
SECTOR PERCENTAGES *
1964 1968 1972 1976 1977
T r a n s p o r t a t i o n 30. 0 29.9 20.3 21. 9 21.1
Machinery 23. 5 23.9 34.4 35.1 34.2
O i l and Gas I n d u s t r i e s 18.6 17.8 14 .6 14.8 14.9
Chemicals 7.9 8.1 12.2 9.9 11.6
E l e c t r i c a l 2.4 2.5 8.6 8.8 8.5
Other 17.5 17.8 9.9 9.5 9.6
* May not add to 100% due to rounding
Source: U.S. Bureau of Mines, Molybdenum Commodity P r o f i l e s , 1975 and 1979.

Figure 1-1
PRINCIPAL COMMERCIAL FORMS AND USES OF MOLYBDENUM M O L Y B D E N I T E IN ORE
M 0 S 2
M I L L I N G A N O F L O T A T I O N
M O L Y B D E N I T E C O N C E N T R A T E S M O L Y B O E N I T E C O N C E N T R A T E S P U R I F Y DIRECT A O D I T I O N T O STEEL Mo S j
P U R I F Y P U R E
M O L Y B D E N U M D I S U L F I D E M o S ;
ROASTING F U R N A C E
" C A L C I U M M O L Y B O A T E "
PITCHBINOEft HYDRAULIC
PWjSS
M O L Y B O I C OXIOE
BRIQUETS
TECHNICAL M O L Y B O I C
ELEC FUftN
I SODIUM M O L Y B O A T E f.
N « 2 M o 0 4
A L L O Y STEEL
M F G . OTHER
C H E M I C A L S
O E C O R A T I V E COATINGS
ON ZINC.ETC
^ , CAST H I R O N lm
E X T R U S I O N TO B I L L E T S
ADDITION TO G L A S S
E L E C T R I C F U R N A C E
S U B L I M A T I O N M o O j t f t H j O H
• " f p j G M E N T s j
S P R A Y FOR : i T R U S TREES h F E R T I L I Z E R
u „ 1 | P U R E I I M „ n * \ i A M M O N I U M M o 0 3 * — _ M O L Y B O I C _ ^ M ° ° 3 I M O L Y B O A T E
H . O H { ^ O ^ D ^ ^ r i * H * ° H M < N H < ) C o ° M
E L E C T R I C F U R N A C E
R E D U C T I O N
E L E C T R I C F U R N A C E
M 0 O 3 • H 2
ARC CASTING OF
INGOTS
M E T A L POWDER
H Y D R A U L I C PRESS H SINTERING SWAGING.
F U R N A C E H ? F O n G t N C . ATMOSPHERE ETC.
WELDING RODS
A O D I T I O N T O V O N F E R R O U S
A L L O Y S
M F G . OF C H E M I C A L S
C H E M I C A L RE A G E N T ,
ETC.
BUREAU OF MINES U.S. DEPARTMENT OF THE INTERIOR
8
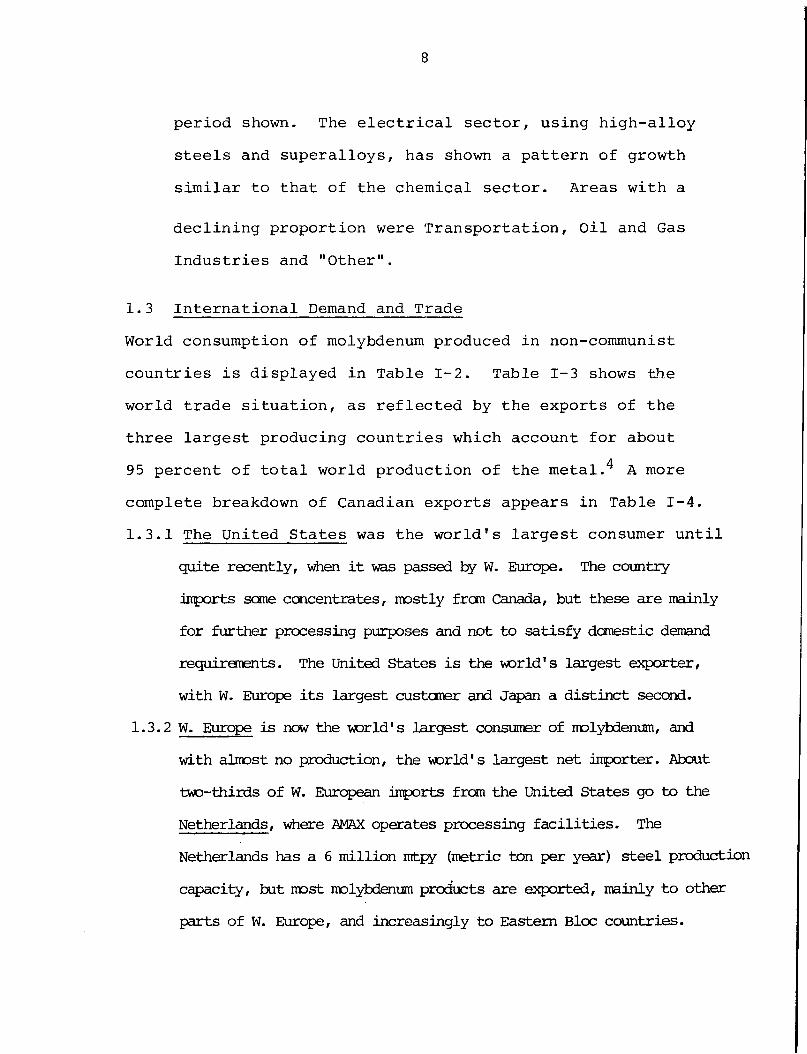
p e r i o d shown. The e l e c t r i c a l s e c t o r , using h i g h - a l l o y s t e e l s and s u p e r a l l o y s , has shown a p a t t e r n of growth s i m i l a r to that of the chemical s e c t o r . Areas w i t h a
d e c l i n i n g p r o p o r t i o n were T r a n s p o r t a t i o n , O i l and Gas I n d u s t r i e s and "Other".
1.3 I n t e r n a t i o n a l Demand and Trade World consumption of molybdenum produced i n non-communist c o u n t r i e s i s d i s p l a y e d i n Table 1-2. Table 1-3 shows the world trade s i t u a t i o n , as r e f l e c t e d by the exports of the three l a r g e s t producing c o u n t r i e s which account f o r about 95 percent of t o t a l world production of the metal. 4 A more complete breakdown of Canadian exports appears i n Table 1-4. 1.3.1 The United States was the world's l a r g e s t consumer u n t i l
quite recently, when i t was passed by W. Europe. The country imports seme concentrates, mostly frcm Canada, but these are mainly for further processing purposes and not to satisfy domestic demand requirements. The United States i s the world's largest exporter, with W. Europe i t s largest customer and Japan a distinct second.
1.3.2 W. Europe i s now the world's largest consumer of molybdenum, and with almost no production, the world's largest net importer. About two-thirds of W. European imports from the United States go to the Netherlands, where AMAX operates processing f a c i l i t i e s . The Netherlands has a 6 million mtpy (metric ton per year) steel production capacity, but most molybdenum products are exported, mainly to other parts of W. Europe, and increasingly to Eastern Bloc countries.

TABLE 1-2 WORLD CONSUMPTION OF MOLYBDENUM PRODUCED
IN NON-COMMUNIST COUNTRIES, 1966/70/73-78 (1000 M e t r i c : tons contained Mo)
1966 1970 1973 1974 1975 1976 1977 1978e U.S.A. 27.2 23.6 31.8 34.0 24. 9 25.9 27.2 29.5 W. Europe 19.9 30.4* 29.5 35.4 29.9 31.8 31.8 32.7 Eastern Bloc 0.9 * 5.4 6.4 6.8 6.8 7.7 9.1 Japan 4.9 9.1 10.4 12.2 9.5 11.3 10.9 11.3 Others - 3.2 5.0 5.9 5.0 4.5 5.0 5.4
53.5 66.2 82.1 93. 9 76.2 80.3 82.6 88.0
e - estimate * - Eastern Bloc i n c l u d e d i n W. Europe Source - Goth, J.W., AMAX, E & MJ March 1979, March 1976
except 1966 - P l a c e r Development.

10 TABLE 1 - 3
I n t e r n a t i o n a l Molybdenum Trade 197 6/77 (metric tons contained Mo)
Exporters USA* CANADA CHILE* Importers 1976 1977 1976 1977 1977 A u s t r i a 39 272 _ _ 862 Benelux 3 112 3 210 4 028 5 797 920 France 179 264 423 356 -W. Germany 3 646 2 539 519 1 156 1 040 U.K. 496 406 2 275 2 268 2 023 I t a l y 19 280 - - 453 Netherlands 12 678 14 111 962 402 2 676 Sweden 1 245 1 035 53 - 497 Others 246 - 46 - 48 W. Europe 21 660 22 783 8 306 9 979 8 519 E. Europe 30 1 083 - - 39 Argentine 75 81 20 - 136 B r a z i l 105 137 - - 1 270 Canada 169 238 - - 208 Mexico 399 288 - - -U.S. - - 1 104 1 223 208 Venezuela 271 - - - -Americas 1 091 744 1 124 1 223 1 822 Japan 5 322 4 729 4 866 3 920 689 I n d i a 209 234 134 - -P h i l l i p i n e s 1 2 40 40 -S. A f r i c a 34 85 6 - 140 Others 20 118 75 147 39 World T o t a l s 28 300 29 778 14 551 15 309 11 209
* Exports of ore, concentrates and molybdic oxide ** Ch i l e a n data not a v a i l a b l e f o r 1976 Sources: U.S. Bureau of Mines, Dept. of Energy, Mines and
Resources Canada, Chilean Copper Commission, Chilean Banco d e l Estado.
11
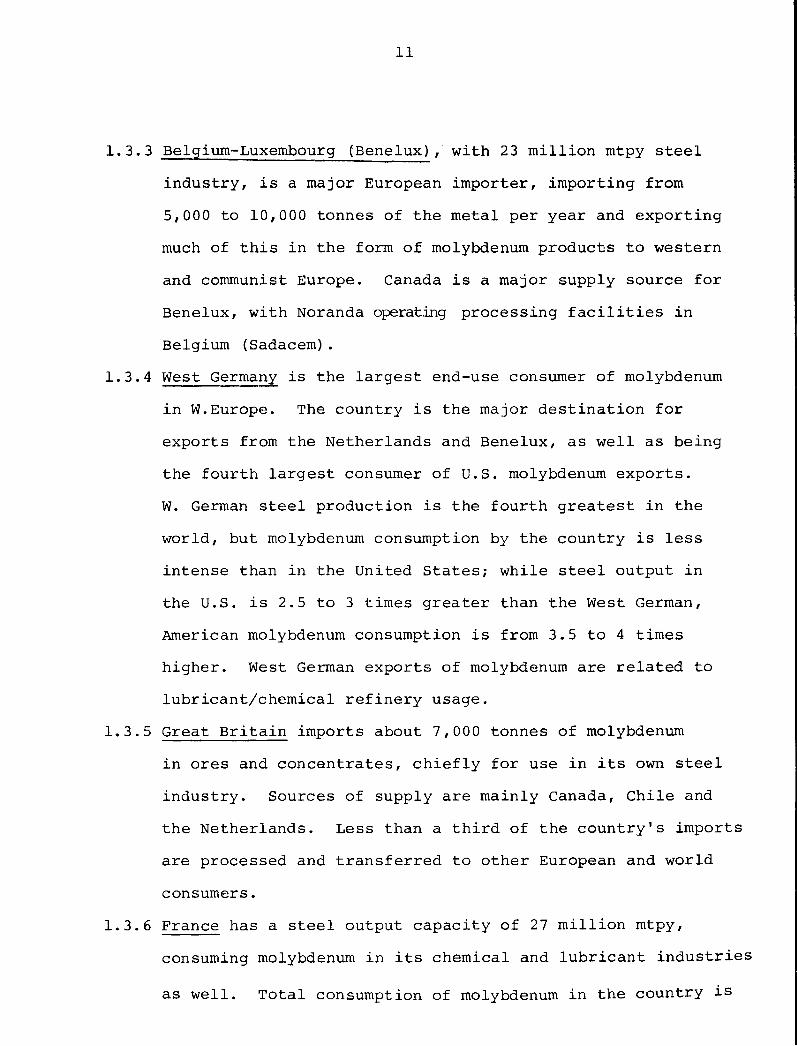
1.3.3 Belgium-Luxembourg (Benelux),' w i t h 23 m i l l i o n mtpy s t e e l i n d u s t r y , i s a major European importer, importing from 5,000 to 10,000 tonnes of the metal per year and e x p o r t i n g much of t h i s i n the form of molybdenum products to western and communist Europe. Canada i s a major supply source f o r Benelux, w i t h Noranda operating processing f a c i l i t i e s i n Belgium (Sadacem).
1.3.4 West Germany i s the l a r g e s t end-use consumer of molybdenum i n W.Europe. The country i s the major d e s t i n a t i o n f o r exports from the Netherlands and Benelux, as w e l l as being the f o u r t h l a r g e s t consumer of U.S. molybdenum exports. W. German s t e e l production i s the f o u r t h g r e a t e s t i n the world, but molybdenum consumption by the country i s l e s s intense than i n the United S t a t e s ; w h i l e s t e e l output i n the U.S. i s 2.5 to 3 times greater than the West German, American molybdenum consumption i s from 3.5 to 4 times higher. West German exports of molybdenum are r e l a t e d to l u b r i c a n t / c h e m i c a l r e f i n e r y usage.
1.3.5 Great B r i t a i n imports about 7,000 tonnes of molybdenum i n ores and concentrates, c h i e f l y f o r use i n i t s own s t e e l i n d u s t r y . Sources of supply are mainly Canada, C h i l e and the Netherlands. Less than a t h i r d of the country's imports are processed and t r a n s f e r r e d to other European and world consumers.
1.3.6 France has a s t e e l output c a p a c i t y of 27 m i l l i o n mtpy, consuming molybdenum i n i t s chemical and l u b r i c a n t i n d u s t r i e s
as w e l l . T o t a l consumption of molybdenum i n the country i s

12
about 4,000-5,000 mtpy, w i t h main sources of supply
being other W.European c o u n t r i e s . 1.3.7 I t a l y has about 10 percent l e s s s t e e l production c a p a c i t y
than France, but i s a l e s s i n t e n s i v e molybdenum consumer at about 2,500-3,000 mtpy
1.3.8 Sweden i s W.Europe's second l a r g e s t end-use consumer of molybdenum a f t e r West Germany at about 6^00 mtpy. The country's 6 m i l l i o n mtpy s t e e l i n d u s t r y i s small by world standards but i t produces much s t a i n l e s s , high a l l o y , highspeed and s u p e r a l l o y s t e e l s and thus the u n i t consumption of molybdenum i s l a r g e . Sources of supply are mainly other W.European c o u n t r i e s , but the United States provides a s i g n i f i c a n t share of the country's molybdenum imports.
1.3.9 Minor W. European consumers of molybdenum i n c l u d e : A u s t r i a which processes most of i t s imports i n t o molybdenum products f o r f u r t h e r export; Spain, w i t h a s i z e a b l e s t e e l i n d u s t r y but low u n i t consumption molybdenum use, and Yugoslavia, which has some molybdenun resources but i s s t i l l a net importer.
1.3.10 The Soviet Union and So v i e t Bloc c o u n t r i e s are l a r g e net importers of molybdenum. The major source f o r these c o u n t r i e s has t r a d i t i o n a l l y been W.Europe, where molybdenum from the Americas i s processed and re-exported. W.European exports to the Sovie t Bloc have increased s u b s t a n t i a l l y i n recent years but no recent s t a t i s t i c s are a v a i l a b l e . U.S.
13
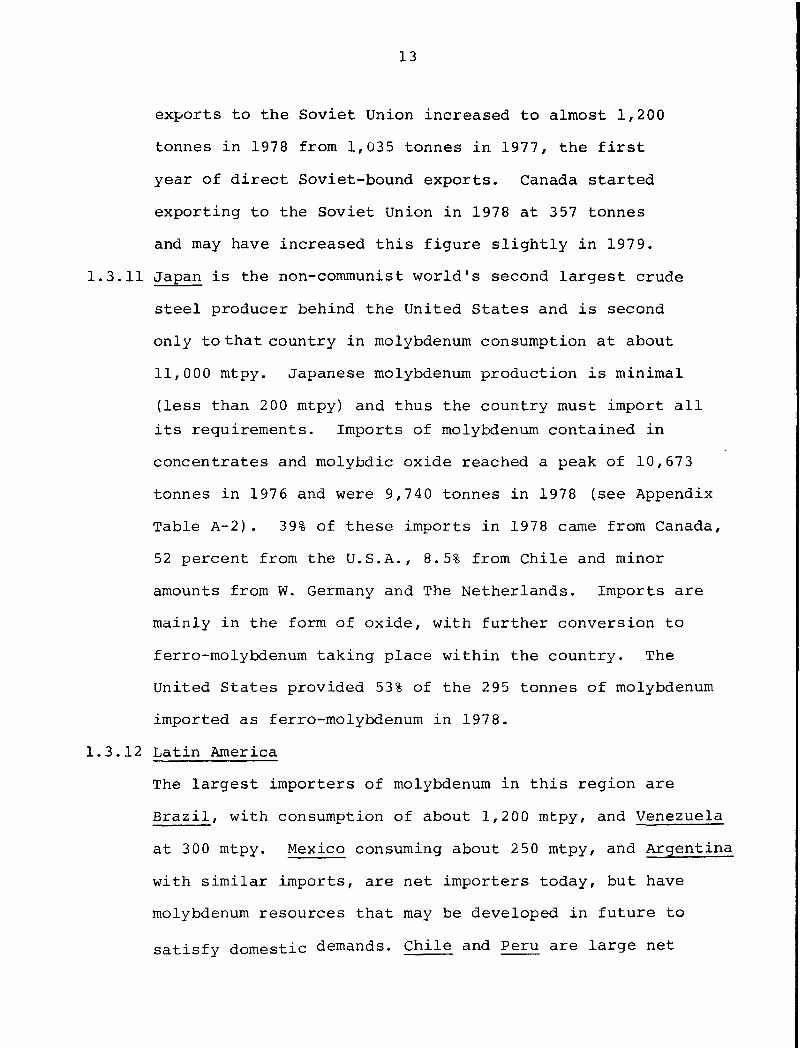
exports to the Soviet Union increased t o almost 1,200 tonnes i n 1978 from 1,035 tonnes i n 1977, the f i r s t year of d i r e c t Soviet-bound exports. Canada s t a r t e d e x p o r t i n g to the Soviet Union i n 1978 at 3 57 tonnes and may have increased t h i s f i g u r e s l i g h t l y i n 197 9.
1.3.11 Japan i s the non-communist world's second l a r g e s t crude s t e e l producer behind the United States and i s second only to t h a t country i n molybdenum consumption at about 11,000 mtpy. Japanese molybdenum production i s minimal ( l e s s than 2 00 mtpy) and thus the country must import a l l i t s requirements. Imports of molybdenum contained i n concentrates and molybdic oxide reached a peak of 10,673 tonnes i n 1976 and were 9,740 tonnes i n 1978 (see Appendix Table A-2). 39% of these imports i n 1978 came from Canada, 52 percent from the U.S.A., 8.5% from C h i l e and minor amounts from W. Germany and The Netherlands. Imports are mainly i n the form of oxide, w i t h f u r t h e r conversion to ferro-molybdenum t a k i n g place w i t h i n the country. The United States provided 53% of the 295 tonnes of molybdenum imported as ferro-molybdenum i n 1978.
1.3.12 L a t i n America The l a r g e s t importers of molybdenum i n t h i s r e g i o n are B r a z i l , w i t h consumption of about 1,2 00 mtpy, and Venezuela at 3 00 mtpy. Mexico consuming about 2 50 mtpy, and Argentina w i t h s i m i l a r imports, are net importers today, but have molybdenum resources that may be developed i n f u t u r e to s a t i s f y domestic demands. C h i l e and Peru are l a r g e net

14 TABLE 1 - 4
CANADA MOLYBDENUM TRADE, 1977-1978
Exports Molybdenum in ores and concentrates and scrap
Japan Belgium and Luxembourg United States United Kingdom Germany, Vest U.S.S.R. France Australia Other Countries
Total
1977 Kg $
3 920 400 41 739 000 5 797 400 40 844 000 1 222 900 9 781 000 2 267 500 16 049 000 1 156 300 8 866 000
356 300 3 111 000 147 100 1 645 000 442 500 3 559 000
15 310 400 125 594 000
1978 Kg
4 262 600 53 443 000 4 214 800 30 496 000 3 364 800 20 065 000 1 654 200 12 036 000
728 500 9 480 000 357 300 4 463 000 300 500 3 482 000 91 400 1 525 000
166 900 2 063 000
15 141 000 137 053 000
Imports Molybdic oxide (containing less than 1 per cent impurities) 192 142 1 221 000
Molybdenum in ores and concentrates 3 (Mo content) 237 668 1 702 635
Ferromolybdenum3
(Gross weight) 74 330 498 485
Consumption (Mo content) Ferrous and nonferrous alloys 875 686 Electrical and electronics 2 719
» J)ther uses 4 49 442
Total 927 847
Source: Statistics Canada, except where noted,
^Producers* shipments (Mo content) of molybdenum concentrates, molybdic oxide and ferromolybdenum. 2 i n c i U ( j e s molybdenite, molybdic oxide in ores and concentrates. ^United States exports of molybdenum to Canada, reported by. the U.S. Bureau of Commerce, Exports of Domestic and Foreign Merchandise (Report 410), value in U.S. currency. These imports are not available separately in o f f i c i a l Canadian trade statistics. 4Chiefly pigment uses.
p Preliminary; ... Not Available
- molybdic oxide and ferromolybdenum both contain about 60% Mo. Source: Energy, Mines and Resources.

15
exporters. Both c o u n t r i e s consume l e s s than 1 percent of domestic molybdenum production. The United S t a t e s and C h i l e supply most of the L a t i n American molybdenum imports.
1.3.13 A u s t r a l a s i a and A f r i c a A u s t r a l i a has had no mine production s i n c e 197 4 and has had to r e l y on imports from the U.S. and the Commonwealth since then. S. Korea and Taiwan import small amounts of the metal, mainly from the U.S.; South Korea i s a l s o a small net exporter. I n d i a and S . A f r i c a consume about 200-250 mtpy each wi t h most imports coming from Canada and the U.S. A number of other c o u n t r i e s i n the reg i o n consume minor amounts of molybdenum. G e n e r a l l y , demand i s d i f f u s e and l o c a l production of the metal minimal.
1.3.14 Canada Canadian molybdenum consumption as estimated by Energy Mines and Resources (Ottawa) i s p r o f i l e d below:
TABLE 1-5 CANADA - Consumption of Molybdenum*
(Metric tons contained Mo) 1960 1965 1970 1975 1976 1977 1978 e
4 7 3 772 1037 1437 1260 928 1700
Source: Energy, Mines and Resources, M i n e r a l s Yearbook * As estimated by consumers e Estimate
Consumption ranges between 5 and 10 percent of domestic production, thus the country i s a l a r g e net exporter. P r i o r t o 1965 Canada was a net importer, and even now
the country r e l i e s on imports t o s a t i s f y a modest p o r t i o n
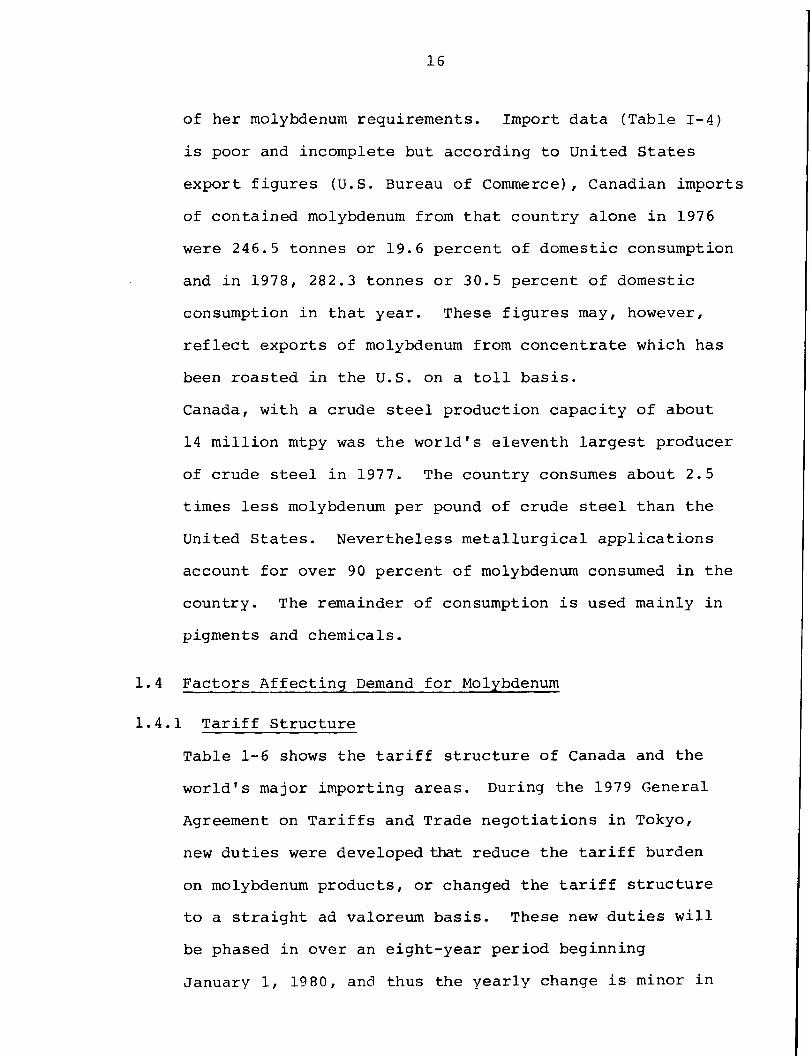
16
of her molybdenum requirements. Import data (Table 1-4) i s poor and incomplete but according to United States export f i g u r e s (U.S. Bureau of Commerce), Canadian imports of contained molybdenum from th a t country alone i n 1976 were 246.5 tonnes or 19.6 percent of domestic consumption and i n 1978, 282.3 tonnes or 30.5 percent of domestic consumption i n that year. These f i g u r e s may, however, r e f l e c t exports of molybdenum from concentrate which has been roasted i n the U.S. on a t o l l b a s i s . Canada, w i t h a crude s t e e l production c a p a c i t y of about 14 m i l l i o n mtpy was the world's eleventh l a r g e s t producer of crude s t e e l i n 1977. The country consumes about 2.5 times l e s s molybdenum per pound of crude s t e e l than the United S t a t e s . Nevertheless m e t a l l u r g i c a l a p p l i c a t i o n s account f o r over 90 percent of molybdenum consumed i n the country. The remainder of consumption i s used mainly i n pigments and chemicals.
1.4 Factors A f f e c t i n g Demand f o r Molybdenum
1.4.1 T a r i f f S t r u c t u r e Table 1-6 shows the t a r i f f s t r u c t u r e of Canada and the world's major importing areas. During the 1979 General Agreement on T a r i f f s and Trade n e g o t i a t i o n s i n Tokyo, new d u t i e s were developed that reduce the t a r i f f burden on molybdenum products, or changed the t a r i f f s t r u c t u r e to a s t r a i g h t ad valoreum b a s i s . These new d u t i e s w i l l be phased i n over an eight-year p e r i o d beginning January 1, 19 80, and thus the y e a r l y change i s minor i n
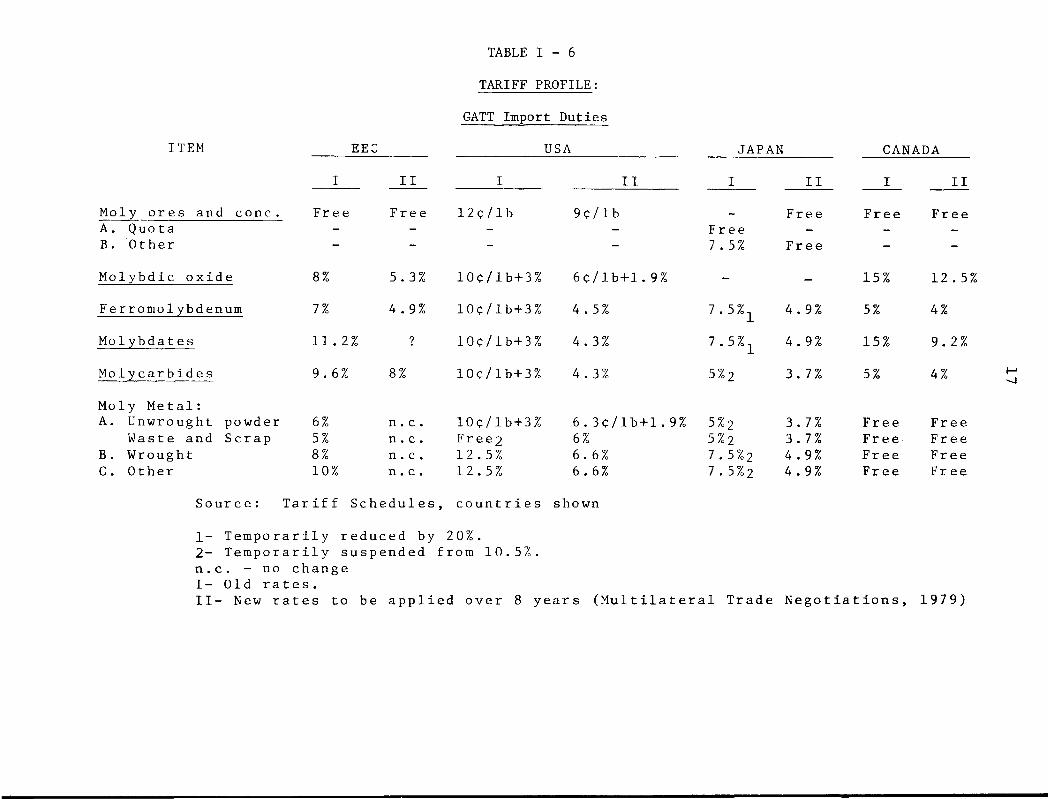
TABLE 1 - 6
TARIFF PROFILE:
GATT Import Duties
ITEM EEC USA JAPAN CANADA ITEM
I I I I I I I I I I I I
Moly o r e s and cone. F r e e F r e e 1 2 c / l b 9 c / l b _ F r e e F r e e F r e e A. Quota - - - - F r e e - - -B. O t h e r - - - - 7 . 5% F r e e - -
M o l y b d i c o x i d e 8% 5.3% 10c/lb+3% 6 c / l b + l . 9 % - - 15% 12 . 5%
F e r r o m o l y b d e n u m 7% 4 . 9% 10c/lb+3% 4 . 5% 7 . 5 % 2 4 . 9% 5% 4%
M o l y b d a t e s 11. 2% 10c/lb+3% 4.3% 7 . 5 % x 4.9% 15% 9.2%
M o l y c a r b i d e s 9.6% 8% 10c/lb+3% 4.3% 5% 2 3. 7% 5% 4%
Moly M e t a l : A. Unwrought powder 6% n . c . 10c/lb+3% 6 . 3 c / l b + l . 9 % 5% 2 3.7% F r e e F r e e
Waste and S c r a p 5% n . c . Fr ee2 6% 5 % 2 3.7% F r e e F r e e B. Wrought 8% n . c . 12.5% 6.6% 7 . 5% 2 4 . 9% F r e e F r e e C. O t h e r 10% n . c . 12.5% 6 . 6% 7 . 5%2 4 .9% F r e e F r e e
Sour c e: T a r i f f S c h e d u l e s , c o u n t r i e s shown
1- T e m p o r a r i l y r e d u c e d by 20%. 2- T e m p o r a r i l y s u s p e n d e d from 10.5%. n.c. - no change I - O l d r a t e s . I I - New r a t e s to be a p p l i e d o v e r 8 y e a r s ( M u l t i l a t e r a l T r a d e N e g o t i a t i o n s , 1979)
18
most cases. G e n e r a l l y , t a r i f f s on l e s s processed m a t e r i a l s are q u i t e minor, w i t h Canadian exports of concentrate to the E.E.C. and concentrate and oxide t o Japan e n t e r i n g f r e e of d u t i e s since mid-1976. These type of exports account f o r most of the c u r r e n t Canadian shipments (see S e c t i o n 5).
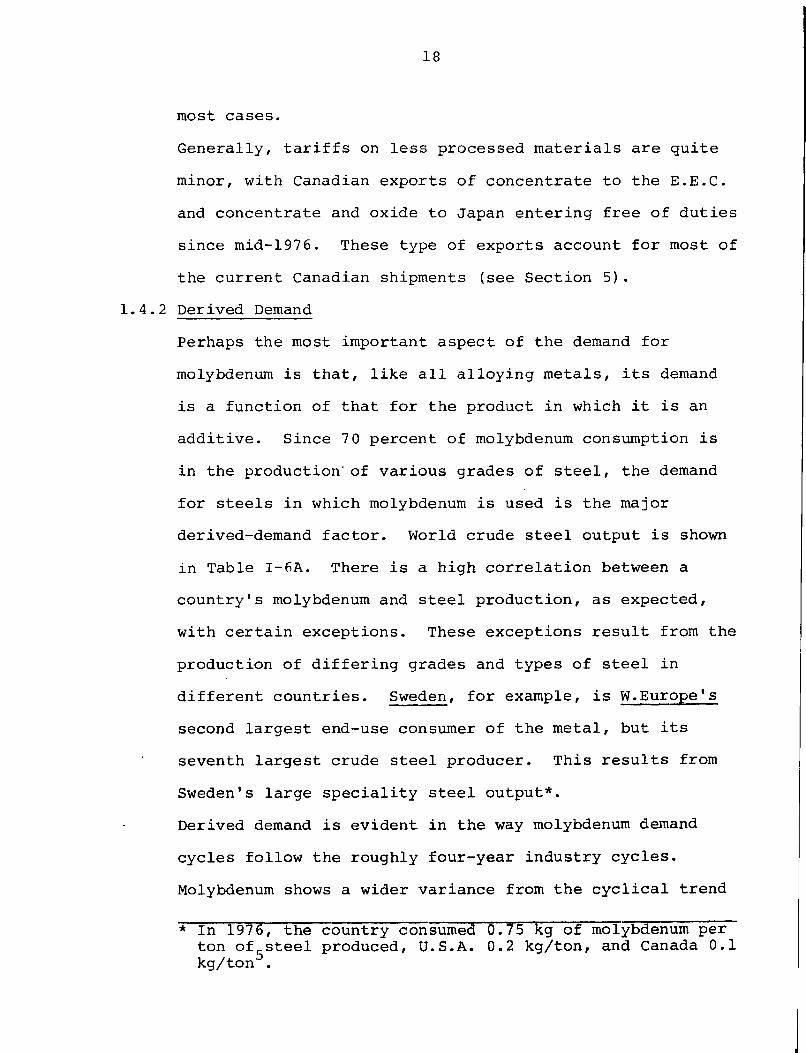
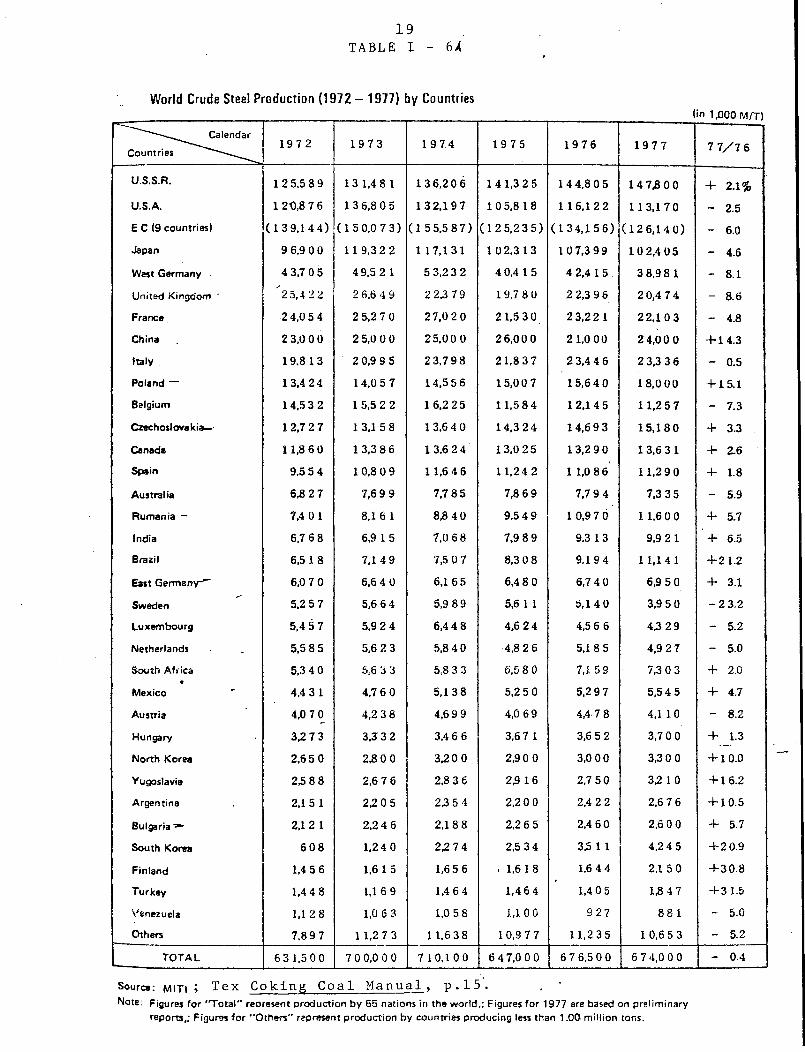
1.4.2 Derived Demand Perhaps the most important aspect of the demand f o r molybdenum i s t h a t , l i k e a l l a l l o y i n g metals, i t s demand i s a f u n c t i o n of tha t f o r the product i n which i t i s an a d d i t i v e . Since 7 0 percent of molybdenum consumption i s i n the production' of v a r i o u s grades of s t e e l , the demand f o r s t e e l s i n which molybdenum i s used i s the major derived-demand f a c t o r . World crude s t e e l output i s shown i n Table I-6A. There i s a high c o r r e l a t i o n between a country's molybdenum and s t e e l p r oduction, as expected, w i t h c e r t a i n exceptions. These exceptions r e s u l t from the production of d i f f e r i n g grades and types of s t e e l i n d i f f e r e n t c o u n t r i e s . Sweden, f o r example, i s W.Europe's second l a r g e s t end-use consumer of the metal, but i t s seventh l a r g e s t crude s t e e l producer. This r e s u l t s from Sweden's l a r g e s p e c i a l i t y s t e e l output*. Derived demand i s evident i n the way molybdenum demand c y c l e s f o l l o w the roughly four-year i n d u s t r y c y c l e s . Molybdenum shows a wider variance from the c y c l i c a l trend
* In 197 6, the country consumed 0.75 kg of molybdenum per ton o f 5 s t e e l produced, U.S.A. 0.2 kg/ton, and Canada 0.1 kg/ton .
19 TABLE 1 - 6 4
W o r l d Crude Steel P r o d u c t i o n (1972 - 1977) by Countries (in 1,000 M/T)
^ ^ ^ - ^ ^ ^ Calendar Countries ' --^^^
1972 1973 19 74 1975 1976 1977 7 7/7 6
U.S.S.R. 1 2 5,5 8 9 13 1,4 8 1 136,206 14 1,325 14 4,805 1 4 73 0 0 4- 2.1% U.S.A. 1 2t),8 7 6 1 3 6,8 0 5 132,197 105,8 18 1 16,12 2 1 13,17 0 - 2.5 E C O countries) (139.144) (1 50,0 7 3) (1 55,587) (125,235) (1 34,1 56) (126,14 0) - 6.0 Japan 9 6,9 0 0 11 9.3 2 2 1 17,131 1 02,3 13 10 7,3 99 10 2,4 05 - 4.6
West Germany 4 3,7 0 5 49.5 2 1 5 3,2 3 2 4 0,4 1 5 4 2,4 1 5 3 8,98 1 - 8.1
United Kingdom " ^25,4 2 2 2 6,6 4 9 22379 1 9.7 8 0 2 2,3 9 6 2 0,4 7 4 - 8.6
France. 24,0 5 4 2 5,2 7 0 27,0 2 0 21,530 23,22 1 22,10 3 - 4.8 China 2 3,0 0 0 2 5,0 0 0 25,00 0 26.000 21,0 00 2 4,00 0 + 14.3
Italy 1 9.8 1 3 2 0,9 9 5 23,798 21,8 3 7 23,446 2 3,3 3 6 - 0.5
Poland — 13.4 24 1 4,0 5 7 14,5 5 6 15,00 7 15,640 18,000 4-15.1 Belgium 14.5 3 2 1 5,5 2 2 16,2 25 11,5 8 4 12,14 5 1 1,2 5 7 - 7.3 Czechoslovakia- 1 2,7 2 7 1 3,1 5 8 1 3,6 4 0 14,3 24 14,693 15,18 0 4- 3.3
Canada 11,8 6 0 1 3,3 8 6 1 3,6 2 4 13,0 25 13,2 9 0 1 3,6 3 1 4- 2.6 Spain 9.5 5 4 1 0,8 0 9 1 1,6 4 6 11,24 2 1 1,0 8 6 11,2 9 0 4- 1.8
Australia 6,8 2 7 7,69 9 7,7 8 5 73 6 9 7,7 9 4 7,3 3 5 - 5.9
Rumania — 7,4 0 1 8,1 6 1 83 4 0 93 4 9 1 0,9 7 6 11,6 0 0 4- 5.7
India 6,7 6 8 6.9 15 7,0 6 8 7,9 8 9 93 13 9.9 21 4- 6.5
Brazil 6318 7,1 4 9 7,5 0 7 8,3 0 8 9,19 4 11,14 1 4-21.2
East Germany-"" 6,0 7 0 6,6 4 0 6,16 5 6,4 8 0 6,7 4 0 63 5 0 4- 3.1
Sweden 5,2 5 7 5,6 6 4 5.9 89 5,6 1 1 5,14 0 3,9 5 0 -2 3.2
Luxembourg 5,4 5 7 5,9 2 4 6,4 4 8 4,6 2 4 4,5 6 6 43 29 - 5.2
Netherlands 5,5 8 5 5,6 2 3 5,8 4 0 4,8 2 6 5,18 5 4,9 2 7 - 5.0
South Africa 5,3 4 0 5,6 3 3 53 3 3 6,5 8 0 7,15 9 73 0 3 4- 2.0 •
Mexico 4.4 3 1 4,7 6 0 5,13 8 5,2 5 0 5,2 9 7 5,5 4 5 4- 4.7
Austria 4,0 7 0 4,2 3 8 4,6 9 9 4,0 6 9 4,4 7 8 4,1 1 0 - 8.2
Hungary 3,2 7 3 3,3 3 2 3,4 6 6 3,6 7 1 3,6 5 2 3,7 0 0 4- 1.3
North Korea 2,6 5 0 23 0 0 3,20 0 2,90 0 3,0 0 0 3,3 0 0 4-10.0
Yugoslavia 2^8 8 2,6 7 6 23 3 6 23 16 2,7 5 0 3,2 10 4-16.2
Argentina 2,15 1 22 0 5 23 5 4 2,2 0 0 2,4 2 2 2,6 7 6 4-10.5
Bulgaria ^ 2,12 1 2,2 4 6 2,18 8 2,2 6 5 2,4 6 0 2,6 0 0 4- 5.7
South Korea 608 1,24 0 2,274 2.5 34 33 1 1 4.2 4 5 4-2 0.9
Finland 1,4 5 6 1,6 15 1,6 5 6 i 1,618 1,6 4 4 2.1 5 0 4-30.8
Turkey 1,4 4 8 1,16 9 1,4 6 4 1,464 1,4 0 5 1,8 4 7 +315
Venezuela 1,12 8 1,0 6 3 1,0 5 8 1,10 0 927 88 1 - 5.0
Others 7,8 9 7 1 1,2 7 3 11,6 3 8 10,9 7 7 11,235 10,6 5 3 - 5.2
TOTAL 63 1,500 7 0 0.0 0 0 710,100 6 4 7,000 6 7 6.500 6 7 4,000 - 04
Source: MITI ; Tex C o k i n g C o a l M a n u a l , p. 15. , * Note: Figures for 'Total" reoresent production by 65 nations in the world.; Figures for 1977 are based on preliminary
reports,; Figures for "Others" represent production by countries producing less than 1.00 million tons.
20
than does s t e e l , l i k e l y due to the consumption of molybdenum i n s t e e l s used i n c a p i t a l expansion p r o j e c t s ( p i p e l i n e s , mineral e x p l o r a t i o n , nuclear energy) r a t h e r than i n more consumer-oriented s t e e l s (appliances, c o n s t r u c t i o n s t a r t s , e t c . ) * S t e e l c y c l e s are most o f t e n c l o s e l y t i e d t o the l a t t e r , r a t h e r than the former, type of consumption^. Tec h n o l o g i c a l advance i s an exogenous or "unexplained" v a r i a b l e that d i s r u p t s the o r d e r l y r e l a t i o n s h i p between demand f o r a metal and demand f o r i t s end-use products. The d i s c o v e r y of new a p p l i c a t i o n s and products and changes i n a l l o y i n g and r e f i n i n g techniques w i l l a f f e c t the demand f o r an a d d i t i v e metal l i k e molybdenum i n a f a s h i o n u n r e l a t e d to the demand f o r e x i s t i n g products. The e f f e c t of technol o g i c a l change on molybdenum demand can be seen i n the d i f f e r e n c e between the growth r a t e f o r s t e e l consumption (3-4 percent per year) and th a t f o r molybdenum (6-7 pe r c e n t ) . As new s t e e l a p p l i c a t i o n s f o r molybdenum have been found, i t s use i n s t e e l products has increased p r o p o r t i o n a l l y ; an
o f f s e t t i n g f a c t o r , however, i s the f a c t t h a t the use of molybdenum reduces the amount of s t e e l needed by i n c r e a s i n g the s t r e n g t h to weight r a t i o .
1.4.3 P r i c e E l a s t i c i t y of Demand; Cost C o n t r i b u t i o n and S u b s t i t u t i o n The p r i c e e l a s t i c i t y of demand i s a measure of the magnitude of demand changes that r e s u l t from a u n i t p r i c e change. Gen e r a l l y , metals tend to share the common c h a r a c t e r i s t i c of u n e l a s t i c demand i n the short run*. This means th a t f o r
* The "short run" i s def i n e d by the amount of time r e q u i r e d to make p l a n t changes or a d d i t i o n s - i t i s u s u a l l y from 1 to 3 years.

21
a given percentage increase i n p r i c e the demand f o r a commodity decreases by l e s s than t h a t percentage i n the short-run. This i s common amongst most metals because: (i) demand f o r metals i s de r i v e d from t h a t of t h e i r end-products. In most cases, metals c o n t r i b u t e only a f r a c t i o n of the f i n a l cost of the consumer good produced ( l i k e an automobile or an a p p l i a n c e ) . Thus metal p r i c e s can clim b s u b s t a n t i a l l y without having a s i g n i f i c a n t e f f e c t on the cost of a consumer good and hence i t s demand; ( i i ) s u b s t i t u t i o n i s o f t e n not p o s s i b l e i n the short-run due t o the time r e q u i r e d f o r equipment and process changes tha t may be r e q u i r e d to enable i t to occur.
In the case of molybdenum, the metal's c o n t r i b u t i o n to the cost of the f i n a l or consumer good v a r i e s widely depending upon the end-use i n v o l v e d * . The metal's g r e a t e s t end-use, i n HSLA s t e e l s , i n v o l v e s a lower cost of molybdenum per pound of s t e e l produced than any other s t e e l a p p l i c a t i o n , but t h i s may not imply t h a t short-run demand i s i n e l a s t i c , s i n ce HSLA s t e e l s u s u a l l y are the f i n a l good and not j u s t a c o n s t i t u e n t of a l a r g e r product. In s u p e r a l l o y a p p l i c a t i o n s , cost per pound i s high but the c o n t r i b u t i o n t o the t o t a l cost of a good may be low, si n c e small q u a n t i t i e s are of t e n used to cover a r e l a t i v e l y minor surface of the f i n a l
* A c t u a l cost-per-weight data on molybdenum i n d i f f e r e n t s t e e l s was not a v a i l a b l e .

22
product. Despite these i n c o n s i s t e n c i e s , the f a c t t h a t molybdenum i s an a d d i t i v e metal suggests i t would f i t the scenario i n (i) above q u i t e w e l l .
Molybdenum has enjoyed s u b s t a n t i a l gains since the 1950's through i t s s u b s t i t u t i o n f o r other a l l o y i n g agents. S u b s t i t u t i o n r e s u l t s from a combined engineering/economic d e c i s i o n based on the price-performance of a l t e r n a t i v e metals i n a c h i e v i n g a given g o a l . Molybdenum has "won out" over other a l l o y i n g agents because i t s price-performance r a t i o i s b e t t e r than other metals and because i t has simply out-performed i t s c ompetitive metals i n c e r t a i n a p p l i c a t i o n s . The p o s s i b i l i t y of s u b s t i t u t i o n i n s t e e l and a l l o y a p p l i c a t i o n s i s analysed below by end-use: 1.4.3.1 S t a i n l e s s S t e e l s and S u peralloys
Molybdenum's c o r r o s i o n and temperature r e s i s t a n t q u a l i t i e s are d i f f i c u l t t o r e p l a c e because the metal simply outperforms i t s s u b s t i t u t e s i n these a r e a s . 7 In s t a i n l e s s s t e e l s , chromium and n i c k e l , the other a l l o y c o n s t i t u e n t s , c o n t r i b u t e t o c o r r o s i o n r e s i s t a n c e (the key q u a l i t y i n s t a i n l e s s s t e e l s ) , but under c e r t a i n c o n d i t i o n s such as high temperature, molybdenum i s c r u c i a l . This means that s u b s t i t u t i o n i n these h i g h l y r e s i s t a n t s t e e l s i s u n l i k e l y . Another f a c t o r i n h i b i t i n g s u b s t i t u t i o n i n the short-run i s t h a t these s t e e l s are produced
and s o l d by t h e i r chemical content, not by p h y s i c a l

23
s p e c i f i c a t i o n s . Producers w i t h supply c o n t r a c t s w i l l t h e r e f o r e t o l e r a t e short-term p r i c e i n c r e a s e s because increased c o s t s must be t o l e r a t e d to f u l f i l l these c o n t r a c t s . A l s o , i n c e r t a i n cases, these increased c o s t s can be passed along to consumers i n the form of molybdenum-content surcharges by weight of s t e e l s o l d .
1.4.3.2 Tool S t e e l s Strength and h a r d e n a b i l i t y were among the q u a l i t i e s of molybdenum tha t enabled i t t o s u b s t i t u t e f o r tungsten i n t o o l s t e e l s . I t out-performed tungsten by v i r t u e of i t s r e l a t i v e s t a b i l i t y of p r i c e and supply i n comparison to the unstable tungsten market. The f i r s t s u stained use of molybdenum occurred when, i n World War I , tungsten was i n short supply.
S u b s t i t u t i o n between these s t e e l s i s thus a p o s s i b i l i t y i n the long-run i f the cu r r e n t molybdenum market i n s t a b i l i t y continues.
1.4.3.3 High-Strength Low-Alloy (HSLA) S t e e l s S u b s t i t u t i o n f o r molybdenum i s most l i k e l y i n t h i s area. S u b s t i t u t e s i n t h i s a p p l i c a t i o n i n c l u d e vanadium and Columbian (niobium); Columbian being the main a d d i t i v e metal used i n HSLA s t e e l s p r i o r
to popular use of molybdenum.

24
Since these s t e e l s are s o l d on t h e i r p h y s i c a l s p e c i f i c a t i o n s (e.g. t e n s i l e s t r e n g t h ) , there i s a great i n c e n t i v e f o r producers to s u b s t i t u t e as price-performance changes, i n order to keep c o s t s down. In the short-run d i f f e r e n t s t e e l r o l l i n g techniques can be used to reduce molybdenum content
and, as i n the case of la r g e diameter X-7 0 p i p e l i n e s t e e l , these techniques have completely e l i m i n a t e d the molybdenum content. In the long-run, a l l o y i n g techniques can be changed. (Table 1-7 gives a d e s c r i p t i o n of common s t e e l a d d i t i o n agents and t h e i r c o n t r i b u t i o n to the q u a l i t i e s of the product.
1.5 Summary Short-run demand f o r molybdenum was deemed t o be p r i c e -i n e l a s t i c due to the minor cost c o n t r i b u t i o n the metal has h i s t o r i c a l l y made to most of i t s i r o n and s t e e l products and i n other areas of growing demand. I t i s rep o r t e d , however, t h a t the p r i c e s p i r a l i n 197 9 d i d a f f e c t demand and t h a t s u b s t i t u t i o n d i d take p l a c e . Such s u b s t i t u t i o n i s l i m i t e d by the time r e q u i r e d t o make the process changes that s u b s t i t u t i o n n e c e s s i t a t e s , and by the presence of production c o n t r a c t s f o r s p e c i a l t y s t e e l s which s p e c i f y a given molybdenum content f o r the s t e e l produced.
25
In the longer run, s u b s t i t u t i o n i s more l i k e l y , e s p e c i a l l y i n t o o l and HSLA s t e e l a p p l i c a t i o n s . But even i n the long-run the p o s s i b i l i t y of s u b s t i t u t i o n i s reduced by the t r a d i t i o n a l p r i c e / s u p p l y r e l i a b i l i t y and p h y s i c a l performance of molybdenum.

TABLE 1 - 7
COMMON ADDITIVE AGENTS IN STEELMAKING
ELEMENT Aluminum Chromium
Cobalt
Columbium Molybdenum
N i c k e l
S i l i c o n Tantalum
Titanium
Tungsten
Vanadium
HOW USED Metal
F e r r o a l l o y , oxide
Metal
F e r r o a l l o y , metal F e r r o a l l o y , oxide
F e r r o a l l o y , metal, oxide
F e r r o a l l o y F e r r o a l l o y
F e r r o a l l o y
F e r r o a l l o y , metal, oxide
F e r r o a l l o y , oxide
MAIN EFFECTS ON STEEL Deoxidizes; hardens. Improves c o r r o s i o n r e s i s t a n c e . Strengthens. Improves r e s i s t a n c e to high temperatures, hardens. Deoxidizes; desulphurizes. Hardens improves c o r r o s i o n r e s i s t a n c e . Toughens improves c o r r o s i o n and heat r e s i s t a n c e . Deoxidizes; hardens. Improves c o r r o s i o n r e s i s t a n c e ; c o n t r o l s g r a i n s i z e . Improves high temperature c h a r a c t e r i s t i c s ^ d e oxidizes. Hardens; improves high temperature c h a r a c t e r i s t i c s . C o n t r o l g r a i n s i z e ; toughens.
to
Source: Department of Energy, Mines and Resources, Ottawa.

27
Section I Footnotes
1 Sutulov, A., Molybdenum and Rhenium, 1976, p.55.
2 Placer Development data
3 Based on AMAX and Placer Development data. See Appendix Table A - l .
4 Based on 1973 figures i n , Sutulov, A., Molybdenum and Rhenium, 1976 p.175. Canada, Ch i l e and the U.S.A. accounted f o r 95.3% of non-communist world trade i n that year.
5 B u t t e r f i e l d , J.A., and Ganshorn, J.A., "Molybdenum Supply and Demand Forecast", C.I.M., Annual Volume, 1977.
6 T i l t o n , J . , The Future of Non-Fuel Minerals, 1977, Chapter 5.
7 Greene, Norbert D., Corrosion Engineering, McGraw-Hill.
INTERNATIONAL SOURCES OF SUPPLY
31
2. INTERNATIONAL SOURCES OF SUPPLY
2.1 World Production
2.1.1 H i s t o r i c a l P r o f i l e
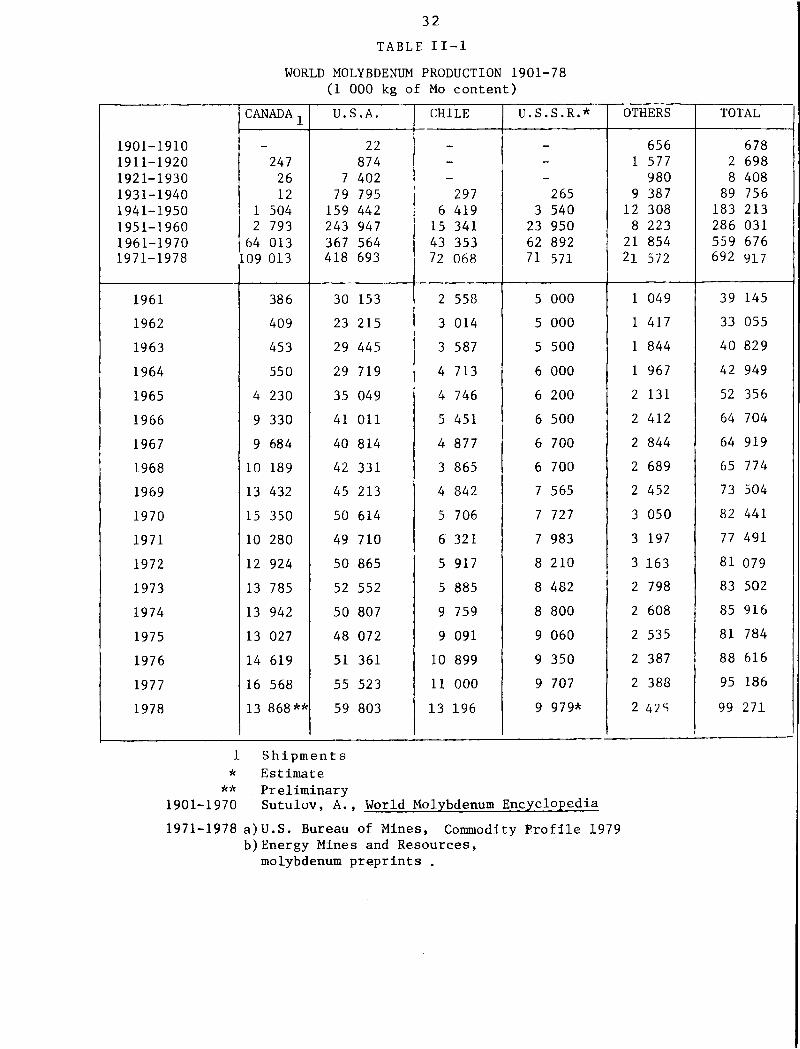
World Molybdenum production i s p r o f i l e d i n Table I I - l and Figure I I - l . The United States has dominated world product i o n since the 1920's when the Climax mine i n Colorado began operating on a sustained b a s i s and the Questa, New Mexico mine was developed. Major world sources of molybdenum p r i o r to World War I had been Norway, where the world's f i r s t molybdenum production occurred a t the Knaben mine i n the l a t e 1800's, and A u s t r a l i a .
Over the l a s t decade the trend has been toward steady e r o s i o n of the United S t a t e s ' l e a d i n g share of world prod u c t i o n (see Table II-3) . A f a c t o r i n t h i s trend may have been American s t o c k p i l i n g of the metal t h a t began i n the 1950's. By 1959 s t o c k p i l e s reached 38 000 m e t r i c tonnes -more than t o t a l world production f o r t h a t year. In 1963 r e l e a s e of s t o c k p i l e d m a t e r i a l s began and u n t i l 1977 t h i s source o f f s e t the pressure on sources of supply i n the United S t a t e s . U.S. demand f o r the metal peaked i n 1973 and 1974 when r e l e a s e of s t o c k p i l e d m a t e r i a l s t o t a l l e d about 16 000 metric tonnes. Since 1977, when the s t o c k p i l e was t o t a l l y
32
TABLE I I - l
WORLD MOLYBDENUM PRODUCTION 1901-78 (1 000 kg of Mo content)
CANADA 1 U.J >.A. CHILE U.S S.R.* OTHERS TOTAL
1901-1910 22 656 678 1911-1920 247 874 1 577 2 698 1921-1930 26 7 402 980 8 408 1931-1940 12 79 795 297 265 9 387 89 756 1941-1950 1 504 159 442 6 419 3 540 12 308 183 213 1951-1960 2 793 243 947 15 341 23 950 8 223 286 031 1961-1970 64 013 367 564 43 353 62 892 21 854 559 676 1971-1978 109 013 418 693 72 068 71 571 21 572 692 917
1961 386 30 153 2 558 5 000 1 049 39 145
1962 409 23 215 3 014 5 000 1 417 33 055
1963 453 29 445 3 587 5 500 1 844 40 829
1964 550 29 719 4 713 6 000 1 967 42 949
1965 4 230 35 049 4 746 6 200 2 131 52 356
1966 9 330 41 O i l 5 451 6 500 2 412 64 704
1967 9 684 40 814 4 877 6 700 2 844 64 919
1968 10 189 42 331 3 865 6 700 2 689 65 774
1969 13 432 45 213 4 842 7 565 2 452 73 504
1970 15 350 50 614 5 706 7 727 3 050 82 441
1971 10 280 49 710 6 321 7 983 3 197 77 491
1972 12 924 50 865 5 917 8 210 3 163 81 079
1973 13 785 52 552 5 885 8 482 2 798 83 502
1974 13 942 50 807 9 759 8 800 2 608 85 916
1975 13 027 48 072 9 091 9 060 2 535 81 784
1976 14 619 51 361 10 899 9 350 2 387 88 616
1977 16 568 55 523 11 000 9 707 2 388 95 186
1978 13 868** 59 803 13 196 9 979* 2 4?S 99 271
1 Shipments * Estimate
** Preliminary 1901-1970 Sutulov, A., World Molybdenum Encyclopedia 1971-1978 a)U.S. Bureau of Mines, Commodity P r o f i l e 1979
b)Energy Mines and Resources, molybdenum preprints .
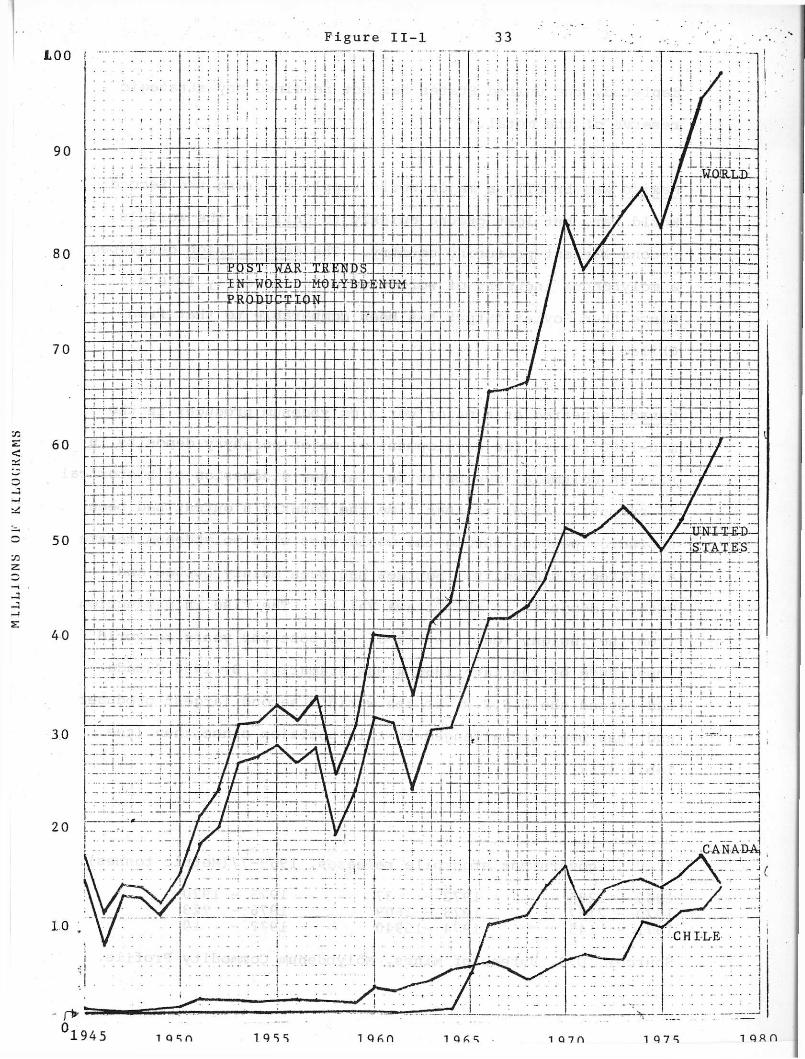
F i g u r e I I -t o o
1 Q S S l q f i n 1 Q A ^ 1 0 7 f l 1 Q 7 S

34
depleted, the United States has not r e t a i n e d any s t r a t e g i c reserve of the metal.*
Mexico was b r i e f l y a major world s u p p l i e r during the Second World War, but l o s t ground q u i c k l y to C h i l e as the world's second l a r g e s t producing country. The S o v i e t Union developed a molybdenum i n d u s t r y of world s c a l e i n the e a r l y 1950's. Since then S o v i e t output has been comparable to th a t from C h i l e .
Canada appeared as a major world molybdenum producer i n the mid-1960*s w i t h the development of major porphyry d e p o s i t s i n B r i t i s h Columbia (see below f o r f u r t h e r d i s c u s s i o n of h i s t o r i c a l BC output). P r i o r to th a t time the country's output had been sporadic, peaking during the world wars when molybdenum became a s t r a t e g i c commodity. Sources had been mainly Quebec and Ontario deposits i n the Ottawa V a l l e y . The r i s e i n production from the i n s i g n i f i c a n t l e v e l s of the post-war years to world importance by the l a t e 1960's was dramatic. By 1966 Canada had passed the U.S.S.R. as the world's second l a r g e s t producer and has been unchallenged i n t h i s p o s i t i o n since then (see Table I I - 2 ) .
* U.S. government s t o c k p i l e r e l e a s e s , 1969-77(Metric tonnes). 1969 - 1285 1972 - 37 1975 - 1970 1970 - 2157 1973 - 2609 1976 - 723 1971 - 145 1974 -15940 1977 - 10 Source: U.S. Bureau of Mines, Molybdenum Commodity P r o f i l e .

35
TABLE H-2
PROPORTIONAL SHARE OF WORLD MOLYBDENUM PRODUCTION
1901 - 1978
CANADA USA CHILE USSR OTHER 1901 - 1910 - 3.2 - - 96.4 1911 - 1920 9.2 32.4 - - 58.4 1921 - 1930 0.3 88.0 - - 11.7 1931 - 1940 - 88.9 0.3 0.3 10.5 1941 - 1950 0.8 87.0 3.5 1.8 6.7 1951 - 1960 1.0 85.3 5.4 8.4 2.9 1961 - 1970 11.4 65.7 7.7 11.2 3.9 1971 - 1978 15.7 60.4 10.4 10.3 3.1
Sources: U.S. Bureau of Mines, Min e r a l s Yearbook, Molybdenum p r e p r i n t s .
, Commodity P r o f i l e , Molybdenum, May, 1979. Canada; Energy, Mines and Resources, Min e r a l s Yearbooks, Molybdenum p r e p r i n t s .
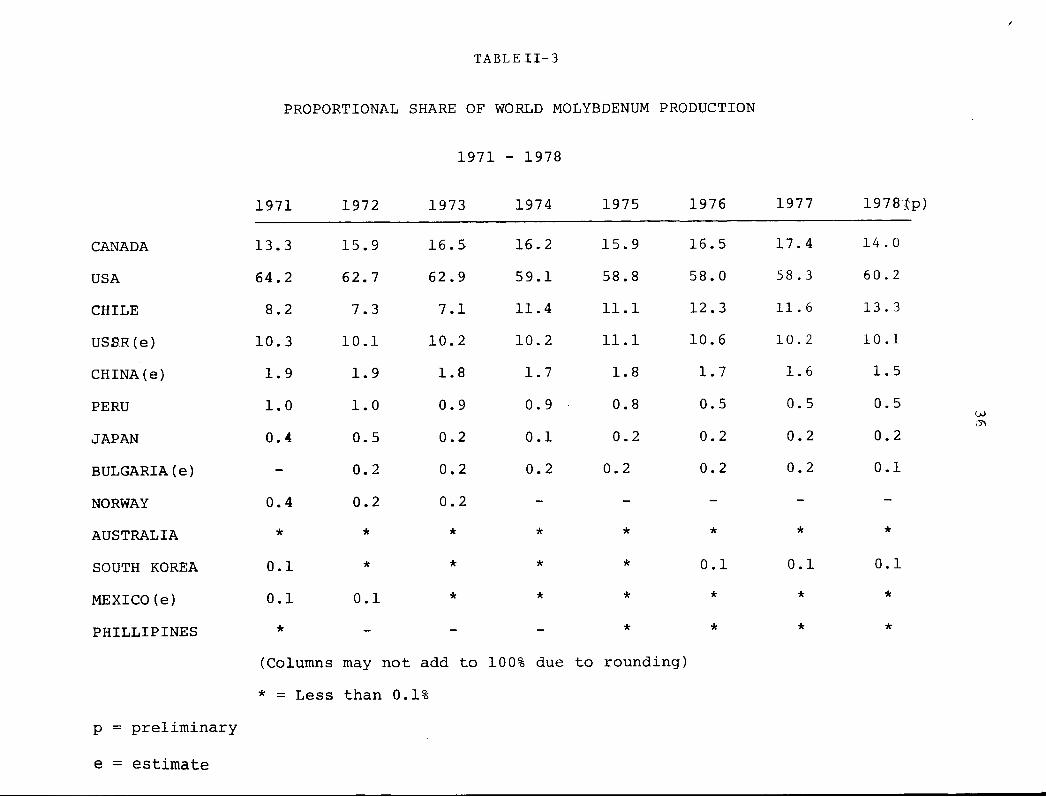
TABLEII-3
PROPORTIONAL SHARE OF WORLD MOLYBDENUM PRODUCTION
1971 - 1978
1971 1972 1973 1974 1975 1976 1977 1978;
CANADA 13.3 15.9 16.5 16. 2 15.9 16.5 17.4 14 . 0
USA 64.2 62.7 62.9 59.1 58.8 58.0 58 . 3 60.2
CHILE 8.2 7.3 7.1 11.4 11.1 12.3 11. 6 13 . 3
USSR(e) 10.3 10.1 10.2 10.2 11.1 10.6 10. 2 10.1
CHINA(e) 1.9 1.9 1.8 1.7 1.8 1.7 1.6 1.5
PERU 1.0 1.0 0.9 0.9 0.8 0.5 0.5 0.5
JAPAN 0.4 0.5 0.2 0.1 0.2 0.2 0.2 0.2
BULGARIA(e) - 0.2 0.2 0.2 0.2 0.2 0.2 0.1
NORWAY 0.4 0.2 0.2 - - - - -
AUSTRALIA * * * * * * * *
SOUTH KOREA 0.1 * * * * 0.1 0.1 0.1
MEXICO(e) 0.1 0.1 * * * * * *
PHILLIPINES * - - - * * * *
(Columns may not add to 100% due to rounding)
* = Less than 0.1 p = p r e l i m i n a r y
e = estimate

37 Other Countries
Since the e a r l y 1940's c o u n t r i e s other than the United S t a t e s , Canada, C h i l e and the Sovi e t Union have accounted f o r l e s s and l e s s of the world's molybdenum production. Of these other sources Peru and China have a l t e r n a t e d as the world's f i f t h l a r g e s t producers over the l a s t 25 years, w i t h the l a t t e r t a k i n g the lead i n the l a s t decade. Other notable producing c o u n t r i e s are l i s t e d i n Table I I - 3 .
The h i s t o r i c a l r a t e of change i n world molybdenum supply i s p r o f i l e d i n Table II-4 below. The 1930's were the years of most dramatic growth i n production, about 30% per year i n tha t p e r i o d . In the 1970's production has increased 6.4% per annum from the 1960's average. Between 1958 and 1978 world production has shown a 7.1% annual r a t e of i n c r e a s e , between the years 1968 and 1978 t h i s f i g u r e i s 4.2%.
2.2 Current World Supply S t r u c t u r e
World Supply i s dominated by four c o u n t r i e s , the United S t a t e s , Canada, C h i l e and the S o v i e t Union, which together accounted f o r more than 97 percent of world molybdenum i n 1978 (see Tables II-2 and I I - 3 ) . B r i e f p r o f i l e s of each country as a molybdenum producer are presented below.

3H
TABLE II-4
Rate of Increase i n World Molybdenum Pr o d u c t i o n ; Percent Change i n Average Output Between I n d i c a t e d Periods and Growth Rate:
PERIOD AVERAGE YEARLY OUTPUT (1000 tonnes)
% CHANGE BETWEEN PERIODS
GROWTH RATE DURING PERIOD
1901-10 1911-20 1921-30 1931-40 1941-50 1951-60 1961-70 1971-78
67.8 269 .8 840.8
8 975.6 18 321.3 28 603.1 55 967.6 86 614.6
278 212 967 104 56 96 54
16 . 6 13.5 30.1 8.7 5.0 9.7 6.4
Source: Table I I - l above

39
2.2.1 United States
Since 1971 the United States has accounted f o r about 60 percent of world molybdenum output w i t h a 1978 production of about 60 000 metric tonnes of the metal.
Table I I - 5 gives a breakdown of American molybdenum production by company and mine. The country's four l a r g e s t producing companies accounted f o r about 92 percent of domestic mine output i n both 1977 and 1978.
AMAX Inc. has been the United S t a t e s ' l a r g e s t producer since the country became the world's l e a d i n g world molybdenum source i n the 1920's. The company operates two primary molybdenum mines i n Colorado, Climax and Henderson, m i l l c a p a c i t y at Climax i s about 27-29 thousand tonnes of molybdenum annually. Henderson began production i n 1976 and i s expected to reach c a p a c i t y output of 24 000 metric tonnes per year by 1980-81.2
AMAX thus dominates both world and domestic U.S. molybdenum supply. The company i s v e r t i c a l l y i n t e g r a t e d and operates i t s own oxide, ferromolybdenum and chemical p l a n t s i n Pennsylvania and Iowa. These p l a n t s have a combined annual conversion c a p a c i t y of 32 000 met r i c tonnes of molybdenum per year. Overseas, the company operates conversion f a c i l i t i e s i n the Netherlands, I t a l y and England.

TABLE I I - 5
C O M P A N Y / M I N E O U T P U T - U . S . A . , C A N A D A A N D C H I L E
COUNTRY COMPANY COMPANY SHARE IN DOMESTIC OUTPUT
%
COMPANY SHARE IN WORLD OUTPUT
%
MINES (*-PRIMARY)
MINE PRODUCTION (1000 TONNES)
77 77 78 77
UNITED STATES AMAX
DUVAL
CANADA
CHILE
KENNECOTT
MOLYCORP
ANAMAX
MAGMA
OTHERSi
PLACER
NORANDA
RIO ALGOM
UTAH
BETHLEHEM
CODELCO
61.4
18.2
6.4
6.6
3.0
2.2
2.2
47.3
35.5
11.2
6.0
100.0
64.1
15.9
8.2
4.2
2.3
2.3
3.0
44.3
35.1
13.3
5.2
0.9
100.0
35.7
10.6
3.7
3.9
1.8
1.3
1.3
8.2
6.2
1.9
1.0
25.3
38.6
9.6
4.9
1.9
1.4
1.4
1.7
6.2
4.9
1.9
0.9
0.1
29.3
* 1. Includes Cyprus, Asarco C i t i e s Service, I n s p i r a t i o n , Union Carbide.
2. Shipments
*CLIMAX ^HENDERSON
SIERRITA MINERAL PARK
BINGHAM OTHERS
*QUESTA
TWIN BI JT r , ES
SAN MANUEL
OTHERS
*ENDAK0 GIBRALTAR
BRENDA *BOSS GASPE
LORNEX
ISLAND COPPER
BETHLEHEM
CHUQUICAMATA TENIENTE SALVADOR ANDINA
23.1 10.9
8.6 1.5
2.9 0.6
3.7
1.7
1.2
1.2
7.7 0.1
3.9 1.0 1.0
1.9
1.0
15.3 4.8 3.2 0.8
78
23.5 14.7
8.2 1.4
4.2 0.7
2.5
1.4
1.4
1.7
6.0 0.1
3.3 0.8 0.8
1.9
0.9
0.1
19.7 6.1 2.7 0.6

41 Duval i s the United St a t e s ' second l a r g e s t producer as a r e s u l t of by-product production from the S i e r r i t a mine i n A r i z o n a . As w e l l as owning two other A r i z o n a copper-molybdenum mines, Duval operates oxide and ferromolybdenum p l a n t s i n the s t a t e .
Molyborp, Inc. (which was acquired by Union O i l i n 1977) operates a primary molybdenum mine at Questa i n New Mexico. Since producing a record 5200 metric tonnes of molybdenum i n 1976, t h i s mine has encountered lower grades and w i l l l i k e l y be replaced by an underground mine i n the same area (the Goat H i l l deposit) i n the mid-1980's. Molycorp's v e r t i c a l i n t e g r a t i o n i n c l u d e s an o x i d e / f e r r o molybdenum p l a n t i n Pennsylvania.
Kennecott produces molybdenum as a by-product at i t s Bingham, Ray, and Chino copper mines i n Utah, A r i z o n a , and New Mexico r e s p e c t i v e l y . Of these only the Bingham mine i s a major producer, w i t h an output of from 3 to 5 thousand metric tonnes of molybdenum per year. Roasting of concentrates takes place a t a p l a n t near S a l t Lake C i t y
Of the remaining producing f i r m s i n the United S t a t e s , s i x o t h e r s , accounting f o r about 8 percent of U.S. output, recover molybdenum as a by-product from copper mines i n A r i z o n a . These are, i n order of d e c l i n i n g output, Anamax, (a p a r t n e r s h i p between Anaconda and AMAX), Magma Copper Co (a Newmont S u b s i d i a r y ) , Cyprus Mines Corp., C i t i e s S e r v i c e

42
Co., I n s p i r a t i o n Consolidated Copper Co., and Asarco Inc. Most of these f i r m s ' production i s s o l d i n concentrate form to d e a l e r s or other companies f o r f u r t h e r p r o c e s s i n g .
Recently improved copper markets have allowed resumed prod u c t i o n a t the I n s p i r a t i o n and S i l v e r B e l l (Asarco) mines, i n a d d i t i o n Molycorp has announced i t s i n t e n t i o n to produce from i t s Goat H i l l d e p o s i t w i t h s t a r t - u p i n 1983. A small amount of American production ( l e s s than h a l f of one percent of t o t a l domestic output) comes from tungsten production at Union Carbide's Pine Creek mine i n C a l i f o r n i a . Kerr McGee Corp. a l s o recovers a minor q u a n t i t y of molybdenum from i t s New Mexico uranium opera t i o n s .
Trade
The United States i s the world's l a r g e s t exporter of molybdenum. Exports over the l a s t ten years c o n s t i t u t e d 56 percent of domestic mine output i n t h a t p e r i o d . Major d e s t i n a t i o n s f o r U.S. molybdenum output i n 1978 were the Netherlands (about h a l f of t o t a l exports) and Japan (about o n e - s i x t h ) . Other major customers f o r U.S. molybdenum were Belgium-Luxembourg, West Germany and the U.S.S.R. (see Appendix Table A - l ) . About 97 percent of molybdenum exports i n 1978 were i n the form of concentrate or molybdic oxide.
43
Summary of U.S. Supply S t r u c t u r e
The United States i s the world's l a r g e s t s u p p l i e r of molybdenum, exporting over h a l f of domestic output to world markets. The country's molybdenum output i s dominated by four firms which have c o n s i s t e n t l y accounted f o r about 90 percent of t o t a l production. These f i r m s , l e d by AMAX, are f o r the most par t v e r t i c a l l y i n t e g r a t e d i n t o conversion of molybdenum to end-use products such as molybdic oxide, ferromolybdenum and ammonium and sodium molybdate. These products can be used d i r e c t l y i n the production of s t e e l , a l l o y s and chemicals. V e r t i c a l i n t e g r a t i o n among major molybdenum mining companies i n the United States thus extends to the p o i n t of t h e i r f i n a l i n d u s t r i a l consumption by s t e e l and chemical producers.
2.2.2 C h i l e
C h i l e strengthened i t s p o s i t i o n as the world's t h i r d l a r g e s t molybdenum producer with a 1978 output of 13 000 metric tonnes of the metal. A l l C h i l e a n molybdenum production i s recovered as a by-product from four porphyry-type copper mines operated by the N a t i o n a l Copper Corporation of C h i l e (Codelco-Chile).
State-owned Codelco was born from the 1971 n a t i o n a l i z a t i o n of copper mines operated by Anaconda, Kennecott and Cerro. The company's l a r g e s t mine, Chuquicamata, i s a l s o the l a r g e s t copper producer i n the world, wi t h a c a p a c i t y of 500 000 metric
44
tonnes of ore per year. The operat i o n recovers the g r e a t e s t amount of molybdenum as a by-product from copper production of any world mine.
E l Teniente, E l Salvador and Andina are the other Codelco-owned Ch i l e a n molybdenum-producing mines (see Table 1-5 f o r production breakdown); Andina began production i n 1975, the other two mines i n 1976. One has r e c e n t l y used a Noranda-patented l e a c h i n g process i n the expansion of i t s recovery p l a n t .
Trade
Over 95 percent of Ch i l e a n molybdenum production i s exported. The major market, accounting f o r more than h a l f of C h i l e a n exports, i s Western Europe. (see Appendix Table A-2).
Japan i s an area of i n c r e a s i n g export trade, the Ch i l e a n exports to that country r i s i n g i n 1978 to about 1400 metric tonnes of molybdenum from 689 i n 1977.
Ch i l e a n exports are e i t h e r handled d i r e c t l y by the producer, Codelco, or through a processing company, Molibdenos Y Metales S.A. (Molymet). Molymet converts the molybdenite concentrate i t purchases from Codelco i n t o molybdenum oxide (with by product recovery of rhenium) or ferromolybdenum.
45
Summary of C h i l e a n Supply S t r u c t u r e
Chilean molybdenum production i s monopoly c o n t r o l l e d , w i t h state-owned Codelco the only producer. Output i s mainly exported, w i t h Western Europe, and, more r e c e n t l y , Japan, the major customers.
About two-thirds of C h i l e a n molybdenum exports are i n forms other than molybdenite concentrate. Codelco has r e c e n t l y been o r i e n t e d toward c o n v e r t i n g i t s molybdenite concentrates i n t o more v a l u a b l e products before export. Conversion to f u r t h e r processed forms i s done by Molymet, a company which possesses conversion f a c i l i t i e s but no m i n e r a l p r o p e r t i e s .
2.2.3 U.S.S.R.
The Sov i e t Union ranks f o u r t h i n world molybdenum production w i t h an output of about 10 000 metric tonnes of the metal per year. Most of the country's resources and producing f a c i l i t i e s are concentrated along i t s southern border, i n Armenia and C e n t r a l A s i a .
S o v i e t production data i s kept c o n f i d e n t i a l because s t r a t e g i c metals are i n v o l v e d . Based on data compiled by Sutulov^/ however, a reasonable p r o f i l e of the S o v i e t i n d u s t r y can be obtained.
46
Almost a l l molybdenum produced i s recovered as a by-product from copper production. The Balkhash Copper complex at Kazakhstan i n C e n t r a l A s i a i s the l a r g e s t o p e r a t i o n w i t h an output of 1500 to 2000 m e t r i c tonnes per year. Ore i s m i l l e d from two mine s i t e s , a primary porphyry molybdenum deposit and a l a r g e copper-molybdenum porphyry. Another C e n t r a l Asian f a c i l i t y , the Almalyk p l a n t i n Uzbekstan, a l s o produces by-product molybdenum. Using ore from the Kalmakyr copper-molybdenum porphyry., t h i s o p e r a t i o n y i e l d s about 1000 metri c tonnes per year of contained molybdenum.
Several low-grade copper porphyry d e p o s i t s , i n Armenia, y i e l d molybdenum as a by-product. These f a c i l i t i e s apparently bear some s i m i l a r i t y to the by-product molybdenum recovery operations i n B r i t i s h Columbia copper mines. Armenian output t o t a l s about 3000 metric tonnes per year.
Another area of small by-product operations i s Eastern S i b e r i a , near the Chinese border. Production from s e v e r a l mines i n the region t o t a l s about 1800 metri c tonnes per year.
Trade
While molybdenum production i n the So v i e t Union has grown at a comparable r a t e to the expansion of the domestic s t e e l i n d u s t r y , the country c u r r e n t l y has a considerable trade d e f i c i t i n the metal r e s u l t i n g i n imports of about 6000 me t r i c tonnes per year. D i r e c t imports from the United States
47
accounted f o r about a t h i r d of t h i s t o t a l i n 1978. The remaining two-thirds of imports are mainly American, C h i l e a n and Canadian molybdenum t h a t has been processed i n Western Europe. Canadian molybdenum exports to the U.S.S.R. i n 1978 were about 400 metric tonnes.
Summary of U.S.S.R. Supply S t r u c t u r e
Soviet molybdenum production i s d i v i d e d among many f a i r l y small mines. Almost a l l output comes from by-product recovery of the metal at low-grade copper molybdenum porphyry d e p o s i t s .
The country r e l i e s on the Free World f o r about 4 0 percent of her domestic molybdenum requirements. The bulk of imported molybdenum i s produced i n the Americas and processed i n Western Europe.
2.2.4 Canada
Canada i s second only to the United States as a world producer of molybdenum. The country's r i s e to t h i s p o s i t i o n of world importance began i n the 1960's w i t h the development of l a r g e , porphyry-type molybdenum and copper-molybdenum d e p o s i t s i n B r i t i s h Columbia. While Canada produced l e s s than one percent of the world's molybdenum i n 1960, by 1966 the country had passed both C h i l e
48
and the Soviet Union i n production, w i t h a world share of 14.4% (see Table I I - 2 ) .
Almost a l l of pre-1960 Canadian molybdenum production came from deposits i n Quebec and Ontario. Today, however, B r i t i s h Columbia accounts f o r over 95 percent of domestic production. Of the 8 molybdenum-producing mines i n Canada today, 7 are i n B r i t i s h Columbia (the o n l y producer not i n t h a t province being the Gaspe Copper mine o p e r a t i n g i n Quebec). Table II-6 gives a breakdown of Canadian molybdenum production over the past decade by mine ( f o r a more comprehensive d i s c u s s i o n of BC producers and prospects, see S e c t i o n I I I , below).
Two companies dominate Canadian molybdenum production - P l a c e r Development L i m i t e d , w i t h a 44 percent share of domestic output i n 1978 and c o n t r o l l i n g i n t e r e s t i n two producing mines and Noranda Mines L i m i t e d w i t h a 35 percent share i n 197 8 and c o n t r o l of three producers. Noranda a l s o has a 31.4% i n t e r e s t i n P l a c e r . Two of Canada's f i v e molybdenum-producing companies thus accounted f o r about 80 percent of i t s output i n 1978 (See Table I I - 5 ) .
Molybdenum i s converted to molybdic oxide at two r o a s t i n g p l a n t s i n the country, one at P l a c e r ' s Endako mine i n B r i t i s h Columbia and the other a t *Eldorado Gold Mines' Duparquet,
- formerly Fundy Chemical I n t e r n a t i o n a l L t d .
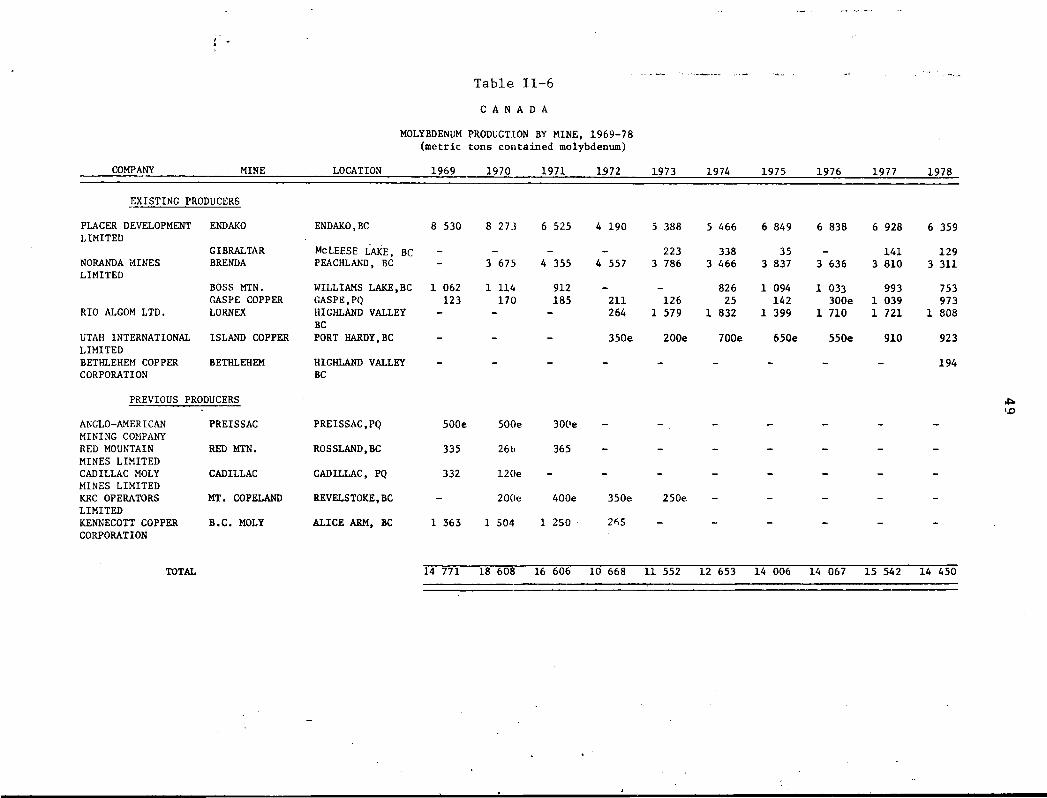
Table II-6 C A N A D A
MOLYBDENUM PRODUCTION BY MINE, 1969-78 (metric tons contained molybdenum)
COMPANY MINE LOCATION 1969 1970 1971 1972 1973 1974 1975 1976 1977 1978
EXISTING PRODUCERS
PLACER DEVELOPMENT ENDAKO ENDAKO,BC 8 530 8 273 6 525 4 190 5 388 5 466 6 849 6 838 6 928 6 359 LIMITED
GIBRALTAR McLEESE LAKE, BC - - - - - 223 338 35 - 141 129 NORANDA MINES BRENDA PEACHLAND, BC - 3 675 4 355 4 557 3 786 3 466 3 837 3 636 3 810 3 311 LIMITED
BOSS MTN. WILLIAMS LAKE.BC 1 062 1 114 912 - - 826 1 094 1 033 993 753 GASPE COPPER GASPE,PQ 123 170 185 211 126 25 142 300e 1 039 973
RIO ALGOM LTD. LORNEX HIGHLAND VALLEY BP - - - 264 1 579 1 832 1 399 1 710 1 721 1 808
UTAH INTERNATIONAL ISLAND COPPER PORT HARDY,BC _ _ _ 350e 200e 700e 650e 550e 910 923 LIMITED BETHLEHEM COPPER BETHLEHEM HIGHLAND VALLEY - - - - - - - - - 194 CORPORATION BC
PREVIOUS PRODUCERS
ANGLO-AMERICAN PREISSAC PREISSAC,PQ 500e 500e 300e _ _ _ _ _ _ MINING COMPANY RED MOUNTAIN RED MTN. ROSSLAND.BC 335 266 365 - - - - - - -MINES LIMITED CADILLAC MOLY CADILLAC CADILLAC, PQ 332 120e - - - - - - - -MINES LIMITED KRC OPERATORS MT. COPELAND REVELSTOKE,BC - 200e 400e 350e 250e - - - - -LIMITED KENNECOTT COPPER B.C. MOLY ALICE ARM, BC 1 363 1 504 1 250 2*5 - - - - - -CORPORATION
TOTAL 14 771 18 608 16 606 10 668 11 552 12 653 14 006 14 067 15 542 14 450

50
Quebec p l a n t . The Duparquet o p e r a t i o n and Masterloy of Ottawa produce ferromolybdenum. (see S e c t i o n V f o r more on f u r t h e r processing of molybdenum i n Canada).
Trade
Canada exports about f o u r - f i f t h s of i t s molybdenum production making i t the second l a r g e s t exporter of the metal, behind the United States. Japan and Western Europe are the main markets f o r Canadian exports (see S e c t i o n I ) . The United States i s a l s o a major d e s t i n a t i o n f o r Canadian shipments. Canadian production i s o f t e n sent to the U.S. f o r f u r t h e r processing and most i s subsequently t r a n s f e r r e d to f o r e i g n markets.*
2.3 Factors A f f e c t i n g World Supply
2.3.1 Primary Molybdenum Production
Primary molybdenum mines are those whose main or major output i s molybdenum concentrate or ore. There are only s i x such mines among the 55-odd c u r r e n t world molybdenum producers, but these operations accounted f o r 50.1 percent of world production o f the metal i n 1977 and 4 9.2 percent i n 1978. AMAX operates the Climax and Henderson mines, the
the a c t u a l q u a n t i t i e s consumed i n the U.S. and/or t r a n s f e r r e d to f o r e i g n markets are d i f f i c u l t to determine, however.
51
two l a r g e s t primary operations i n the world. P l a c e r Development's Endako mine i s the world's t h i r d l a r g e s t .
Primary molybdenum ores have on average from 2 - 5 0 times the molybdenum content of ores used i n the recovery of molybdenum as a by-product from copper p r o d u c t i o n , however primary porphyry molybdenum d e p o s i t s are o f t e n of comparable tonnage to copper porphyries. Primary moly-mines thus produce, on average, much more of the metal than by-product o p e r a t i o n s , and th e r e f o r e the development of techniques f o r the e x p l o i t a t i o n of primary d e p o s i t s has had an important e f f e c t on h i s t o r i c a l world molybdenum supply.
A major breakthrough of t h i s nature occurred at the Climax mine i n Colorado, when the o l d shrinkage stope method of mining was replaced by the block caving method i n the mid-1930' s. By the war years m i l l c a p a c i t y had increased to 18 000 metric tonnes per day of ore from 1200 i n 1932. The i n t r o d u c t i o n of block caving, and the expanded recovery c a p a c i t y t h a t was a s s o c i a t e d w i t h i t , thus enabled molybdenum output to meet demand when the Second World War broke out, and e s t a b l i s h e d the Climax mine as the world production l e a d e r .
2.3.2 By-Product and Co-Product Production
A by-product i s a secondary or a d d i t i o n a l product y i e l d e d i n the process of production. A co-product i s an output

52
produced i n c o n j u n c t i o n w i t h , and at a comparable r a t e as, another. In mining, these concepts are based p r i m a r i l y on the u n d e r l y i n g economics. By-products are seen as outputs tha t have a minor c o n t r i b u t i o n to the economics of an o p e r a t i o n , and co-products are those which have a r e l a t i v e l y l a r g e impact. In the pure sense, a by-product i s y i e l d e d without the e x e r t i o n of e x t r a e f f o r t . In mining, by-product recovery r e q u i r e s e x t r a e f f o r t and c a p i t a l but outputs are s t i l l considered "by-products" i f t h i s impact i s i n s i g n i f i c a n t .
Production of molybdenum as a by-product or co-product (hereafter j u s t "by-product") of other metals has had s i g n i f i c a n t impact on molybdenum supply. Today, over 50 percent of the world's molybdenum output i s recovered as a by-product, p r i m a r i l y from porphyry copper d e p o s i t s (see Table II-7) While minor amounts of molybdenum are recovered from tungsten, uranium and bismuth-containing ores, over 95 percent of the by-product output of the metal comes from about 50 copper mines around the world.
The breakthrough i n molybdenum by-product recovery took place at Anaconda's Green Cananea Copper Mine i n Sonora, Mexico i n the mid-1930's when a process f o r the separation of molybdenite from copper ore was pioneered. The new technology q u i c k l y v a u l t e d Mexico to second place i n world molybdenum production.

53
TABLE II - 7
WORLD MOLYBDENUM PRODUCTION BY TYPE 1977-78 (1000 M e t r i c t o n s c o n t a i n e d Mo)
U.S.
CANADA
S. AMERICA
OTHER
PRIMARY
1977 1978
37 . 7
8.7
1 . 2
40.8
6.8
1.2
BY-PRODUCT OR CO-PRODUCT
1977 1978
17.8 19.0
7.9 7.1
11.1 13.2
10.8 11.1
TOTALS
%
47.6 48.8
50.1 49.2
47.5 50.4
49.9 50.8
54
The development at Green Cananea was of c o n s i d e r a b l e importance to s i g n i f i c a n t copper producers i n the Southeast United S t a t e s , where many porphyry copper d e p o s i t s contained s u b s t a n t i a l amounts of molybdenite. Kennecott, holder of s e v e r a l such d e p o s i t s , had soon developed a molybdenum recovery process f o r i t s Bingham and E l Teniente mines i n Utah and C h i l e r e s p e c t i v e l y . The Kennecott process provided the b a s i s f o r molybdenum recovery systems used today. As mining technology progressed and l a r g e r shovels, bigger t r u c k s and other t e c h n o l o g i c a l advances i n e a r t h moving, open p i t mining and molybdenum recovery occurred, by-product molybdenum increased i t s share of t o t a l output. In 1957 molybdenum by-product production was o n l y 17 percent of world output; today i t has a greater than 50 percent share.^
2.4 Economic E f f e c t s of By-Product Production
With more than h a l f of the world's molybdenum output coming from copper mines today, molybdenum supply has to some degree become dependent on copper markets. Poor markets f o r copper have been i d e n t i f i e d as a f a c t o r c o n t r i b u t i n g to the short supply of molybdenum i n recent years.^
This i s undeniably a f a c t o r i n United States supply, w i t h poor copper markets i n 1977 f o r c i n g the c l o s u r e of the Cyprus Pima and Esperanza mines and reducing production at S i e r r i t a ,
55
M i n e r a l Park and s e v e r a l Kennecott o p e r a t i o n s , a l l by-product producers of molybdenum. The decrease i n molybdenum output caused by copper production cutbacks i n 197 7 was more than o f f s e t by production increases a t the Henderson primary mine i n Colorado, however.
While by-product production i s important i n an aggregate sense, i t must be remembered that by-product mines u s u a l l y produce much l e s s on an i n d i v i d u a l b a s i s than primary operations and t h e i r independent impact i s thus much l e s s than th a t of primary mines.^ A copper market slump would have to be deva s t a t i n g to have a quantum impact on molybdenum supply s i m i l a r t o , say, a s t r i k e a t AMAX's primary mines. Nonetheless, copper markets are an undeniable f a c t o r i n molybdenum supply, although one i n d u s t r y r e p r e s e n t a t i v e has expressed the view th a t l e s s than 50% of the world's molybdenum production w i l l come from by-product i n the near f u t u r e .
Some copper-molybdenum producers are e q u a l l y as dependent on molybdenum as on copper i n t h e i r production economics, e s p e c i a l l y i n l i g h t of recent molybdenum p r i c e s . At Duval's S i e r r i t t = mine i n Arizona and BC's Brenda o p e r a t i o n , f o r example, high molybdenum and low copper heads make molybdenum i n d i s p e n -s i b l e to the mines' o p e r a t i o n . In such cases copper and molybdenum are "tr u e " co-products.
56
In some cases of by-product molybdenum recovery, molybdenum may a c t u a l l y have had a gre a t e r e f f e c t on cash f l o w than copper, as long as high molybdenum p r i c e s were gained f o r production. The a d d i t i o n of a by-product molybdenum recovery c i r c u i t can have very a t t r a c t i v e economics, because most other costs of ope r a t i o n a t the m i n e / m i l l (such as coarse and f i n e c r u s h i n g , g r i n d i n g and rougher and cle a n e r f l o t a t i o n ) can be charged to copper produOtion, and are thus sunk c o s t s .
In a d d i t i o n , when copper p r i c e s are low the r e d u c t i o n i n copper output which r e s u l t s from molybdenum recovery i s a smaller o p p o r t u n i t y c o s t than i t would be i f copper p r i c e s rose.* Thus a molybdenum recovery c i r c u i t can be added w i t h the p o s s i b i l i t y of a p r o f i t a b l e r e t u r n on investment.
When molybdenum p r i c e s are high, by-product production of the metal may a c t u a l l y have a major e f f e c t on copper supply. Molybdenum content, even i f i t i s minor, may help r a t i o n a l i z e the development of otherwise economically marginal copper d e p o s i t s , and s t a b i l i z e the income of copper mines when copper markets f a l t e r .
The r e l a t i o n s h i p between molybdenum and copper recovery i s q u i t e complex and subject to the content of each i n ore m i l l e d .
57
2.5 I n t e r n a t i o n a l Molybdenum Reserves*
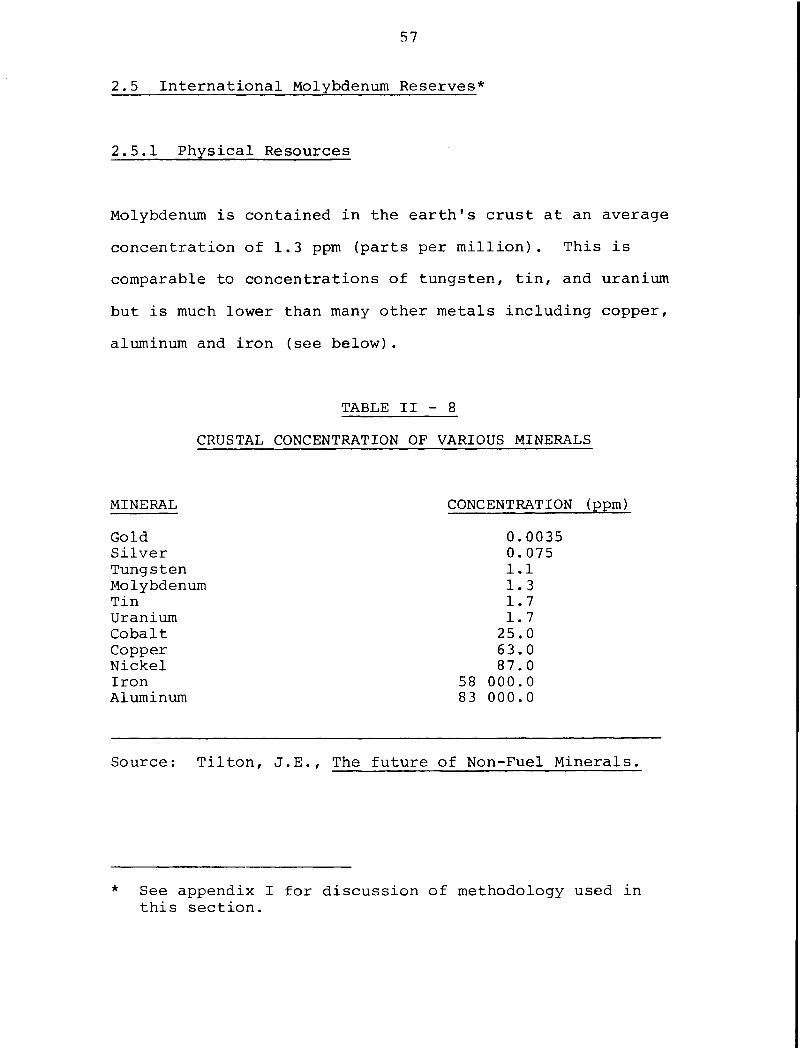
2.5.1 P h y s i c a l Resources
Molybdenum i s contained i n the earth's c r u s t a t an average conc e n t r a t i o n of 1.3 ppm (parts per m i l l i o n ) . This i s comparable to concentrations of tungsten, t i n , and uranium but i s much lower than many other metals i n c l u d i n g copper, aluminum and i r o n (see below).
TABLE I I - 8 CRUSTAL CONCENTRATION OF VARIOUS MINERALS
MINERAL CONCENTRATION Gold 0.0035 S i l v e r 0.075 Tungsten 1.1 Molybdenum 1.3 Tin 1.7 Uranium 1.7 Cobalt 25.0 Copper 63.0 N i c k e l 87.0 Iron 58 000.0 Aluminum 83 000.0
(ppm)
Source: T i l t o n , J.E., The f u t u r e of Non-Fuel M i n e r a l s .
See appendix I f o r d i s c u s s i o n of methodology used i n t h i s s e c t i o n .
58
T o t a l p h y s i c a l resources (obtained by m u l t i p l y i n g c r u s t a l c o n c e n t r a t i o n by the weight of the earth's c r u s t ) are
3
2.8 3 x 10' metric tonnes of molybdenum. I t should be noted t h a t of t h i s amount the vast m a j o r i t y i s not a v a i l a b l e under any current economic or t e c h n i c a l scheme.
D i s t r i b u t i o n i s mainly i n three g e o l o g i c a l b e l t s : The C i r c u m p a c i f i c Mountain B e l t - the major area of molybdenum reserves, t h i s b e l t begins i n the A l e u t i a n Islands of Alaska and runs down the western c o r d i l l e r a of the Americas to T i e r r a d e l Fuego i n the south. Concentrations occur i n n o r t h - c e n t r a l C h i l e and i n the lower United States as an almost continuous b e l t from Texas to Idaho and Montana. C l u s t e r s of d e p o s i t s occur i n North America w i t h i n the Colorado mineral b e l t , i n C e n t r a l B r i t i s h Columbia from Endako, through A l i c e Arm to Quartz H i l l i n southeast A l a s k a .
The A l p i n e Cancasian Cenozoic B e l t - runs through southern Europe from Spain to Yugoslavia. Peak concentrations occur i n Yugoslavia.
The P a l e o z o i c B e l t of the S i b e r i a n S h i e l d - runs along the U.S.S.R./China border, w i t h high values only i n c e n t r a l Kazakhstan i n the s o u t h - c e n t r a l S o v i e t Union. Important molybdenum depo s i t s have a l s o been reported i n c e n t r a l and southern p a r t s of China.
59
2.5.2 Deposit C h a r a c t e r i s t i c s
Five general types of molybdenum ore deposits can be i d e n t i f i e d : 1. Disseminated porphyry deposits 2. Contact-metamorphic d e p o s i t s 3. Quartz veins 4. Pegmatite and a p l i t e dykes 5. Bedded deposits i n sedimentary rocks.
The f i r s t category i s by f a r the most important to world p h y s i c a l resources and production, accounting f o r about 90 - 95 percent of the former and almost a l l of the l a t t e r . These deposits are g e n e r a l l y low-grade and l a r g e volume and thus are a p p r o p r i a t e l y e x p l o i t e d using l a r g e - s c a l e open p i t or underground block caving methods.
The primary economic m i n e r a l i z a t i o n of such d e p o s i t s i s mainly molybdenum or copper. In primary molybdenum porphyries, accompanying minerals are o f t e n tungsten, t i n , bismuth, l e a d , z i n c , and uranium. In copper p o r p h y r i e s , molybdenum presence i s o f t e n minor and d i f f i c u l t to d e t e c t by v i s u a l i n s p e c t i o n . There are many more i d e n t i f i e d copper-molybdenum than primary molybdenum porp h y r i e s , though world production from each type i s roughly comparable today.
Several world mines have e x p l o i t e d the other types of d e p o s i t s l i s t e d above. The world's f i r s t molybdenum mine a t Knaben, Norway, worked a contact metamorphic d e p o s i t . The Questa mine
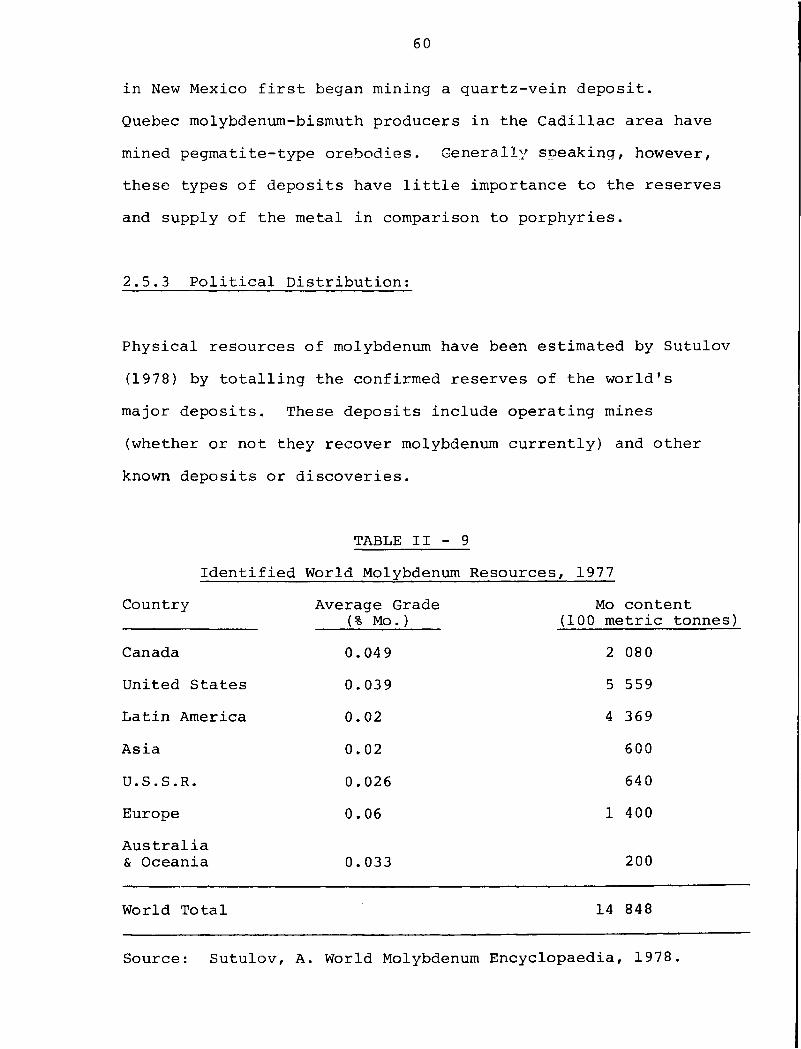
60
i n New Mexico f i r s t began mining a q u a r t z - v e i n d e p o s i t . Quebec molybdenum-bismuth producers i n the C a d i l l a c area have mined pegmatite-type orebodies. G e n e r a l l y speaking, however, these types of dep o s i t s have l i t t l e importance to the reserves and supply of the metal i n comparison to po r p h y r i e s .
2.5.3 P o l i t i c a l D i s t r i b u t i o n :
P h y s i c a l resources of molybdenum have been estimated by Sutulov (1978) by t o t a l l i n g the confirmed reserves of the world's major d e p o s i t s . These dep o s i t s i n c l u d e operating mines (whether or not they recover molybdenum c u r r e n t l y ) and other known deposits or d i s c o v e r i e s .
TABLE I I - 9 I d e n t i f i e d World Molybdenum Resources, 1977
Country Average Grade Mo content (% Mo.) (100 metric tonnes)
Canada 0.04 9 2 08 0 United States 0.039 5 559 L a t i n America 0.02 4 36 9 A s i a 0.02 600 U.S.S.R. 0.026 640 Europe 0.06 1 4 00 A u s t r a l i a
& Oceania 0.033 200
World T o t a l 14 848 Source: Sutulov, A. World Molybdenum Encyclopaedia, 1978.
61
The d i s t r i b u t i o n of resources c l o s e l y p a r a l l e l s the p a t t e r n of world output, w i t h the United S t a t e s , Canada, and C h i l e as the l e a d e r s . The S o v i e t Union i s an exception, w i t h a tenth of the world output and only 4 percent of resources as i d e n t i f i e d above.
Canada, w i t h 7.5 percent of the world's land area, has about 14 percent of g l o b a l molybdenum resources. B r i t i s h Columbia accounts f o r over 85 percent of Canada's molybdenum resources. Canada's porphyry copper, p a r t i c u l a r l y those i n B r i t i s h Columbia, show on average a c o n s i d e r a b l y higher molybdenum-to-copper r a t i o than those i n the S o v i e t Union and the United S t a t e s . This suggests molybdenum content i s more important to the economics of t h e i r e x p l o i t a t i o n than i t i s to copper deposits i n other areas of the world.
South C e n t r a l American resources are contained mainly i n the l a r g e copper porphyries of C h i l e and Peru. Some major depo s i t s (none c u r r e n t l y mined) are a l s o found i n A r g e n t i n a , Equador,Columbia, and Panama. Elsewhere i n L a t i n America, Mexico contains a number of noteworthy copper-molybdenum depo s i t s along i t s border w i t h the United S t a t e s .
United States d e p o s i t s are mainly i n Colorado,Arizona, New Mexico and Utah. Other massive porphyries are found i n Washington, Montana, Idaho and A l a s k a .

62
A u s t r a l i a n d e p o s i t s are minor i n comparison to those i n the Americas. North Korea, Japan, Burma, China and Iran have de p o s i t s of some importance. In the southwestern P a c i f i c , the P h i l l i p i n e s , New Guinea and A u s t r a l i a have some resources of the metal.
Europe, except f o r d e p o s i t s i n Yugoslavia, Rumania and B u l g a r i a , i s p r a c t i c a l l y devoid of molybdenum resources. The same i s true of A f r i c a , i n which only Morocco and S i e r r a Leone have, at best, poor d e p o s i t s . The A f r i c a n c o n t i n e n t i s almost a "blank spot" on a map of world molybdenum resources.
The c o n c e n t r a t i o n of resources i n the non-communist world i s thus great, w i t h western i n d u s t r i a l c o u n t r i e s c o n t r o l l i n g over two-thirds of the t o t a l . Underdeveloped c o u n t r i e s , e s p e c i a l l y those i n A f r i c a , have almost no resources of the metal. Among communist n a t i o n s , the S o v i e t Bloc has resources but i s dependent on o u t s i d e sources of supply. China's resources, w h i l e undefined, could be q u i t e l a r g e .
2.6 Economic Reserves
Reserves are defined as those resources of the metal thought to be economically e x p l o i t a b l e given today's p r i c e s and technology. Table 11-10 gives a breakdown of world r e s e r v e s , as defined by e x i s t i n g mines and prospects. Prospect reserves are included at t h e i r expected date of development. (Under the d e f i n i t i o n of economic reserves used i n t h i s r e p o r t ,

63 TABLE I I - 10
WORLD MOLYBDENUM RESERVES : EXISTING AND PROSPECTIVE MINES
( t h o u s a n d s o f m e t r i c t o n s )
COUNTRY
U.S.A.
Chile
U.S.S.R.
Canada
China2
Peru
Other 3
TOTAL
RESERVES OF EXISTING MINES
1979
RESERVES OF PROSPECTS BY EXPECTED STARTUP DATE
2 999
2 253
594
357
227
140
193
6 763
1980-85 1986-90 1991 + PROSPECTS TOTAL
846
N.A.
269
N.A.
251
275
1 338
100
N.A.
121
N.A.
330
103
N.A,
450
N.A.
194
2 287
100
N.A.
840
N.A.
251
799
1 - Sutulov, Molybdenum Encyclopedia, Vol 1 (1978).
2 - U.S. Bureau of Mines, Molybdenum Commodity P r o f i l e (1979)
3 - Includes Bulgaria, Greenland, Iran, Japan, Korea, Mexico, New Guinea, The P h i l l i p i n e s , Yugoslavia.
N.A. - not a v a i l a b l e .

64
a deposit should not be considered i n a reserve t o t a l u n t i l i t i s e x p l o i t e d as a mine - see Appendix I ) .
A d i f f e r e n t p i c t u r e of molybdenum resources i s given than by the p h y s i c a l resource data i n Table I I - 9 . While the United States s t i l l l eads, C h i l e i s c l o s e behind on the weight of the massive reserves of the Chuquicamat?*. and E l Teniente copper porphyries. Canada lags behind the S o v i e t Union i n reserves.
I t i s important to remember tha t reserves are c a l c u l a t e d on the b a s i s of the known metal content and not on recoverable m a t e r i a l . This has major i m p l i c a t i o n s i n the case of C h i l e , f o r example, where molybdenum reserves are a l l contained i n copper porphyries. Since recovery of molybdenum contained i n copper porphyries (at 50-60 percent of contained Mo) i s much lower than from primary molybdenum porphyries (at 7 5-90 p e r c e n t ) , C h i l e a n molybdenum reserves are l e s s p r o p o r t i o n a l l y than i n d i c a t e d . Canada and the United S t a t e s , w i t h s i g n i f i c a n t reserves i n primary d e p o s i t s , w i l l have p r o p o r t i o n a l l y greater recoverable molybdenum than i s i n d i c a t e d i n Tables I I - 9 and 11-10.
The data on reserves at p r o s p e c t i v e mines show tha t the United States i s l i k e l y to r e t a i n i t s p o s i t i o n as the world's reserve leader f o r many years to come. C h i l e w i l l l i k e l y continue to be important on the b a s i s of e x i s t i n g r e s e r v e s , while Canada

65
w i l l s o l i d i f y i t s p o s i t i o n through the reserves of new producers. In the "other" category, s u b s t a n t i a l new d e p o s i t s , e s p e c i a l l y i n L a t i n America, w i l l i ncrease the share of world reserves contained i n l e s s developed c o u n t r i e s .

66
Sec t i o n I I Footnotes
1. World Production Figures are from the f o l l o w i n g sources: (a) 1970 and before: Sutulov, A., I n t e r n a t i o n a l
Molybdenum Encyclopaedia, V o l . I, 1978, pp. 298-304 (b) 1971 and l a t e r :
- United States Bureau of Mines, M i n e r a l Commodity Summaries, 1979, Molybdenum Commodity P r o f i l e May 1979, M i n e r a l s Yearbook, v a r i o u s years, molybdenum s e c t i o n .
- Canada, Energy, Mines and Resources M i n e r a l s Yearbook, Molybdenum r e p r i n t s , v a r i o u s years from 1971 on.
- B r i t i s h Columbia, M i n i s t r y of Energy Mines and Petroleum Resources, Annual Reports
2. AMAX, Annual Report 1978 3. Sutulov, A. Molybdenum and Rhenium, Concepcion, 1976,
pp. 116-117 4. Tex Report, January 19, 1979 5. See, f o r example, Goth, J.W., "Molybdenum", E.&.M.J.
March 1979, or Dept. of Energy, Mines and Petroleum, Molybdenum p r e p r i n t 1977, or Sutulov, A. "Molybdenum, The Energy Metal...", World Mining, March 1978
6. Energy, Mines and Resources, Molybdenum P r e p r i n t , 197 7 and Sutulov, A., o p . c i t .
7. See S h i r l e y , Joseph F, "Optimizing the By-Product C i r c u i t " , World Mining, J u l y 1978.
67
3. B.C. SOURCES OF SUPPLY

69
3. B.C. SOURCES OF SUPPLY
B r i t i s h Columbia c u r r e n t l y accounts f o r about 95 percent of Canadian production of molybdenum from f i v e by-product and two primary molybdenum mines. The province i s a major world producer i n i t s own r i g h t , w i t h a 13 percent share of world molybdenum output i n 1978.
3.1 H i s t o r i c a l P r o f i l e
The province's f i r s t molybdenum output came from f i v e small high-grade de p o s i t s (Golconda, Index, M o l l y , Tidewater and V i c t o r i a ) mined between 1914 and 1918. I t was not u n t i l the 1960's, however, when the mining of l a r g e , low-grade molybdenum and copper molybdenum porphyry de p o s i t s began, th a t BC molybdenum production grew to s i g n i f i c a n t l e v e l s .
The Bethlehem copper mine i n the Highland V a l l e y recovered molybdenum from i t s copper ores between 1964 and 1966. Large s c a l e production f i r s t occurred i n 1965, when two primary mines, Endako and Boss Mountain, began o p e r a t i o n s . In 1966, Coxey, a small 4 00 mtpd (metric tonnes per day) open-pit mine began operations near Rossland. The operating company, Red Mountain Mines, never ran the mine without a l o s s and i t c l o s e d i n 1972 a f t e r producing about 1650 mt of molybdenum.
The BC Molybdenum mine, at K i t s a u l t on BC's north coast, began
production i n 1967. The mine, owned by Kennecott Copper L t d . ,
70
encountered problems of lead content i n i t s concentrates. In 1972 Kennecott c l o s e d BC Moly a f t e r i t had produced more than 10 000 mt of concentrates i n i t s 6 years of o p e r a t i o n s . Weak market c o n d i t i o n s were blamed f o r the c l o s u r e .
Another s h o r t - l i v e d producer was King Resources' Mt. Copeland mine, which worked a small high-grade molybdenum de p o s i t from 1970 to 1973. In i t s 4 years of o p e r a t i o n , about 1 200 mt of molybdenum were produced.
Endako's c a p a c i t y was doubled i n 1968, and by 1970, w i t h the s t a r t u p of Noranda's Brenda Mine and the Mt. Copeland and BC Moly mines i n o p e r a t i o n , B r i t i s h Columbia molybdenum producti o n reached an a l l - t i m e peak of 17 800 mt (shipments peaked l a t e r , i n 1977 - see Table I I I - l ) .
In the e a r l y 1970's, weak markets saw the c l o s u r e of the BC Moly, Mt. Copeland and Boss Mtn. mines - a l l primary molybdenum producers. At the same time, two copper-moly mines, Lornex and I s l a n d Copper, began production i n 1972 and a t h i r d G i b r a l t a r , s t a r t e d i n 1973. Thus, while molybdenum markets were slumping i n t h a t p e r i o d , copper showed promise and by-product production increased.
Since 1971-3, when mine c l o s u r e s and reduced output a t other mines l i k e Endako caused a decrease i n production, B r i t i s h Columbia molybdenum output has climbed s t e a d i l y , c h i e f l y through increased

71
recovery by copper by-product producers of the metal. Lornex and I s l a n d Copper, f o r example, had i n i t i a l d i f f i c u l t i e s w i t h molybdenum recovery but were able to r e s o l v e them and have c o n s i s t e n t l y increased output since s t a r t u p . G i b r a l t a r a c t u a l l y c l o s e d i t s molybdenum recovery c i r c u i t i n 1975 when i t was deemed uneconomic, but resumed recovery of the metal i n 1977.
In 1974 the Boss Mtn. mine was re-opened and by 1975 production had reached near-peak l e v e l s o f about 1 000 mtpy. Other than the re-opening of G i b r a l t a r i n 1977, the only a d d i t i o n a l producer since 1974 has been Bethlehem, where a molybdenum recovery c i r c u i t was added and began production by mid-197 8.
The province's production was down i n 1978, due p r i m a r i l y to decreased output at the l a r g e s t producers, Endako and Brenda. A s t r i k e at G i b r a l t a r , a n d lower ore grades and hence output at Boss Mtn. were a l s o c o n t r i b u t i n g f a c t o r s i n t h i s decrease.
3.2 Performance of the BC Molybdenum Industry
Table I I I - l shows BC molybdenum shipments s i n c e 1960 and t h e i r a s s o c i a t e d values. (see f o l l o w i n g page)
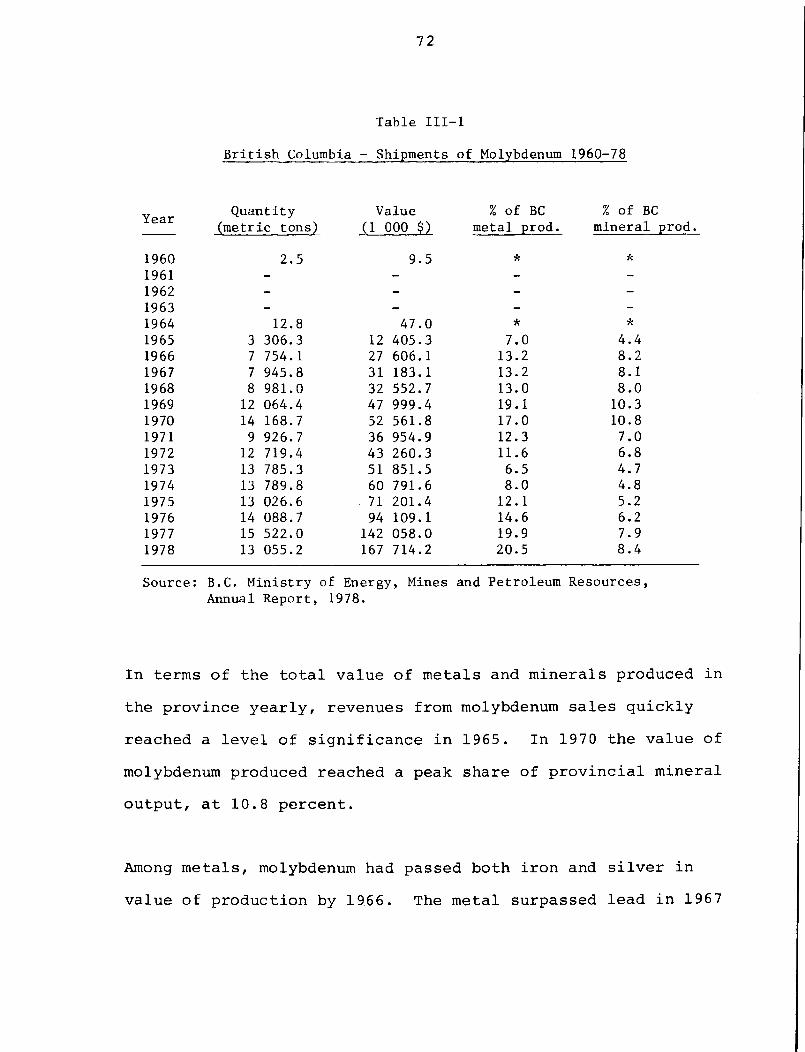
72
Table I I I - l
British Columbia - Shipments of Molybdenum 1960-78
Quantity Value % of BC % of BC (metric tons) (1 000 $) metal prod. mineral prod.
1960 2.5 9.5 * 1961 - - - -1962 - - - -1963 - - - -1964 12.8 47.0 * 1965 3 306.3 12 405.3 7.0 4.4 1966 7 754.1 27 606.1 13.2 8.2 1967 7 945.8 31 183.1 13.2 8.1 1968 8 981.0 32 552.7 13.0 8.0 1969 12 064.4 47 999.4 19.1 10.3 1970 14 168.7 52 561.8 17.0 10.8 1971 9 926.7 36 954.9 12.3 7.0 1972 12 719.4 43 260.3 11.6 6.8 1973 13 785.3 51 851.5 6.5 4.7 1974 13 789.8 60 791.6 8.0 4.8 1975 13 026.6 . 71 201.4 12.1 5.2 1976 14 088.7 94 109.1 14.6 6.2 1977 15 522.0 142 058.0 19.9 7.9 1978 13 055.2 167 714.2 20.5 8.4
Source: B.C. Ministry of Energy, Mines and Petroleum Resources, Annual Report, 1978.
In terms of the t o t a l value of metals and minerals produced i n the province y e a r l y , revenues from molybdenum s a l e s q u i c k l y reached a l e v e l of s i g n i f i c a n c e i n 1965. In 1970 the value of molybdenum produced reached a peak share of p r o v i n c i a l mineral output, a t 10.8 percent.
Among metals, molybdenum had passed both i r o n and s i l v e r i n value of production by 1966. The metal surpassed lead i n 1967
73
and z i n c i n 1974. By 1976 molybdenum was the province's second l e a d i n g metal by value next to copper, and i t has held and strengthened th a t p o s i t i o n since then.
In 1978 molybdenum, w i t h production valued at $167.7 m i l l i o n , was the province's f o u r t h most important m i n e r a l next to c o a l ($382.9 m i l l i o n ) , n a t u r a l gas ($401.4 m i l l i o n ) and copper ($431.7 m i l l i o n ) .
3.2.1 By-Production and Co-Production
Four of B r i t i s h Columbia's molybdenum producers, Bethlehem, G i b r a l t a r , I s l a n d Copper and Lornex, r e c e i v e d l e s s revenue from molybdenum than f o r t h e i r copper concentrate outputs i n 1978. These mines can thus be c l a s s i f i e d as by-product producers. The Brenda mine r e c e i v e d g r e a t e r revenues from molybdenum than copper production and thus must be considered a co-producer. The other producers, Endako and Boss Mtn., produce only molybdenum.
3.2.2 Impacts on Production
A number of impacts of molybdenum production i n BC have been l i s t e d below. Since i t would be i n a p p r o p r i a t e to a t t r i b u t e the impacts of a by-product molybdenum producer s o l e l y to molybdenum production, co-product and primary producer impacts are l i s t e d s e p a r a t e l y from by-product producer impacts.

74
3.2.3 D i r e c t Employment
By-product producers employed a 1978 average 2 250 persons a t the four o p e r a t i o n s , or 21 percent of t o t a l employment i n the p r o v i n c e ' s metals production sector"*". Employment at co-product and primary mines was a 1978 average 1 398 persons, 13 percent of metal sector employment. The average hourly wage f o r m i n e / m i l l workers from a l l BC molybdenum producers was $9.05 i n 1978.
3.2.4 Energy Use
Use of s e l e c t e d energy inputs i n 1978 i s summarized below:
Table I I I - 2 Energy Use by Molybdenum Producers, 1978
Mine Type Energy Input By-Product Co-Product & Primary Gasoline (1 000 Imp.Gals) 773 239 D i e s e l (1 000 Imp.gals) 10 935 2 545 E l e c t r i c i t y ( M i l l i o n s kwh) 991 404
E l e c t r i c i t y consumption shown above c o n s t i t u t e s 5.5 percent of BC Hydro's n o n - r e s i d e n t i a l e l e c t r i c a l output f o r the year f o r by-product producers, and 2.4 percent f o r co-product and primary producers^.

75
3.2.5 Consumption of M i n i n g / M i l l i n g Inputs
In 1978 by-product molybdenum producers consumed $78 m i l l i o n worth of m a t e r i a l s , c o n t a i n e r s , s u p p l i e s and other non-energy inputs used i n the mining and m i l l i n g processes. This f i g u r e was $36 m i l l i o n f o r co-product and primary producers i n the same year.
Table I I I - 3 Taxes Paid by BC Molybdenum Producers, 1978
(Payment ($ m i l l i o n s ) Type of Tax By-Product Co-Product & Primary M u n i c i p a l 4.1 0.9 P r o v i n c i a l 4.9 14.7 Federal 3.4 15.3
Co-products and primary producers paid s i g n i f i c a n t l y more p r o v i n c i a l and f e d e r a l taxes than by-product producers. By-product producers pai d more municipal taxes.
3.3 Current BC Molybdenum Producers P r o f i l e d
B r i e f p r o f i l e s of B r i t i s h Columbia's e x i s t i n g molybdenum producers appear below. T o t a l reserves of the metal i n BC were 303.1 thousand metric tonnes i n 1978, or 88.2% of t o t a l Canadian producer reserves. (See Table I I I - 4 ) .
76
3.3.1 Bethlehem (Bethlehem Copper Corporation)
The Bethlehem mine began o p e r a t i o n i n 1962 and recovered molybdenum from i t s copper ore b r i e f l y , from 1964 to 1966. In 1977 a molybdenum recovery c i r c u i t was added at a c o s t of about $1 m i l l i o n . Capacity of the c i r c u i t , which began production i n 1978, i s between 300 and 350 mtpy of molybdenum.
Bethlehem workers l i v e mainly i n A s h c r o f t w i t h some i n Cache Creek, the N i c o l a V a l l e y and Kamloops. A s h c r o f t r e l i e s on mining f o r only 30 percent of r e s i d e n t employment, w i t h ranching and s e r v i c e s p r o v i d i n g the main source of work ~*.
Ore reserves were expanded i n 197 8 w i t h the d i s c o v e r y of a d d i t i o n a l reserves on the edge of the Jersey P i t .
Earning per share f e l l from $1.39 i n 1974 to $0.14 i n 1977, 3
r e c o v e r i n g to $0.70 i n 1978 . The company's earnings have shown considerable growth since the a d d i t i o n of the molybdenum c i r c u i t and increased metal p r i c e s , w i t h six-month share earnings to June 30 1979 quadrupling to 70.5C per share, as opposed to 15.8C
4 per share i n the same p e r i o d i n 1978
3.3.2 Boss Mountain (Noranda Mines Ltd.)
This primary molybdenum o p e r a t i o n s t a r t e d i n 1965 but the mine was c l o s e d between 1971 and 1974 due to poor market c o n d i t i o n s .

Table I II - 4 B.C. Molybdenum Producers P r o f i l e
Mine Ownership Type
Ore Reserves M i l l
Capacity (mtpd)
Molybdenum Shipments
1977-78 ave. (1 000 mt)
Mine Ownership Type Mo %
Cu %
Contained Molybdenum (1 000 mt)
M i l l Capacity (mtpd)
Molybdenum Shipments
1977-78 ave. (1 000 mt)
Bethlehem Bethlehem Copper Corp. 100%: Newmont 22.8% Gulf Res. 25.8% Cominco 39.3%
By-Product Open P i t
0.01 (estimate)
0.42 6.1 18 600 started 1978
Boss Mountain Noranda Mines 100% Primary Underground/Open P i t
0.186 - 4.6 1 590 879
Brenda Brenda Mines Ltd: Noranda 50.9% Nippon 7.6% M i t s u i 0.3%
Co-Product Open P i t
0.04 0.165 32.1 27 200 3 589
Endako Placer Development Ltd. 100%: Noranda 31.4%
Primary Open P i t 0.082 - 162.9 24 500 6 861
G i b r a l t a r Placer Development Ltd. 71.9%
By-Product Open P i t 0.009 0.36 20.8 36 300 128
Island Copper Utah Mines Ltd. 100% By-Product Open P i t
0.015 0.5 27.7 34 500 924
Lornex Rio Algom Ltd. 68.1% Teck Corp. 20.8%
By-Product Open P i t
0.012 0.406 48.9 40 900 1 855

78 B E T H L E H E M M I N E , H I G H L A N D V A L L E Y , B . C .
79
Due to f a l l i n g ore reserves a small open p i t was added to the o r i g i n a l underground operations i n 1978. Production of molybdenum i s c u r r e n t l y about 50% from underground and 50% from open-pit but the l a t t e r i s not expected to produce a f t e r 1980.
Workers l i v e i n the company town of Hendrix Lake, f i v e m i l e s from the m i n e s i t e .
3.3.3 Brenda (Noranda Mines Ltd.)
Brenda i s a true co-product producer of molybdenum, d e r i v i n g a g r e a t e r , but comparable, amount of i t s revenues from i t s molybdenum than i t s copper output. Mining, which began i n 1969, i s by open-pit methods. The m i l l i n c l u d e s a l e a c h i n g p l a n t , n e c e s s i t a t e d by lead and copper content i n molybdenum concentrates produced.
Most workers l i v e i n Peachland, 18 m i l e s from the mine on the shore of Okanagan Lake. Many l i v e i n Kelowna and P e n t i c t o n .
Earnings per share rose from $2.21 i n 1977 to $3.14 i n 1978. Increased molybdenum p r i c e s w i l l push t h i s higher i n 1979.^
3.3.4 Endako (Placer Development Ltd)
The Endako mine i s B r i t i s h Columbia's l a r g e s t molybdenum producer, and f o u r t h l a r g e s t i n world production. Operations, which i n c l u d e

B R E N D A M I N E , O K A N A G A N A R E A , B . C .
B r e n d a T a i l i n g s P o n d
81
the mining and m i l l i n g of molybdenite ore and the r o a s t i n g of
concentrates, began i n 1965. Roasting c a p a c i t y has been increased
s t e a d i l y since s t a r t u p to i t s present l e v e l of 7 700 mtpy of
contained molybdenum. Plans are to increase t h i s to 10 8 00 mtpy by 1981.
Most Endako workers l i v e i n Fraser Lake, where about three quarters of employment i s provided by the mine and the remainder being i n f o r e s t r y and s e r v i c e s . A few workers l i v e i n Burns Lake and Vanderhoof.
The Endako mine has been very important to P l a c e r ' s earnings i n recent years, p r o v i d i n g $1.54 of P l a c e r ' s 1977 net earnings per share of $1.78, and $1.62 of $1.67 i n 1978. In the f i r s t s i x months of 1979 P l a c e r earnings per share t r i p l e d to $3.01 from 92C i n the same per i o d i n 1978.
A work stoppage began at the mine on February 15, 197 9, and continued u n t i l November 2, 1979. The consequent d i s r u p t i o n of supply aggravated the already s e r i o u s world shortage of molybdenum since the mine was operated at one t h i r d c a p a c i t y during t h a t p e r i o d (see Sec t i o n I V ).
3.3.5 G i b r a l t a r (Placer Development Ltd.)
G i b r a l t a r i s a minor by-product producer of molybdenum. Recovery of the metal was resumed i n 1977 a f t e r c l o s u r e of the molybdenum
82
c i r c u i t f o r most of 1975 and a l l of 1976. A 31-week s t r i k e , l a s t i n g u n t i l February 1979, has reduced recent production.
The o p e r a t i o n has had f i n a n c i a l d i f f i c u l t i e s i n recent years, o p e r a t i n g at a l o s s i n both 1977 and 1978.
In the f i r s t s i x months of 1979 the company reported earnings of 60 cents a share, however, l a r g e l y due to record high p r i c e s f o r i t s molybdenum e x t r a c t , which P l a c e r s o l d by tender. P r i c e s p a i d
7
f o r t h i s output have been c l o s e to spot market l e v e l s .
3.3.6 I s l a n d Copper (Utah I n t e r n a t i o n a l )
F i r s t shipments from t h i s by-product molybdenum producer were i n 19 71 and production has increased q u i t e s t e a d i l y since then. P o r t Hardy i s the mine townsite, but the town r e l i e s on mining f o r l e s s than h a l f of i t s employment, w i t h the balance taken up by l o g g i n g , f i s h i n g and s e r v i c e s . The D i s t r i c t of Port Hardy, inco r p o r a t e d i n 196 5, i n c l u d e s the m i n e s i t e .
The mine's ore reserves are c h a r a c t e r i z e d by a high rhenium content (up to 0.2% on 100% M 0 S 2 ) . Molybdenum concentrates are exported to the United States where they are roasted and the rhenium e x t r a c t e d . Utah experimented w i t h o n - s i t e r o a s t i n g but e l e c t e d to export f o r f u r t h e r p r o c e s s i n g .

83
3.3.7 Lornex (Rio Algom)
C u r r e n t l y Canada's l a r g e s t metal mine and BC's l a r g e s t producer of by-product molybdenum, Lornex began operations i n 1972. Design m i l l i n g c a p a c i t y of 34 470 mtpd of ore was reached by 1973 and since 1976 the m i l l i n g r a t e has averaged 42 600 mtpd of ore.
The townsite of Logan Lake was b u i l t as p a r t of the mine development. Logan Lake i s 11 m i l e s east of the mine and was i n c o r p o r a t e d i n 1970. A few workers, about 10 percent of the mine workforce, l i v e i n the centres of A s h c r o f t , M e r r i t t and Kamloops, each about 30 m i l e s from the mine.
Lornex earnings per share dropped to $0.08 i n 1975 but recovered to $1.93 i n 1976, $0.94 i n 1977 and $1.74 i n 1978. Healthy gains were shown i n 1979, w i t h six-month earnings per share of $1.91
g (compared to $0.54 i n the f i r s t h a l f of 1978) reported
Lornex plans to have i t s concentrates t o l l - r o a s t e d at Endako once expansion i n r o a s t i n g c a p a c i t y there i s completed. Concentrates are c u r r e n t l y s o l d d i r e c t l y to P h i l l i p Bros., an i n t e r n a t i o n a l metals company.
9 .4 - T h e o r e t i c a l G e o l o g i c a l P o t e n t i a l
B r i t i s h Columbia i s one of the world's major areas of molybdenum m i n e r a l i z a t i o n . The Canadian C o r d i l l e r a , i n which BC's d e p o s i t s are
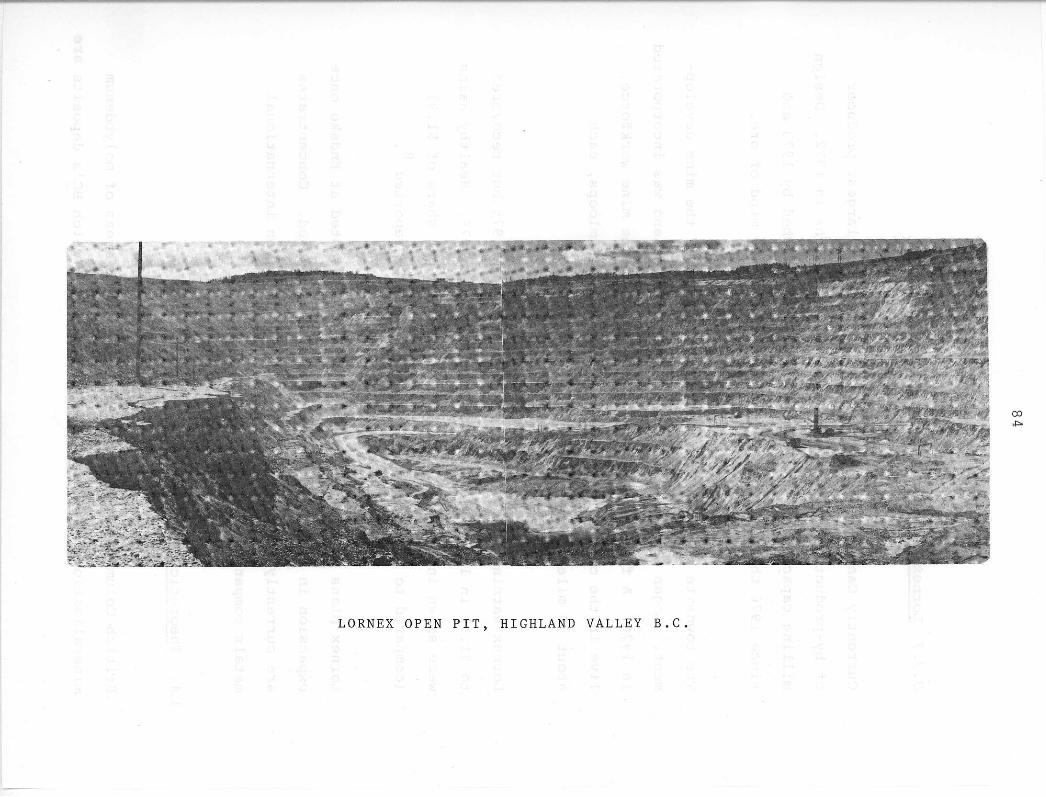
CO
L O R N E X O P E N P I T , H I G H L A N D V A L L E Y B . C .
•

85
found, i s p a r t of the C i r c u m p a c i f i c Mountain B e l t , which s t r e t c h e s south to T i e r r a d e l Fuego. The world's major molybdenum de p o s i t s i n Colorado, Arizona and C h i l e , are l o c a t e d i n t h i s b e l t .
3.4.1 Types of BC Molybdenum Deposits
Molybdenum deposits i n the p r o v i n c e are of four major types -porphyry, pegmatite, quartz v e i n and skarn.
Porphyry-type molybdenum de p o s i t s and copper-molybdenum d e p o s i t s dominate the province's molybdenum resource. A porphyry d e p o s i t i s a l a r g e low to medium grade deposit r e l a t e d to v o l c a n i c or igneous rock, i n which conspicuous c r y s t a l s are u s u a l l y set i n a f i n e - g r a i n e d ground mass. A l l the the c u r r e n t molybdenum-producing mines i n the province work such d e p o s i t s . G e n e r a l l y , the d i s t r i b u t i o n of major porphyry molybdenum and copper-molybdenum depo s i t s i n the Province i s s i m i l a r .
The o n l y major pegmatite deposi t to have been i d e n t i f i e d and/or e x p l o i t e d i s the Mt. Copeland mine, which operated from 1970 to 1973. Quartz-vein type d e p o s i t s are o f t e n found i n the p r o x i m i t y of a porphyry d e p o s i t . An example i s the Endako d e p o s i t , which has s e v e r a l such veins a s s o c i a t e d w i t h i t . Minor molybdenum producers th a t worked such d e p o s i t s i n the pre-1960 p e r i o d were the Golconda mine at O l l o l a , the Index mine near L i l l o e t t , and the M o l l y mine near Salmo. The o n l y skarn-type to have been worked i s the Red Mountain (Loxey) mine near Rossland, which produced 1655 mt of molybdenum between 1966 and 1972.
86
3.4.2 D i s t r i b u t i o n of BC Molybdenum Deposits
The Canadian C o r d i l l e r a contains f i v e t e c t o n i c ( s t r u c t u r a l ) b e l t s w i t h i n which the geology i s dominated by rocks of a s i m i l a r age, e v o l u t i o n and h i s t o r y . In a d d i t i o n , each b e l t shows a c h a r a c t e r i s t i c molybdenum m i n e r a l i z a t i o n . Figure I I I - l shows these b e l t s and the major molybdenum and copper-molybdenum dep o s i t s contained w i t h i n each. C u r r e n t l y operating producers and prospects (as i d e n t i f i e d below) are a l s o shown.
The Eastern Marginal B e l t (occupying the general area of the Rocky Mountains) contains no i d e n t i f i e d molybdenum d e p o s i t s . Moving west, the Omineca B e l t contains s e v e r a l d e p o s i t s i n the northern and southern regions. Near Revelstoke, f o r example, the Mt. Copeland mine worked a pegmatic-type d e p o s i t . Omineca i s the only b e l t to c o n t a i n skarn-type d e p o s i t s of any magnitude.
The Intermontane B e l t , which runs down the i n t e r i o r of the p r o v i n c e , contains most of B r i t i s h Columbia's porphyry-type molybdenum and copper-molybdenum d e p o s i t s , i n c l u d i n g s i x of the seven producing mines. In the Highland V a l l e y area near Kamloops, molybdenum occurs i n v a r y i n g grades w i t h copper i n l a r g e porphyry d e p o s i t s and i s c u r r e n t l y recovered as a by-product at the area's Lornex and Bethlehem open-pit mines. The b e l t a l s o contains the Brenda mine, w i t h i t s high molybdenum to copper content, and the Endako mine, the t h i r d l a r g e s t primary producer i n the world. The province's only other primary molybdenum mine, Boss Mountain,
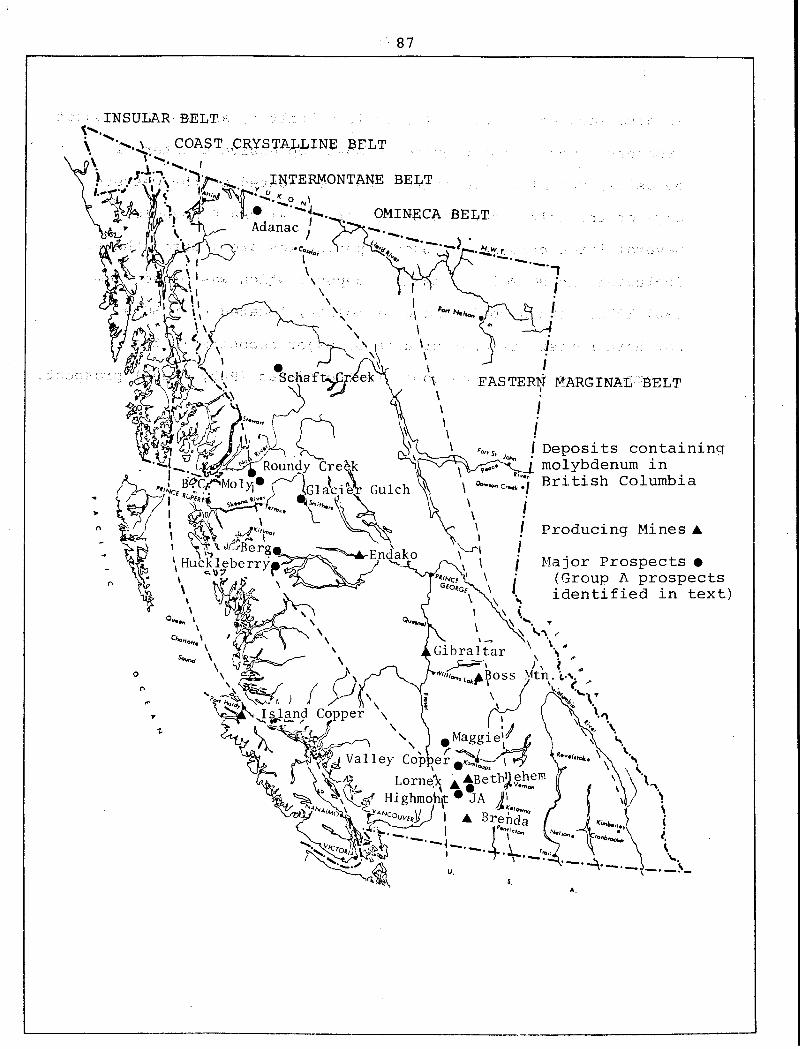
87
INSULAR BELT• ^ . COAST .CRYSTALLINE BELT r i" y INTERMONTANE BELT
OMINECA BELT
EASTERN MARGINAL BELT
I Deposits c o n t a i n i n g molybdenum i n B r i t i s h Columbia
/ Producing Mines • \ \ j Major Prospects
'"J&t^L. ^ i (Group A prospects i d e n t i f i e d i n text)
*"-u*ABoss Mtn. i.v* >
V a l l e y Copper Lornek AABethJghem
Highmohf • JA ^t^J ! A Bre&a
m & • -4-v—r;
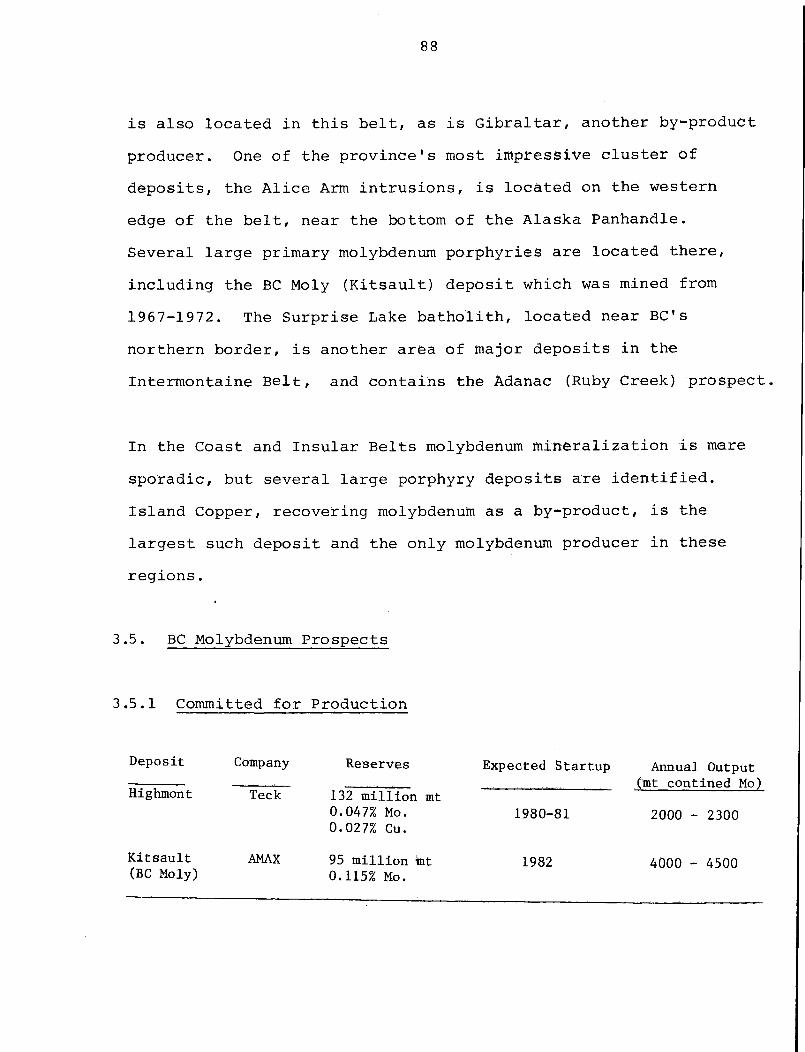
88
i s a l s o l o c a t e d i n t h i s b e l t , as i s G i b r a l t a r , another by-product producer. One of the p r o v i n c e f s most impressive c l u s t e r of de p o s i t s , the A l i c e Arm i n t r u s i o n s , i s l o c a t e d on the western edge of the b e l t , near the bottom of the A l a s k a Panhandle. Several l a r g e primary molybdenum porphyries are l o c a t e d there, i n c l u d i n g the BC Moly ( K i t s a u l t ) d e p o s i t which was mined from 1967-1972. The S u r p r i s e Lake b a t h o l i t h , l o c a t e d near BC fs northern border, i s another area of major d e p o s i t s i n the Intermontaine B e l t , and contains the Adanac (Ruby Creek) prospect.
In the Coast and I n s u l a r B e l t s molybdenum m i n e r a l i z a t i o n i s more sporadic, but s e v e r a l l a r g e porphyry d e p o s i t s are i d e n t i f i e d . I s l a n d Copper, recovering molybdenum as a by-product, i s the l a r g e s t such deposit and the only molybdenum producer i n these r e g i o n s .
3 .5. BC Molybdenum Prospects
3.5.1 Committed f o r Production
Deposit Company Reserves Expected Startup Annual Output
Highmont Teck (mt contined Mo)
132 million mt 0.047% Mo. 0.027% Cu.
1980-81 2000 - 2300
Kitsault (BC Moly)
AMAX 95 million tet 0.115% Mo.
1982 4000 - 4500

R9
3.5.1.1 Highmont (Highmont Mining Corporation)
Teck Corporation, w i t h a 53% i n t e r e s t i n Highmont Mining and a
30% i n t e r e s t i n the Highmont property, plans to spend
$125-150 m i l l i o n to develop t h i s copper/molybdenum mine i n the
Highland V a l l e y of BC. Preparatory work on the de p o s i t , which
borders the Lornex Mine property on the south and west, began
i n May of 1979. Planned m i l l i n g r a t e i s 25 000 tonnes per day, and
the o p e r a t i o n i s expected to employ 4 00. Molybdenum output w i l l be
s o l d to M e t a l l g e s e l l s c h a f t of Germany, a company which r e c e n t l y
became Teck's second l a r g e s t shareholder. The planned annual
production of 227 000 mt of copper concentrates w i l l be s o l d through Marc Rich of New York. A mine l i f e of 13 to 15 years i s a n t i c i p a t e d by the amount of i n d i c a t e d reserves
3.5.1.2 K i t s a u l t (Amax of Canada)
AMAX plans to reopen t h i s primary molybdenum mine which was operated by Kennecott from 1967 to 1972. The o r i g i n a l p l a n t , designed to process 6 000 tonnes of ore per day, w i l l be expanded to 12 000 tonnes per day and a concentrate l e a c h i n g p l a n t w i l l be i n s t a l l e d to reduce lead content. Access to Terrace w i l l be made p o s s i b l e through a proposed road i n l a n d . T o t a l investment r e q u i r e d to develop t h i s property, which AMAX bought from Kennecott a t a cost of $2.62 m i l l i o n i s estimated a t $135 m i l l i o n (U.S.) While AMAX b e l i e v e s the access road i s important to reduce the i s o l a t i o n
90
of the community, the company a l s o plans to use i t f o r t r u c k i n g concentrate i n l a n d to Endako f o r r o a s t i n g . Heavy s n o w f a l l , as i s c h a r a c t e r i s t i c f o r the area, may r e s t r i c t w inter access i n any case.
.5.2 Prospects
A l i s t of the province's major molybdenum prospects appears below. Prospect c a t e g o r i e s are described as f o l l o w s : 1. S u b s t a n t i a l Development
Prospects f o r which extensive d r i l l i n g and g e o l o g i c a l e x p l o r a t i o n has taken place. Most have undergone an economic f e a s i b i l i t y study. Ore reserves are w e l l documented and p o t e n t i a l i s c l e a r l y e s t a b l i s h e d .
2. P a r t i a l Development Less development than Group A prospects. A v a i l a b l e i n f o r m a t i o n i n d i c a t e s l e s s development p o t e n t i a l than Group A prospects, but more in f o r m a t i o n r e q u i r e d .
3. Less Development or Undocumented Ore reserves l e s s documented, or l e s s i n d i c a t e d p o t e n t i a l than Group B prospects. Apparent p o t e n t i a l i n some cases but more e x p l o r a t i o n and documentation r e q u i r e d .
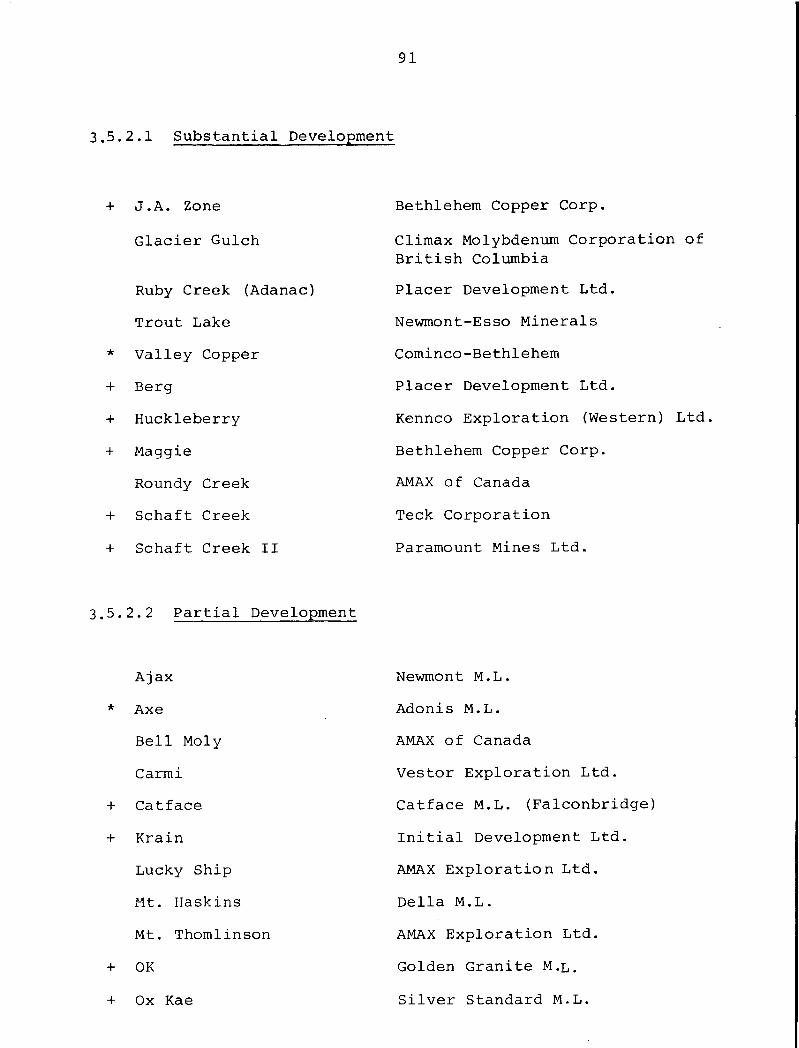
91
3.5.2.1 S u b s t a n t i a l Development
+ J.A. Zone Bethlehem Copper Corp.
G l a c i e r Gulch Climax Molybdenum Corporation of B r i t i s h Columbia
Ruby Creek (Adanac) P l a c e r Development L t d . Trout Lake Newmont-Esso M i n e r a l s
* V a l l e y Copper Cominco-Bethlehem + Berg P l a c e r Development L t d . + Huckleberry Kennco E x p l o r a t i o n (Western + Maggie Bethlehem Copper Corp.
Roundy Creek AMAX of Canada + Schaft Creek Teck Corporation + Schaft Creek I I Paramount Mines L t d .
5. 2.2 P a r t i a l Development
Ajax Newmont M.L. * Axe Adonis M.L.
B e l l Moly AMAX of Canada Carmi Vestor E x p l o r a t i o n L t d .
+ Catface Catface M.L. (Falconbridge) + K r a i n I n i t i a l Development L t d .
Lucky Ship AMAX E x p l o r a t i o n L t d .
Mt. Haskins D e l i a M.L. Mt. Thomlinson AMAX E x p l o r a t i o n L t d .
+ OK Golden Granite M . L .
+ Ox Kae S i l v e r Standard M.L.
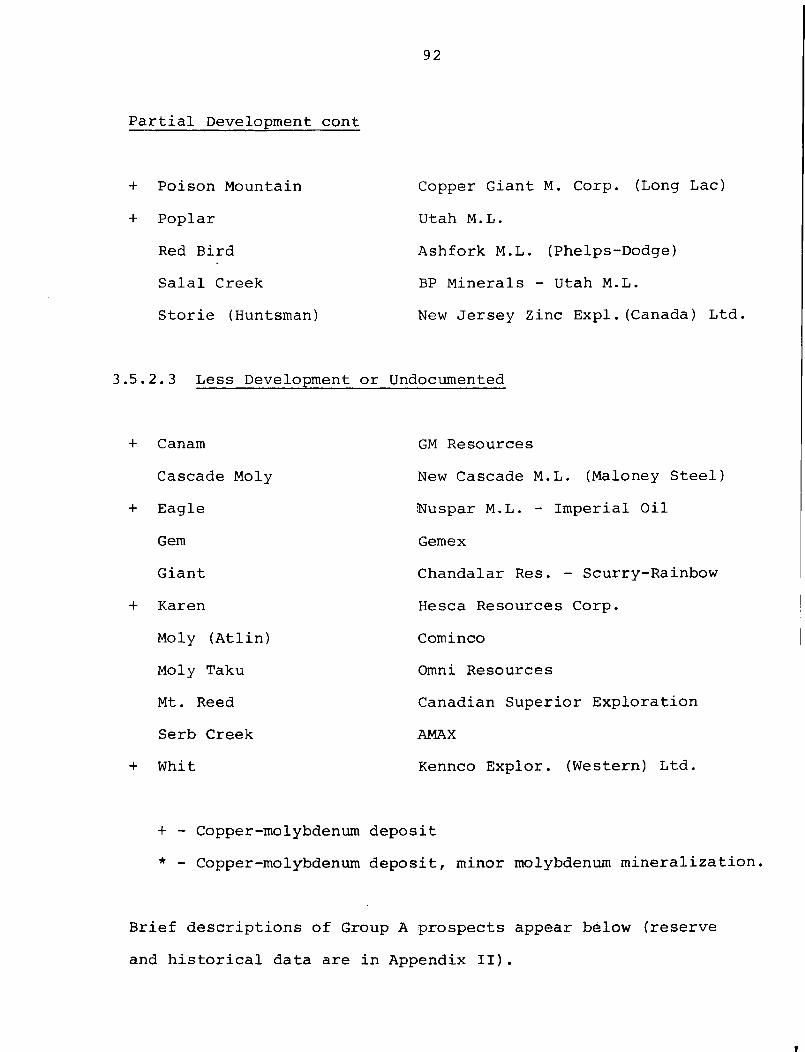
92
P a r t i a l Development cont
+ Poison Mountain + Poplar
Red B i r d S a l a l Creek S t o r i e (Huntsman'
Copper Giant M. Corp. (Long Lac)
Utah M.L. Ashfork M.L. (Phelps-Dodge) BP M i n e r a l s - Utah M.L. New Jersey Zinc Expl.(Canada) L t d
3.5.2.3 Less Development or Undocumented
+ Canam Cascade Moly
+ Eagle Gem Giant
+ Karen Moly ( A t l i n ) Moly Taku Mt. Reed Serb Creek
+ Whit
GM Resources New Cascade M.L- (Maloney Steel) iNuspar M.L. - Imp e r i a l O i l Gem ex Chandalar Res. - Scurry-Rainbow Hesca Resources Corp. Cominco Omni Resources Canadian Superior E x p l o r a t i o n AMAX Kennco Explor. (Western) L t d .
+ - Copper-molybdenum deposit * - Copper-molybdenum d e p o s i t , minor molybdenum m i n e r a l i z a t i o n
B r i e f d e s c r i p t i o n s of Group A prospects appear below (reserve and h i s t o r i c a l data are i n Appendix I I ) .
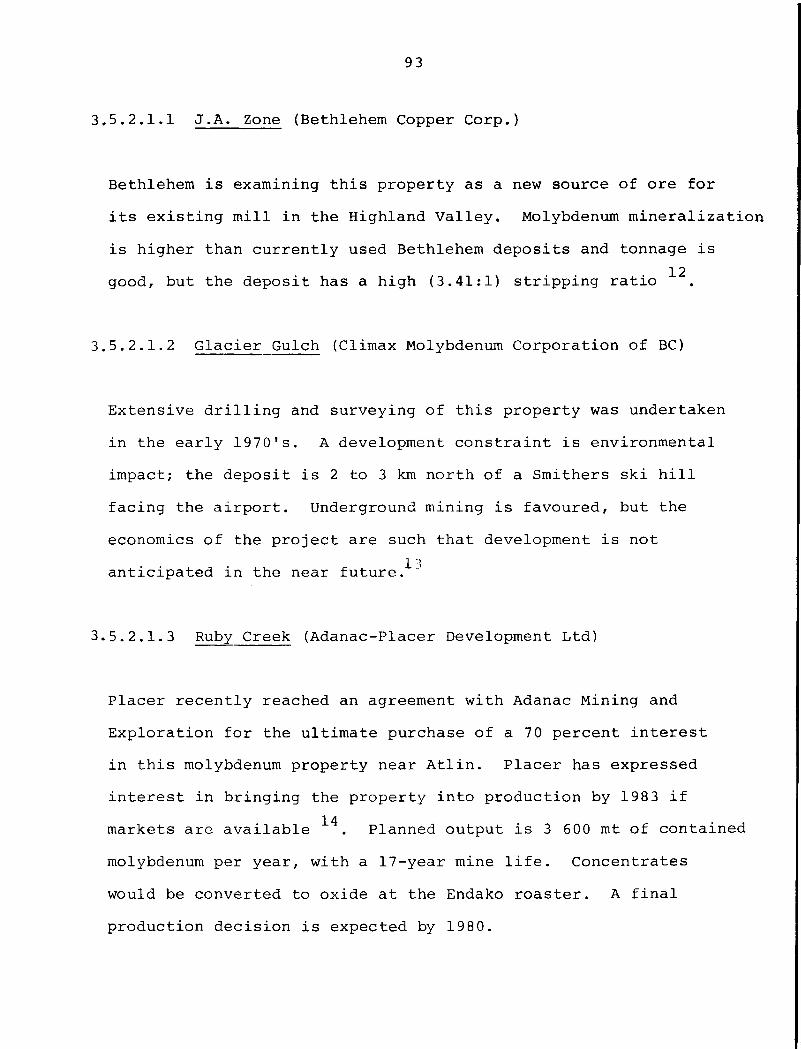
93
3.5.2.1.1 J.A. Zone (Bethlehem Copper Corp.)
Bethlehem i s examining t h i s property as a new source of ore f o r i t s e x i s t i n g m i l l i n the Highland V a l l e y . Molybdenum m i n e r a l i z a t i o n i s higher than c u r r e n t l y used Bethlehem d e p o s i t s and tonnage i s
12 good, but the deposit has a high (3.41:1) s t r i p p i n g r a t i o
3.5.2.1.2 G l a c i e r Gulch (Climax Molybdenum Corporation of BC)
Extensive d r i l l i n g and surveying of t h i s property was undertaken i n the e a r l y 1970's. A development c o n s t r a i n t i s environmental impact; the deposit i s 2 to 3 km north of a Smithers s k i h i l l f a c i n g the a i r p o r t . Underground mining i s favoured, but the economics of the p r o j e c t are such th a t development i s not a n t i c i p a t e d i n the near future.^"'
3.5.2.1.3 Ruby Creek (Adanac-Placer Development Ltd)
P l a c e r r e c e n t l y reached an agreement w i t h Adanac Mining and E x p l o r a t i o n f o r the u l t i m a t e purchase of a 70 percent i n t e r e s t i n t h i s molybdenum property near A t l i n . P l a c e r has expressed i n t e r e s t i n b r i n g i n g the property i n t o production by 1983 i f
14 markets are a v a i l a b l e . Planned output i s 3 600 mt of contained molybdenum per year, w i t h a 17-year mine l i f e . Concentrates would be converted to oxide at the Endako r o a s t e r . A f i n a l p roduction d e c i s i o n i s expected by 1980.

94
3.5.2.1.4 Trout Lake (Newmont-Esso Minerals)
Newmont E x p l o r a t i o n o f Canada (55%) and Esso M i n e r a l s Canada (45%) are planning a 1979/80 underground e x p l o r a t i o n and sampling program c o s t i n g $4.5 m i l l i o n f o r t h i s d e p o s i t l o c a t e d 35 mi l e s southeast of Revelstoke. While r e p o r t s of "an economic d e p o s i t " have been made, no grade or tonnage f i g u r e s have yet been rele a s e d
3.5.2.1.5 V a l l e y Copper ( V a l l e y Copper Mines Ltd.)
This d e p o s i t , l o c a t e d i n the Highland V a l l e y , touches the Bethlehem mine property on the northeast and Lornex on the southeast. Cominco has 81.7% ownership of V a l l e y Copper, Bethlehem a 5.1% i n t e r e s t . 20% of the copper-molybdenum de p o s i t i s i n Bethlehem property as w e l l . Molybdenum m i n e r a l i z a t i o n i s minor and e r r a t i c ; molybdenum production would l i k e l y be s i m i l a r to Bethlehem's (300 mtpy). Cominco plans to make a d e c i s i o n by the end of 1979, and has expressed i n t e r e s t i n development. M i l l c a p a c i t y would be 55-60 000 tons of ore per day, investment i n the order of $350 m i l l i o n . $0.90-$l.00/lb. are s a i d to be r e q u i r e d f o r development
3.5.2.1.6 Berg (Kennco E x p l o r a t i o n (Western) Ltd)
P l a c e r Development L t d . acquired the o p t i o n to t h i s copper-molybdenum property i n 1972 and has continued e x p l o r a t i o n since then. I n f r a s t r u c t u r e costs of development are great, however; the
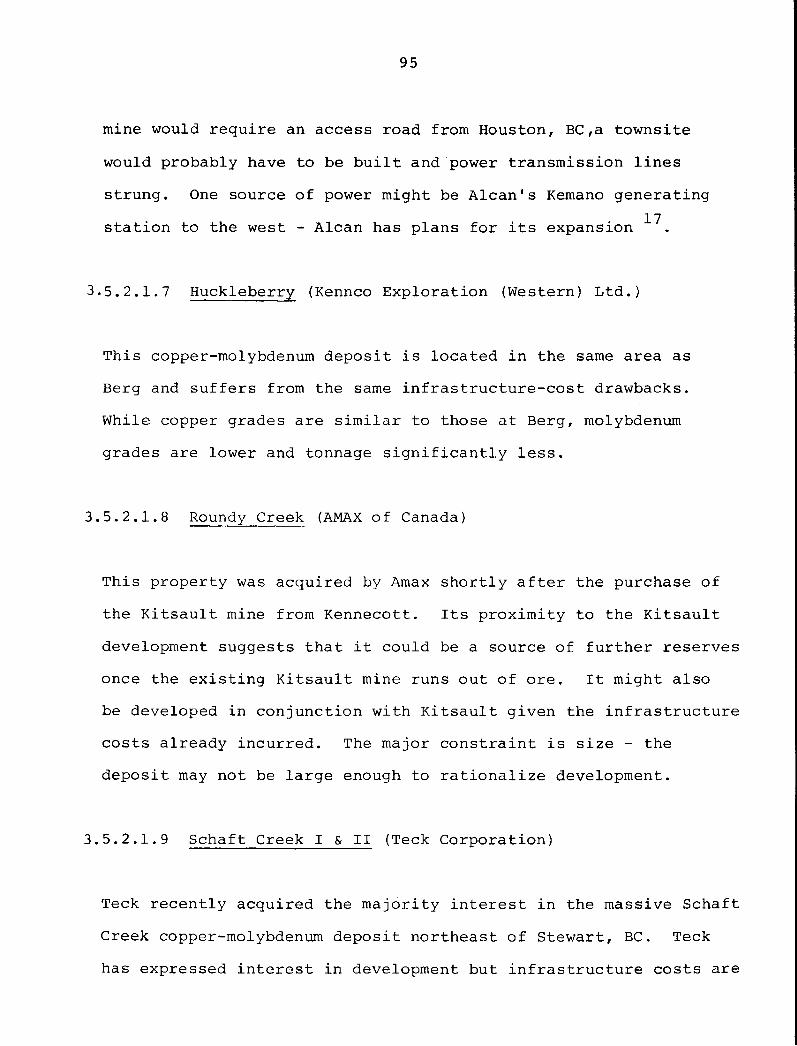
95
mine would r e q u i r e an access road from Houston, BC,a townsite would probably have to be b u i l t and power tr a n s m i s s i o n l i n e s strung. One source of power might be Mean's Kemano generating
17 s t a t i o n to the west - Alcan has plans f o r i t s expansion
3.5.2.1.7 Huckleberry (Kennco E x p l o r a t i o n (Western) Ltd.)
This copper-molybdenum deposit i s l o c a t e d i n the same area as Berg and s u f f e r s from the same i n f r a s t r u c t u r e - c o s t drawbacks. While copper grades are s i m i l a r to those at Berg, molybdenum grades are lower and tonnage s i g n i f i c a n t l y l e s s .
3.5.2.1.8 Roundy Creek (AMAX of Canada)
This property was acquired by Amax s h o r t l y a f t e r the purchase of the K i t s a u l t mine from Kennecott. I t s p r o x i m i t y to the K i t s a u l t development suggests t h a t i t could be a source of f u r t h e r reserves once the e x i s t i n g K i t s a u l t mine runs out of ore. I t might a l s o be developed i n c o n j u n c t i o n w i t h K i t s a u l t given the i n f r a s t r u c t u r e c o s ts already i n c u r r e d . The major c o n s t r a i n t i s s i z e - the d e p o s i t may not be l a r g e enough to r a t i o n a l i z e development.
3.5.2.1.9 Schaft Creek I & I I (Teck Corporation)
Teck r e c e n t l y acquired the m a j o r i t y i n t e r e s t i n the massive Schaft Creek copper-molybdenum deposit northeast of Stewart, BC. Teck has expressed i n t e r e s t i n development but i n f r a s t r u c t u r e c o s t s are

96
immense. They i n c l u d e access roads, p o s s i b l y a 20 - 30 m i l e 18
t u n n e l , power tr a n s m i s s i o n and townsite c o n s t r u c t i o n
3.5.3 Expansion at E x i s t i n g BC Mines
3.5.3.1 G r a n i s l e (Zapata-Granby Corp.)
A molybdenum recovery c i r c u i t i s planned f o r t h i s 14 000 tonne per day m i l l . Molybdenum w i l l be produced i n t e r m i t t e n t l y , s t a r t i n g next summer. Annual output w i l l l i k e l y be about 100 mt of
19
contained molybdenum per year
3.5.3.2 Lornex (Rio Algom Ltd.)
F e a s i b i l i t y s t u d i e s are underway f o r 50% expansion of the mine and m i l l . Management f e e l s t h a t such an expansion would s t i l l
20
leave the mine wit h a greater-than 2 0 year mine l i f e
3.5.3.3 Boss Mountain (Noranda Mines Ltd.)
Expansion of the open p i t a t t h i s combined underground-open p i t mine has been considered f o r some time. I f such p i t and m i l l expansion occurs, output could be increased to 3 600 mt per year
21 of contained molybdenum by as e a r l y as 1980 . A f a c t o r c o n s t r a i n i n g such development c u r r e n t l y i s u n c e r t a i n molybdenum content of reserves.

97
SECTION I I I FOOTNOTES
1. M i n i s t r y of Energy, Mines and Petroleum Resources, Annual Report 1978.
2. BC Hydro, Annual Report 1978/79, p. 37. 3. Bethlehem Copper Corp., Annual Report 1978. 4. Bethlehem Copper Corp., I n t e r i m Report June 30, 1979. 5. Bancroft, C l i f f o r d G., Mining Communities i n BC: A S o c i a l
I n f r a s t r u c t u r e A n a l y s i s ^ 1975 (U. V i c t o r i a & Energy, Mines and Petroleum Resources.)
6. Ames Research A n a l y s i s : Brenda Mines L t d . , June 1979. 7. Metals Week, var i o u s i s s u e s i n 197 9 r e p o r t i n g G i b r a l t a r tenders. 8. Lornex Mining Corp. L t d . , Annual Report 1978 and I n t e r i m Report. 9. This d i s c u s s i o n i s based upon S o r e g a r o l i , A.E. and Sutherland
Brown, A., " C h a r a c t e r i s t i c s of Canadian C o r d i l l e r a n Molybdenum Deposits" i n C.I.M.M. S p e c i a l Volume 15 (1976), pp. 417-431.
10. This t a b l e i s the r e s u l t of c o n s u l t a t i o n s w i t h Dr. N.C. C a r t e r , J.A. Garnett and Dr. A. Sutherland Brown of the M i n i s t r y of Energy, Mines and Petroleum Resources, G e o l o g i c a l D i v i s i o n , and reference research (see Appendix B) by J . Tyhurst, Economics and Planning D i v i s i o n .
11. Teck Corporation L t d . , Annual Report 1978 and Northern Miner, A p r i l 26, 1979.
12. Bethlehem Copper Corp., Annual Report 1978; Mc M i l l a n , W.J. "J.A.", C.I.M.M. S p e c i a l Volume 15, 1976.
13. Northern Miner, Canadian Mines Handbook, 1978-79. 14. Tex Report, May 17, 197 9. 15. Northern Miner, August 2, 1979. 16. George Cross Newsletter 110, June 1979; Northern Miner, June 28,
1979; F i n a n c i a l Post June 30, 1979. 17. Wright Engineers, Forecast of Developments i n the Mi n e r a l s Sector
of the N.W. Region of BC, 1975. 18. I b i d . ; Teck Corporation L t d . , Annual Report 1978. 19. Zapata-Granby personnel. 20. Mining J o u r n a l , A p r i l 27, 1979. 21. Tex Report, A p r i l 24, 1979.
99
SECTION 4
MARKET STRUCTURE, PRICES, PROJECTIONS

101
4. Market S t r u c t u r e , P r i c e s , P r o j e c t i o n s
4.1 I n d u s t r i a l Organizations and Market H i s t o r y
The i n d u s t r i a l o r g a n i z a t i o n of western world molybdenum producers i s c h a r a c t e r i z e d by the dominance of one f i r m - the Climax Molybdenum Company, a D i v i s i o n of AMAX. Climax was the only company to hold a greater than 10 percent share of world output i n 1978 - with an impressive 38.6 percent i n that year (see Table I I - 5 ) . The company has a l s o been s u c c e s s f u l i n e s t a b l i s h i n g processing f a c i l i t i e s i n W. Europe, the area of l a r g e s t world consumption of the metal, thereby s t a b i l i z i n g demand f o r i t s products. Climax has a l s o been instr u m e n t a l i n developing many of the new a p p l i c a t i o n s f o r the metal through i t s research and development a c t i v i t i e s .
Climax has been the t r a d i t i o n a l leader i n e s t a b l i s h i n g p r i c e and marketing p a t t e r n s among producers. P r i o r to 1978 the Climax p r i c e was b a s i c a l l y matched by other major world producers and thus p r i c i n g took on the appearance of o l i g o p o l i s t i c p r i c e l e a d e r s h i p . Up u n t i l 1974 p r i c e s t a b i l i t y was great, w i t h Climax p r i c e s remaining unchanged f o r years at a time (see Table and Figure IV-1). I t i s understandable i n an economic sense t h a t Climax, the l a r g e s t s e l l e r , should want to maintain t h i s s i t u a t i o n s ince s t a b l e p r i c e s encourage growth i n demand and ensure p r o f i t a b l e o p e r a t i o n s . I t was the c l i m a t e r e q u i r e d to enable the metal to e s t a b l i s h a s o l i d and d i v e r s i f i e d end-use p a t t e r n . G e n e r a l l y speaking p r i c e competition i n molybdenum markets has thus f a r been absent -
102
competition has been aimed mainly at the markets of s u b s t i t u t e metals. The s t r a t e g y of s t a b l e p r i c i n g and ensured supply has proven to be an important s e l l i n g p o i n t f o r the metal, and was one of the f a c t o r s that has enabled molybdenum to out-compete i t s s u b s t i t u t e s , eg. tungsten, which s u f f e r from wide p r i c e and supply f l u c t u a t i o n s . S u b s t i t u t i o n took place as new a p p l i c a t i o n s f o r the metal were developed and consequently, demand rose r a p i d l y . World molybdenum p r i c i n g has thus f a r been b a s i c a l l y p r o d u c e r - c o n t r o l l e d - most s a l e s of the metal being made at c o n t r a c t or "producer" p r i c e s . Strong b u y e r - s e l l e r t i e s , between molybdenum producers and l a r g e i r o n and s t e e l manufacturers, f o r example, have allowed t h i s p r i c i n g s t r u c t u r e to p e r s i s t , as long as a dependable supply was a v a i l a b l e .
Molybdenum i s a l s o s o l d at "dealer" or spot-market p r i c e s by i n t e r n a t i o n a l metal t r a d i n g companies l i k e P h i l l i p Bros, and A s s o c i a t e d Metals. Before 1978, such s a l e s accounted f o r a minor (15% or l e s s ) amount of the t o t a l , w i t h the balance being at c o n t r a c t or producer p r i c e s . A l s o , u n t i l r e c e n t l y , spot-market p r i c e s f o r molybdenum were very c l o s e to producer p r i c e s , w i t h i n a range of two times the l a t t e r .
An exception was a p e r i o d i n the e a r l y 1960's when spot-market p r i c e s rose to 5 times the producer p r i c e as a r e s u l t of growing demand f o r the metal and consumption t h a t exceeded supply. These increased p r i c e s prompted s e v e r a l new producers to enter the market, i n c l u d i n g s e v e r a l i n B r i t i s h Columbia (Endako and K i t s a u l t among them). By the l a t e 60's there was a world oversupply of the

103 TABLE IV - 1
HISTORICAL MOLYBDENUM PRICES, 1955-1978
YEAR ACTUAL PRICE* 1977 $
1955 1.10 2 . 55 1956 1.18 2 . 66 1957 1.18 2 . 57 1958 1.25 2 . 68 1959 1.25 2 . 62 1960 1.25 2 . 58 1961 1.40 2 .86 1962 1.40 2 . 81 1963 1.40 2.77 1964 1 .55 3 . 02 1965 1. 55 2 .95 1966 1. 55 2 .86 1967 1 . 62 2 . 90 1968 1. 62 2 . 78 1969 1. 72 2 .81 1970 1. 72 2 .67 1971 1. 72 2 . 54 1972 1.72 2 .44 1973 1.72 2 . 30 1974 2 . 02 2.47 1975 2 . 48 2 .76 1976 2 . 94 3.11 1977 3 . 68 3 . 68 1978 4. 52 4 .21
C l i m a x c o n c e n t r a t e i n U.S. $ / l b . w e i g h t e d a v e r a g e i n each y e a r .
S o u r c e : U.S. Bureau of M i n e s .
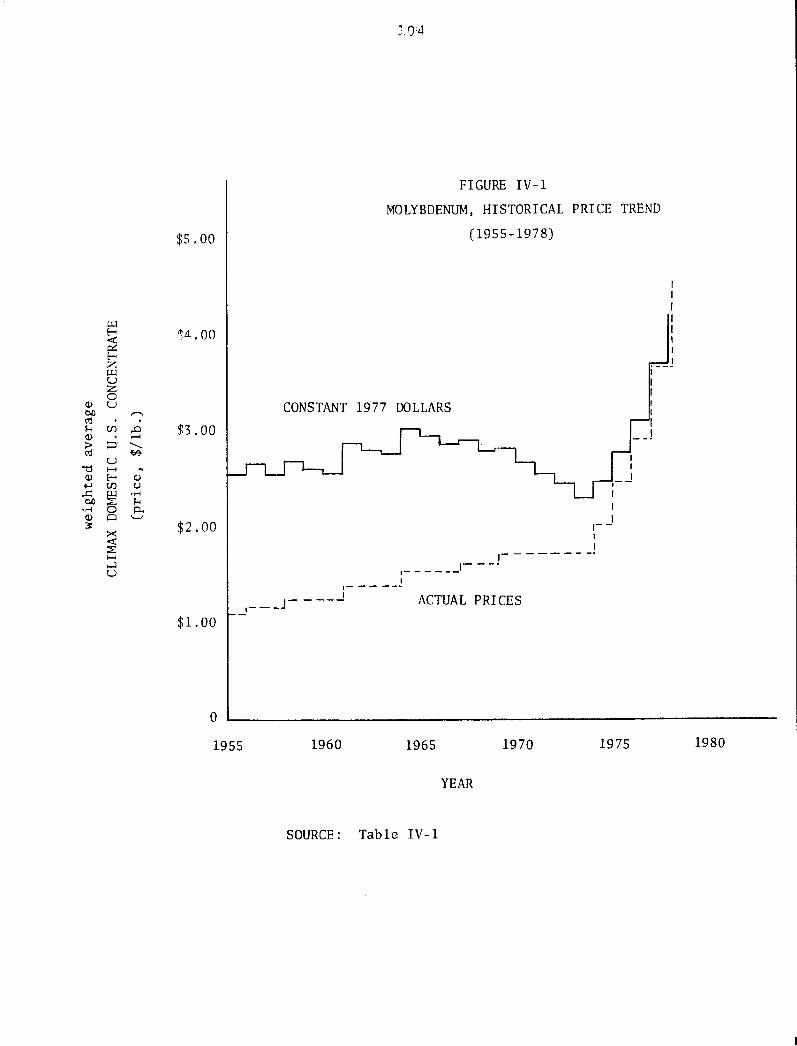
10'4
FIGURE IV-1
MOLYBDENUM, HISTORICAL PRICE TREND
$5.00 (1955-1978)
j ! ACTUAL PRICES $1.00
0 I . ,
1955 I960 1965 1970 1975 1980
YEAR
SOURCE: Table IV-1

105
metal th a t p e r s i s t e d u n t i l the e a r l y 1970's (see Table IV-2). In 1971 and 1972 spot market p r i c e s a c t u a l l y f e l l below publis h e d Climax p r i c e s . Industry p r o f i t s s u f f e r e d and there were production cutbacks and c l o s u r e s .
B r i t i s h Columbia was hard h i t i n t h i s p e r i o d , w i t h the Boss Mountain and Coxey mines c l o s i n g i n 1971, followed by K i t s a u l t i n 1972; P l a c e r Development cut back production a t Endako at t h i s time.
By 1973 consumption was r i s i n g r a p i d l y again and i n 1974 the t r a d i t i o n a l p r i c e s t a b i l i t y of the metal had s t a r t e d to break down. AMAX (which had taken over marketing f o r Climax) began announcing more frequent and s u b s t a n t i a l p r i c e i n c r e a s e s . The company's p r i c i n g l e a d e r s h i p continued, however, wi t h other major producers matching Climax changes c l o s e l y .
Industry stocks have been f a l l i n g s t e a d i l y since 1973, w i t h western world consumption of the metal being g r e a t e r than supply i n every year since then. U.S. General Services A d m i n i s t r a t i o n s t o c k p i l e r e l e a s e s cushioned the supply s h o r t f a l l , but these slowed to a t r i c k l e i n 1977 and the s t o c k p i l e was exhausted by 1978.
4.1.2 Recent Trends
In 1977 the supply t i g h t n e s s i n the western world was aggravated when the U.S. began i n - d i r e c t exports of molybdenum to the S o v i e t

TABLE IV - 2
WESTERN WORLD SUPPLY/DEMAND BALANCE (1000 m e t r i c t o n s )
69 70 71 72 73 74 75 76 7 7 78
Mine P r o d u c t i o n 67 78 74 74 72 75 74 78 82 85
Co n s u m p t i o n 64 66 59 67 82 94 76 80 83 88
U.S. I n d u s t r y s t o c k s 14 19 29 36 24 21 18 15 13 12 (Dec. 31)
U.S. S t o c k p i l e R e l e a s e s 1.3 2.2 0.2 * 2.6 15.9 2.0 0.7 *
* L e s s t h a n 0.1
S o u r c e s : P r o d u c t i o n & C o n s u m p t i o n , AMAX from EM&J A n n u a l Reviews S t o c k s & S t o c k p i l e R e l e a s e s , U.S. B u r e a u o f M i n e s .

107
Union. In a d d i t i o n , c o n s t r u c t i o n of the T r a n s - S i b e r i a n p i p e l i n e s i g n i f i c a n t l y increased demand f o r the metal i n W. Europe and Japan where the pipe was manufactured. By the middle of the year U.S. s t e e l producers, alarmed by c o n t i n u i n g shortages of molybdenum, p e t i t i o n e d the Department of Commerce through the American Iron and S t e e l I n s t i t u t e (AISI) to monitor exports and e v e n t u a l l y l i c e n s e and c o n t r o l them. No such a c t i o n was taken by the U.S. Government. Demand remained strong i n 1978, p a r t i c u l a r l y f o r s p e c i a l t y and s t a i n l e s s s t e e l a p p l i c a t i o n s . Production increased during the year, but growth was l i m i t e d when poor markets forced cut-backs on by-product producers i n the United States. Other f a c t o r s l i m i t i n g supply were s t r i k e s at the Questa mine i n N. Mexico, and G i b r a l t a r and Gaspe i n Canada, a s l i d e at the Questa mine and power shortages at AMAX's Langeloth r o a s t i n g f a c i l i t i e s .
In response to the strong world-wide demand shown i n 1978, other molybdenum producers s t a r t e d to i n i t i a t e p r i c e i n c reases independent of Climax p r i c e changes and to post p r i c e s i n excess of the Climax l e v e l . In A p r i l 1978 Noranda hiked i t s export p r i c e s by 15% and "stunned the i n d u s t r y ... because i t so q u i c k l y f o l l o w e d the i n d u s t r y ' s 10% increase i n March" ^. L a t e r i n the year Duval jumped the gun on Climax again and posted a 15% in c r e a s e on i t s products.

109
Spot market p r i c e s began to move away from producer p r i c e s i n mid-1978. Figure IV-2 shows the dramatic p r i c e changes that occurred from the f a l l of 1978 to the summer of 1979. Molybdic oxide i s p r o f i l e d and both contract and spot p r i c e s are a v a i l a b l e because i t i s the most widely traded form of molybdenum.
In January of 1978 spot oxide p r i c e s showed a 26% premium on Climax export p r i c e s . This had increased to 77% by May of that year and 174% by December.
In 1979 an already t i g h t supply s i t u a t i o n was aggravated by a co l d winter i n the United States which caused a 10-15% cutback i n Climax shipments to Europe and Japan. Then, on February 15, workers struck at Placer Development's Endako mine, the world's fourth l a r g e s t producer. In the int e r v e n i n g months molybdenum markets underwent fundamental changes. Spot market sales increased g r e a t l y , as consumers, f e a r i n g f u r t h e r shortages had to look past the t r a d i t i o n a l long-term contract and producer p r i c e system i n order to f i n d s u pplies. As a r e s u l t , spot market p r i c e s soared, peaking at $32.50 U.S. i n June 1979 and since then f a l l i n g to about $15 at the time of w r i t i n g .
Producer p r i c i n g a l s o underwent s i g n i f i c a n t changes. As a r e s u l t of the Carter administration's c o n t r o l of domestic p r i c e s through the c o u n c i l on wage and p r i c e s t a b i l i t y , p r i c i n g by American producers i s two-tiered with domestic and export p r i c e s quoted.

110
Export p r i c e s began to diverge s i g n i f i c a n t l y from U.S. domestic p r i c e s when Kennecott hiked i t s export p r i c e 105% from $5.70 to $11.70 U.S. per l b . c . i . f . Japan. Since then other major U.S. producers have followed t h i s p a t t e r n . Climax, f o r example, hiked i t s domestic oxide p r i c e from $4.76 U.S./lb. i n J u l y of 1978 to $5.80 U.S. i n J u l y of 1979, while the export p r i c e went from $5.08 to $9.54 i n the same period (see Table IV-3) Climax p r i c e s have a c t u a l l y not shown the increases of other companies however; Climax has continued i t s t r a d i t i o n a l tendency of p r o t e c t i n g i t s market share rather than r a i s i n g p r i c e s to l e v e l s the market w i l l bear. In c o n t r a s t , Kennecott r a i s e d i t s export oxide p r i c e to $24.00 i n J u l y 1979.
4.1.3 Summary
Molybdenum marketing has changed d r a s t i c a l l y i n the past 2 years; spot market sales have increased as a proportion of t o t a l sales of the metal and spot p r i c e s have r i s e n to i n c r e d i b l e heights. Producer or contract sales have decreased i n importance and p r i c e s t a b i l i t y , a previous c h a r a c t e r i s t i c of the molybdenum producer p r i c i n g system, has given way to ever i n c r e a s i n g p r i c e s . Climax, the h i s t o r i c a l p r i c e leader, has r e s i s t e d matching the p r i c e increases of the spot market but some producers, l i k e Kennecott, have set t h e i r producer p r i c e at high l e v e l s i n an attempt to "cash-in" on the buoyant market. Climax i s not the current p r i c e -s e t t e r i n the export market, other companies are authoring both the timing and scale of p r i c e changes.
I l l
4.2 Current Market S t r u c t u r e
4.2.1 Japan
Molybdenum was i n short supply i n Japan, and t h i s shortage was i n t e n s i f i e d i n 1979 as the Endako s t r i k e progressed. Endako accounts f o r about 40 percent of Japan's imports. Japanese consumers were forced to buy from the spot market (or grey market as i t i s known i n Japan), and t h i s was a f a c t o r i n the skyrocketing spot p r i c e .
Demand f o r molybdenum i n Japan has increased i n both m e t a l l u r g i c a l and chemical a p p l i c a t i o n s . Japan's s p e c i a l t y s t e e l i n d u s t r y i s growing at near-boom l e v e l s .
D i r e c t s a l e s to Japanese steelmakers by North and South American producers have increased i n recent years and c u r r e n t l y c o n s t i t u t e s 30 - 40% of s a l e s .
4.2.2 Soviet Bloc
S o v i e t and Eastern European imports have increased through both d i r e c t trade w i t h producing c o u n t r i e s l i k e the United States and increased purchases on the spot market. The U.S.S.R. began buying on the spot market a f t e r China stopped s e l l i n g to i t and
2 these purchases have accentuated the world-wide shortage.

112
Table IV-3
Recent Trends i n Producer and Spot P r i c e s ($U.S./lb. molybdic oxide)
Month Climax Domestic
C1imax Export
Duval Export
Kennco Export
Noranda Export
Codelco Export
Spot Market
1978 Feb 4.31 4.60 4.60 6.30- 6.40
Mar 4.76 5.08 5.08 5.08 4.96 5.08 5.75- 6.85
Apr ii tt it it 5.83 it 6.85- 7.80
May it ti it tt tt 5.80 8.00- 9.00
Jun II it tt ti it tt 8.25- 8.50
J u l ti ti it it tt it 8.25- 8.50
Aug it it it tt it it 8.00- 8.50
Sep 5.30 5.70 5.85 5.70 it ti 9.00- 9.50
Oct II it n I I it it 11.80-14.25
Nov it it it tt tt tt 15.00-16.50
Dec ti 6.56 6.94 tt 6.89 tt 16.50-18.00
1979 Jan 5.55 it it 11.70 it 6.85 17.00-20.00
Feb it it it tt tt tt 21.50-22.00
Mar 5.67 it 7.64 ti 7.94 8.91 22.00-23.00
Apr ti 7.54 it 15.00 tt tt 23.00-26.50
May it ti 9.64 it 10.00 tt 26.50-29.75
Jun ti 9.54 tt it ft tt 28.00-32.50
J u l 5.80 it 11.34 24.00 11.56 11.59 21.00-27.00
Aug n ti ti tt tt tt 23.00-29.00
Sources: Metals Week,. Tex Report export p r i c e s c . i . f . Japan or Europe

113
4.2.3 U.S.A.
Domestic producers of s p e c i a l t y s t e e l s , and other consumers who normally r e l y on short-term purchases of molybdenum on the spot market f o r t h e i r s u p p l i e s , have been h a r d - h i t by e s c a l a t i n g world p r i c e s . While domestic producer p r i c e s have remained r e l a t i v e l y s t a b l e , only the l a r g e i n t e g r a t e d s t e e l companies and others w i t h long-term supply c o n t r a c t s are fort u n a t e enough to pay these p r i c e s . Thus, despite a massive American trade surplus i n the metal, many U.S. consumers have had to s u f f e r short supply at domestic p r i c e s and high p r i c e s f o r a d d i t i o n a l s u p p l i e s . Some s p e c i a l t y s t e e l makers i n the U.S. have been charging 5 to 10 cents per pound surcharge f o r each percent of contained molybdenum
3 i n s t e e l produced
Even major s t e e l producers w i t h long-term c o n t r a c t s had to tu r n to the spot market i n 1979 f o r 10 to 30 percent of t h e i r s u p p l i e s . There has been growing d i s s a t i s f a c t i o n among such producers concerning the shortage of molybdenum e s p e c i a l l y i n l i g h t of the scal e of U.S. exports of the metal. Although p r o t e s t s have been made to the Department of Commerce, no a c t i o n to c o n t r o l exports of the metal has been taken.
4.2.4 Europe
Europe f e l t the molybdenum shortage l a t e r than other areas, but i t s s c a l e i s now s i m i l a r to that i n Japan. Despite the high cost of
114
the metal, s p e c i a l t y and t o o l s t e e l producers i n Europe have t r i e d to hold t h e i r p r i c e s f o r moly-bearing grades near pre-shortage l e v e l s by ta k i n g lower p r o f i t s or reducing output of moly-bearing grades, r a t h e r than p r i c e themselves out of hard-won s t e e l export markets.
4.2.5 Canada
Despite the work-stoppage a t t h e i r Endako mine, P l a c e r Development was able to meet over 90 percent of i t s s a l e s commitments f o r the f i r s t four months of the s t r i k e . However, once i n v e n t o r i e s were used up the company could guarantee only 35 percent of shipments r e q u i r e d , the l e v e l at which the mine can be operated by management. This s t r i k e terminated i n e a r l y November 1979 and the mine has returned to normal output of molybdenum. P l a c e r has been s u c c e s s f u l i n a t t r a c t i n g r i c h p r i c e s f o r output from i t s G i b r a l t a r mine by s e l l i n g i t by open tender. Tender p r i c e s reached $30.00 U.S. • T ' 4 i n June
Noranda s a l e s , r e s p o n s i b l e f o r marketing the output of the Boss Mountain and Brenda Mines i n BC, has r e s i s t e d the Kennecott-scale p r i c e increases but has p r i c e d molybdic oxide $2.00 U.S. above Climax p r i c e s , at l e v e l s comparable to Duval.
Lornex has been able to b e n e f i t from spot market p r i c e s by s e l l i n g to P h i l l i p Bros., a metal brokerage f i r m .

115
On the demand side i n Canada, shortages are s i m i l a r to those i n the United S t a t e s . Since the beginning of the t i g h t domestic supply s i t u a t i o n Canadian molybdenum producers, i n cooperation wi t h Industry, Trade and Commerce and Energy, Mines and Resources, have been op e r a t i n g a v o l u n t a r y supply a l l o c a t i o n to ensure t h a t the needs of the Canadian s t e e l i n d u s t r y are more e q u i t a b l y shared by a l l Canadian producers. Despite t h i s move, Canadian molybdenum has been i n extremely short supply, e s p e c i a l l y s i n c e the s t r i k e at Endako, and Canadian steelmakers are i n c r e a s i n g l y unhappy about
. . 5
supply a v a i l a b i l i t y
4 . 3 P r o j e c t e d Supply
4.3.1 BC Supply
B r i t i s h Columbia molybdenum supply has been p r o j e c t e d on the b a s i s of estimated s t a r t u p dates f o r committed and probable p r o j e c t s , and on the p r o j e c t e d output from e x i s t i n g producers, t a k i n g planned and probable expansion i n t o account. Prospect p r o j e c t i o n s are based on the d i s c u s s i o n s i n S e c t i o n I I I above on BC molybdenum d e p o s i t s .
Table IV-4 P r o j e c t e d B r i t i s h Columbia Molybdenum Supply
(1 000 m e t r i c tons contained Mo)
1979 1980 1981 1982 1983 1984 1985 1985-90 10.1 14.9 14.5 17.2 19.1 20.9 22.7 29.0

116
4.3.2 Non-Communist World Supply
Non-Communist world molybdenum production to 1995 has been estimated by t o t a l l i n g the committed, planned and i n d i c a t e d expansion at e x i s t i n g mines and prospects. A l i s t of prospects, w i t h t h e i r expected s t a r t u p dates and c a p a c i t y was made, and these c a p a c i t y increments and a d d i t i o n s aggregated to produce p r o j e c t i o n s by country and/or re g i o n . The raw t a b l e s appear i n Appendix I I I (Tables A-3 to A-6). Table IV-5 l i s t s major prospects w i t h d e t a i l s of reserves, c a p a c i t y , investment, e t c .
Non-communist world supply p r o j e c t i o n s , based on the prospects l i s t e d i n Table IV-5 and production increments a t e x i s t i n g mines, i s shown i n Table IV-6, P r o j e c t i o n I . This p r o j e c t i o n should be i n t e r p r e t e d as a maximum, since o n l y 5 percent has been taken o f f the t o t a l to take account of p r o d u c t i o n - l i m i t i n g f a c t o r s and delays i n development. Four other supply p r o j e c t i o n s are l i s t e d f o r comparative purposes. A l l p r o j e c t i o n s except IV are dependent on present c o n d i t i o n s and i n f o r m a t i o n - i t would thus be unwise to place much weight on p r o j e c t i o n s past 1985.
The United States w i l l continue i t s dominance of supply i n t o the l a t e 1980's w i t h continued output from major producers and the a d d i t i o n of new c a p a c i t y . Canada should maintain a roughly 16 percent share of non-communist world output, though production w i l l not begin to increase u n t i l 1982. Further labour problems a t Canadian mines could continue to s t a l l the growth i n production.

117
South American production w i l l i ncrease l a r g e l y on the weight of expanded c a p a c i t y at Codelco's C h i l e a n copper mines. Copper markets are p r o j e c t e d to improve by 1981-83 w i t h world consumption
7
of copper to s t a b i l i z e a t about 4% growth per year a f t e r t h a t This should help by-product producers throughout the world, w i t h C h i l e one of the main b e n e f i c i a r i e s .
Other c o u n t r i e s w i l l i ncrease t h e i r share of world output by the l a t e 1980's, mainly through the development of l a r g e by-product copper-molybdenum porphyries.
Growth r a t e s i m p l i c i t i n the f i v e p r o j e c t i o n s shown are compared i n Table IV-1. P r o j e c t i o n IV, a l i n e a r r e g r e s s i o n trend l i n e based on non-communist world output f o r 1958-78, y i e l d s the lowest r a t e s . Given the massive r e a l p r i c e increases of the past year and c o n d i t i o n s of short supply over the past s i x years, growth i n supply w i l l almost c e r t a i n l y exceed t h i s estimate. P r o j e c t i o n I I by P l a c e r Development i s somewhat p e s s i m i s t i c about c e r t a i n prospects, but may be a good "low estimate" of supply growth. P r o j e c t i o n I I I i s q u i t e o p t i m i s t i c and should thus be considered a "high estimate". P r o j e c t i o n I may be a b e t t e r high estimate, however, since i t i s a l i t t l e more r e a l i s t i c but s t i l l b i a s e d upward.
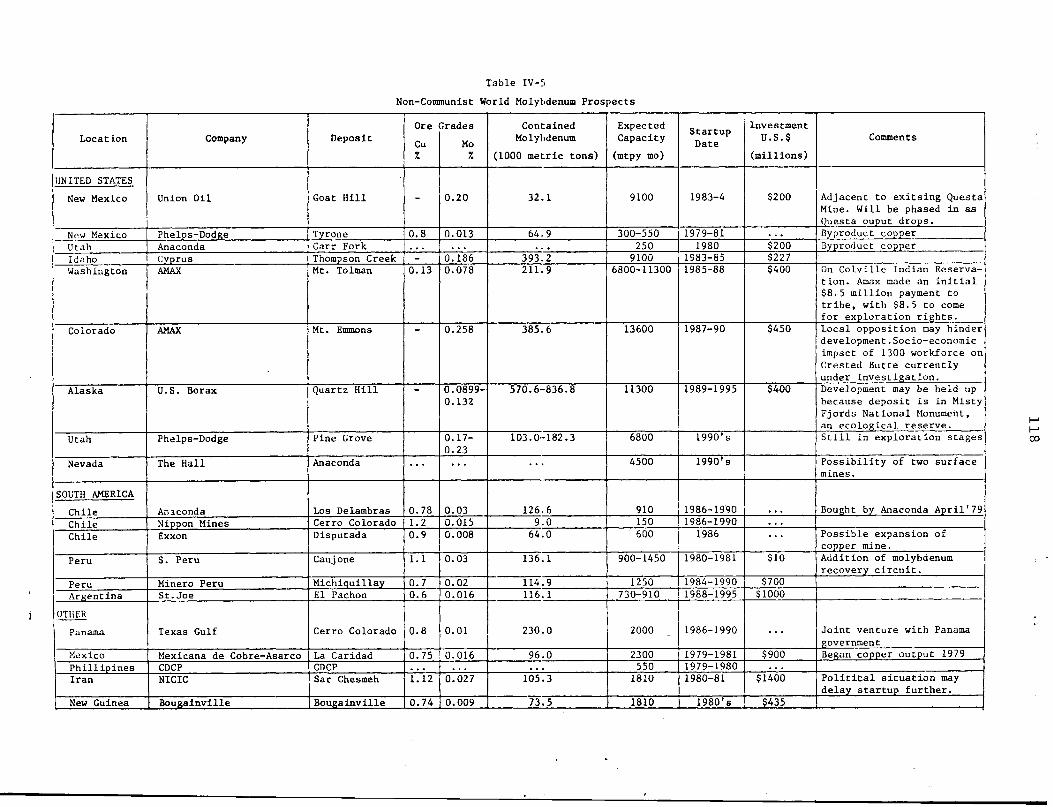
Table IV-5 Non-Communist World Molybdenum Prospects
Locat ion Company Deposit Ore Cu %
trades Mo %
Contained Molybdenum
(1000 metric tons)
Expected Capacity (mtpy mo)
Startup Date
Investment U.S.$
(millions) Comments
UNITED STATES New Mexico Union O i l Goat H i l l - 0.20 32.1 9100 1983-4 $200 Adjacent to exitsing Questa
Mine. W i l l be phased in as Questa ouput drops.
New Mexico Phelps-Dodge Tyrone 0.8 0.013 64.9 300-550 1979-81 Byproduct copper Utah Anaconda Carr Fork 250 1980 $200 Byproduct copper Idaho Cyprus Thompson Creek - 0.186 393.2 9100 1983-85 $227 Washington AMAX Mt. Tolman 0.13 0.078 211.9 6800-11300 1985-88 $400 On C o l v i l l e Indian Reserva
tion. Amax made an i n i t i a l $8.5 m i l l i o n payment to trib e , with $8.5 to come for exploration rights.
Colorado AMAX Mt. Emmons 0.258 385.6 13600 1987-90 $450 Local opposition may hinder development.Socio-economic impact of 1300 workforce on Crested Butte currently under investigation.
Alaska U.S. Borax Quartz H i l l 0.0899¬0.132
570.6-836.8 11300 1989-1995 $400 Development may be held up because deposit i s in Misty Fjords National Monument, an ecological reserve.
Utah Phelps-Dodge Pine Grove 0.17¬0.23
103.0-182.3 6800 1990's S t i l l i n exploration stages
Nevada The H a l l Anaconda 4500 1990's P o s s i b i l i t y of two surface mines.
SOUTH AMERICA Chile Anaconda Los Delambras 0.78 0.03 126.6 910 1986-1990 Bought by Anaconda April'79 Chile Nippon Mines Cerro Colorado 1.2 0.015 9.0 150 1986-1990 Chile Exxon Disputada 0.9 0.008 64.0 600 1986 Possible expansion of
copper mine. Peru S. Peru Caujone 1.1 0.03 136.1 900-1450 1980-1981 $10 Addition of molybdenum
recovery c i r c u i t . Peru Minero Peru Michiquillay 0.7 0.02 114.9 1250 1984-1990 $700 Argentina St.Joe El Pachon 0.6 0.016 116.1 730-910 1988-1995 $1000
OTHER Panama Texas Gulf Cerro Colorado 0-8 0.01 230.0 2000 1986-1990 ... Joint venture with Panama
government Mexico Mexicana de Cobre-Asarco La Caridad 0.75 0.016 96.0 2300 1979-1981 $900 Began copper output 1979 P h i l l i p i n e s CDCP CDCP ... ... 550 1979-1980 Iran NICIC Sar Chesmeh 1.12 0.027 105.3 1810 1980-81 $1400 P o l i t i c a l s i t u a t i o n may
delay startup further. New Guinea Bougainville Bougainville 0.74 0.009 73.5 1810 1980's $435

119 Table IV - 6
(1 000 metric tons contained Mo)
Projection I: 1978 1 1979 1980 1981 1982 1983 1984 1985 1986-90
("1988") 1991-95 ("1993")
Canada 13.9 11.3 16.0 15.8 18.8 20.4 22.0 23.6 29.9 38.4
U.S.A. 59.8 66.2 70.3 72.7 74.6 81.9 84.6 91.2 115.8 140.7
South America 13.4 13.5 14.0 15.0 15.5 16.7 18.6 20.3 25.2 26.6
Others 0.7 0.9 3.2 7.3 11.3 14.3 14.3 14.3 18.3 33.3
To t a l 87.8 91.9 103.5 110.8 120.2 133.3 139.5 149.4 189.2 239.0
Less 5%* 87.3 98.3 105.3 114.2 126.6 132.5 141.9 179.7 227.1
(1986- 90) 2
Proj e c t i o n II 86.4 98.0 106.5 110.5 116.1 119.4 128.0 130.5 - 137.2 3
Projection III 93.0 99.8 111.6 122.0 138.3 140.2 152.0 -4
Proj e c t i o n IV 92.2 95.4 98.7 102.0 105.3 108.5 111.8 115.1 - 128.2
Proj ection V~* 1
98.6
Actual
104.8
data
(1985 = 137.2- 166.5)
2 Placer Development, June, 1979
Japanese Marketing Report
Trend-Line Projections based on data from 1958-1978 (simple l i n e a r regression)
Energy, Mines & Resources, Molybdenum preprint 1977
For losses, s t r i k e s , etc. - t h i s i s Projection I
Proj e c t i o n I Pro j e c t i o n II Proj e c t i o n I I I Projection IV Projection V
Table IV - 7 Comparison of Pro j e c t i o n Growth Rates
(growth rates i n percent) 1978-1985 1985-1988
7.1 5.5 8.2 3.3 7.9
8.2 1.8
2.9
1988-1993 4.8
2.6

220
Forecast*
Non-communist world supply i s p r o j e c t e d to increase at a r a t e of between 5.5 to 7.1 percent to 1985.
4 . 4 P r o j e c t e d Demand
4 . 4 . 1 Demand E l a s t i c i t y S u b s t i t u t i o n
I t was o r i g i n a l l y thought by molybdenum producers th a t p r i c e s of $8 to $10 a pound f o r molybdic oxide would be enough to s t a r t s u b s t i t u t i o n of the metal at wholesale l e v e l s . S u b s t i t u t i o n has taken place i n l a r g e diameter pipe although demand has remained strong i n s p e c i a l t y s t e e l s . The short run demand curve f o r molybdenum has proved to be p r i c e - i n e l a s t i c ( i n these areas) -demand has continued to grow as p r i c e s have r i s e n .
4 . 4 . 2 Expanded end-use a p p l i c a t i o n s
As the energy c r i s e s continues, so w i l l the demand f o r molybdenum. The unique p r o p e r t i e s of the metal that combine strength w i t h r e s i s t a n c e to the elements have h i s t o r i c a l l y broadened i t s
I t would be misleading to extend a p r o j e c t i o n past 1985 since p r i c e s , technology, e t c . may change c o n d i t i o n s g r e a t l y . Since mine development u s u a l l y takes a t l e a s t s i x years from "coming p u b l i c " w i t h a deposit, 1985 i s seen as " w i t h i n the s i g h t s " of f o r e c a s t s .
121
a p p l i c a t i o n s . The need f o r these p r o p e r t i e s i n i n d u s t r i e s which i n v o l v e the s y n t h e s i s , a c q u i s i t i o n and consumption of energy w i l l continue to broaden i t s demand.
In the automotive i n d u s t r y , f o r example, the need f o r s t e e l s that combine l i g h t n e s s w i t h s t r e n g t h w i l l increase w i t h g a s o l i n e mileage requirements. O i l and gas p i p e l i n e s , consuming l a r g e q u a n t i t i e s of the metal i n t h e i r c o n s t r u c t i o n , w i l l be s t r e t c h e d to more remote areas as the p r i c e of energy r i s e s . Energy e x p l o r a t i o n e f f o r t s w i l l i n c r e a s e , and w i l l be r e f l e c t e d i n demand f o r d r i l l b i t s and c o r r o s i v e - r e s i s t a n t casing consumed i n such e x p l o r a t i o n . The need f o r s u p e r a l l o y s that can t o l e r a t e high temperatures w i l l continue as t u r b i n e s and r e a c t o r s are b u i l t f o r e f f i c i e n c y and s a f e t y . In the chemical market, molybdenum c a t a l y s t s are consumed at i n c r e a s i n g r a t e s w i t h decreasing q u a l i t y of crude petroleum and are f i n d i n g new a p p l i c a t i o n s i n c o a l l i q u i f i c a t i o n and g a s i f i c a t i o n ; these areas could become very important i f North American pledges of energy s e l f - s u f f i c i e n c y
o
are to be r e a l i z e d . The worldwide increase i n r a i l t r a f f i c a s s o c i a t e d w i t h c o a l and ore h a u l i n g has created a demand f o r stronger and more w e a r - r e s i s t a n t s t e e l s . A new molybdenum-chromium r a i l has been developed w i t h an experimental l i f e 60-100% g r e a t e r than standard carbon s t e e l r a i l s . I n i t i a l
9 production of such r a i l s has begun around the world
One p r o s p e c t i v e a p p l i c a t i o n f o r molybdenum w i t h great p o t e n t i a l has been developed a t the U n i v e r s i t y of BC Physics Department by Dr. R. Haering and o t h e r s . I t i s a b a t t e r y which uses molybdenum

122
d i s u l p h i d e (molybdenum conc e n t r a t e ) , as produced by domestic mines.
A prototype of Dr. Haering's " i n t e r c o l a t i o n " *-type b a t t e r y was developed by Exxon i n 1976 using t i t a n i u m d i s u l p h i d e , and B e l l Labs followed w i t h a vandium d i s u l p h i d e battery."^ I t occurred to Haering to use molybdenum d i s u l p h i d e since i t , u n l i k e the other d i s u l p h i d e s , i s present i n i t s n a t u r a l form and does not have to be made s y n t h e t i c a l l y at great expense. The b a t t e r y design has been patented and research continues.
The most promising feature about the b a t t e r y i s i t s p o t e n t i a l low c a p a c i t y to weight r a t i o n i n comparison to others (see Table IV-8). The p o s s i b i l i t y f o r the use of such a l i g h t w e i g h t b a t t e r y i n e l e c t r i c cars occurs to one immediately. The weight of c u r r e n t e l e c t r i c b a t t e r i e s i s o f t e n a l i m i t i n g f a c t o r , exceeding 1 000 pounds. Another p o s s i b l e a p p l i c a t i o n i s as a l o a d - l e v e l l i n g storage c e l l f o r use by u t i l i t y companies. This can have very a t t r a c t i v e economics f o r u t i l i t i e s , which must provide enough e l e c t r i c a l supply to meet peak demand. BC Hydro has s u b s i d i z e d l a b space f o r the b a t t e r y ' s development i n exchange f o r c e r t a i n r i g h t s r e l a t i n g to t h i s a p p l i c a t i o n .
I n t e r c o l a t i o n i s the process of acceptance or storage of e l e c t r o n s i n gaps i n "sandwich-structure" molecules such as molybdenum and t i t a n i u m d i s u l p h i d e .

123
The e f f e c t s on demand f o r molybdenum of t h i s a p p l i c a t i o n may be staggering i f one considers Haering's estimate of 300 l b s . of molybdenum d i s u l p h i d e r e q u i r e d f o r each e l e c t r i c c a r .
Table IV-8 Performance of Several B a t t e r y Systems
System Capacity (approximate) Watt-Hours/kilogram
Lead-Acid 4 0 Nickel-Cadmium 55 Sodium-Sulphur* 90 - 100
I n t e r c o l a t i o n System 500 i n experimental c e l l s MX2** 100 - 150 a n t i c i p a t e d i n
p r a c t i c a l c e l l s .
* Operates at approximately 4 00 C ** Where M i s a t r a n s i t i o n metal and X i s one of Sulphur,
Selenium or Delurium Source: Dr. R. Haering, U n i v e r s i t y of B r i t i s h Columbia
Department of P h y s i c s .
Other n o n - m e t a l l u r g i c a l a p p l i c a t i o n s i n c l u d e l u b r i c a n t s , smoke and flame r e t a r d a n t s i n p l a s t i c s , and i n pigments and p a i n t s . A c l o s e d - c i r c u i t water c o o l i n g system c o n t a i n i n g a s o l u b l e molybdenum compound i n i t s c o r r o s i o n i n h i b i t i o n system r e c e i v e d a p r e s t i g i o u s engineering award i n 1978.
In summary, demand f o r the metal i s expected to develop and
broaden as f u r t h e r a p p l i c a t i o n s are found.
124
4.4.3 Forecasts
The major growth area f o r molybdenum consumption i s i n H.S.L.A. s t e e l s - those used i n p i p e l i n e and other t r a n s p o r t a t i o n a p p l i c a t i o n s . P l a c e r Development f o r e c a s t an approximate 6% annual consumption growth r a t e f o r molybdenum i n t h i s a p p l i c a t i o n . Other growth r a t e s to 19 84 are f o r e c a s t as f o l l o w s : (3-5%) s p e c i a l t y and s t a i n l e s s s t e e l , (10-15%) c a t a l y s t a p p l i c a t i o n s , (2-3%) carbon s t e e l s and cas t i r o n s , and (4-6%) t o o l s t e e l s . P l a c e r a r r i v e d a t an o v e r - a l l consumption growth r a t e f o r the non-communist world of 5.5 - 6% to 1985 (see Appendix Table A-l) .
AMAX's demand-growth p r e d i c t i o n of 6 percent y e a r l y i s comparable wi t h P l a c e r ' s . AMAX s t r e s s e s the continued demand f o r molybdenum i n Eastern Europe, which i s estimated at 6800-9100 me t r i c tonnes per year ( d i r e c t demand - not i n c l u d i n g imports of molybdenum-bearing s t e e l s ) .
A l i n e a r r e g r e s s i o n using non-communist world comsumption data a v a i l a b l e (1966-78) p r e d i c t s a 3.7% growth r a t e i n consumption to 1985. This i s used as the "low estimate" w i t h AMAX and Pl a c e r p r e d i c t i o n s the "high estimate" growth r a t e s . Non-communist world consumption i s p r o j e c t e d to 1985 below on the bas i s of t h i s range of growth r a t e s .
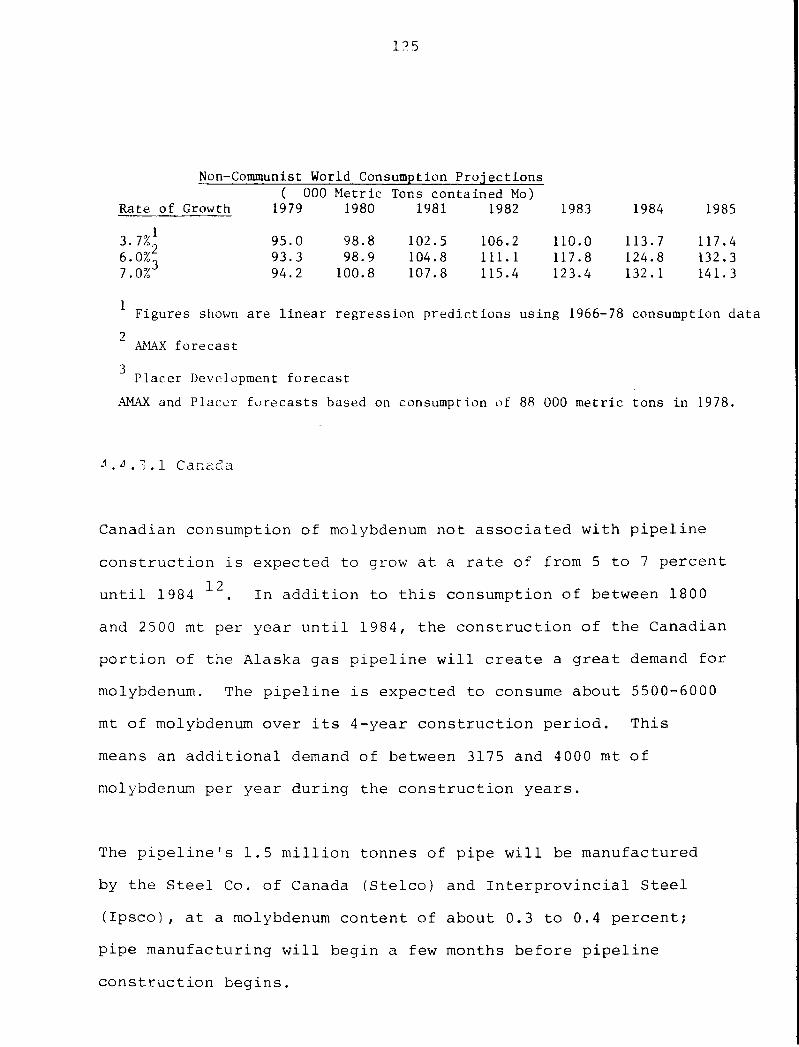
1?5
1979 1980 1981 1982 1983 1984 1985
95.0 98.8 102.5 106.2 110.0 113.7 117.4 93.3 98.9 104.8 111.1 117.8 124.8 132.3 94.2 100.8 107.8 115.4 123.4 132.1 141.3
Non-Communist World Consumption Projections ( 000 Metric Tons contained Mo)
Rate of Growth
3.7%* 6.0%^ 7.0%
* Figures shown are l i n e a r regression predictions using 1966-78 consumption data 2 AMAX forecast
Placer Development forecast AMAX and Placer forecasts based on consumption of 88 000 metric tons i n 1978.
^.^.3.1 C a n a d a
Canadian consumption of molybdenum not as s o c i a t e d w i t h p i p e l i n e c o n s t r u c t i o n i s expected to grow at a rate of from 5 to 7 percent
12
u n t i l 1984 . In a d d i t i o n to t h i s consumption of between 1800 and 2500 mt per year u n t i l 1984, the c o n s t r u c t i o n of the Canadian p o r t i o n of the Alaska gas p i p e l i n e w i l l c r eate a great demand f o r molybdenum. The p i p e l i n e i s expected to consume about 5500-6000
mt of molybdenum over i t s 4-year c o n s t r u c t i o n p e r i o d . This means an a d d i t i o n a l demand of between 3175 and 4000 mt of molybdenum per year during the c o n s t r u c t i o n years.
The p i p e l i n e ' s 1.5 m i l l i o n tonnes of pipe w i l l be manufactured by the S t e e l Co. of Canada (Stelco) and I n t e r p r o v i n c i a l S t e e l (Ipsco), at a molybdenum content of about 0.3 to 0.4 percent; pipe manufacturing w i l l begin a few months before p i p e l i n e c o n s t r u c t i o n begins.

126
I f the N a t i o n a l Energy Board (NEB) a u t h o r i z e s f u r t h e r s a l e s of n a t u r a l gas to the United States from Canada, s o - c a l l e d " p r e - b u i l d i n g " w i l l occur and c o n s t r u c t i o n w i l l l i k e l y s t a r t i n l a t e 1980. With these a d d i t i o n a l s a l e s of gas to the U.S., f u r t h e r t r u n k l i n e systems r e q u i r e d to t r a n s p o r t the gas to the main l i n e w i l l be necessary and molybdenum demand w i l l i n crease by perhaps 200 mt per year. I f the NEB r u l e s a g a i n s t e x t r a s a l e s , c o n s t r u c t i o n w i l l l i k e l y not s t a r t u n t i l mid-1981 and t h i s
13 a d d i t i o n a l molybdenum demand w i l l not occur
Despite the hurdles i n the way of i t s development, the Alaska gas p i p e l i n e i s a p r i o r i t y of the C a r t e r a d m i n i s t r a t i o n and w i l l very l i k e l y be s t a r t e d by 1981 at the l a t e s t . The p r e - b u i l d i n g question may have an e f f e c t on i t s t i m i n g , however.
4.5 Supply/Demand Balance and P r i c e s
4.5.1 Non-Communist World
A number of d i f f e r e n t supply/demand scenarios are developed below on the b a s i s of the v a r i o u s p r o j e c t i o n s reached above, and the r e s u l t s examined.
4.5.1.1 Low Supply, High Demand
I f we assume that the slowest supply growth p r o j e c t i o n from Table IV-6 and the high demand growth p r o j e c t i o n from Table IV-9 are c o r r e c t , we must adopt :
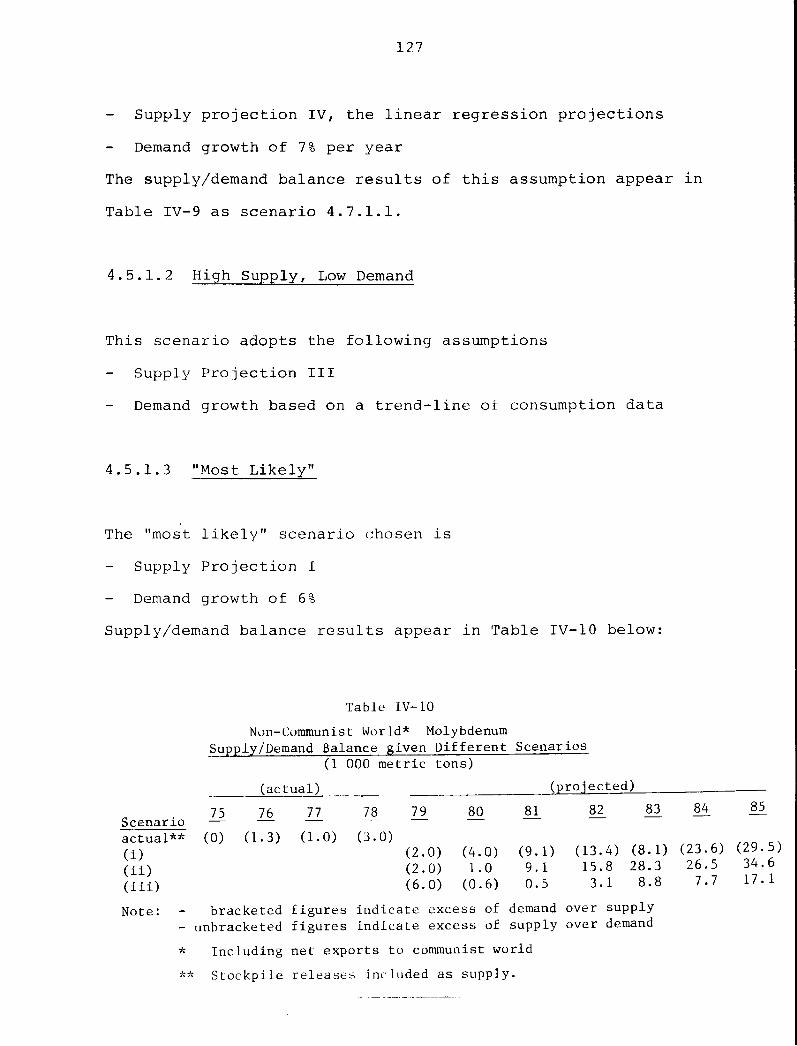
127
Supply p r o j e c t i o n IV, the l i n e a r r e g r e s s i o n p r o j e c t i o n s Demand growth of 7% per year
The supply/demand balance r e s u l t s of t h i s assumption appear i n Table IV-9 as scenario 4.7.1.1.
4.5.1.2 High Supply, Low Demand
This scenario adopts the f o l l o w i n g assumptions Supply P r o j e c t i o n I I I Demand growth based on a t r e n d - l i n e of consumption data
4.5.1.3 "Most L i k e l y "
The "most l i k e l y " scenario chosen i s Supply P r o j e c t i o n I Demand growth of 6%
Supply/demand balance r e s u l t s appear i n Table IV-10 below:
Table IV-10 Non-Communist World* Molybdenum
Supply/Demand Balance given D i f f e r e n t Scenarios (1 000 metric tons)
(actual) (projected) 75 76 77 78 79 80 81 82 83 84 85
(2.0) (4.0) (9.1) (13.4) (8.1) (23.6) (29.5) (2.0) 1.0 9.1 15.8 28.3 26.5 34.6 (6.0) (0.6) 0.5 3.1 8.8 7.7 17.1
Scenario a c t u a l * * (0) (1.3) (1.0) (3.0) (i) ( i i ) ( i i i ) Note: - bracketed figures indicate excess of demand over supply
- unbracketed figures indicate excess of supply over demand * Including net exports to communist world ** Stockpile releases included as supply.

128
Scenarios 4.7.1.1 and 4.7.1.2 produce huge shortages and d e f i c i t s by 1985 r e s p e c t i v e l y .
"Most l i k e l y " scenario 4.7.1.3 appears r e a l i s t i c because strong demand f o r the metal has been demonstrated, along w i t h r e c e n t l y increased p r i c e s that should create the i n c e n t i v e to b r i n g new mines i n t o production.* According to t h i s p r o j e c t i o n , supply and demand should balance by 1981, w i t h the c u r r e n t shortage s i t u a t i o n easing o f f by 1983. I f t h i s i s c o r r e c t , molybdenum p r i c e s , i n constant $'s, should remain strong throughout 1979, l e v e l o f f i n the p e r i o d 1980 to 1982 and begin to f a l l by 1983.
Exports of the metal from non-communist c o u n t r i e s to the Eastern bloc may a f f e c t the p r o j e c t e d over-supply s i t u a t i o n to the p o i n t where the apparent surplus disappears. I t i s d i f f i c u l t to p r e d i c t the e f f e c t s of t h i s market f o r two reasons; f i r s t l y , the exports are o f t e n contained i n f i n i s h e d s t e e l products and, secondly, unforeseen p o l i t i c a l developments may reduce trade i n molybdenum and molybdenum-containing products.
I t must be remembered tha t such a p r o j e c t i o n can i d e n t i f y o nly the "next t u r n " of the c y c l e and nothing past t h i s , since no i n f o r m a t i o n has been introduced to a l l o w an a n a l y s i s of the b a s i s of the c y c l e . Therefore only supply/demand and accompanying p r i c e changes that are a f f e c t e d by today's events can be p r o j e c t e d
129
4 . 6 Overview - Conclusion
The current shortage of molybdenum i s the r e s u l t of an i n t e r a c t i o n between i n c r e a s i n g demand and decreasing supply f o r the metal. Demand has increased due to increases i n p i p e l i n e c o n s t r u c t i o n worldwide and increased s p e c i a l t y s t e e l a p p l i c a t i o n s f o r the metal; simultaneously, supply has been reduced by a number of f a c t o r s i n c l u d i n g s t r i k e s , un-natural c l i m a t i c c o n d i t i o n s and poor copper markets.
The i n d u s t r i a l o r g a n i z a t i o n of the molybdenum i n d u s t r y has been one of h i s t o r i c a l market dominance by the Climax Molybdenum Company, r e s u l t i n g i n p r i c e l e a d e r s h i p , s t a b l e p r i c e s and assumed supply. The i n d u s t r y was not prepared to absorb the j o l t i t r e c e i v e d from shortages i n l a t e 1978 and 1979, as a r e s u l t p r i c e s have skyrocketed and Climax's l e a d e r s h i p broken down.
Capacity w i l l now be increased i n response to c u r r e n t high p r i c e s . Entry i n t o the i n d u s t r y w i l l occur, and the a d d i t i o n s to supply w i l l g r a d u a l l y exert downward pressure on p r i c e s . At t h a t p o i n t , which could be i n the p e r i o d 1985-8, the molybdenum i n d u s t r y may enter a new phase i n which c a p a c i t y i s greater than demand. I t i s d i f f i c u l t to p r e d i c t whether or not molybdenum w i l l then enter i n t o the c y c l i c a l p a t t e r n of over-supply accompanied by d r a s t i c p r i c e r e d u c t i o n which t y p i f y many of the other metals. I t would be most unusual i f t h i s does not occur, since entry i n t o the i n d u s t r y i s not r e s t r i c t e d , p r i c e l e a d e r s h i p i s no longer a dominant f e a t u r e , and molybdenum de p o s i t s are i n t e r n a t i o n a l l y d i s t r i b u t e d .
13°
In the longer term the noted i n t e r l o c k s between molybdenum use and incremental energy s u p p l i e s can be expected to s u s t a i n c o n t i n u i n g demand f o r the metal.

131
S e c t i o n IV - FOOTNOTES
1. Metals Week, A p r i l 14, 1978
2. American Metal Market, J u l y 6, 197 9, molybdenum supplement.
3. i b i d
4. Metals Week, v a r i o u s i s s u e s i n 1979 r e p o r t i n g G i b r a l t a r output tenders.
5. Interviews with Ipsco and S t e l c o Management, F o o t h i l l s P i p e l i n e s L t d .
6. Obtained from Department of Energy, Mines and Petroleum Resources, author unknown.
7. See, f o r p r o j e c t e d copper p r i c e s : U.S. Department of Commerce, 1979 U.S. I n d u s t r i a l Outlook, With P r o j e c t i o n s to 1983 and 2000, January 1979, Wash., D.C.
The World Bank, P r i c e P r o s pects f o r Major Primary Commodities, June 1978, Wash., D.C.
The Economist I n t e l l e g e n c e U n i t L t d . , World Commodity Outlook 78/79 I n d u s t r i a l Raw M a t e r i a l s , November 1978, London.
8. See E l l i n g t o n , R.T., L i q u i d F u e l s from Coal, Academic P r e s s , Inc., Houston, Texas, 1977.
9. Goth, J.W., Amax, "Molybdenum Outlook", E.&M.J., March 1979.
10. See Science, V o l . 192, p. 112G (1976) f o r a r t i c l e on the Exxon b a t t e r y .
11. Goth, J.W., Amax, o p . c i t .
12. Department of Energy, Mines and Resources.
13. F o o t h i l l s P i p e l i n e s L t d . , Interview.
14. More s o p h i s t i c a t e d a n a l y s i s of supply and demand balance f o r metals worldwide i s p o s s i b l e u s i n g econometric models r a t h e r than simple data aggregation, as i s done i n t h i s r e p o r t . See, f o r example,
O n t a r i o , M i n i s t r y of N a t u r a l Resources, M i n e r a l Resources Branch, World M i n e r a l Markets, an Econometric S i m u l a t i o n A n a l y s i s , May, 1979.

13 2
A molybdenum model could be set up using a s i m i l a r format, employing some of the demand-related v a r i a b l e s l i k e energy consumption and p i p e l i n e c o n s t r u c t i o n which were i d e n t i f i e d i n t h i s s e c t i o n . Long-term p r o j e c t i o n s , impossible under the methodology used i n t h i s r e p o r t , have more v a l i d i t y using such an econometric model.
133
FURTHER PROCESSING

135
5. FURTHER PROCESSING
5.1 AREAS OF FURTHER PROCESSING
With the exception of high q u a l i t y molybdenum d i s u l p h i d e concent r a t e which may be d i r e c t l y p u r i f i e d f o r molysulphide l u b r i c a n t production (as Endako plans to do at i t s new l u b r i c a n t grade concentrate p l a n t ) , a l l concentrate must be roasted to o b t a i n molybdic oxide (MoO^) before any end use a p p l i c a t i o n or f u r t h e r processing can take p l a c e . About 75% of end-use consumption i n s t e e l i s i n molybdic oxide, which i s added d i r e c t l y to the s t e e l making furnace. The other 25% i s i n ferromolybdenum which i s a f i n a l a d d i t i o n to the furnace or l a d l e . (See Figure 1-1, above).
Ferromolybdenum i s a l s o used by foundries i n the production of c e r t a i n h i g h - q u a l i t y i r o n a l l o y s where c o n t r o l of molybdenum content i s c r i t i c a l and l o s s e s are important. Usage of f e r r o molybdenum has d e c l i n e d i n favour of oxide.
Technical grade (99.95% pure) oxide i s produced by i n t e n s i v e r o a s t i n g , then i s d e n s i f i e d w i t h water and d r i e d . This product i s c h e m i c a l l y r e f i n e d to produce v a r i o u s forms of molybdates which are used d i r e c t l y by pigment, chemical and c a t a l y s t producers .

136 Pure molybdenum metal i s manufactured by reducing pure molybdic oxide or ammonium molybdate w i t h hydrogen gas. Metal powder i s pressed and s i n t e r e d i n t o small metal ingots f o r conversion i n t o rod, wire or sheet by hot r o l l i n g , swaging or f o r g i n g .
Summary
The vast m a j o r i t y (97%) of molybdenum i s converted i n t o oxide w i t h only a small amount of p u r i f i e d concentrate used i n l u b r i cants (2^ % ) . The oxide i s then used d i r e c t l y i n s t e e l (75%), or converted to ferromolybdenum f o r s i m i l a r m e t a l l u r g i c a l a p p l i c a t i o n s (25%). Chemical a p p l i c a t i o n s use oxide a f t e r conversion to molybdates. Pure metal i s a l s o manufactured from oxide.
5.2 Industry Trends i n Further Processing
Climax (AMAX) i s f u l l y i n t e g r a t e d , w i t h no other producer c l o s e i n conversion c a p a c i t y . Climax i d e n t i f i e d the a b i l i t y to e s t a b l i s h d i r e c t s a l e s contacts w i t h f i n a l consumers, which f u r t h e r processing enables, as an important market s t r a t e g y . At present, the company has r o a s t i n g c a p a c i t y i n Pennsylvania, Iowa, Holland, I t a l y and England. Molybdenum metal i s produced at a p l a n t i n Michigan and l u b r i c a n t - g r a d e molydisulphide at a p l a n t i n Pennsylvani a . Climax thus has a f u l l range of processing f a c i l i t i e s and does not s e l l concentrate.
137 Other U.S. producers have followed Climax's s t r a t e g y . Duval and Kennecott r o a s t the bulk of t h e i r molybdenum production a t the m i n e s i t e . Both companies a l s o produce ferromolybdenum. Molycorp has conversion f a c i l i t i e s a t i t s m i n e s i t e and i n Pennsylvania, and s e l l s only oxide and ferromolybdenum.
In the United States molybdenum i s g e n e r a l l y shipped by r a i l i n concentrate form from the Western States to conversion p l a n t s i n the East and Midwest, the favoured s t r a t e g y i s to have conversion f a c i l i t i e s c l o s e to the market. U.S. exports to Europe are both i n concentrate, f o r conversion i n Climax-owned p l a n t s there, and i n oxide form. Exports to Japan are mainly shipments of oxide or ferromolybdenum.
Smaller U.S. producers s e l l t h e i r output as concentrate to domestic and f o r e i g n firms with conversion c a p a c i t y , or to d e a l e r s .
Chilean exports have h i s t o r i c a l l y been mainly i n concentrate, but t h i s i s changing. Codelco, the state-owned copper g i a n t , has r e c e n t l y acquired r o a s t i n g c a p a c i t y and has used t h i s to gain b e t t e r access to the Japanese market. (Before t h i s c a p a c i t y was a v a i l a b l e , Codelco had an export s w i t c h i n g arrangement w i t h Endako f o r the export of Endako oxide to Japan i n exchange f o r Codelco exports of concentrate to Europe). Molymet of C h i l e a l s o has expanding r o a s t i n g f a c i l i t i e s .

138
In Canada, Endako has moved from 30% conversion of i t s concentrate to oxide when operations began i n 1965 to 100% i n 1978. This was i n response to the industry-wide change i d e n t i f i e d above toward r o a s t i n g by producers r a t h e r than users, which r e s u l t e d i n a more s t a b l e market f o r oxide than f o r concentrates. The wisdom of the move was evident when, during the market slump i n the e a r l y 1970's, P l a c e r was able to move oxides with l e s s d i f f i c u l t y than concentrates.
Noranda, the other Canadian producer, has i d e n t i f i e d the same trend. The company has an agreement wit h Sadacem i n Belgium f o r the r o a s t i n g of concentrate to oxide there and i s searching f o r ways of expanding i t s r o a s t i n g c a p a b i l i t i e s .
Minor by-product producers l i k e Bethlehem s e l l t h e i r concentrate to metal d e a l e r s . Lornex s e l l s i t s output through P h i l l i p Bros, one such d e a l e r , at spot p r i c e s . Some of Lornex 1s concentrates are roasted i n Europe and returned to Canada f o r domestic consumpt i o n .
I s l a n d Copper's molybdenum concentrates are a l l processed i n the United States, where rhenium i s e x t r a c t e d .

139
5v 3 BC Further Processing O p p o r t u n i t i e s
.3.1 Current S i t u a t i o n
Of BC molybdenum shipments i n 1978, 53% were i n concentrate form, 4 6% were as oxide roasted a t Endako and 1% was ferromolybdenum produced by Masterloy i n Ottawa from Endako concentrates.
The only f a c i l i t i e s f o r the processing of molybdenum beyond the concentrate stage i n Canada are the Endako r o a s t e r and r e c e n t l y to be added l u b r i c a n t - g r a d e p l a n t , the Eldorado Gold Roaster and ferromolybdenum p l a n t at Duparquet, Quebec and the Masterloy f e r r o a l l o y p l a n t i n Ottawa. Roasting c a p a c i t y at Endako i s about 7000 metric tonnes per year of contained molybdenum, Duparquet c a p a c i t y i s about 800 m e t r i c tonnes per year. Ferromolybdenum c a p a c i t y i s about 1500 m e t r i c tonnes per year of product at each conversion p l a n t .
Despite t h i s conversion c a p a c i t y which i s e a s i l y adequate f o r domestic needs, Canada imported at l e a s t a t h i r d of molybdenum consumed i n the country i n 1977. (See t a b l e s 1-3 and 1-5.)
140
3.2 O p p o r t u n i t i e s
There i s much room f o r f u r t h e r p
f o r export markets, but the prob
a p p r o p r i a t e and i n what areas of
r o c e s s i n g of Canadian molybdenum
I.em i s t o decide on how much i s
p r o c e s s i n g .
The i n t e r n a t i o n a l t a r i f f s t r u c t u r e (See t a b l e 1-5) favours the ex
p o r t of c o n c e n t r a t e s , s i n c e a l l are accepted f r e e , with the excep
t i o n o f the U n i t e d S t a t e s . Canadian exports of oxide c u r r e n t l y
e n t e r Japan t a r i f f - f r e e - t h a t country changed i t s p o l i c y i n
1976. The EEC has a r e s t r i c t i v e t a r i f f on o x i d e , as does the
Uni t e d S t a t e s . Canada i s p a r t i c u l a r l y p r o t e c t i v e a g a i n s t oxide
imports.
B r i t i s h Columbia and Canada l a g i n the p r o d u c t i o n of oxide probably
as a r e s u l t of the t a r i f f s t r u c t u r e a g a i n s t t h a t product. Despite
the t a r i f f , P l a c e r has been very s u c c e s s f u l i n marketing oxide
d i r e c t l y to Japanese consumers s i n c e a c q u i r i n g adequate r o a s t i n g
c a p a c i t i e s . The p o s s e s s i o n of r o a s t i n g f a c i l i t i e s enables t h i s
d i r e c t producer-consumer i n t e r a c t i o n - a type of marketing
developed by Climax and a p p a r e n t l y now w e l l accepted. P l a c e r has
a l s o found t h a t the oxide market i s more s t a b l e .
Ferromolybdenum a l s o has r e s t r i c t i v e t a r i f f s a t t a c h e d
import, although the use of t h i s product i s d e c l i n i n g
to i t s
i n comparison
141
to oxide. Canadian c a p a c i t y i s reasonable on a world s c a l e and a f a c i l i t y i n BC would not b e n e f i t the domestic market.
Other molybdenum products are subject to p r o h i b i t i v e t a r i f f s i n a l l major markets. Further processing i n t o the areas of molybdates, t e c h n i c a l grade oxide and molybdenum metal i s r e s t r i c t e d by small markets and i s dominated by e x i s t i n g producers l i k e Climax. I t i s t h e r e f o r e apparent that expansion of r o a s t i n g f a c i l i t i e s i n B r i t i s h Columbia o f f e r s the best o p p o r t u n i t y f o r f u r t h e r processing of molybdenum. P l a c e r has recognized t h i s and i s committed to an expansion which w i l l be o p e r a t i o n a l by e a r l y 1981.
5. 4 E v a l u a t i o n of Processing A l t e r n a t i v e s
5.4.1 Minimum Economic Throughput
The minimum economic throughput f o r a r o a s t i n g f a c i l i t y i s between 3600 and 4500 me t r i c tonnes per year of contained molybdenum i n concentrates (Placer Development). The Brenda and Endako mines have t h i s l e v e l of output, although Brenda 1s output i s b o r d e r l i n e .
Should a c e n t r a l i z e d f a c i l i t y be considered, BC's t o t a l unroasted output i n 1978 would r a t i o n a l i z e only one such f a c i l i t y f o r the province.

142
5.4.2 E v a l u a t i o n C r i t e r i a
A framework i s set out below f o r the e v a l u a t i o n of f u r t h e r r o a s t i n g c a p a c i t y f o r BC:
B e n e f i t s 1. Marketing f l e x i b i l i t y 2. Market s t a b i l i t y of output 3. Added Values
Costs 1. Venture C a p i t a l 2. P o l l u t i o n 3. I n f r a s t r u c t u r e Requirements
B e n e f i t s
1. Marketing F l e x i b i l i t y - as mentioned above, Climax has e s t a b l i s h e d a p a t t e r n of d i r e c t producer-consumer t i e s t h a t i s w e l l accepted. The trend world-wide i s toward producer-roasting of concentrates. P l a c e r has been s u c c e s s f u l i n p e n e t r a t i n g the Japanese market since a c q u i r i n g adequate r o a s t i n g c a p a c i t y .
2. Market S t a b i l i t y - oxide markets are more s t a b l e than those f o r concentrates due to the d i r e c t producer-consumer t i e s a v a i l a b l e through 1. Weak markets i n the 1970's demonstrated that oxides were e a s i e r to market than concentrates.
3. Added Values - More study i s needed, but these appear l i m i t e d . An a d d i t i o n a l r o a s t e r s u f f i c i e n t to convert a l l a v a i l a b l e BC concentrates would probably employ no more than 30 persons
143
(Wright Engineers). Oxide-concentrate p r i c e d i f f e r e n t i a l s have been kept low by Climax over the years and are c u r r e n t l y about 7% or $8.84 U.S./lb concentrate and $9.54 U.S./lb. oxide (export p r i c e s , August 1979).
Costs
1. C a p i t a l Cost - C a p i t a l costs of a 4 500 m e t r i c tonne per year (contained Mo) r o a s t e r were estimated by Wright Engineers a t $C5 m i l l i o n i n 1975. This t r a n s l a t e s to almost $C7 m i l l i o n today.
2. P o l l u t i o n - P o l l u t i o n from a r o a s t i n g f a c i l i t y i s i n the form of discharged sulphur d i o x i d e . The P o l l u t i o n C o n t r o l Branch's o b j e c t i v e s f o r the mining i n d u s t r y i n B r i t i s h Columbia r e s u l t i n a range between 1 000 p a r t s per m i l l i o n (ppm) and 250 ppm of sulphur d i o x i d e . A f a i r l y e l aborate c l e a n i n g system i s used i n the stacks at the Endako r o a s t e r to keep p o l l u t i o n to these l e v e l s . P o l l u t i o n from Endako t r a n s l a t e s to a range of from 7 000 lb/day sulphur d i o x i d e to 10 000 lb/day maximum.
3. I n f r a s t r u c t u r e Requirements - A v a i l a b i l i t y of s u f f i c i e n t power i s the only major requirement f o r a r o a s t i n g f a c i l i t y over and above the normal i n f r a s t r u c t u r e needs of the mining s e c t o r .
144
5.4.3 L o c a t i o n a l Considerations
1. Economic
Lo c a t i o n should achieve the maximum cost e f f i c i e n c y i n f r e i g h t , c o n t a i n e r s , handling, molybdenum c o s t s , e t c . A l o c a t i o n near a m i n e s i t e i s o b v i o u s l y favoured, but BC producers, w i t h the exc e p t i o n of Endako, produce too l i t t l e and are too s c a t t e r e d f o r any one e x i s t i n g producer to be an obvious choice.
The Highland V a l l e y i s one p o s s i b i l i t y , given that Highmont and V a l l e y Copper go ahead. T o t a l output from a l l Highland V a l l e y producers w i l l be about 4 000 - 4 500 metric tonnes per year - enough f o r one r o a s t e r . The area i s a t t r a c t i v e given the other i n f r a s t r u c t u r e c o sts already i n c u r r e d ; t h i s a t t r a c t i v e n e s s would increase were Brenda 1s production of molybdenum to be t r a n s f e r r e d to the Highland V a l l e y s i t e .
Endako i s planning expansion to 10 800 m e t r i c tonnes per annum and w i l l r o a s t both the output of Lornex and K i t s a u l t . This w i l l improve the BC processing s i t u a t i o n , i n a d d i t i o n Endako's e x i s t i n g marketing t i e s can be taken advantage o f . The Endako s i t e i s more i s o l a t e d than the Highland V a l l e y and p o l l u t i o n should t h e r e f o r e be l e s s of a problem.
145
A tidewater s i t e such as Pr i n c e Rupert has handling disadvantages, although a r o a s t e r on the north coast could make some b o r d e r l i n e deposits i n the province's northeast more a t t r a c t i v e . For the time being, however, mine production i n the area does not r a t i o n a l i z e t h i s development. K i t s a u l t ' s output would be enough to r a t i o n a l i z e a small r o a s t e r should i t not ship to Endako, and the prospect of the deposit being developed makes such a l o c a t i o n more a t t r a c t i v e . T r a n s p o r t a t i o n between A t l i n and P r i n c e Rupert remains a problem.
Generally the Endako s i t e appears to be favoured because of i t s c e n t r a l l o c a t i o n i n the province, the economics of the expansion of the e x i s t i n g f a c i l i t y a g a i n s t b u i l d i n g anew, (thereby i n c u r r i n g separate p o l l u t i o n and i n f r a s t r u c t u r e costs) and the a b i l i t y to take advantage of P l a c e r ' s marketing knowledge and successes. A l a r g e , c e n t r a l marketing network f o r oxide i s w e l l accepted by s t e e l consumers and producers a l i k e . One obvious d i f f i c u l t y however i s the r i s k inherent i n co n c e n t r a t i n g production i n one la r g e f a c i l i t y , the recent s t r i k e a t Endako has i l l u s t r a t e d one aspect of t h i s r i s k .

147
APPENDIX 1
DEFINITION OF RESERVES
149
D e f i n i t i o n of Reserves
Before any d i s c u s s i o n of the reserves of a given metal can take p l a c e , i t i s important that the concept of reserves be def i n e d . There are two main ways of d e f i n i n g r e s e r v e s , e i t h e r i n a p h y s i c a l or i n an economic sense.
P h y s i c a l Reserves (Resources)
The p h y s i c a l measurement of reserves attempts to evaluate a l l the e x i s t i n g resources of a given mineral i n the earth's c r u s t . No attempt i s made to d i f f e r e n t i a t e between those reserves which are more or l e s s d i f f i c u l t to e x t r a c t .
Economic Reserves
Economic reserves are those which are "economical" to e x t r a c t given today's p r i c e s , c o sts and t e c h n o l o g i e s . These reserves expand as a r e s u l t of i n c r e a s i n g p r i c e s , decreasing c o s t s , expanding technology or a combination of a l l three f a c t o r s .
The known resources of e x i s t i n g and committed p r o p e r t i e s are t o t a l l e d to c a l c u l a t e economic reserves. The un d e r l y i n g assumptions of t h i s c a l c u l a t i o n are:
a. These resources are 100% recoverable b. P e r f e c t knowledge of the de p o s i t i s p o s s i b l e .

150
The dependence on these assumptions leaves much to be d e s i r e d , t h e r e f o r e t h i s measure of resources may be regarded as the "best guess" of economically recoverable resources of the mineral i n question.
In t h i s r e p o r t , economic reserves of molybdenum are defined around e x i s t i n g and pro s p e c t i v e producers. The l a t t e r are i n c l u d e d i n the reserves c a l c u l a t i o n at t h e i r expected s t a r t u p dates, to gain an idea of the change i n reserves over time. This i s the methodology used i n Table 1-9.
For f u r t h e r d i s c u s s i o n of the concept of reserves, see:
Energy, Mines and Resources Canada, M i n e r a l B u l l e t i n MR178, Ottawa, 1979. T i l t o n , John E., The Future of Non-Fuel M i n e r a l s , Brookings, Washington, D.C, 1977, Chapter 2. Zwartendyk, Dr. J . , "The L i f e Index of M i n e r a l Reserves - A S t a t i s t i c a l Mirage", CIM B u l l e t i n , October 1974, page 67-70.
151
APPENDIX I I
BC PROSPECTS - RESERVES, HISTORY & REFERENCES
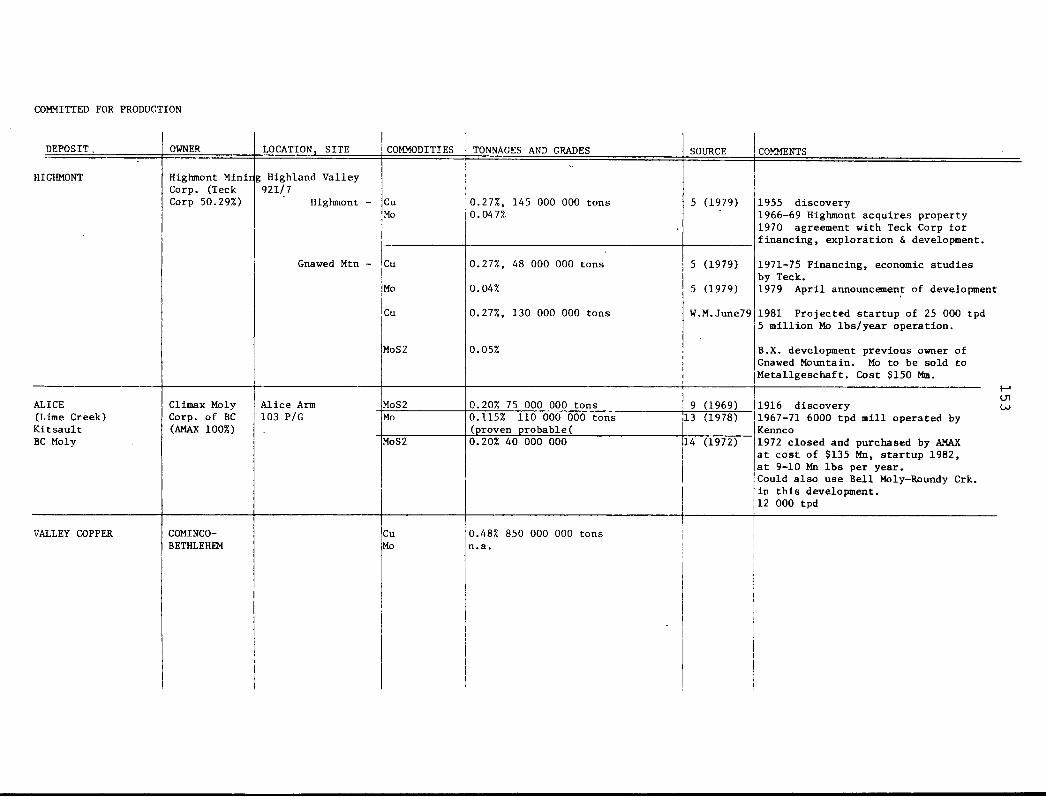
COMMITTED FOR PRODUCTION
DEPOSIT . OWNER LOCATION, SITE COMMODITIES TONNAGES AND GRADES SOURCE COMMENTS
HIGHMONT Highmont Minin Corp. (Teck Corp 50.29%)
g Highland Valley 921/7
Highmont -
Gnawed Mtn -
Cu Mo
0.27%, 145 000 000 tons 0.047%
5 (1979) 1955 discovery 1966-69 Highmont acquires property 1970 agreement with Teck Corp for financing, exploration & development.
1971-75 Financing, economic studies by Teck. 1979 A p r i l announcement of development
1981 Projected startup of 25 000 tpd 5 m i l l i o n Mo lbs/year operation.
B.X. development previous owner of Gnawed Mountain. Mo to be sold to Metallgeschaft. Cost $150 Mm.
HIGHMONT Highmont Minin Corp. (Teck Corp 50.29%)
g Highland Valley 921/7
Highmont -
Gnawed Mtn -
Cu
Mo
Cu
MoS2
0.27%, 48 000 000 tons
0.04%
0.27%, 130 000 000 tons
0.05%
5 (1979)
5 (1979)
W.M.June79
1955 discovery 1966-69 Highmont acquires property 1970 agreement with Teck Corp for financing, exploration & development.
1971-75 Financing, economic studies by Teck. 1979 A p r i l announcement of development
1981 Projected startup of 25 000 tpd 5 m i l l i o n Mo lbs/year operation.
B.X. development previous owner of Gnawed Mountain. Mo to be sold to Metallgeschaft. Cost $150 Mm.
ALICE (Lime Creek) K i t s a u l t BC Moly
Climax Moly Corp. of BC (AMAX 100%)
A l i c e Arm MoS2 0.20% 75 000 000 tons 9 (1969) Ul
1916 discovery u> 1967-71 6000 tpd m i l l operated by Kennco 1972 closed and purchased by AMAX at cost of $135 Mn, startup 1982, at 9-10 Mn l b s per year. Could also use B e l l Moly-Roundy Crk. i n t h i s development. 12 000 tpd
ALICE (Lime Creek) K i t s a u l t BC Moly
Climax Moly Corp. of BC (AMAX 100%)
103 P/G Mo 0.115% 110 000 000 tons (proven probable(
13 (1978)
Ul 1916 discovery u> 1967-71 6000 tpd m i l l operated by Kennco 1972 closed and purchased by AMAX at cost of $135 Mn, startup 1982, at 9-10 Mn l b s per year. Could also use B e l l Moly-Roundy Crk. i n t h i s development. 12 000 tpd
ALICE (Lime Creek) K i t s a u l t BC Moly
Climax Moly Corp. of BC (AMAX 100%)
MoS2 0.20% 40 000 000 14 (1972)
Ul 1916 discovery u> 1967-71 6000 tpd m i l l operated by Kennco 1972 closed and purchased by AMAX at cost of $135 Mn, startup 1982, at 9-10 Mn l b s per year. Could also use B e l l Moly-Roundy Crk. i n t h i s development. 12 000 tpd
VALLEY COPPER COMINCO-BETHLEHEM
Cu Mo
0.48% 850 000 000 tons n.a.

PROSPECTS
DEPOSIT
J.A. ZONE
OWNER
BETHLEHEM COPPER CORP. (Cominco 39.25
LOCATION. SITE
Highland Valley 92 I/7W
COMMODITIES
Cu . Mo
Cu Mo
Cu MoS2
TONNAGES AND GRADES
0.45%, 400 000 000 tons 0.01%
0.43% 286 000 000 tons 0.017% (cutoff grade-0.25% Cu waste:ore = 3.42:1
0.43% 286 000 000 tons 0.03%
SOURCE i COMMENTS
A, 11(1978)
14(Table)
1971 discovery by d r i l l i n g 1976 o r i g i n a l planned production date f o r 25 000 tpd m i l l . BC mineral land and ro y a l t y tax in d e f i n a t e l y postponed. 1978 Bethlehem introduces molybdenum c i r c u i t , JA, development contemplated ( I D Constraints: High s t r i p p i n g r a t i o
MAGGIE
BELL MOLY
BETHLEHEM Copper Corp. (Cominco 39.255
9 miles NW of Cache Creek. 92 I/14W
Cu Mo
0.34% 200 000 000 tons 0.022%
4, 7(1971)
Cu MoS2
0.28% 200 000 000 tons 0.017%
14 (p.442)
Cu Mo
CLIMAX MOLY CORP.(AMAX
100%)
6 miles E of A l i c e Arm 103 P/6W
Mo
MoS2
0.28% 200 000 000 tons 0.029%
14 (text)
0.07% 36 000 000 tons
0.11% 35 860 000 tons
1890 discovery 1968 Bethlehem acquires d r i l l i n g 1969-71 continued d r i l l i n g 1978-9 Evaluation continues
Constraints - Environmental problems. Deposit close to highway, stream on top of deposit.
7 (1967),14
1965 discovery
1966-75 exploration and d r i l l i n g by B e l l Molybdenum M.L. 1975 B e l l s e l l s to Climax. Clijnax to spend $1 Mn on exploration to Dec.31/80 & make production decision by Dec.31/90. 1976 D r i l l i n g by Climax (9 000 f t )
ROUNDY CREEK CLIMAX A l i c e Arm (103 P/6 MoS2 MoS2 MoS2
0.32% 1 296 000 tons 6 (1979) 0.347% 1 447 800 tons 0.36% 1 400 000 tons 14 (table)
MoS2 (a) 0.32% 1 296 000 tons (b) 0.668% 39 000 tons (c) 0.12-0.15% 8 000 000 tons
1965-71 d r i l l i n g , surface exploration 1975 sold to Climax by United Chiefton Res. for $325 000 plus 5% royalty per l b . contained Mo product-t i o n over 1.5Mn tons.
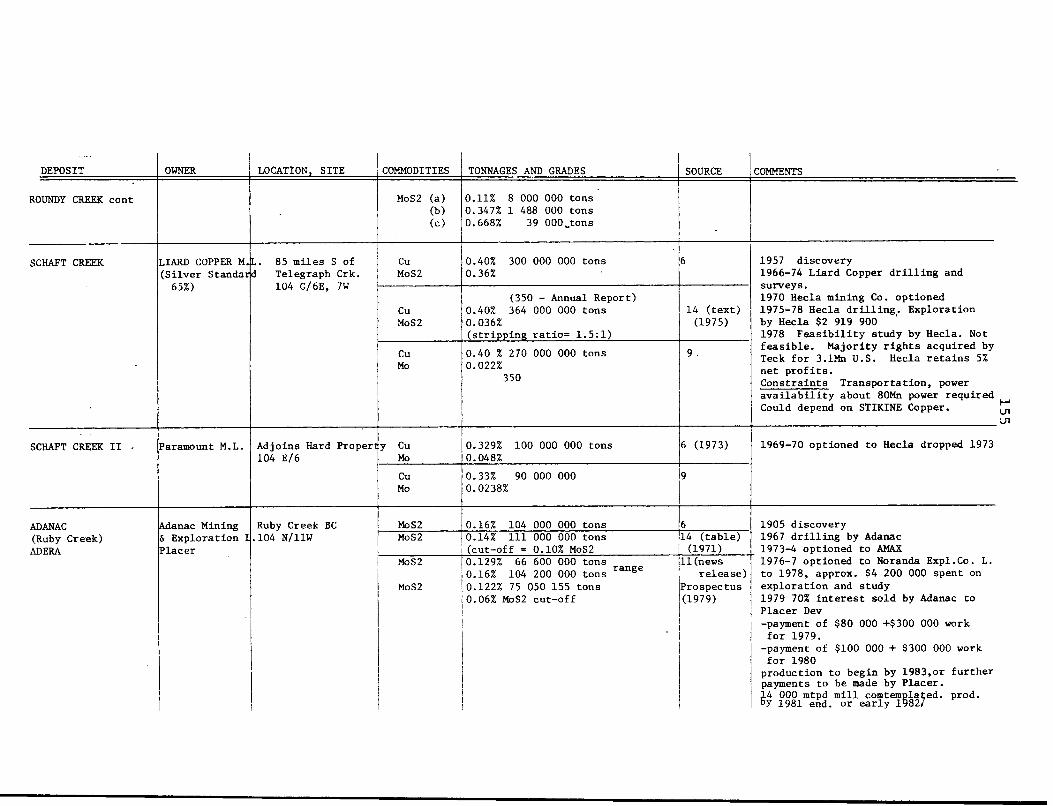
DEPOSIT OWNER LOCATION, SITE COMMODITIES TONNAGES AND GRADES SOURCE COMMENTS
ROUNDY CREEK cont MoS2 (a) (b) (c)
0.11% 8 000 000 tons 0.347% 1 488 000 tons 0.668% 39 OOO^tons
SCHAFT CREEK LIARD COPPER M. (Si l v e r Standar 65%)
L. 85 miles S of d Telegraph Crk.
104 G/6E, 7W
Cu MoS2
0.40% 300 000 000 tons 0.36%
6 1957 discovery 1966-74 L i a r d Copper d r i l l i n g and surveys. 1970 Hecla mining Co. optioned 1975-78 Hecla d r i l l i n g . Exploration by Hecla $2 919 900 1978 F e a s i b i l i t y study by Hecla. Not f e a s i b l e . Majority r i g h t s acquired by Teck for 3.1Mn U.S. Hecla r e t a i n s 5% net p r o f i t s . Constraints Transportation, power a v a i l a b i l i t y about 80Mn power required Could depend on STIKINE Copper. £J
SCHAFT CREEK LIARD COPPER M. (Si l v e r Standar 65%)
L. 85 miles S of d Telegraph Crk.
104 G/6E, 7W
Cu MoS2
(350 - Annual Report) 0.40% 364 000 000 tons 0.036% (stripping r a t i o * 1.5:1)
14 (text) (1975)
1957 discovery 1966-74 L i a r d Copper d r i l l i n g and surveys. 1970 Hecla mining Co. optioned 1975-78 Hecla d r i l l i n g . Exploration by Hecla $2 919 900 1978 F e a s i b i l i t y study by Hecla. Not f e a s i b l e . Majority r i g h t s acquired by Teck for 3.1Mn U.S. Hecla r e t a i n s 5% net p r o f i t s . Constraints Transportation, power a v a i l a b i l i t y about 80Mn power required Could depend on STIKINE Copper. £J
SCHAFT CREEK LIARD COPPER M. (Si l v e r Standar 65%)
L. 85 miles S of d Telegraph Crk.
104 G/6E, 7W
Cu Mo
0.40 % 270 000 000 tons 0.022%
350
9 .
1957 discovery 1966-74 L i a r d Copper d r i l l i n g and surveys. 1970 Hecla mining Co. optioned 1975-78 Hecla d r i l l i n g . Exploration by Hecla $2 919 900 1978 F e a s i b i l i t y study by Hecla. Not f e a s i b l e . Majority r i g h t s acquired by Teck for 3.1Mn U.S. Hecla r e t a i n s 5% net p r o f i t s . Constraints Transportation, power a v a i l a b i l i t y about 80Mn power required Could depend on STIKINE Copper. £J
SCHAFT CREEK II * Paramount M.L. Adjoins Hard Propert 104 E/6
y Cu Mo
0.329% 100 000 000 tons 0.048%
6 (1973) 1969-70 optioned to Hecla dropped 1973 SCHAFT CREEK II * Paramount M.L. Adjoins Hard Propert 104 E/6
Cu Mo
0.33% 90 000 000 0.0238%
9
1969-70 optioned to Hecla dropped 1973
ADANAC (Ruby Creek) ADERA
Adanac Mining & Exploration I Placer
Ruby Creek BC .104 N/11W
MoS2 0.16% 104 000 000 tons 6 1905 discovery 1967 d r i l l i n g by Adanac 1973-4 optioned to AMAX
ADANAC (Ruby Creek) ADERA
Adanac Mining & Exploration I Placer
Ruby Creek BC .104 N/11W MoS2 0.14% 111 000 000 tons
(cut-off = 0.10% MoS2 14 (table) (1971)
1905 discovery 1967 d r i l l i n g by Adanac 1973-4 optioned to AMAX
ADANAC (Ruby Creek) ADERA
Adanac Mining & Exploration I Placer
Ruby Creek BC .104 N/11W
MoS2
MoS2
0.129% 66 600 000 tons 0.16% 104 200 000 tons r a n g e
0.122% 75 050 155 tons 0.06% MoS2 cut-off
11(news release)
Prospectus (1979)
1976-7 optioned to Noranda Expl.Co. L. to 1978, approx. $4 200 000 spent on exploration and study 1979 70% i n t e r e s t sold by Adanac to Placer Dev -payment of $80 000 +$300 000 work for 1979.
-payment of $100 000 + $300 000 work for 1980
production to begin by 1983,or further payments to be made by Placer. 14 000 mtpd m i l l comtemplated. prod. 6y 1981 end. or early 1982/

DEPOSIT OWNER LOCATION, SITE COMMODITIES TONNAGES AND GRADES SOURCE COMMENTS
BERG KENNCO EXPLOR (Western) Ltd.
20 miles NW of Taht; Reach 93 E/14W (10 miles SE of Houston)
>a Cu Mo
0.40% 400 000 000 tons 0.05%
6 (1975) 1961-71 exploration, d r i l l i n g 1972 optioned to Placer Development 1974-5 Placer continues exploration
Constraints RequiiB access road from Houston; townsite would probably have to be b u i l t . Power requires building of g r i d from Houston or Kemano.
BERG KENNCO EXPLOR (Western) Ltd.
20 miles NW of Taht; Reach 93 E/14W (10 miles SE of Houston)
Cu Mo
0.40% 360 000 000 tons 0.05%
9
1961-71 exploration, d r i l l i n g 1972 optioned to Placer Development 1974-5 Placer continues exploration
Constraints RequiiB access road from Houston; townsite would probably have to be b u i l t . Power requires building of g r i d from Houston or Kemano.
BERG KENNCO EXPLOR (Western) Ltd.
Cu MoS2
0.40% 394 000 000 tons. 0.054% (0.25% cutoff; 250 000 000 tons with stripping r a t i o 2.75:1.)
14(p.422)
1961-71 exploration, d r i l l i n g 1972 optioned to Placer Development 1974-5 Placer continues exploration
Constraints RequiiB access road from Houston; townsite would probably have to be b u i l t . Power requires building of g r i d from Houston or Kemano.
POISON MOUNTAIN Copper Giant Moly Corp. (Long Lac Min. Explor. Ltd. 50.64%)
70 miles NW of L i l l o o e t . 920/2E
Cu MoS2
0.37% 85 000 000 tons 0.022%
4,7 (1967) 14 (p.422)
1935-67 d r i l l i n g , mapping, surveying 1970 tests, surveys Copper Giant has 30% share. Property i d l e since 1971 (7) 1979 a c t i v i t i y
POISON MOUNTAIN Copper Giant Moly Corp. (Long Lac Min. Explor. Ltd. 50.64%)
70 miles NW of L i l l o o e t . 920/2E Cu
M q S2 Au
0.33% 193 000 000 tons 0.025% . 3 ppm
14 (Table)
1935-67 d r i l l i n g , mapping, surveying 1970 tests, surveys Copper Giant has 30% share. Property i d l e since 1971 (7) 1979 a c t i v i t i y
GLACIER GULCH Yorke-Hardy Hudson Bay Mtn.
AMAX EXPLOR. LTD. (Climax of BC)
Smithers Area 93L/14W
MoS2 W03
0.30 70 000 000 tons 0.06 12
1958-66 surface |_» 1966-69 d.d d r i f t s , adits Ui 1970-71 extensive d r i l l i n g ^ Company has expressed i n t e r e s t i n development large tungsten potential Constraints deposit favors underground development, open p i t options may be more favorable.
GLACIER GULCH Yorke-Hardy Hudson Bay Mtn.
AMAX EXPLOR. LTD. (Climax of BC)
Smithers Area 93L/14W
MoS2 0.29% 100 000 000 tons 8,14(p422)
1958-66 surface |_» 1966-69 d.d d r i f t s , adits Ui 1970-71 extensive d r i l l i n g ^ Company has expressed i n t e r e s t i n development large tungsten potential Constraints deposit favors underground development, open p i t options may be more favorable.
GLACIER GULCH Yorke-Hardy Hudson Bay Mtn.
AMAX EXPLOR. LTD. (Climax of BC)
Smithers Area 93L/14W
Mo 0.15% 100 000 000 tons 9,6
1958-66 surface |_» 1966-69 d.d d r i f t s , adits Ui 1970-71 extensive d r i l l i n g ^ Company has expressed i n t e r e s t i n development large tungsten potential Constraints deposit favors underground development, open p i t options may be more favorable.
HUCKLEBERRY KENNCO EXPLOR (Western) LTD.
50 miles SW of Houst on Oosta Lake 93 E/11E
on Cu MoS2
0.417% 85 600 000 tons 0.025%
15 (1976) 14 (p.422)
1961 discovery 1972 Kennco optioned to Granby M.L. can earn 50% i n t . i f spend 1.5 Mn
• by 1989 - had spent $1 Mn by 1974 1974-76 f e a s i b i l i t y studies indicate not economical. Est. cost of dev $100 Mn Constraints - s i m i l a r to BERG. Townsite/power/roads
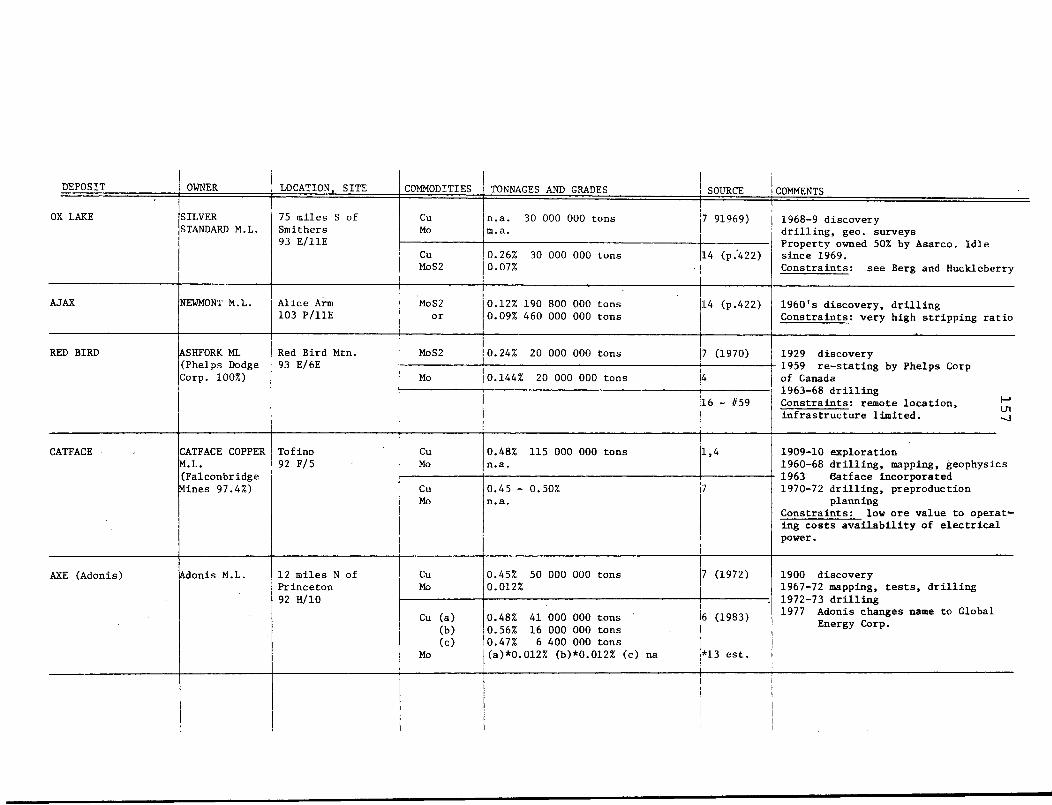
DEPOSIT OWNER LOCATION, SITE COMMODITIES TONNAGES AND GRADES SOURCE COMMENTS
OX LAKE SILVER STANDARD M.L.
75 miles S of Smithers 93 E/11E
Cu Mo
n.a. 30 000 000 tons m.a.
7 91969) 1968-9 discovery d r i l l i n g , geo. surveys Property owned 50% by Asarco. Idle since 1969. Constraints: see Berg and Huckleberry
OX LAKE SILVER STANDARD M.L.
75 miles S of Smithers 93 E/11E
Cu MoS2
0.26% 30 000 000 tons 0.07%
14 (p.422)
1968-9 discovery d r i l l i n g , geo. surveys Property owned 50% by Asarco. Idle since 1969. Constraints: see Berg and Huckleberry
AJAX NEWMONT M.L. A l i c e Arm 103 P/11E
MoS2 or
0.12% 190 800 000 tons 0.09% 460 000 000 tons
14 (p.422) 1960 fs discovery, d r i l l i n g Constraints: very high s t r i p p i n g r a t i o
RED BIRD ASHFORK ML (Phelps Dodge Corp. 100%)
Red Bird Mtn. 93 E/6E
MoS2 0.24% 20 000 000 tons 7 (1970) 1929 discovery RED BIRD ASHFORK ML (Phelps Dodge Corp. 100%)
Red Bird Mtn. 93 E/6E
Mo 0.144% 20 000 000 tons 4 - 1959 re- s t a t i n g by Phelps Corp of Canada 1963-68 d r i l l i n g Constraints: remote l o c a t i o n , |~* infr a s t r u c t u r e l i m i t e d .
RED BIRD ASHFORK ML (Phelps Dodge Corp. 100%)
Red Bird Mtn. 93 E/6E
16 - #59
- 1959 re- s t a t i n g by Phelps Corp of Canada 1963-68 d r i l l i n g Constraints: remote l o c a t i o n , |~* infr a s t r u c t u r e l i m i t e d .
CATFACE CATFACE COPPER M.L. (Falconbridge Mines 97.4%)
Tofino 92 F/5
Cu Mo
0.48% 115 000 000 tons n.a.
1.4 1909-10 exploration 1960-68 d r i l l i n g , mapping, geophysics
CATFACE CATFACE COPPER M.L. (Falconbridge Mines 97.4%)
Tofino 92 F/5
Cu Mo
0.45 - 0.50% n.a.
7 1963 Gatface Incorporated 1970-72 d r i l l i n g , preproduction
planning Constraints: low ore value to operating costs a v a i l a b i l i t y of e l e c t r i c a l power.
AXE (Adonis) Adonis M.L. 12 miles N of Princeton 92 H/10
Cu Mo
0.45% 50 000 000 tons 0.012%
7 (1972) 1900 discovery 1967-72 mapping, tests, d r i l l i n g 1972-73 d r i l l i n g 1977 Adonis changes name to Global
Energy Corp.
•
AXE (Adonis) Adonis M.L. 12 miles N of Princeton 92 H/10
Cu (a) (b) (c)
Mo
0.48% 41 000 000 tons ' 0.56% 16 000 000 tons 0.47% 6 400 000 tons (a)*0.012% (b)*0.012% (c) na
6 (1983)
*13 est.
1900 discovery 1967-72 mapping, tests, d r i l l i n g 1972-73 d r i l l i n g 1977 Adonis changes name to Global
Energy Corp.
•

DEPOSIT OWNER LOCATION, SITE COMMODITIES TONNAGES AND GRADES SOURCE COMMENTS
HUNTSMAN (Storie)
New Jersey Zinc Explor. Canada Ltd.
4 miles S of Cassia: 104 P/5W
Mo 0.115% 110 000 000 tons 15 1965 i n i t i a l exploration 1968-71 d r i l l i n g 1976 d r i l l i n g large sulphide deposit. Could use Cassiar as townsite. Constraints: power supply, transport a t i o n would probably be by truck to Stewart. Need higher Mo p r i c e .
MT. HASKINS (JOEM)
DELLA ML Cassiar Area 104 P/5
MoS2 Ag, Zn
0.15% 13 500 000 tons na
14 (p.422) 1968-69 d r i l l i n g 1971-4 tmderground tunneling and d r i l l i n g 1976 d r i l l i n g resumed Financed by R&P Metals Corp, Iso Mines Ltd and Ashland O i l .
MT. HASKINS (JOEM)
DELLA ML Cassiar Area 104 P/5
MoS2 0.17% 13 000 000 tons 3
1968-69 d r i l l i n g 1971-4 tmderground tunneling and d r i l l i n g 1976 d r i l l i n g resumed Financed by R&P Metals Corp, Iso Mines Ltd and Ashland O i l .
O.K.' GOLDEN GRANITE ML (Prev. Granite Mtn. ML)
18 miles NW of Powell River 92K/2E
Cu MoS2
0.30% 100 000 000 tons 0.03%
14 (p.422) 1916 discovery 1965 re-discovered, exploration J _ J 1972 surveys, d r i l l i n g Ln 1973-4 optioned to Western ML 0 0
(65% i f prod). D r i l l i n g so Western earns 50% i n t e r e s t . 1976 Western agreement changed so can earn 80% - 90% i n t e r e s t i f expands in 2 years.
O.K.' GOLDEN GRANITE ML (Prev. Granite Mtn. ML)
18 miles NW of Powell River 92K/2E
Cu MoS2
0.33% 90 000 000 tons 0.02%
6
1916 discovery 1965 re-discovered, exploration J _ J 1972 surveys, d r i l l i n g Ln 1973-4 optioned to Western ML 0 0
(65% i f prod). D r i l l i n g so Western earns 50% i n t e r e s t . 1976 Western agreement changed so can earn 80% - 90% i n t e r e s t i f expands in 2 years.
O.K.' GOLDEN GRANITE ML (Prev. Granite Mtn. ML)
18 miles NW of Powell River 92K/2E
Cu MoS2
0.30% 75 000 000 tons 0.016% (cutoff 0.2% Cu)
14 (Table)
1916 discovery 1965 re-discovered, exploration J _ J 1972 surveys, d r i l l i n g Ln 1973-4 optioned to Western ML 0 0
(65% i f prod). D r i l l i n g so Western earns 50% i n t e r e s t . 1976 Western agreement changed so can earn 80% - 90% i n t e r e s t i f expands in 2 years.
KRAIN I n i t i a l Develop Ltd.
Highland Valley Cu Mo
0.56% ;5 530 000 tons 0.01%
14 (text) 1907 discovery 1955 porphyry discovery, exploration 1971 exploration and development option to Getty M L - d r i l l i n g 1974 Getty drops option Comet Industries owns some claims, optioned to I.D.
KRAIN I n i t i a l Develop Ltd.
Highland Valley
Cu Mo
0.45% 20 000 000 tons na
6
1907 discovery 1955 porphyry discovery, exploration 1971 exploration and development option to Getty M L - d r i l l i n g 1974 Getty drops option Comet Industries owns some claims, optioned to I.D.
KRAIN I n i t i a l Develop Ltd.
Highland Valley
Cu MoS2
0.55% 16 535 000 tons 0.02%
14 (Table)
1907 discovery 1955 porphyry discovery, exploration 1971 exploration and development option to Getty M L - d r i l l i n g 1974 Getty drops option Comet Industries owns some claims, optioned to I.D.
|
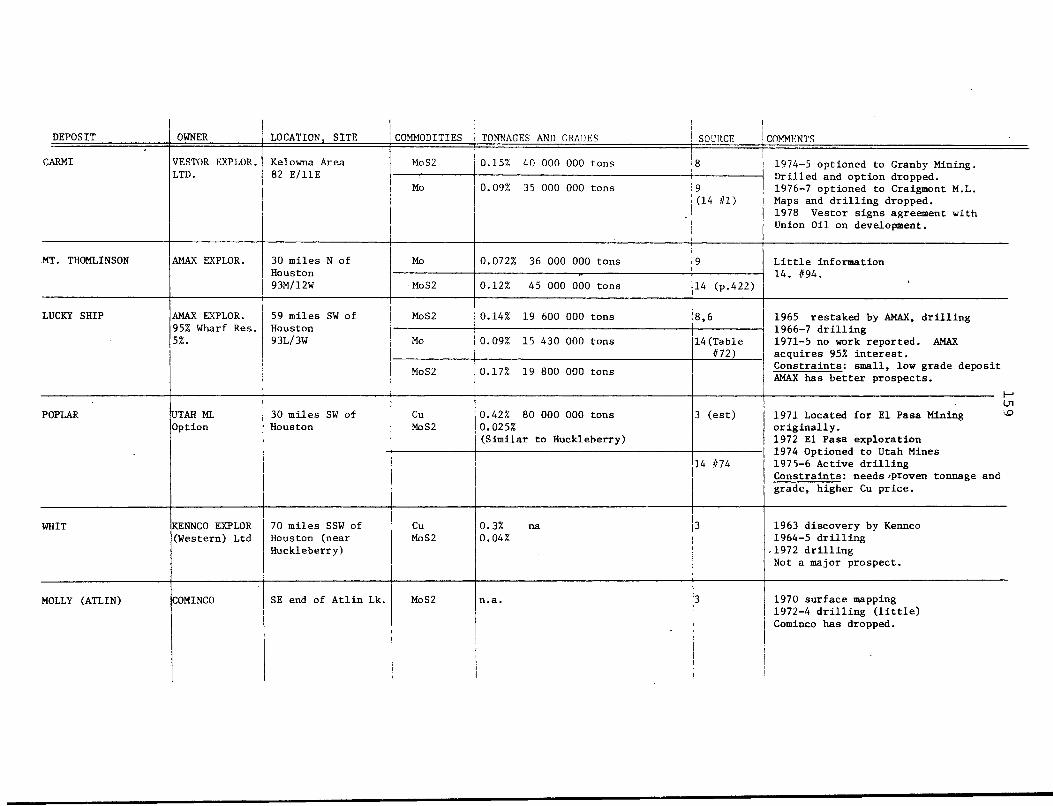
DEPOSIT OWNER LOCATION, SITE COMMODITIES TONNAGES AND GRADES SOURCE COMMENTS
CARMI VESTOR EXPLOR. LTD.
Kelowna Area 82 E/11E
MoS2 0.15% 40 000 000 tons 8 1974-5 optioned to Granby Mining. D r i l l e d and option dropped. 1976-7 optioned to Craigmont M.L. Maps and d r i l l i n g dropped. 1978 Vestor signs agreement with Union O i l on development.
VESTOR EXPLOR. LTD.
Kelowna Area 82 E/11E
Mo 0.09% 35 000 000 tons 9 (14 #1)
1974-5 optioned to Granby Mining. D r i l l e d and option dropped. 1976-7 optioned to Craigmont M.L. Maps and d r i l l i n g dropped. 1978 Vestor signs agreement with Union O i l on development.
.MT. THOMLINSON AMAX EXPLOR. 30 miles N of Houston 93M/12W
Mo 0.072% 36 000 000 tons 9 L i t t l e information 14. #94.
30 miles N of Houston 93M/12W •MoS2 0.12% 45 000 000 tons 14 (p.422)
L i t t l e information 14. #94.
LUCKY SHIP AMAX EXPLOR. 95% Wharf Res. 5%.
59 miles SW of Houston 93L/3W
MoS2 0.14% 19 600 000 tons 8,6 1965 restaked by AMAX, d r i l l i n g 1966-7 d r i l l i n g 1971-5 no work reported. AMAX acquires 95% i n t e r e s t .
AMAX EXPLOR. 95% Wharf Res. 5%.
59 miles SW of Houston 93L/3W Mo 0.09% 15 430 000 tons 14(Table
#72)
1965 restaked by AMAX, d r i l l i n g 1966-7 d r i l l i n g 1971-5 no work reported. AMAX acquires 95% i n t e r e s t .
MoS2 0.17% 19 800 000 tons Constraints: small, low grade deposit AMAX has better prospects.
1—i
POPLAR UTAH ML Option
30 miles SW of Houston
Cu MoS2
0.42% 80 000 000 tons 0.025% (Similar to Huckleberry)
3 (est) Ui
1971 Located for E l Pasa Mining <° o r i g i n a l l y . 1972 E l Pasa exploration 1974 Optioned to Utah Mines 1975-6 Active d r i l l i n g Constraints: needs ̂ proven tonnage and grade, higher Cu pr i c e .
14 #74
Ui 1971 Located for E l Pasa Mining <° o r i g i n a l l y . 1972 E l Pasa exploration 1974 Optioned to Utah Mines 1975-6 Active d r i l l i n g Constraints: needs ̂ proven tonnage and grade, higher Cu pr i c e .
WHIT KENNCO EXPLOR (Western) Ltd
70 miles SSW of Houston (near Huckleberry)
Cu MoS2
0.3% na 0.04%
3 1963 discovery by Kennco 1964-5 d r i l l i n g .1972 d r i l l i n g Not a major prospect.
MOLLY (ATLIN) COMINCO SE end of A t l i n Lk. MoS2 n.a.
1 i
3
i
1970 surface mapping 1972-4 d r i l l i n g ( l i t t l e ) Cominco has dropped.
•
i

DEPOSIT OWNER LOCATION, SITE COMMODITIES TONNAGES AND GRADES SOURCE i COMMENTS
GEM (MEG) GEMEX N of Harrison L. Mo 46 500 tons contained Mo 14(p.422) 14 #19
SERB CREEK AMAX Smithers Area 93L/12W
MoS2 0.08% 500 000 000 tons 14 (p.422)
SALAL CREEK BP MINERALS 92J/14W Mo n.a. 14 (p.422) Low grade p o t e n t i a l . Craigmont d r i l l e d i n 1975.
EAGLE NUSPAR MIN 40% IMPERIAL OIL 60%
33 miles E of Dease Lake.
Cu Mo
n.a. n.a.
3,6 •
KAREN HE6CA RES.CORP 48 miles N of Grand Forks
Cu Mo
n.a. 60 000 000 tons n.a.
CASCADE MOLY NEW CASCADE M.L.
Mo 0.14% 1 078 283 tons 7 Amenable to open p i t , but small (7) New Cascade acquired by Maloney 0
Steel 1976. Adjacent to Red Mtn.
CASCADE MOLY NEW CASCADE M.L. MoS2
Au 0.27% 1 500 000 tons 0.034 oz/ton
14 (p.422) Amenable to open p i t , but small (7) New Cascade acquired by Maloney 0
Steel 1976. Adjacent to Red Mtn.
GIANT (ST i ELMO)
CHANDALAR RES. 50%
SCURRY RAINBOW 50%
Rossland Area MoS2 0.39% 810 540 tons 6 (1972) Open p i t prospect d r i l l e d i n the 1970*s, s p l i t with Scurry.
GIANT (ST i ELMO)
CHANDALAR RES. 50%
SCURRY RAINBOW 50%
Rossland Area
MoS2 0.33% 73 000 tons 6
Open p i t prospect d r i l l e d i n the 1970*s, s p l i t with Scurry.
GIANT (ST i ELMO)
CHANDALAR RES. 50%
SCURRY RAINBOW 50%
Rossland Area
MoS2 0.39% 804 700 tons 14 (p.422)
Open p i t prospect d r i l l e d i n the 1970*s, s p l i t with Scurry.
CANAM GIANT MASCOT ML (GM RES.)
27 miles SW of Hope 93 11/3
Cu Ag Au Mo
1.28% 2 600 000 tons 0.65% 0.015% 0.03%
6 (1970) 7
1903-70 extensive d r i l l i n g and development. Work suspended l a t e 1970.
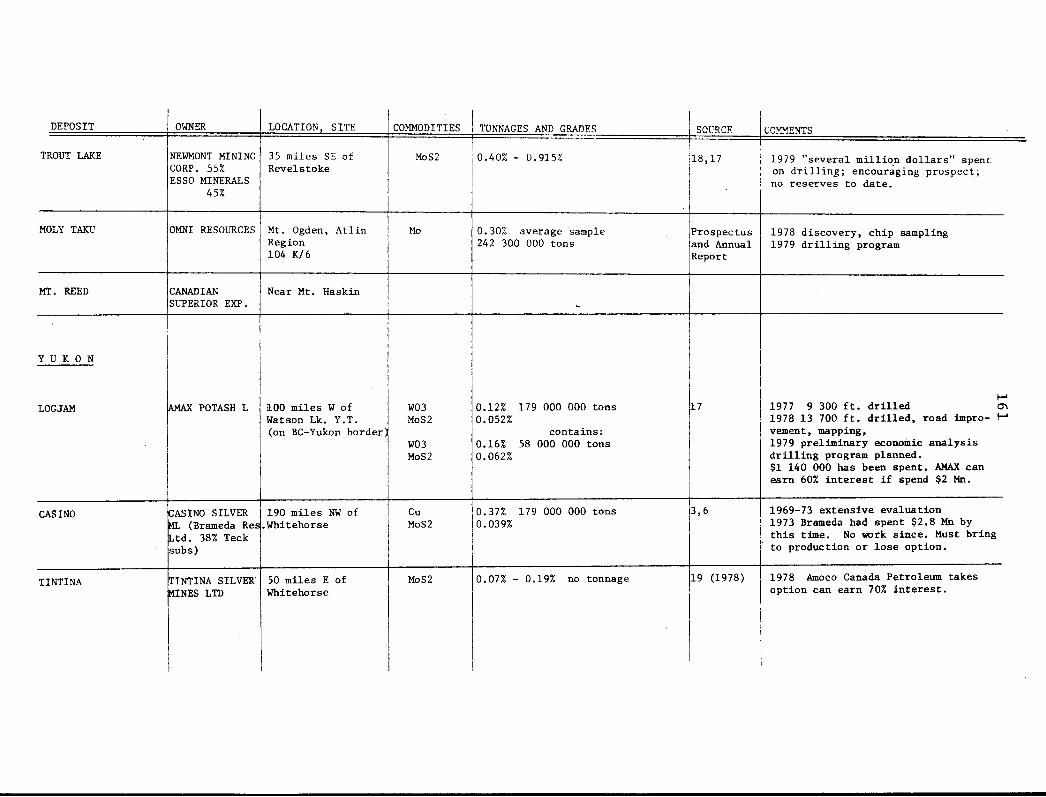
DEPOSIT OWNER LOCATION, SITE COMMODITIES TONNAGES AND GRADES SOURCE COMMENTS
TROUT LAKE NEWMONT MINING CORP. 55% ESSO MINERALS
45%
35 miles SE of Revelstoke
MoS2 0.40% - 0.915% 18,17 1979 "several m i l l i o n d o l l a r s " spent on d r i l l i n g ; encouraging prospect; no reserves to date.
MOLY TAKU OMNI RESOURCES Mt. Ogden, A t l i n Region 104 K/6
Mo 0.30% average sample 242 300 000 tons
Prospectus and Annual Report
1978 discovery, chip sampling 1979 d r i l l i n g program
MT. REED CANADIAN SUPERIOR EXP.
Near Mt. Haskin
Y U K O N
LOGJAM AMAX POTASH L 100 miles W of Watson Lk. Y.T. (on BC-Yukon border)
W03 MoS2
W03 MoS2
0.12% 179 000 000 tons 0.052%
contains: 0.16% 58 000 000 tons 0.062%
17 r-«
1977 9 300 f t . d r i l l e d <T> 1978 13 700 f t . d r i l l e d , road impro- H« vement, mapping, 1979 preliminary economic analysis d r i l l i n g program planned. $1 140 000 has been spent. AMAX can earn 60% in t e r e s t i f spend $2 Mn.
CASINO CASINO SILVER ML (Brameda Res Ltd. 38% Teck subs)
190 miles NW of .Whitehorse
Cu MoS2
0.37% 179 000 000 tons 0.039%
3,6 1969-73 extensive evaluation 1973 Brameda had spent $2.8 Mn by t h i s time. No work since. Must bring to production or lose option.
TINTINA TINTINA SILVER MINES LTD
50 miles E of Whitehorse
MoS2 0.07% - 0.19% no tonnage 19 (1978) 1978 Amoco Canada Petroleum takes option can earn 70% i n t e r e s t .
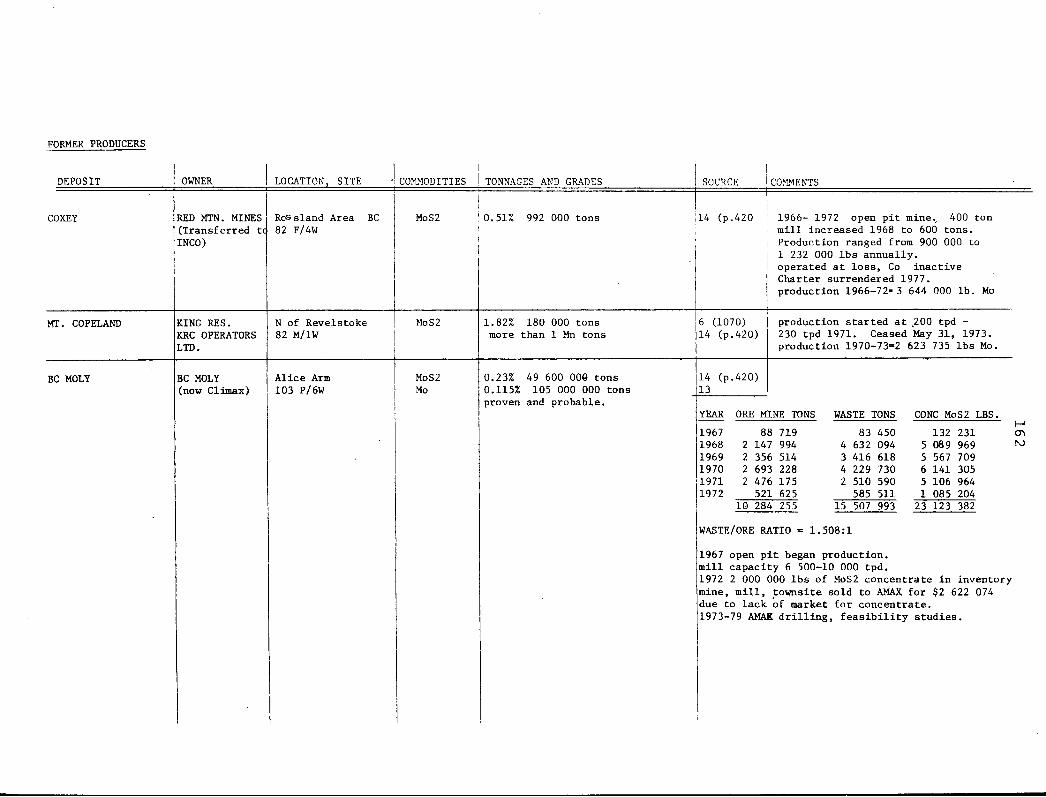
FORMER PRODUCERS
DEPOSIT OWNER LOCATION, SITE COMMODITIES j TONNAGES AND GRADES SOURCE I COMMENTS
I
COXEY RED MTN. MINES (Transferred tc INCO)
RcSsland Area BC 82 F/4W
MoS2 0.51% 992 000 tons 114 (p.420 ! 1966- 1972 open p i t mine v 400 ton I m i l l increased 1968 to 600 tons.
Production ranged from 900 000 to 1 232 000 lbs annually, operated at l o s s , Co inac t i v e Charter surrendered 1977. production 1966-72= 3 644 000 l b . Mo
MT. COPELAND KING RES. KRC OPERATORS LTD.
N of Revelstoke 82 M/1W
MoS2 1.82% 180 000 tons more than 1 Mn tons
6 (1070) 14 (p.420)
production started at 200 tpd -230 tpd 1971. Ceased May 31, 1973. production 1970-73=2 623 735 lbs Mo.
BC MOLY BC MOLY (now Climax)
A l i c e Arm 103 P/6W
MoS2 Mo
0.23% 49 600 00© tons 0.115% 105 000 000 tons proven and probable.
14 (p.420) 13
YEAR ORE MINE TONS WASTE TONS CONC MoS2 LBS. 1967 1968 1969 1970 1971 1972
88 719 147 994 356 514 693 228 476 175 521 625
10 284 255
83 450 4 632 094 3 416 618 4 229 730 2 510 590
585 511 15 507 993 23 123 382
132 231 089 969 567 709 141 305 106 964 085 204
r-J
WASTE/ORE RATIO - 1.508:1
1967 open p i t began production, m i l l capacity 6 500-10 000 tpd. 1972 2 000 000 l b s of MoS2 concentrate i n inventory mine, m i l l , townsite sold to AMAX for $2 622 074 due to lack of market for concentrate. 1973-79 AMAK d r i l l i n g , f e a s i b i l i t y studies.

163
REFERENCE SOURCES - DEPOSITS AND PROSPECTS DATA
REF # 1. Wright Engineers and H.N. Halvorson Consultants
L t d . ; Forecast of Developments i n the M i n e r a l Sector of the C o a s t a l Region of B r i t i s h Columbia, March, 1975.
2. , Forecast of Developments i n the M i n e r a l Sector of the C e n t r a l Region of B r i t i s h Columbia, 1975.
3. , Forecast of Developments i n the M i n e r a l Sector of the Northwest Region of B r i t i s h Columbia, 3 volumes, January 1977.
4. D r o l e t , J.P.; The Demands and L i m i t a t i o n s Governing the M i n e r a l Production of Western Canada i n 1990, October 1976.
5. Northern Miner Magazine, A p r i l 26 1979, page 7. 6. Northern Miner Magazine, Canadian Mines Handbook,
years 1972/73 - 1978/79. 7. Canada, Department of Mines and Resources,
Min e r a l B u l l e t i n MR 181, A Survey of Known Mi n e r a l Deposits i n Canada That are Not Being Mined, A p r i l 1978.
Appendix to the above Sutulov, A., I n t e r n a t i o n a l Molybdenum Encyclopedia,
Volume 1, Santiago, 1978. BC and Yukon Chamber of Mines, M i n e r a l Prospects,
1977. Company Annual Reports f o r 1978. B r i t i s h Columbia M i n i s t r y of Economic Development,
Northwest Report, 1977, V i c t o r i a , December 1977. Canada Department of Energy, Mines and Resources,
M i n e r a l B u l l e t i n MR 185, Reserves of Copper, N i c k e l , Lead, Zinc, Molybdenum, Gold and S i l v e r as of January 1, 1978.
14. Ney, Charles S., C,I,M, S p e c i a l Volume 15, Porphyry Deposits of the Canadian C o r d i l l e r a , 1976.
16. Table 1, Paper 10 of the above.
8. 9.
10.
11. 12.
13.
16 4
17. Garnett, J.A., M i n i s t r y of Energy, Mines and Petroleum Resources, Resource Data D i v i s i o n .
18. Northern Miner Magazine, February 22, 1979. 19. Mining J o u r n a l , November 24, 1978, p.14 and
A p r i l 14, 1978, p.277.

165
APPENDIX I I I
APPENDIX TABLES

16 7
APPENDIX TABLE A - l
NON-COMMUNIST WORLD MOLYBDENUM CONSUMPTION BY END-USE, 1976
END-USE 1000 nut. % EXPECTED GROWTH % IN 1984 Mo RATE TO 1984 (%)
Carbon Steels 2.0 2.5 0 1.4 HSLA Steels 33.9 42.3 9.5 50.8
Stainless Steels 15.1 18.8 7.0 18.9
Tool Steels 6.0 7.5 3.0 5.5
Managing Steels 1.5 1.8 3.0 1.3
High-Temperature Steels 1.8 2.2 4.0 1.7
Cast Irons 3.6 4.5 2.0 3.0
Superalloys 4.1 5.1 3.5 3.9
Mo Metal 5.0 6.3 5.0 5.4
Pigments 2.3 2.8 6.0 2.6
Catalysts 3.2 3.9 7.0 3.9
Lubricants 1.9 2.3 2.0 1.6
TOTALS 80.0 100.0 7.0 100.0
* given stated growth rates.
Source: B u t t e r f i e l d , J.A., and Ganshorn J.A., Placer Development Limited, "Molybdenum Supply and Demand Forecast 1 1, CIM, Annual Volume, 1977.
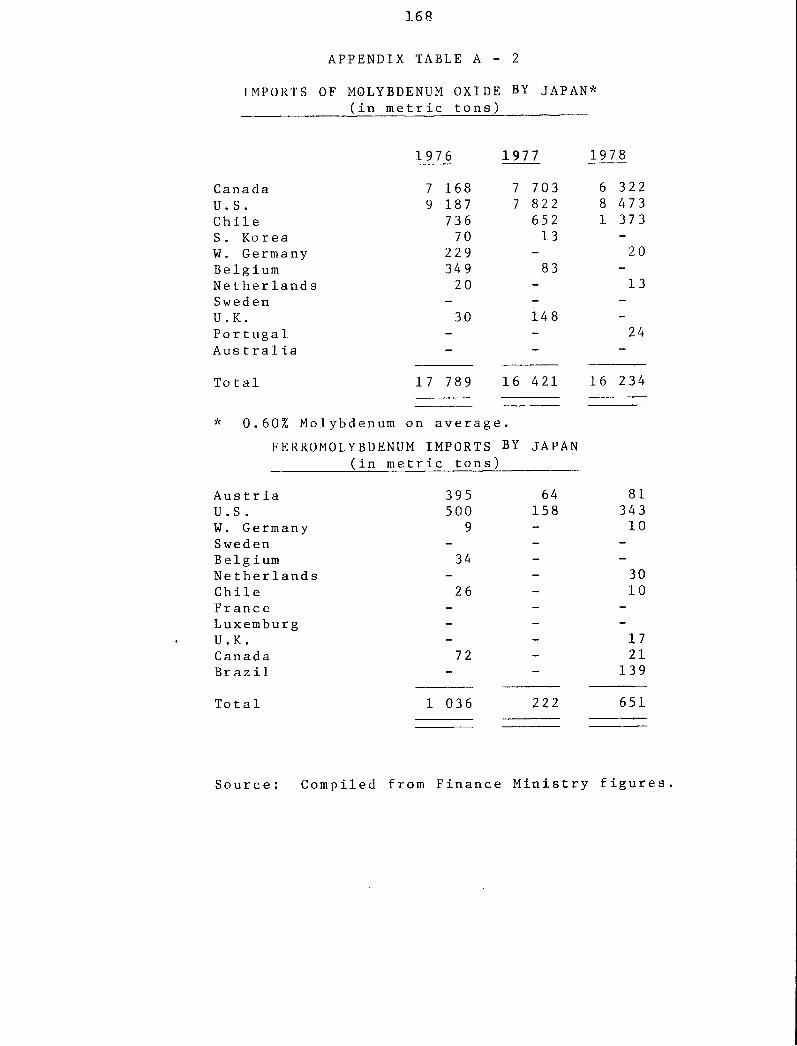
16 8
APPENDIX TABLE A - 2
IMPORTS OF MOLYBDENUM OXIDE BY JAPAN* ( i n m e t r i c t o n s )
1976 1977 1978
Canada 7 168 7 703 6 322 U.S. 9 187 7 822 8 473 C h i l e 736 652 1 373 S. K o r e a 70 13 -W. Germany 229 - 20 B e l g ium 349 83 N e t h e r l a n d s 20 - 13 Sweden - -U.K. 30 148 -P o r t u g a l - - 24 Aus t r a l i a - - —
T o t a l 1 7 789 16 421 16 234
* 0.60% Molybdenum on a v e r a g e . FERROMOLYBDENUM IMPORTS BY JAPAN
( i n m e t r i c t o n s )
A u s t r i a 395 64 81 U.S . 500 158 343 W. Germany 9 - 10 Sweden - - -B e l g ium 34 - -N e t h e r l a n d s - - 30 C h i l e 26 - 10 F r a n c e - - -Luxemburg - - -U.K. - 17 Canada 72 21 B r a z i l - - 139 T o t a l 1 036 222 651
S o u r c e : C o m p i l e d from F i n a n c e M i n i s t r y f i g u r e s

APPENDIX TABLE A - 3
C A N A D A CURRENT AND PROJECTED MOLYBDENUM PRODUCTION
( m i l l i o n s of Kg)
COMPANY MINE
EXISTING MINES 1977 1978 1979 1980 1981 1982 1983 1984 1985 86-90 91-95 1996+
PLACER
NORANDA
RIO ALGOM
UTAH
BETHLEHEM
ZAPATA SUBTOTAL
*ENDAKO GIBRALTAR
BRENDA *B0SS GASPE
LORNEX
ISLAND COPPER
BETHLEHEM
GRANISLE
PROSPECTS
NORANDA *DUMAGAMI
TECK
AMAX
PLACER
COMINCO
BETHLEHEM
ESSO
AMAX
HIGHMONT
*KITSAULT
*ADANAC
VALLEY COPPER
JA ZONE
*TROUT LAKE
*GLACIER GULCH
7.69 0.14
3.87 1.00 1.01
1.85
1.00
6.03 0.12
3.31 0.76 0.81
1.87
0.86
0.13
3. 1 0. 4 3.0 0.7 1.0
1.5
1.0
0.3
16.56 13.89 11.6
6. 0 0.5
2.6 1.3 1.2
1.8
0.9
0.3
0.1 14. J
0.2
6.0 0.5
2.6 1.3 0..8
1.8
0.9
0.3
0.2 14.4
0.4
1.0
6.3 0.5
2.7 0.6 0.8
1.8
0.9
0.3
0.2 14.1
0.4
2.0
2.3
6.3 0.5
2.7
0.8
1.8
0.9
0.3
0.2 13.5
0.4
2.0
4.5
6.3 0.5
2.7
0.8
1.8
0.9
0.3
0.2 13.5
0.2
2.0
4.5
1.8
6.3 0.5
2.7
0.8
1.8
0.9
0.3
0.2 13.5
2.0
4.5
3.6
6.3 0.5
2.7
0.8
2.7
0.9
0.2 14.1
2.0
4.5
3.6
0.5
0.7
4.5
6.3 0.5
0.8
2.7
0.9
11.2
2.0
4.5
3.6
0.7
0.7
4.5
7.0
6.3 0.5
0.8
2.7
10.3
2.0
4.5
3.6
0.7
0.7
7.5
7.0
as
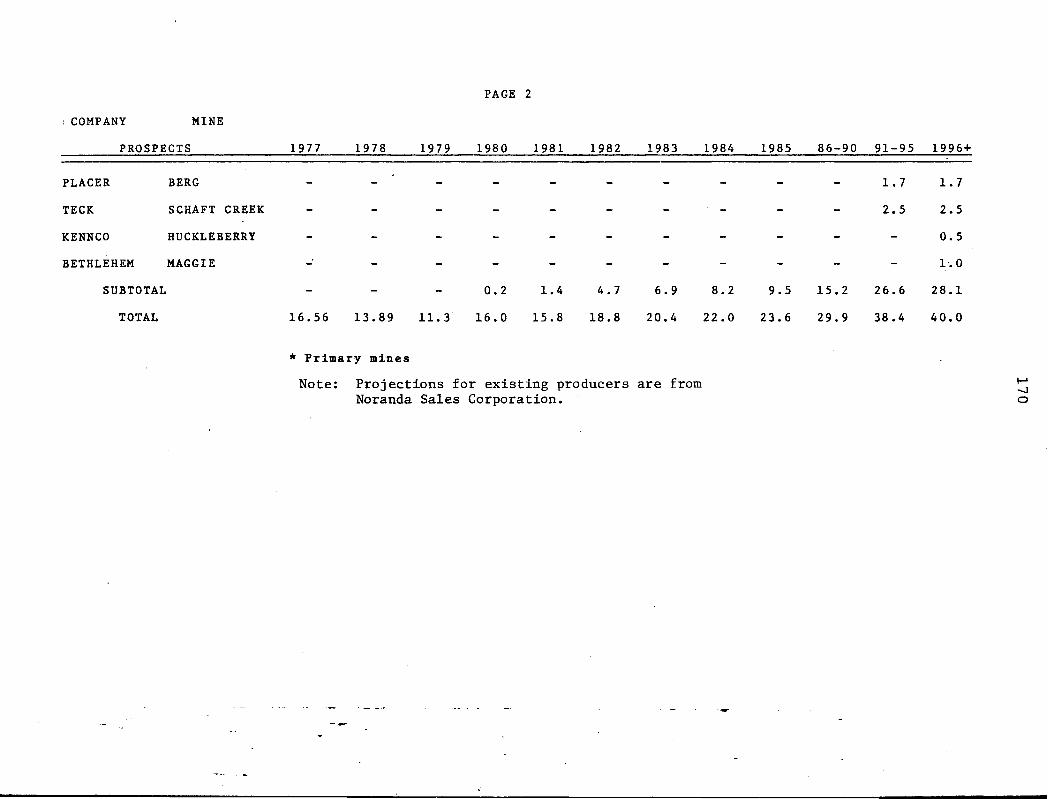
PAGE 2
( COMPANY MINE
PROSPECTS 1977 1978 1979 1980 1981 1982 1983 1984 1985 86-90 91-95 1996+
PLACER BERG - - - - - - - - - - 1.7 1.7
TECK SCHAFT CREEK - - - - - - - - - - 2 . 5 2 . 5
KENNCO HUCKLEBERRY - - - - - - - - - - - 0.5
BETHLEHEM MAGGIE - - - - - - - - - - - - 1.0
SUBTOTAL - - - 0.2 1.4 4.7 6.9 8.2 9.5 15.2 26.6 28.1
TOTAL 16.56 13.89 11.3 16.0 15.8 18.8 20.4 22.0 23.6 29.9 38.4 40.0
* Primary mines
Note: Projections f o r e x i s t i n g producers are from ^ Noranda Sales Corporation. o

APPENDIX TABLE A - 4
PROJECTED MOLYBDENUM SUPPLY: UNITED STATES
(millions of pounds contained molybdenum) * primary mines
1977 1978 1979 1980 1981 1982 1983 1984 1985 1986-1990 1991-1995
AMAX * CLIMAX 51.0 52.0 50.0 53.0 53.0 53.0 53.0 53.0 53.0 55.0 55.0 * HENDERSON 24.0 32.5 45.0 48.0 50.0 50.0 50.0 50.0 50.0 50.0 50.0
DUVAL SIERRITA 19.0 18.0 18.0 18.0 20.0 25.0 25.0 25.0 25.0 25.0 25.0 MINERAL PARK 3.2 3.0 3.0 3.0 3.0 3.0 3.0 3.0 3.0 3.0 3.0 ESPERANZA - - 1.5 3.0 3.5 3.5 3.5 - - -KENNECOTT BINGHAM 6.5 9.2 9.5 10.0 10.5 10.5 10.5 10.5 10.5 10.5 10.5 RAY 0.5 0.7 0.7 0.7 0.7 0.7 0.7 0.7 0.7 1.0 1.0 McGILL 0.2 0.3 0.3 0.3 0.3 0.3 0.3 0.3 0.3 0.3 0.3 CHINO 0.6 0.6 0.6 0.6 0.6 0.6 0.6 0.6 0.6 0.6 0.6
MOLYCORP* * QUESTA 8.1 5.5 5.0 4.5 4.0 3.0 - - - - _ ANAMAX TWIN BUTTES 3.7 3.1 3.7 3.7 3.7 3.7 3.7 3.7 3.7 3.7 3.7 MAGMA SAN MANUEL 2.7 3.0 3.0 3.0 3.0 3.0 3.0 3.0 3.0 3.0 3.0 CYPRUS BAGDAD 0.4 2.5 2.5 2.5 2.5 2.5 2.5 2.5 2.5 2.5 2.5
PIMA 1.2 - 0.6 1.2 1.8 1.8 1.8 1.8 1.8 1.8 1.8 ASARCO MISSION 0.3 0.3 0.3 0.5 0.5 0.5 0.5 0.5 0.5 0.5 0.5
SILVERBELL - 0.1 0.3 0.3 0.3 0.3 0.3 0.3 0.3 0.3 0.3 CITIES PINTO VALLEY 0.3 0.5 0.6 0.6 0.6 0.6 0.6 0.6 0.6 0.6 0.6 INSPIRATION INSPIRATION - - 0.3 0.4 0.5 0.5 0.5 0.5 0.5 0.5 0.5 UNION CARBIDE PINE CREEK 0.4 0.5 0.4 0.4 0.4 0.4 0.4 0.4 0.4 0.4 0.4
SUBTOTAL 122.1 131.8 145.3 153.7 158.9 162.9 159.9 156.4 156.4 158.7 158.7
PROSPECTS
COMPANY MINE
EXISTING MINES
PHELPS DODGE TYRONE - - 0.6 0.8 1.0 1.2 1.2 1.2 1.2 1.2 1.2 ANACONDA CARR FORK - - - 0.4 0.4 0.4 0.4 0.4 0.4 0.4 0.4 CYPRUS * THOMPSON CREEK - - - - - - 10.0 15.0 20.0 20.0 20.0 MOLYCORP * GOAT HILL - - - - - - 9.0 13.5 18.0 20.0 20.0 AMAX MT. TOLMAN - - - - - - - - 5.0 25.0 25.0 AMAX * MT. EMMONS - - - - - - - - - 5.0 30.0 US BORAX * QUARTZ HILL - - - - - - - - - 25.0 25.0 PHELPS DODGE * PINE GROVE - - - - - - - - - - 20.0 ANACONDA THE HALL - - - - - - - - - - 10.0
SUBTOTAL - - 0.6 1.2 1.4 1.6 20.6 30.1 49.6 96.6 151.6 TOTAL 122.1 131.8 145.9 154.9 160.3 164.5 180.5 186.4 201.0 255.3 310.3

APPENDIX TABLE A - 5
SOUTH AMERICA CURRENT AND PROJECTED MOLYBDENUM PRODUCTION ( m i l l i o n s of pounds)
RESERVES COMPANY MINE 1977 1978 1979 1980 1981 1982 1983 1984 1985 86-•90 91-95 1000 tons
CHILE
Codelco Chuquicamata 15.34 19.70 19.4 19.4 19.4 19.4 21 .0 23.0 25.0 25. 5 25.4 814. 0 E l Tennente 4*79 6.11 6.0 6.0 6.0 6.0 7.0 8.0 9.0 11. 0 12.0 1521. 2 E l Salvador 3.20 2.71 3.0 3.7 4.0 4.0 4.0 4.0 4.0 4. 0 4.0 78. 8 Andina 0.77 0.58 0.7 0.7 0.7 0.7 0.7 0.7 0.7 1. 0 1.0 69. 5
Anaconda Los Pelambras - - - - - - - - - 2. 0 2.0 139. 5 Nippon Mines Cerro Colorado - - - - - - - - - 2. 2 2.5 9. 9 Exxon Dispatada - - - - - - - — — 0. 3 0.3 70. 6
CHILE TOTAL 24.10 29.09 29.1 29.8 30.1 30.1 32.7 35.7 38.7 45. 9 47.2 2703. 5
PERU
South Peru Toquepala 0.50 0.55 0.6 1.0 1.0 1.0 1.0 1.0 1.0 1. 8 1.8 154. 3 Caujone - - - - 2.0 3.0 3.2 3.2 3.2 3. 2 3.2 150. 0
Minero Peru M i c h i q u i l l a y '- - - - - - 1.0 2.0 3. 0 4.4 126. 8
PERU TOTAL 0.50 0.55 0.6 1.0 3.0 4.0 4.2 5.2 6.2 8. 0 9.4 458. 6
ARGENTINA
St. Joe E l Pachon - - - - - - - - - 1. 6 2.0 128. 0
SOUTH AMERICA TOTAL 24.60 29.64 29.7 30.8 33.1 34.1 36.9 40.9 44.9 55. 5 58.6
t o
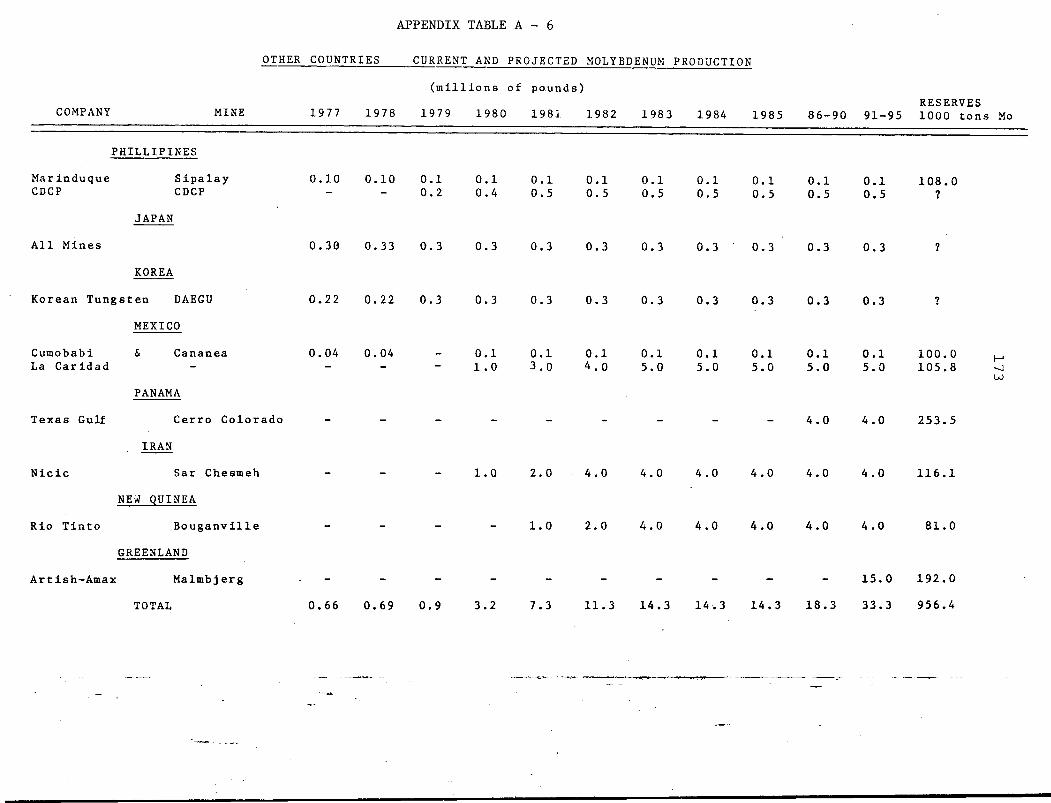
APPENDIX TABLE A - 6
COMPANY
OTHER COUNTRIES CURRENT AND PROJECTED MOLYBDENUM PRODUCTION
( m i l l i o n s of pounds) RESERVES
MINE 1977 1978 1979 1980 1981 1982 1983 1984 1985 86-90 91-95 1000 tons Mo
PHILLIPINES
Mar induque CDCP
A l l Mines
S i p a l a y CDCP
JAPAN
KOREA
Korean Tungsten DAEGU
MEXICO
Cumobabi & Cananea La C a r i d a d
PANAMA
0,10 0,10 0.1 0.2
0.1 0.4
0.1 0.5
0.1 0.5
0.1 0.5
0.1 0.5
0.1 0.5
0.1 0.5
0.04 0.04
Texas Gulf Cerro Colorado
IRAN
0.1 0.5
0.30 0.33 0.3 0.3 0.3 0.3 0.3 0.3 0.3 0.3 0.3
0.22 0.22 0.3 0.3 0.3 0.3 0.3 0.3 0.3 0.3 0.3
108.0 ?
0.1 0.1 0.1 0.1 0.1 0.1 0.1 0.1 100.0 1.0 3.0 4.0 5.0 5.0 5.0 5.0 5.0 105.8
4.0 4.0 253.5
N i c i c Sar Chesmeh
NEtf QUINEA
Rio T i n t o B o u g a n v i l l e
GREENLAND
1.0 2.0 4.0 4.0 4.0 4.0 4.0 4.0 116.1
1.0 2.0 4.0 4.0 4.0 4.0 4.0 81.0
Artish-Amax Malmbjerg 15.0 192.0
TOTAL 0.66 0.69 0.9 3.2 7.3 11.3 14.3 14.3 14.3 18.3 33.3 956.4
Province of British Columbia
Ministry of Energy, Mines and Petroleum Resources