Molly E Brown, PhD CLIMATE CHANGE AND FOOD SECURITY… · CLIMATE CHANGE AND FOOD SECURITY: THE...
22
CLIMATE CHANGE AND FOOD SECURITY: THE VIEW FROM SPACE Molly E Brown, PhD https://ntrs.nasa.gov/search.jsp?R=20120015637 2018-08-20T20:10:11+00:00Z
-
Upload
phungnguyet -
Category
Documents
-
view
217 -
download
0
Transcript of Molly E Brown, PhD CLIMATE CHANGE AND FOOD SECURITY… · CLIMATE CHANGE AND FOOD SECURITY: THE...

CLIMATE CHANGE AND FOOD SECURITY: THE VIEW FROM SPACE
Molly E Brown, PhD
https://ntrs.nasa.gov/search.jsp?R=20120015637 2018-08-20T20:10:11+00:00Z
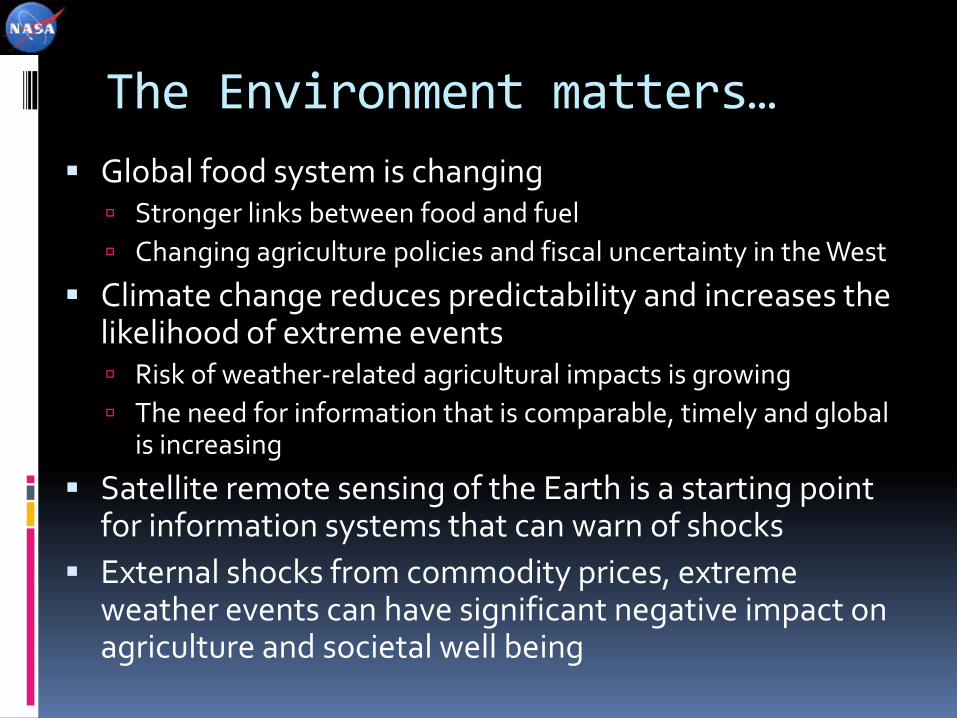
The Environment matters… Global food system is changing Stronger links between food and fuel Changing agriculture policies and fiscal uncertainty in the West
Climate change reduces predictability and increases the likelihood of extreme events Risk of weather-related agricultural impacts is growing The need for information that is comparable, timely and global
is increasing
Satellite remote sensing of the Earth is a starting point for information systems that can warn of shocks
External shocks from commodity prices, extreme weather events can have significant negative impact on agriculture and societal well being
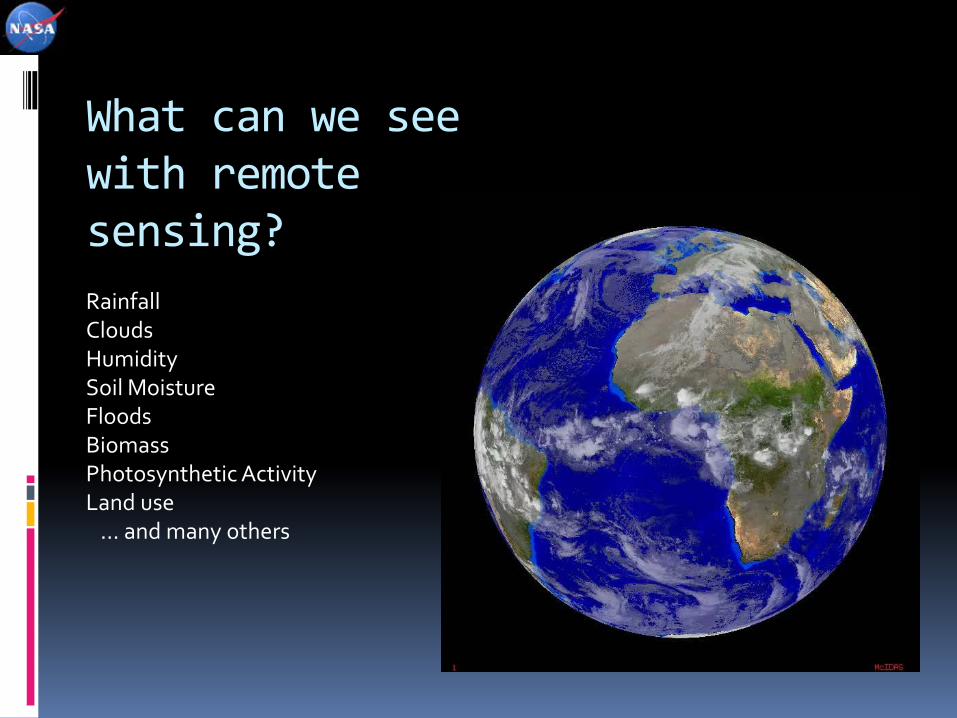
What can we see with remote sensing? Rainfall Clouds Humidity Soil Moisture Floods Biomass Photosynthetic Activity Land use … and many others


Real-time rainfall data are being used for flood forecasting, but in many developing countries rain gauging stations are either not available or are to sparsely available to develop representative aerial samples. Satellite-derived rainfall products are useful for flood forecasting.
Rainfall data from satellites
Flooding event in Pakistan, India, and Thailand 2004
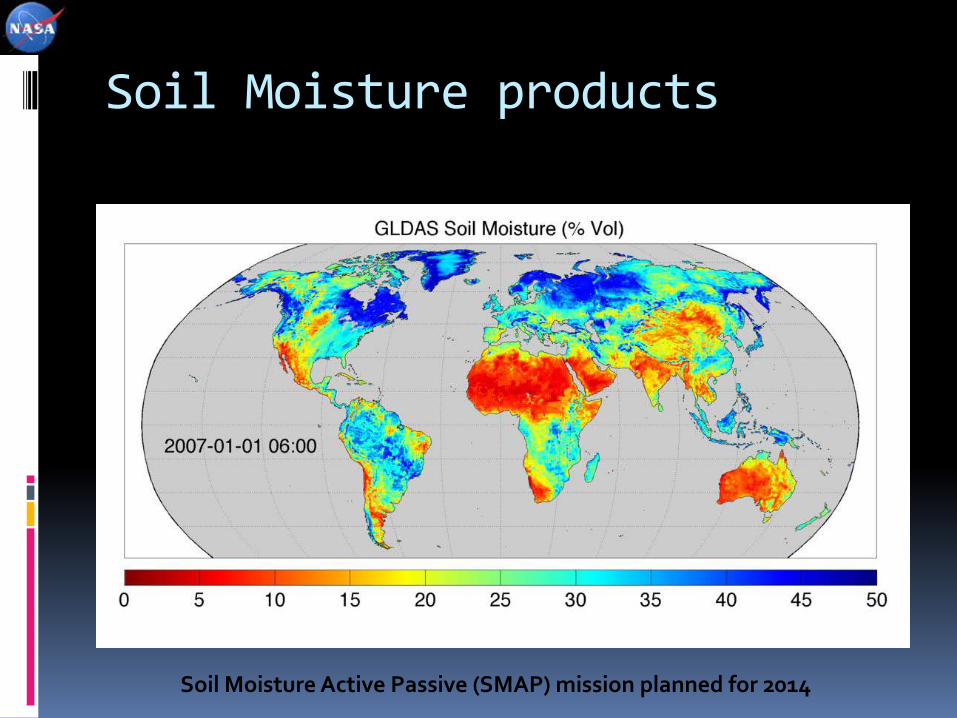
Soil Moisture products
Soil Moisture Active Passive (SMAP) mission planned for 2014

Vegetation Index Seasonality
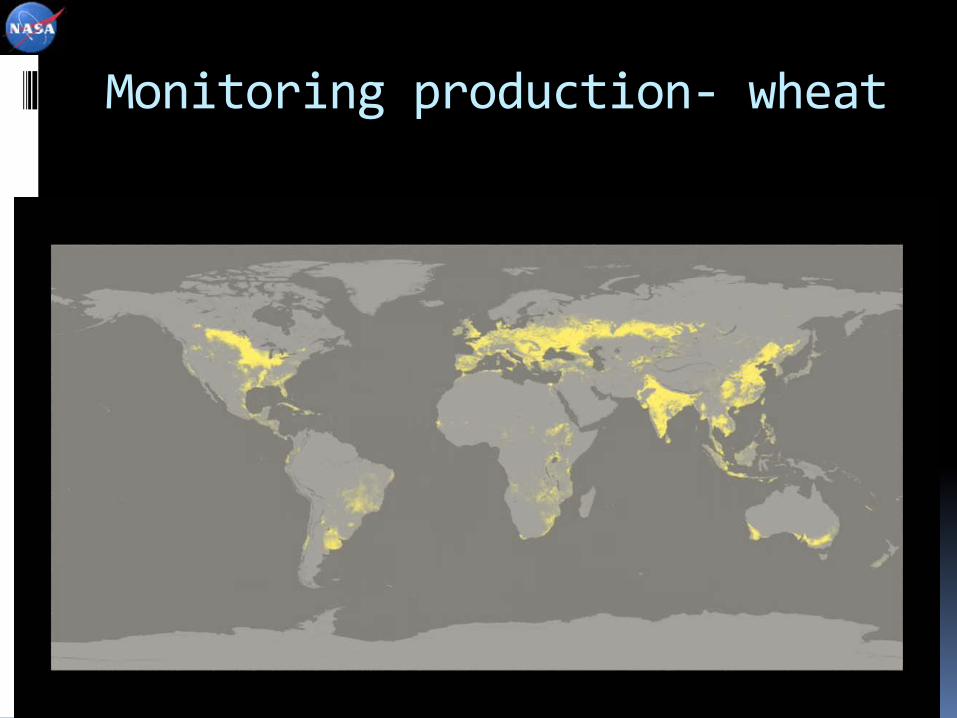
Monitoring production- wheat

Increasing the Usefulness of these data products… Integrated management products that bring
economics and supply concerns together with weather Early warning systems for food security Global Drought Information systems
Understanding Risk – estimating the impact within a structure that links causes to consequences
Detecting and responding to trends

Increases in Agricultural Production Number-fold increase in 135 years (1861-1996)
World food production 1.97
Land under cultivation 1.098
Proportion of irrigated land 1.68
Nitrogen Fertilization 6.87
Phosphorus Fertilization 3.48
Increase in world food production and agricultural inputs from 1961 to 1996 based on FAO data
Lambin et al (2003) Annual Rev. Environ. Resour.
70
75
80
85
90
95
100
105
110
1961 1966 1971 1976 1981 1986 1991 1996 2001 2006
Pro
duct
ion
Inde
x
Gross per Capita Production Index Number (2004-2006 = 100)
Agriculture
Cereals
Crops
Food

11
Food Demand, Markets and Ecosystems: influence of Climate Change
As populations and incomes rise, the global demand for food will also grow – probably roughly doubling by 2050 and shifting towards more water-demanding diets.
Agricultural Production
Rising diet expectations
Market forces
Variable Rainfall
Growing population
Rising temperatures
Climate Change
Increasing land area in cultivation
Global Demand for Natural resources
Landscape alterations Technology
IAASTD 2008
ET and rising water demand
8/31/11
Greenhouse Gases from Animals and Agricultural activity

Poverty Is the Root of Household Food Insecurity and Hunger 925 million people suffer under-nutrition or hunger. 1.4 billion people live on less than $1.25 per day; 70% of
them are rural, and most of these depend on farming for their incomes
40% of the world’s population live on less than $2.00 per day.
Hunger is due mainly to poverty except in times of war, natural disaster or politically-imposed famine.
The rich in no country go hungry. To solve the world’s hunger problem, the world poverty
problem must be solved.
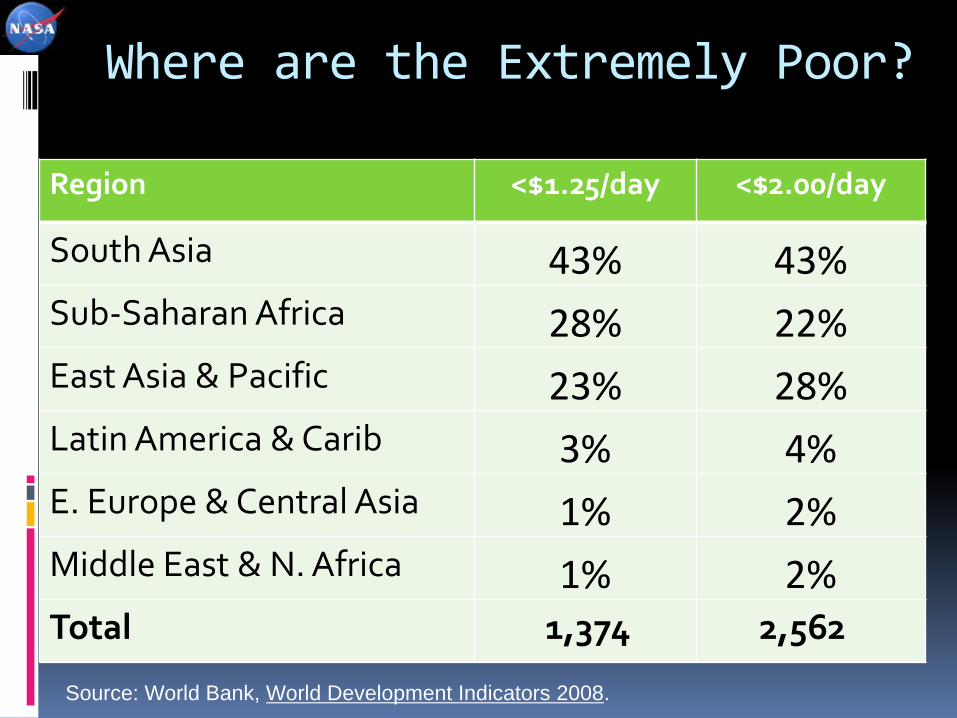
Where are the Extremely Poor?
Region <$1.25/day <$2.00/day
South Asia 43% 43% Sub-Saharan Africa 28% 22% East Asia & Pacific 23% 28% Latin America & Carib 3% 4% E. Europe & Central Asia 1% 2% Middle East & N. Africa 1% 2% Total 1,374 2,562
Source: World Bank, World Development Indicators 2008.

Higher Food Prices Increase the Incidence of Hunger Low income people spend a large fraction of
their incomes on food, so higher food prices reduce their purchasing power
The 2008 and 2010-12 price spike increased number of people suffering hunger to over 1 billion and precipitated political crises in many countries. When international prices are high, local food
production becomes more important Providing early and accurate information about
the impacts of weather on production can reduce food security crises
15
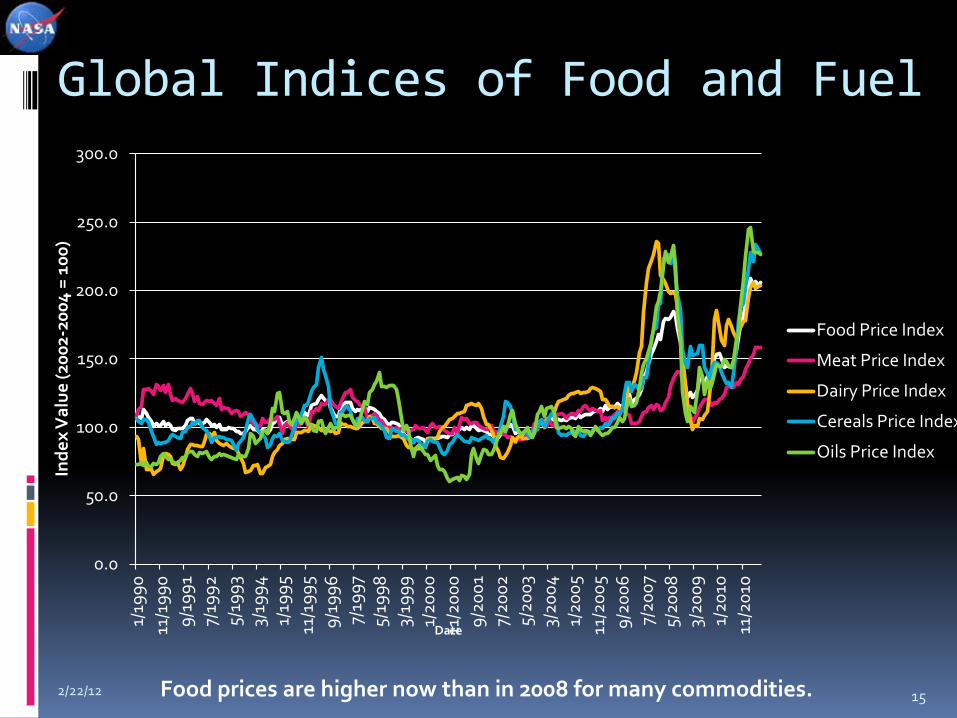
Global Indices of Food and Fuel
0.0
50.0
100.0
150.0
200.0
250.0
300.0 1/
1990
11
/199
0 9/
1991
7/
1992
5/
1993
3/
1994
1/
1995
11
/199
5 9/
1996
7/
1997
5/
1998
3/
1999
1/
2000
11
/200
0 9/
2001
7/
2002
5/
2003
3/
2004
1/
2005
11
/200
5 9/
2006
7/
2007
5/
2008
3/
2009
1/
2010
11
/201
0
Inde
x V
alue
(200
2-20
04 =
100
)
Date
Food Price Index
Meat Price Index
Dairy Price Index
Cereals Price Index
Oils Price Index
Food prices are higher now than in 2008 for many commodities. 2/22/12

Impact of price volatility
From FAO Report 2011 State of food Insecurity
Thailand

Projected World Food Demand World food demand could double in first half
of 21st century: 50% increase from world population growth –
from 6 to 9 billion – almost all in LDCs. 50% increase from broad-based economic
growth in low income countries The World Bank has estimated the number of
people in developing countries in households with incomes >$16,000/year will rise from 352 million in 2000 to 2.1 billion by 2030.
How many presently low income consumers escape from poverty is the most important determinant of future global demand for food.

Larger Fraction of Agricultural Production to Move Through Trade
With population growth, urbanization and broad-based economic development, many low-income countries’ food consumption will outstrip their production capacity, and they will become larger net importers.
South Asia15%
Middle East and North Africa
4%
Latin America and Caribbean
10%
Europe and Central Asia
20%
East Asia and the Pacific14%
Africa11%
OECD Countries26%
OECD Countries14%
South Asia22%
Latin America and Caribbean
9%
Middle East and North Africa
5% Europe and Central Asia
8%
East Asia and the Pacific31%
Africa11%
Distribution of Arable Land Distribution of World Population

Yield growth is projected to decline due to a changing climate
Funk and Brown, 2009, Food Security Journal

Investment in Information…
For improved water management to ensure all needs are met, domestic, agricultural, industrial risks of negative impacts of extreme events reduced
To boost yields in good years in places with low productivity
To provide support to the poor to ensure minimum consumption
To invest in infrastructure to reduce transaction costs, facilitate trade Poverty causes food insecurity, not lack of food

Global Flood Monitoring System (GFMS)

Summary Information on environment Global satellite data provides information on land
use, rainfall, soil moisture, vegetation vigor and crop yields
Process-based products allows transformation of these data into information that can be used to assess impact of weather on commodity prices and local economic health
Trends and impact of climate change
Linking yields, weather and prices is critical to ensure food security for all