Molecular weight distribution of dissolved organic materials in seawater determined by...
17
Marine Chemistry, 16 (1985) 155--171 155 Elsevier Science Publishers B.V., Amsterdam -- Printed in The Netherlands MOLECULAR WEIGHT DISTRIBUTION OF DISSOLVED ORGANIC MATERIALS IN SEAWATER DETERMINED BY ULTRAFILTRATION: A RE-EXAMINATION DAVID J. CARLSON College of Oceanography, Oregon State University, Corvallis, OR 97331 (U.S.A.) MARY LOUISE BRANN and TIMOTHY H. MAGUE Bigelow Laboratory for Ocean Sciences, West Boothbay Harbor, ME 04575 (U.S.A.) LAWRENCE M. MAYER Program in Oceanography, University of Maine at Orono, Walpole, ME 04573 (U.S.A.) (Received July 16, 1984; revision accepted January 3, 1985) ABSTRACT Carlson, D.J., Brann, M.L., Mague, T.H. and Mayer, L.M., 1985. Molecular weight distri- bution of dissolved organic materials in seawater determined by ultrafiltration: a re- examination. Mar. Chem., 16: 155--171. Most of the dissolved organic materials (DOM) in coastal Maine, Gulf of Maine, and North Atlantic seawaters had molecular weights (MW), determined by ultrafiltration, less than 1000. Only 34% of the DOM had MW greater than 1000, only 6% had MW greater than 30 000, and only 1% was of MW greater than 100 000. The majority of ultrafilter- derived MW data are consistent with patterns shown here; earlier reports of high-MW DOM in seawater were apparently exaggerated due to procedural and ultrafilter artifacts. It is also shown that most ultrafiltration data do not clearly indicate loss of high-MW DC VI during estuarine mixing, and that apparent removal could result from decreased ret( ltion as ionic strength increases. INTRODUCTION In the decade since Ogura (1974) demonstrated molecular weight (MW) fractionation c ~ dissolved organic materials (DOM) in seawater by ultra- filtration, the technique has been used in several studies of DOM (e.g., Maurer, 1976; Wheeler, 1976; Baturina et al., 1977) and in studies of inter- actions between DOM and other seawater materials, especially trace metals (Andren and Harriss, 1975; Gillespie and Vaccaro, 1978; Waslenchuk and Windom, 1978; Moore et al., 1979; Srna et al., 1980; Takayanagi and Wong, 1984). However, ultrafiltration in seawater is burdened by some uncertainties which have not been resolved in the course of its increasing use. Some of these, such as imprecisions in retention characteristics and closely related questions of molecular size vs. weight relationships, have been publicized (Ogura, 1974; Wheeler, 1976) and are evidently acceptable limitations. Other uncertainties which have received less attention may be less easy to accommodate. One of the latter derives from the predominant method of 0304-4203/85/$03.30 © 1985 Elsevier Science Publishers B.V.
-
Upload
david-j-carlson -
Category
Documents
-
view
213 -
download
0
Transcript of Molecular weight distribution of dissolved organic materials in seawater determined by...
Marine Chemistry, 16 (1985) 155--171 155 Elsevier Science Publishers B.V., Amsterdam -- Printed in The Netherlands
M O L E C U L A R W E I G H T D I S T R I B U T I O N O F D I S S O L V E D O R G A N I C M A T E R I A L S IN S E A W A T E R D E T E R M I N E D BY U L T R A F I L T R A T I O N : A R E - E X A M I N A T I O N
DAVID J. CARLSON
College of Oceanography, Oregon State University, Corvallis, OR 97331 (U.S.A.)
MARY LOUISE BRANN and TIMOTHY H. MAGUE
Bigelow Laboratory for Ocean Sciences, West Boothbay Harbor, ME 04575 (U.S.A.)
LAWRENCE M. MAYER
Program in Oceanography, University of Maine at Orono, Walpole, ME 04573 (U.S.A.)
(Received July 16, 1984; revision accepted January 3, 1985)
ABSTRACT
Carlson, D.J., Brann, M.L., Mague, T.H. and Mayer, L.M., 1985. Molecular weight distri- bution of dissolved organic materials in seawater determined by ultrafiltration: a re- examination. Mar. Chem., 16: 155--171.
Most of the dissolved organic materials (DOM) in coastal Maine, Gulf of Maine, and North Atlantic seawaters had molecular weights (MW), determined by ultrafiltration, less than 1000. Only 34% of the DOM had MW greater than 1000, only 6% had MW greater than 30 000, and only 1% was of MW greater than 100 000. The majority of ultrafilter- derived MW data are consistent with patterns shown here; earlier reports of high-MW DOM in seawater were apparently exaggerated due to procedural and ultrafilter artifacts. It is also shown that most ultrafiltration data do not clearly indicate loss of high-MW DC VI during estuarine mixing, and that apparent removal could result from decreased ret( ltion as ionic strength increases.
INTRODUCTION
In the decade since Ogura (1974) d e m o n s t r a t e d mo lecu l a r weight (MW) f r a c t i o n a t i o n c ~ dissolved organic mate r ia l s (DOM) in seawate r by ultra- f i l t ra t ion , the t e c h n i q u e has been used in several s tudies o f DOM (e.g., Maurer , 1976; Wheeler , 1976 ; Ba tu r ina e t al., 1977) and in s tudies of inter- ac t ions b e t w e e n DOM and o t h e r seawate r mater ia ls , especia l ly t race me ta l s (Andren and Harriss, 1975 ; Gil lespie and Vaccaro , 1978; Was lenchuk and Windom, 1978; Moore e t al., 1979 ; Srna et al., 1980; T a k a y a n a g i and Wong, 1984) . Howeve r , u l t r a f i l t r a t ion in seawate r is b u r d e n e d b y s o m e uncer ta in t ies which have n o t been resolved in the course o f its increasing use. S o m e o f these , such as imprec i s ions in r e t e n t i o n charac ter i s t ics and closely re la ted ques t ions o f mo lecu l a r size vs. we igh t re la t ionships , have been publ ic ized (Ogura, 1974 ; Wheeler , 1976) and are ev iden t ly accep tab le l imi ta t ions . O t h e r uncer ta in t i e s which have received less a t t e n t i o n m a y be less easy to a c c o m m o d a t e . One o f the la t te r derives f r o m the p r e d o m i n a n t m e t h o d o f
0304-4203/85/$03.30 © 1985 Elsevier Science Publishers B.V.
156
measuring ultrafiltered solutions. Retent ion by ultrafilters has generally been determined by measuring amounts of DOM in ultrafiltrates relative to original solutions, that is, by difference. However, contamination corrections applied to filtrates may have exaggerated differences between filtrates and initial solutions, thereby biasing calculated retention. Direct measurements of DOM retained or concentrated by ultrafilters have rarely been reported, and there are no reports of simultaneous measurements of ultrafiltrate and concentrate to derive mass balances. Another uncertainty involves possible rejection of polyelectrolyte DOM by charged sites on ultrafilters, sites whose number and charge differ on different MW cut-off filters. Such electrostatic rejection will vary with solution ionic strength, so that in estuarine waters DOM retention patterns may reflect differential rejection rather than actual MW characteristics.
As increased at tention is given to seawater reactions which result in larger- MW DOM (Harvey et al., 1983; Carlson et al., 1985) and to MW as a factor in trace element--organic interactions, DOM transport through estuaries (Sigleo and Helz, 1981; Mantoura and Woodward, 1983), and biological cycling of DOM (e.g., Hollibaugh and Azam, 1983), resolution or at least assessment of these ultrafiltration uncertainties is necessary. We present MW data derived from measurements of both ultrafiltrates and concentrates of a series of oceanic samples and reassess ultrafiltration data accumulated to date.
METHODS
Samples were taken during the summer of 1980 at 19 locations in coastal Maine waters, the Gulf of Maine, and the North Atlantic (40°32.7 'N, 60°55.6'W and 39°30.6 'N, 66°20.7'W). At most stations, a near-surface (0--20 m) and a deeper (20--75 m, with one of 3500 m) sample were collected with acid-cleaned, double-distilled water (DDW)-rinsed Niskin bottles and drained directly into combusted (450°C) glass flasks. Samples were pre- filtered through DDW-rinsed, combusted, and rerinsed GF/F glass-fiber filters.
Ultrafiltrations were done shipboard and in the laboratory, generally within 6 h and always within 18 h of collection. Samples were refrigerated if ultrafiltration was delayed for more than 2 h. Amicon 43 mm diameter ultra- filtration membranes UM-2 (nominal MW cut-off = 1000), PM-30 (30 000), and XM-100 (100 000) were used for every sample. More extensive sepa- rations were made on a few samples using Amicon UM-05 {500), YM-5 (5000), UM- and PM-10 (10 000), UM-20 (20000) , XM-50 (50 000), and XM-300 (300000) membranes in addition to the ultrafilters listed above. Ultrafiltration was done in 60-ml stirred cells under N 2 pressures appropriate to the individual ultrafilters, 70 psi for those with MW cut-off < 30 000 and 10psi for those ~ 3 0 0 0 0 , except 25psi for the XM-50. Ultrafilters were soaked and rinsed thoroughly with DDW before any use, cleaned between
157
uses by ultrasonication in 0.1N NH4OH, and stored in DDW with 0.02% sodium azide. Each filter was checked for leaching of organic materials before being used for any sample, and complete records of types and volumes of solutions filtered were maintained for every filter.
In use, ultrafiltration membranes were placed in filtration cells and then rinsed by passing DDW followed by 5 ml of sample through the filters, taking care not to let the filters go dry and discarding the rinses. Next, 55 ml of sample were added and 30 ml filtered, discarding the first ml. Aliquots of concentrated solutions remaining above the ultrafilters and of filtrates were immediately acidified and sealed in ampules for subsequent dissolved organic carbon (DOC) assays (Menzel and Vaccaro, 1964; Sharp, 1973a). Precision (+ 95% CI) of DOC measurements was better than + 0.05 mg1-1 .
From these data, mass balances and retention were calculated. For mass balance, the sum of carbon in filtrate and in concentrate should have been equal to the amount of carbon in the original volume. Mass balances greater than 100% indicated contamination, assignable to ultrafiltrates when per volume DOC concentrations in filtrates exceeded initial DOC concentrations or to concentrates if absolute amounts of carbon in concentrates exceeded total amount in original volume. Retention was calculated from the excess of carbon in the concentrates: amount of carbon in concentrate minus amount in an equivalent volume of the original sample, corrected for volume reduction during filtration.
RESULTS
A total of 31 samples was ultrafiltered. Total DOC concentrations ranged from 0.54 mg 1-1 in the deepest sample to 5.03 mg 1-1 in a nearshore sample. Most samples (n = 24) had DOC concentrations in the range 0.80--2.02 mg 1-1. Salinities of all samples were ~ 30~/00.
Contamination
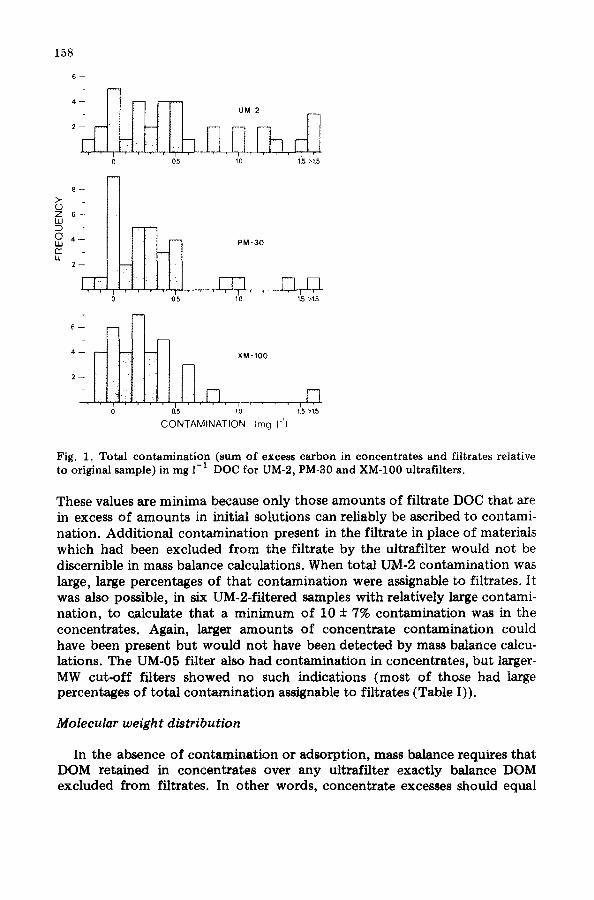
In some instances samples were ultrafiltered without measurable contami- nation but in many instances contamination was present. UM-2, PM-30, and XM-100 ultrafilters were used frequently and of those the UM-2 filters had the most frequent and largest contamination (Fig. 1). In general, contami- nation was lower from filters with cut-offs ~ 5000 MW (Table I). Except in the case of one UM-2 filter (UM-2d, Table I) which had consistently low contamination, no significant differences were observed in contamination characteristics among filters within a cut-off designation. Contamination from individual filters did not decrease with increased use, relatively large contamination was frequently followed by instances of little or no contami- nation, and total contamination was not related to total DOC of the samples. When contamination was observed in UM-2 systems, an average of at least 25 + 9% (~ + 95% CI, n -- 27) of the total contamination was in the filtrates.
158
6 - -
2 - -
0 0.5 10 1,5 >1.5
8 - - >- 0 Z 6 - - LU
0 4 - - UJ c r LL
2 - -
P M - 3 0
. , r ,.N 0 05 10 1.5 >1.5
6 - -
4 - - X M - 1 0 0
2 - -
' 1 . . . . I . . . . I 0 0.5 1.0 1.5 >1.5
C O N T A M I N A T I O N ( m g 14)
Fig. 1. Total contamination (sum of excess carbon in concentrates and filtrates relative to original sample) in mg 1 -I DOC for UM-2, PM-30 and XM-100 ultrafilters.
These values are minima because only those amounts of filtrate DOC that are in excess of amounts in initial solutions can reliably be ascribed to contami- nation. Additional contamination present in the filtrate in place of materials which had been excluded from the filtrate by the ultrafilter would not be discernible in mass balance calculations. When total UM-2 contamination was large, large percentages of that contamination were assignable to filtrates. It was also possible, in six UM-2-filtered samples with relatively large contami- nation, to calculate that a minimum of 10 + 7% contamination was in the concentrates. Again, larger amounts of concentrate contamination could have been present but would not have been detected by mass balance calcu- lations. The UM-05 filter also had contaminat ion in concentrates, but larger- MW c u t - o f f filters showed no such indications (most of those had large percentages of total contaminat ion assignable to filtrates (Table I)).
Molecular weight distribution
In the absence of contamination or adsorption, mass balance requires that DOM retained in concentrates over any ultrafilter exactly balance DOM excluded from filtrates. In other words, concentrate excesses should equal
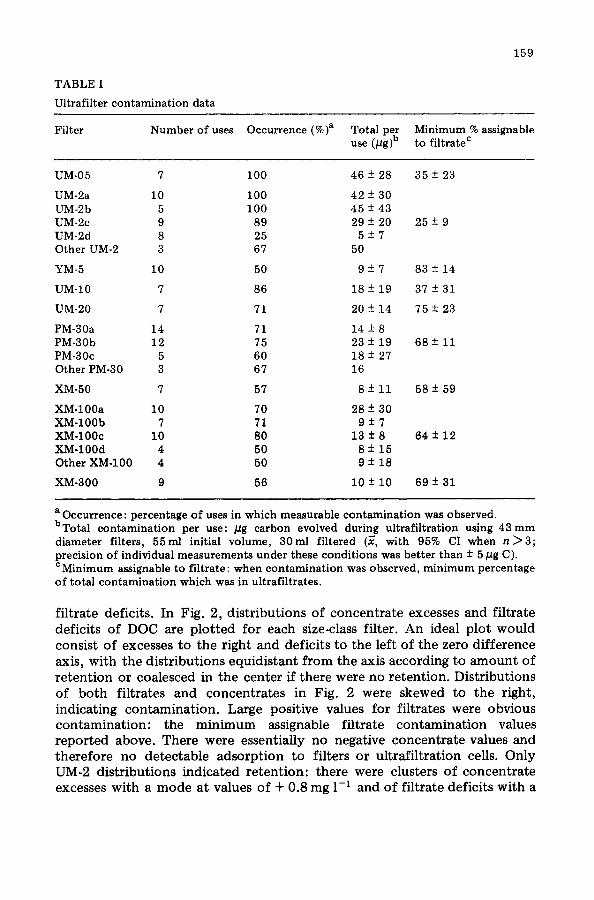
TABLE I
Ultrafilter contamination data
159
Filter Number of uses Occurrence (%)a Total per Minimum % assignable use (pg)b to filtrate c
UM-05 7 100 46 -+ 28 35 + 23
UM-2a 10 100 42 -+ 30 UM-2b 5 100 45 -+ 43 UM-2c 9 89 29 + 20 25 + 9 UM-2d 8 25 5 + 7 Other UM-2 3 67 50
YM-5 10 50 9 + 7 83 -+ 14
UM-10 7 86 18 + 19 37 -+ 31
UM-20 7 71 20 + 14 75 + 23
PM-30a 14 71 14 -+ 8 PM-30b 12 75 23 + 19 68 + 11 PM-30c 5 60 18 + 27 Other PM-30 3 67 16
XM-50 7 57 8 + 11 58 -+ 59
XM-100a 10 70 28 -+ 30 XM-100b 7 71 9 -+ 7 XM-100c 10 80 13 ± 8 64 + 12 XM-100d 4 50 8 + 15 Other XM-100 4 50 9 ± 18
XM-300 9 56 10 ± 10 69 ± 31
a Occurrence : percentage of uses in which measurable contamination was observed. bTotal contamination per use: #g carbon evolved during ultrafiltration using 43ram diameter filters, 55ml initial volume, 30ml filtered (~, with 95% CI when n ~ 3 ; precision of individual measurements under these conditions was better than -+ 5 pg C). c Minimum assignable to filtrate: when contamination was observed, minimum percentage of total contamination which was in ultrafiltrates.
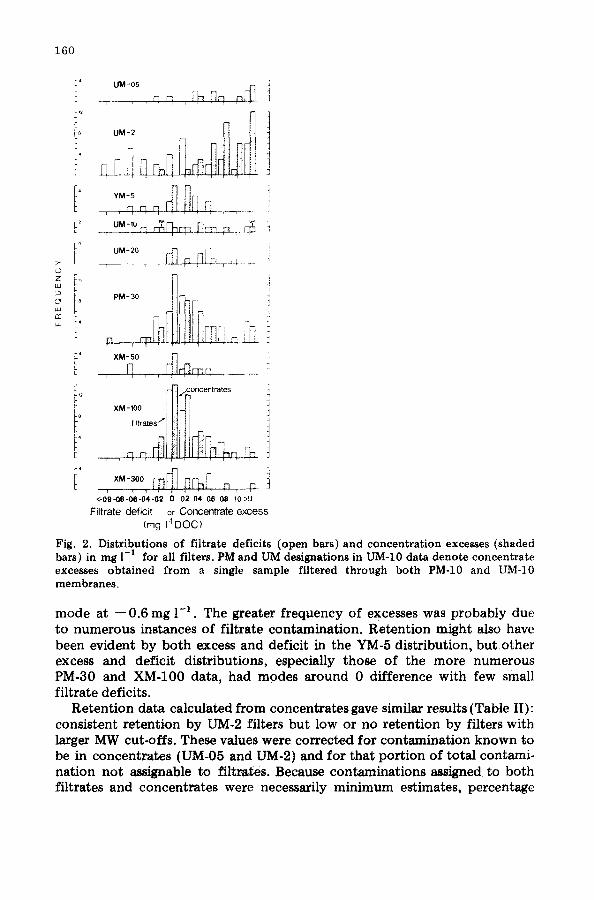
f i l t r a t e def ic i t s . I n Fig. 2, d i s t r i b u t i o n s o f c o n c e n t r a t e excesses a n d f i l t r a t e de f i c i t s o f D O C are p l o t t e d fo r each size-class f i l ter . A n ideal p l o t w o u l d cons i s t o f excesses to t h e r igh t a n d de f i c i t s t o t h e le f t o f t h e zero d i f f e r e n c e
axis , w i t h t h e d i s t r i b u t i o n s e q u i d i s t a n t f r o m t h e axis a c c o r d i n g to a m o u n t o f r e t e n t i o n o r coa l e sced in t h e c e n t e r if t h e r e were n o r e t e n t i o n . D i s t r i b u t i o n s o f b o t h f i l t r a t e s a n d c o n c e n t r a t e s i n Fig. 2 w e r e s k e w e d to t h e r igh t , i n d i c a t i n g c o n t a m i n a t i o n . Large pos i t i ve va lues fo r f i l t r a t e s we re o b v i o u s c o n t a m i n a t i o n : t he m i n i m u m ass ignab le f i l t r a t e c o n t a m i n a t i o n va lues r e p o r t e d above . T h e r e w e r e e s sen t i a l l y n o nega t i ve c o n c e n t r a t e va lues a n d t h e r e f o r e n o d e t e c t a b l e a d s o r p t i o n t o f i l t e r s o r u l t r a f i l t r a t i o n cells. O n l y UM-2 d i s t r i b u t i o n s i n d i c a t e d r e t e n t i o n : t h e r e were c lus te r s o f c o n c e n t r a t e excesses w i t h a m o d e a t va lues o f + 0 .8 m g 1 -~ a n d o f f i l t r a t e de f i c i t s w i t h a
160
. . . . ,rbP p
UM-2 ! t I
J , i , i
YM-5
UM-20 0
LuOff ~ Ii PM-30 I t
p r-n q , f E 1 ,
a ~ r T l r ~ i r i p r t , r , , ----~"
i,2 ~-~Z concentrates ; 4 1
r '"'ra'°"l Iiitl ti i
i' ,xr:°° ,m,M,n t! <-0.9..Q8-0~-04-0.2 0 02 04 06 0,8 1.0>13
Filtrate deficit or Concentrate excess (mg I 1 DOG)
Fig. 2. Distr ibut ions of f i l trate defici ts (open bars) and concent ra t ion excesses (shaded bars) in mg 1-1 for all filters. PM aad UM designations in l ~ - l O data deno te concent ra te excesses ob ta ined f rom a single sample fi l tered through bo th PM-10 and UM-10 membranes ,
mode at -- 0.6 mg 1-1. The greater frequency of excesses was probably due to numerous instances of filtrate contamination. Retention might also have been evident by both excess and deficit in the YM-5 distribution, but other excess and deficit distributions, especially those of the more numerous PM-30 and XM-100 data, had modes around 0 difference with few small filtrate deficits.
Retent ion data calculated from concentrates gave similar results (Table II): consistent retention by UM-2 filters but low or no retention by filters with larger MW cut-offs. These values were corrected for contamination known to be in concentrates (UM-05 and UM-2) and for that portion of total contami- nation not assignable to filtrates. Because contaminations assigned to both filtrates and concentrates were necessarily minimum estimates, percentage
1 6 1
retention will have been overestimated or underestimated depending on which contamination, concentrate or filtrate, was underestimated. In practice, values which involved corrections did not differ significantly from those for which no contamination correction was necessary and those few samples with large contamination also had largest amounts accounted for in filtrates. There were frequent inconsistencies, instances in which retention calculated for a given filter exceeded that calculated for a filter with a smaller-MW cut-off. These were especially evident in UM-10 data relative to YM-5 data and in XM-100 data relative to PM-30 data.
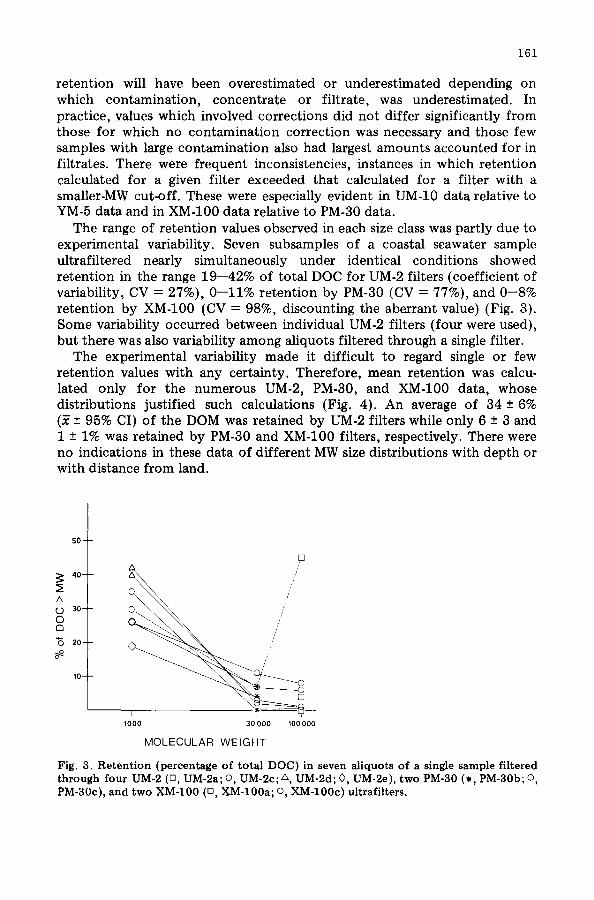
The range of retention values observed in each size class was partly due to experimental variability. Seven subsamples of a coastal seawater sample ultrafiltered nearly simultaneously under identical conditions showed retention in the range 19--42% of total DOC for UM-2 filters (coefficient of variability, CV = 27%), 0--11% retention by PM-30 (CV = 77%), and 0--8% retention by XM-100 (CV = 98%, discounting the aberrant value) (Fig. 3). Some variability occurred between individual UM-2 filters (four were used), but there was also variability among aliquots filtered through a single filter.
The experimental variability made it difficult to regard single or few retention values with any certainty. Therefore, mean retention was calcu- lated only for the numerous UM-2, PM-30, and XM-100 data, whose distributions justified such calculations (Fig. 4). An average of 34 + 6% (~ + 95% CI) of the DOM was retained by UM-2 filters while only 6 + 3 and 1 + 1% was retained by PM-30 and XM-100 filters, respectively. There were no indications in these data of different MW size distributions with depth or with distance from land.
50-
~ 4 0 -
A (.,) 30- o E3
"~ 20-
A /////,
m - ~>~--t looo 30 ooo ~oo ooo
M O L E C U L A R W E I G H T
Fig. 3. Retention (percentage of total DOC) in seven aliquots of a single sample filtered through four UM-2 (rn, UM-2a; o, UM-2c; A, UM-2d; 0, UM-2e), two PM-30 (*, PM-30b; o, PM-30c), and two X_M-100 (n, XM-100a; o XlVI-100c) ultrafilters.
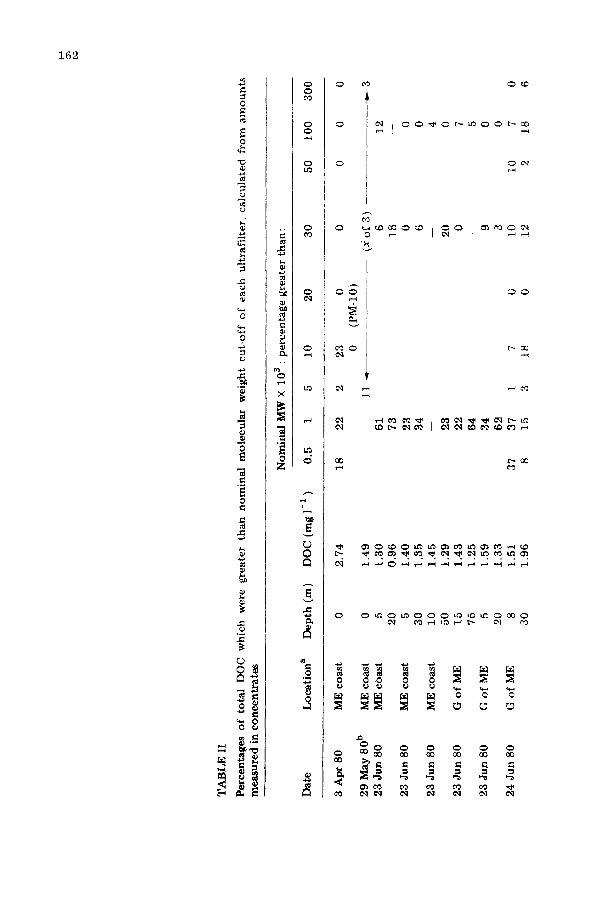
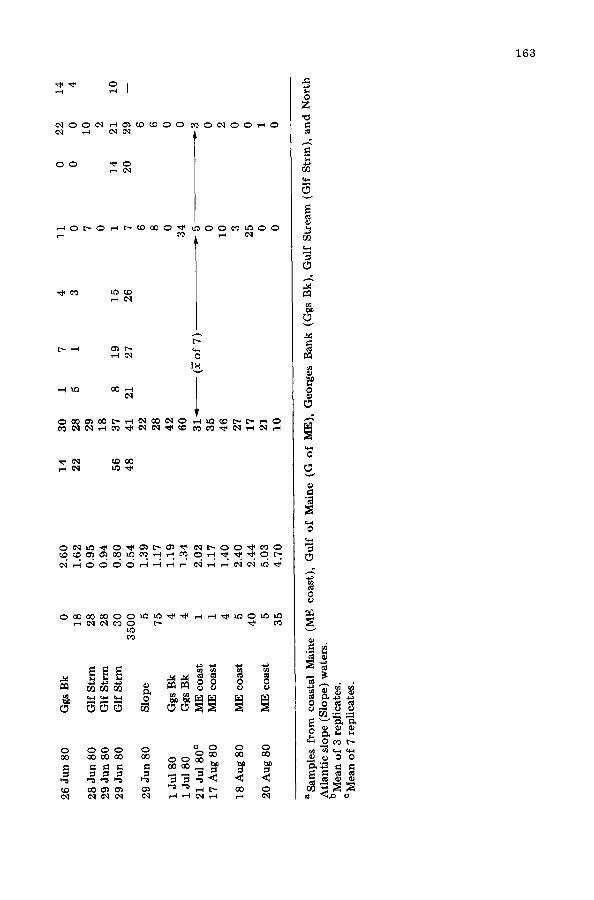
TA
BL
E I
I
Per
cen
tag
es o
f to
tal
DO
C
wh
ich
w
ere
gre
ater
th
an
n
om
ina
l m
ole
cu
lar
wei
gh
t c
ut-
off
of
each
u
ltra
filt
er,
calc
ula
ted
fro
m a
mo
un
ts
me
asu
red
in
co
nc
en
tra
tes
No
min
al
lVlW
×
103
" p
erce
nta
ge
gre
ater
th
an
:
Dat
e L
oc
ati
on
a D
ep
th (
m)
DO
C (
rag
1-1
)
0.5
1
5 10
2
0
30
5
0
10
0
30
0
3 A
pr
80
M
E c
oas
t 0
2.7
4
18
2
2
2 2
3
0 0
0 0
0 (P
M-I
O)
29
May
80
b
ME
co
ast
0 1
.49
11
~
(X o
f 3
) ..
....
..
23
Ju
n 8
0
ME
co
ast
5 1
.30
6
1
6 12
20
0
.96
7
3
18
--
23
Ju
n 8
0
ME
co
ast
5 1
.40
2
3
0 0
30
1
.35
3
4
6 0
23
Ju
n 8
0
ME
co
ast
10
1.4
5
--
--
4 5
0
1.2
9
23
20
0
23 J
un
80
G
of
ME
15
1
.43
2
2
0 7
75
1
.25
6
4
--
5 2
3 J
un
80
G
of
ME
5
1.5
9
34
9
0 2
0
1.3
3
62
3
0 2
4 J
un
80
G
of
ME
8
1.5
1
37
37
1
7 0
l0
10
7
30
1
.96
8
15
3
18
0
t2
2 1
8
0
26
Ju
n 8
0
Gg
s B
k
0 2
.60
1
4
30
1
7 4
11
0
22
1
8
1.6
2
22
2
8
5 1
3 0
0 0
28
Ju
n 8
0
Glf
Str
m
28
0
.95
2
9
7 1
0
29
Ju
n 8
0
Glf
Str
m
28
0
.94
1
8
0 2
29
Ju
n 8
0
Glf
Str
m
30
0
.80
5
6
37
8
19
1
5
1 1
4
21
35
00
0
.54
4
8
41
2
1
27
2
6
7 2
0
29
29
Ju
n 8
0
Slo
pe
5 1
.39
2
2
6 6
75
1
.17
2
8
8 6
I Ju
l 8
0
Gg
s B
k
4 1
.19
4
2
0 0
1 Ju
l 8
0
Gg
s B
k
4 1
.34
6
0
34
0
21 J
ul
80
c
ME
co
ast
1 2
.02
3
1 ~
(7
of
7)
- 5
~ 3
17
Au
g 8
0
ME
co
ast
1 1
.17
3
5
0 0
4 1
.40
4
6
10
2
18
Au
g 8
0
ME
co
ast
5 2
.40
27
3
0 4
0
2.4
4
17
2
5
0 2
0 A
ug
80
M
E c
oas
t 5
5.0
3
21
0
1 3
5
4.7
0
10
0
0
14
4 10
aSam
ples
fr
om coastal Ma
ine
(ME coast), Gu
lf o
f Ma
ine
(G of
ME)
, Ge
orge
s Bank (G
gs Bk)
, Gu
lf Str
eam
(Glf
Str
m), an
d No
rth
Atlantic slo
pe (Sl
ope)
waters.
bMean o
f 3 replicates.
CMean o
f 7 replicates.
164
16-
12-
u_
5 10 20 30 40 50 60 70 0 5 ~0 20 30 0 5 10 20 30
%DOC >1000mw % > 30000 % > 100000
U M- 2 PM- 30 X M - 100
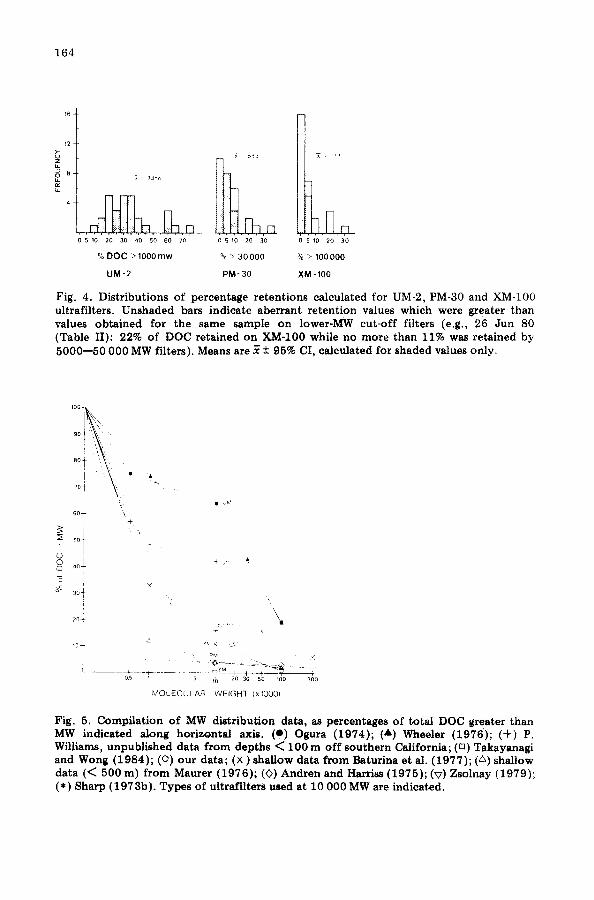
Fig. 4. Distributions of percentage retentions calculated for UM-2, PM-30 and XM-100 ultrafilters. Unshaded bars indicate aberrant retention values which were greater than values obtained for the same sample on lower-MW cut-off filters (e.g., 26 Jun 80 (Table II): 22% of DOC retained on XM-100 while no more than 11% was retained by 5000--50 000 MW filters). Means are x ± 95% CI, calculated for shaded values only.
°o! ~ ~o
i
'°t
1oo -
9oi~i.
8o? '~\i i ,, °
I, \
~+
A
+
\
MOLECULAR WEIGHT (x1000)
Fig. 5. Compilation of MW distribution data, as percentages of total DOC greater than MW indicated along horizontal axis. (o) Ogura (1974); (A) Wheeler (1976); (+) P. Williams, unpublished data from depths < 100 m off southern California; ([]) Takayanagi and Wong (1984); (o) our data; (×) shallow data from Baturina et al. (1977); (z~) shallow data (< 500 m) from Maurer (1976); (0) Andren and Harriss (1975); (V) Zsolnay (1979); (*) Sharp (1973b). Types of ultrafilters used at 10 000 MW are indicated.
165
DISCUSSION
Available seawater ultrafiltration data (combined with our data in Fig. 5) display a large range of apparent MW distributions. However, the pattern which emerges, once variability due to experimental artifacts has been resolved, indicates that most seawater DOM is of less than 10--30 000 MW. All samples except those of Sharp were prefiltered, through filters with approximate pore sizes ranging from 0.2 to 1.2 pm; there was no evidence in these data that use of a specific prefilter biased subsequent MW determi- nations. All samples except those of Sharp and Zsolnay were analysed by wet combust ion techniques; theirs were by dry combustion.
Our data and data from Baturina et al. (1977), Takayanagi and Wong (1984), and Williams (unpublished) indicated that only 30--50% of sea- water DOM had MW greater than 1000. Data of Williams from 500 MW cut- off filters were consistent with this pattern, but data of Ogura (1974) and Wheeler (1976) were clearly higher (lower percentage of low-MW materials) while data of Andren and Harriss (1975) and Maurer (1976) indicated much larger percentages of low-MW DOM. All the data derive from UM-2 or UM-05 ultrafilters so it is unlikely that filter differences caused the large dis- crepancies. There were no evident geographical patterns: lowest values were from the Mississippi estuary and the Gulf of Mexico, high values were from Tokyo Bay and the Georgia coast, and intermediate values came from coastal waters of California, Maine, and Virginia and the western North Atlantic and eastern equatorial Pacific oceans. It appears likely that procedural differ- ences caused the discrepancies. Ogura (1974) and Wheeler (1976) calculated retention from filtrates, correcting for contamination measured in DDW rinses, and applying those corrections not to total filtrates but to secondary filtrate fractions after an initial fraction had been discarded. If initial fractions of seawater ultrafiltrates contained higher amounts of DOM than subsequent fractions (an effect we rarely observed), discarding those fractions and then subtracting contamination found' in rinses amounts to double correction which would exaggerate apparent retention. In any case, as shown here, total contamination was occasionally zero or varied from filter to filter and from one use to the next of the same filter despite uniform cleaning and rinsing regimes. Thus there is a great deal of uncertainty in correcting filtrates for contamination, with most potential errors leading to over- estimation of retention. Of the intermediate 1000 MW data, ours and those of Baturina et al. (1977) derived from direct measurements of concentrates while those of P.M. Williams (personal communicat ion, 1984) involved contamination corrections based on seawater rather than DDW, calculated from and applied to appropriate filtrate fractions. Takayanagi and Wong (1984) did not report contamination or corrections. Low retention values of Andren and Harriss (1975) and Maurer (1976) derive from samples pre- concentrated ~ 2 0 : 1 over UM-05 (Andren and Harriss) or UM-2 (Maurer) membranes. Many workers (Barber, 1968; Ogura, 1974; Wheeler, 1976;
166
Baturina et al., 1977) have reported decreased retention of DOM as degree of concentration increases, often at concentration factors as low as 2:1, 3:1, or 7.4:1 (Wheeler, Ogura, and Barber, respectively). Therefore, extreme concentration factors used by Andren and Harriss (1975) and Maurer (1976) probably resulted in artificially low retention values. Baturina et al. (1977) also used very high concentration factors, but over 300 000MW cut-off filters on which retention of DOM would have been small regardless.
Most data showed only 0--16% of DOM retained by 10 000MW filters (Andren and Harriss, 1975; Maurer, 1976; Baturina et al., 1977; Takayanagi and Wong, 1984; Williams, unpublished) while other data of Williams (unpublished) showed 42% and those of Ogura (1974) showed 64% retained. Artifacts due to extreme concentration factors were not evident at this MW, presumably because samples preconcentrated over lower-MW cut-off filters required only small concentration factors during subsequent filtrations. Contamination corrections of Ogura (1974) probably exaggerated retention at this MW as at lower MW, but a more obvious distinction between low and high values was filter type: high values came from UM-10 filters while low values for which filter type was reported were from PM-10, YM-10, or Sartorius 121 36 filters. Intercomparisons of UM- and PM.10 filters have shown similar patterns. We found 23% of seawater DOM retained by a UM-10 filter while 0% of the same sample was retained by a PM-10 filter (Table I, Fig. 2) and have already noted that UM-10 filters frequently showed greater DOM retention than YM-5 filters. UM.10 filters also retained more freshwater DOM than PM-10 filters (Wilander, 1972; Moore et al., 1979). In laboratory calibrations, UM-10 filters retained 12--50% of low (,~600)-MW oligoaaccharides (Amicon technical literature; O~-.ra, 1974) while PM-10 filters passed 85--95% of some 10 000 MW polymers (Amicon technical literature). Other UM filters, e~., UM-20 filters, had more accurate retention characteristics than the UM-10 in Amicon's tests. Likewise, PM-30 filters were better than PM-10 for the Amicon test compounds, while a third type of membrane, YM-10, had relatively accurate retention characteristics. In seawater, PM-10 data were similar to YM-10 data and were consistent with YM-5 (Takayanagi and Wong, 1984; if averaged, ours would be identi- cal), UM-20 (Zsolnay, 1979), and some (our) PM-30 retention values. There- fore, although little certainty can be ascribed to data from either UM-10 or PM-10 filters, the propensity of UM-10 filters to retain molecules much smaller than their nominal MW cut-off appears to result in larger errors than does poor retention by PM-10 filters.
We found only 6% of seawater DOM to have MW ~ 30 000, and most data (ours; Andren and Harriss, 1975; Maurer, 1976) showed less than 3% of DOM with MW ~ 100 000. In contrast, values obtained by Ogura (1974) and Wheeler (1976) indicated 43% DOC retention at 30000 MW and 19% at 100 000MW. The same types of filters were used in all cases, so we again attribute high values to over-correcting for contamination. Data at
167
50 000 MW (Sharp, 1973b), intermediate between high and low 100 000 MW values, were also calculated from filtrate measurements and may be subject to similar contamination correction uncertainties. In addition, Sharp's samples were not prefiltered so that retention may have been enhanced as particulate materials clogged pores of the ultrafilters.
Finally, slight differences were observed between XM-300 (300 000 MW) ultrafilter data of Andren and Harriss (1975) and Baturina et al. (1977), with the 2% retention values (Andren and Harriss, 1975) at least consistent with most 1 0 0 0 0 0 M W data. Baturina et al. (1977) concentrated 0 . 4 p m filtered seawaters by factors of 10--30 over the XM-300 filters, which may have resulted in enhanced retention due to clogging of the relatively large pores. In our data, retention by both XM-100 and XM-300 filters frequently exceeded retention by lower-MW cut-off filters, casting some uncertainty on any retention indicated by the higher-MW filters.
Data accumulated in Fig. 5 were surface data when depth differences in MW distributions were described by the authors or total data if no differences were described. Some authors suggested that deeper waters contained greater percentages of high-MW DOM (Ogura, 1974; Maurer, 1976) while others (Baturina et al., 1977) indicated lower percentages of high-MW DOM in deeper waters. We observed no significant differences between surface and deeper MW distributions, nor between nearshore and open ocean MW distributions. Given the variability we did observe, we are forced to regard most generalities of MW changes with distance or depth as prema- ture.
Because some ultrafilters, notably UM-type membranes, contain charged sites, retention of polyelectrolyte DOM by charged ultrafilters may involve electrostatic rejection as well as molecular size retention. Assessment of the extent of electrostatic rejection is particularly important to estuarine studies because that rejection will vary as a function of solution ionic strength and because most evidence for removal of high-MW DOM during estuarine mixing has been based at least partly on UM ultrafiltration membranes. Investi- gations of electrostatic rejection over the range of fresh water to seawater composit ions have not been reported, but there are other indications that rejection is important. Ultrafilters, especially UM-2 filters, presoaked in 2 M NaC1 retained less Ca than those soaked only in distilled water (Schindler and Albert, 1974). Likewise, fulvic acid retention by 10 000 MW hollow- fiber ultrafiltration systems decreased significantly in 1 M NaC1 relative to distilled water and in one instance fulvic acid retention over a UM-2 membrane decreased in the presence of 0 .1N HC1 (Kwak et al., 1977). Munch et al. (1979) showed decreased rejection of both rigid (bovine serum albumin) and flexible (polyacrylamide) polyelectrolyte molecules in 0.1 M NaC1 relative to 0 .001M solutions, decreases which they attr ibuted to decreasing length scales of repulsive interactions between ultrafilter pore walls and rigid macromolecules and to contracted conformations of the flexible macromolecules. Thus, there is evidence to suggest that apparent
168
> 500-1000 MW
80 . D -
7 0
6 0 ' V - - V ...... ~ : _ ~ : -- V
50- ~ = ~: : - ~ -
4 0 , >" ..... - - - " 30" 0 - -~ . . . . . . . -~ . . . . . . . . . . . 4)
20, to. 0 . . . . . . . . . . . ; --
i I . . . . . T- . . . . . . . . i [
60"t" > 10-30000 M~
50 1 •
o 0 40 ~ \ \ .., ~ • • £3 El \ - - ~ . - "b ;
20 ~
I ~ - 1 -
404, . > 50000 MW
30-f • ' ~ ' ~ " 20 ~ l . . . . . . ~- ~V 10 V ~" -~•
-3-- l ~, . . . . . . . . . i
30+ > ~00000 MW
'r , * . . . . . . . . . , , . . . . . . . . . ~ . . . . . . . . Y 0 1-10 !1-20 21-30 >30
SALINITY (%o)
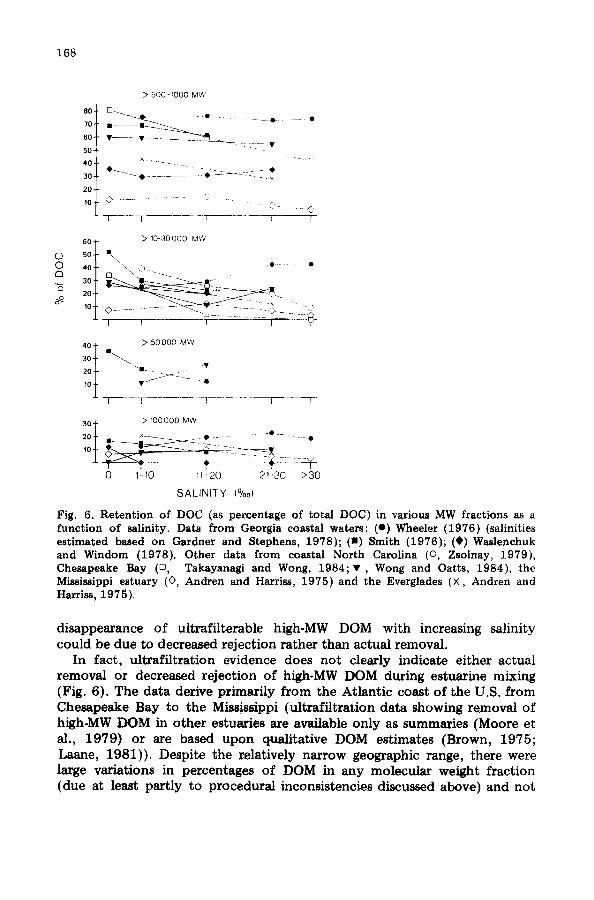
Fig. 6. Retention of DOC (as percentage of total DOC) in ,various MW fractions as a function of salinity. Data from Georgia coastal waters: (o) Wheeler (1976) (salinities estimated based on Gardner and Stephens, 1978); (m) Smith (1976); (@) Waslenchuk and Windom (1978). Other data from coastal North Carolina ( o Zsolnay, 1979), Chesapeake Bay (n, Takayanagi and Wong, 1984; v , Wong and Oatts, 1984), the Mississippi estuary (0, Andren and Harriss, 1975) and the Everglades (X, Andren and Harriss, 1975).
disappearance of ultrafilterable high-MW DOM with increasing salinity could be due to decreased rejection rather than actual removal.
In fact, ultrafiltration evidence does not clearly indicate either actual removal or decreased rejection of high-MW DOM during estuarine mixing (Fig. 6). The data derive pl4.marily from the Atlantic coast of the U.S. from Chesapeake Bay to the Missi~ippi (ultraffltration data showing removal of high-MW DOM in other estuaries are available only as summaries (Moore et al., 1979) or are based upon qualitative DOM estimates (Brown, 1975; Laane, 1981)). Despite the relatively narrow geographic range, there were large variations in percentages of DOM in any molecular weight fraction (due at least partly to procedural inconsistencies discussed above) and not
169
all of the available data showed salinity-dependent decreases of high-MW fractions; some showed no changes while others showed increases. When decreases of high-MW DOM were evident, they did not consistently occur within any salinity range or over an entire salinity range. Removal of high- MW materials during estuarine mixing has been shown by other tech- niques, including filtration and ultrafiltration through non-ionic membranes (Sholkovitz, 1976; Sholkovitz et al., 1978; Carlson and Mayer, 1983) and measurement of colligative properties (Gillam and Riley, 1981), but pending definitive t reatment of ionic strength effects, evidence derived from charged ultrafilters must be considered with caution.
There are unfortunately no unambiguous reference techniques by which to assess ultrafiltration. MW measurement techniques based on colligative properties are ineffectual in seawater due to low concentrations of DOM relative to inorganic solutes. Size exclusion chromatography (SEC) in sea- water has its own uncertainties (e.g., contrasting results of Khaylov (1968} and Starikova et al., (1976)), some of which may derive from preconcen- tration of samples. Some MW values determined by SEC for DOM isolated by a bubble adsorption device (Gershey, 1983) were similar to our ultra- filtration~lerived data while others indicated greater amounts of high-MW materials. In comparisons of MW techniques, applied to humic materials, Thurman et al. (1982) reported similarity among values obtained by small- angle X-ray scattering, vapor pressure osmometry , and ultrafiltration, although small amounts of ~ 100 000 MW materials were indicated only by ultrafiltration. On the other hand, Gillam and Riley (1981) found that corrected number-averaged MW values obtained from vapor pressure osmometry were less than those obtained by ultrafiltration or SEC, while McCreary and Snoeyink (1980) found poor correspondence between ultra- filtration and SEC values.
In view of the prominence in this discussion of contamination and artifact, it must be asked whether MW distributions of DOM in seawater determined by ultrafiltration, at least with these membranes, are not entirely artifact. The fact that some of the evident variability can be ascribed to differences in filters and procedures and that the remaining data appear to converge around a pattern of 30--50% of oceanic DOM having MW greater than 1000, 5--15% with MW greater than 1 0 0 0 0 and only 0--3% greater than 1 0 0 0 0 0 is not entirely satisfying given uncertainties in retention characteristics of the filters. Perhaps all that can be stated with certainty is that earlier indications of significant amounts of high-MW DOM in seawater, based on ultrafiltration, were exaggerated. Meanwhile, many of the ultra- filters discussed here have been supplanted by other, presumably improved, filters. Successful utilization of these in marine investigations requires recognition of the possibilities of artifact and of the potential influence of solution composi t ion on retention.
170
ACKNOWLEDGEMENT
S u p p o r t fo r th i s w o r k was de r ived f r o m N a t i o n a l Sc ience F o u n d a t i o n g ran t OCE 79 20244 . T h a n k s to P.M. Wil l iams fo r shar ing ins ight and da ta .
REFERENCES
Andren, A.W. and Harriss, R.C., 1975. Observations on the association between mercury and organic matter dissolved in natural waters. Geochim. Cosmochim. Acta, 39: 1253-- 1257.
Barber, R.T., 1968. Dissolved organic carbon from deep waters resists microbial oxidation. Nature (London), 220: 274--275.
Baturina, M.V., Ljutsarev, S.V. and Romankevich, E.A., 1977. Fractionating by ultra- filtration the organic matter of the marine water. Pol. Arch. Hydrobiol., 24 (Suppl.): 99--102.
Brown, M., 1975. High molecular-weight material in Baltic seawater. Mar. Chem., 3: 253--258.
Carlson, D.J. and Mayer, L.M., 1983. Relative influences of riverine and macroalgal phenolic materials on UV absorbance in temperate coastal waters. Can. J. Fish. Aquat. Sci., 40: 1258--1263.
Carlson, D.J., Mayer, L.M., Brann, M.L. and Mague, T.M., 1985. Binding of monomeric organic compounds to macromolecular dissolved organic matter in seawater. Mar. Chem., in press.
Gardner, W.S. and Stephens, J.A., 1978. Stability and composition of terrestrially derived dissolved organic nitrogen in continental shelf surface waters. Mar. Chem., 6: 335-- 342.
Gershey, R.M., 1983. Characterization of seawater organic matter carried by bubble- generated aerosols. Limnol. Oceanogr., 28: 309--319.
Gillam, A.H. and Riley, J.P., 1981. Correction of osmometric number-average molecular weights of humic substances for dissociation. Chem. Geol., 33: 355--366.
GiUespie, P.A. and Vaccaro, R.F., 1978. A bacterial bioessay for measuring the copper- chelation capacity of seawater. Limnol. Oceanogr., 23: 543--548.
Harvey, G.R., Boran, D.A., Chesal, L.A. and Tokar, J.M., 1983. The structure of marine fulvic and humic acids. Mar. Chem., 12: 119--132.
Hollibaugh, J.T. and Azam, F., 1983. Microbial degradation of dissolved proteins in seawater. Limnol. Oceanogr., 28: 1104--1116.
Khaylov, K.M., 1968. Dissolved organic macromolecules in sea water. Geochem. Int., 5: 497--503.
Kwak, J.C.T., Nelson, R.W.P. and Gamble, D.S., 1977. Ultrafiltration of fulvic and humic acids, a comparison of stirred cell and hollow fiber techniques. Geochim. Cosmochim. Acta, 41: 993--996.
Laane, R.W.P.M., 1981. Composition and distribution of dissolved fluorescent substances in the En~-Dollart estuary. Neth. J. Sea Res., 15: 88--99.
Mantoura, R.F.C. and Woodward, E.M,S., 1983. Conservative behavior of riverine dissolved organic carbon in the Severn estuary: chemical and geochemical implications. Geochim. Cosmochim. Acta, 47 : 1293--1309.
Maurer, L.G., 1976. Organic polymers in seawater: changes with depth in the Gulf of Mexico. Deep-Sea Res., 23: 1059--1064.
McCreary, J.J. and Snoeyink, V.L., 1980. Characterization and activated carbon adsorption of several humic substances. Water Res., 14: 151--160.
Menzel, D.W. and Vaccaro, R.F., 1964. The measurement of dissolved and particulate carbon in seawater. Limnol. Oeeanogr., 9: 138--142.
171
Moore, R.M., Burton, J.D., Williams, P.J. LeB. and Young, M.L., 1979. The behavior of dissolved organic material, iron and manganese in estuarine mixing. Geochim. Cos- mochirn. Acta, 43 : 919--926.
Munch, W.D., Zestar, L.P. and Anderson, J.L., 1979. Rejection of polyelectrolytes from microporous membranes. J. Membrane Sci., 5: 77--102.
Ogura, N., 1974. Molecular weight fractionation of dissolved organic matter in coastal seawater by ultrafiltration. Mar. Biol., 24: 305--312.
Schindler, J.J. and Albert, J.J., 1974. Analysis of organic--inorganic associations of four Georgia reservoirs. Arch. Hydrobiol. , 74 :429- -440 .
Sharp, J.H., 1973a. Total organic carbon in seawater - - comparison of measurements using persulfate oxidation and high temperature combustion. Mar. Chem., 1: 211-- 229.
Sharp, J.H., 1973b. Size classes of organic carbon in seawater. Limnol. Oceanogr., 18: 441--447.
Sholkovitz, E.R., 1976. Flocculat ion of dissolved organic and inorganic matter during the mixing of river water and seawater. Geochim. Cosmochim. Acta, 40: 831--845.
Sholkovitz, E.R., Boyle, E.A. and Price, N.B., 1978. The removal of dissolved humic acids and iron during estuarine mixing. Earth Planet. Sci. Lett. , 40: 130--136.
Sigleo, A.C. and Helz, G.R., 1982. Composit ion of estuarine colloidal material: major and trace elements. Geochim. Cosmochim. Acta, 45: 2501--2509.
Smith, R.G., 1976. Evaluation of combined application of ultrafil tration and com- plexation capacity techniques to natural waters. Anal. Chem., 48: 74--76.
Srna, R.F., Garrett , K.S., Miller, S.M. and Thum, A.B., 1980. Copper complexation capacity of marine-water samples from southern California. Environ. Sci. Technol., 14: 1482--1486.
Starikova, N.D., Yablokova, O.G. and Korzhikova, L.I., 1976. Determining the molecular composit ion of dissolved organic mat ter by gel filtration. Oceanology, 16 :571- -575 .
Takayanagi, K. and Wong, G.T.F., 1984. Organic and colloidal selenium in southern Chesapeake Bay and adjacent waters. Mar. Chem., 14: 141--148.
Thurman, E.M., Wershaw, R.L., Malcolm, R.L. and Pinckney, D.J., 1982. Molecular size of aquatic humic substances. Org. Geochem., 4: 27--35.
Waslenchuk, D.G. and Windom, H.L., 1978. Factors controlling the estuarine chemistry of arsenic. Estuarine Coastal Mar. Sci., 7: 455--464.
Wheeler, J.R., 1976. Fract ionat ion by molecular weight of organic substances in Georgia coastal water. Limnol. Oceanogr., 21 : 846--852.
Wilander, A., 1972. A study on the fractionation of organic matter in natural water by ultrafi l tration techniques. Swiss J. Hydrol. , 34: 190--200.
Wong, G.T.F. and Oatts, T.J., 1984. Dissolved organic matter and the dissipation of chlorine in estuarine water and seawater. Water Res., 18: 501--504.
Zsolnay, A., 1979. Coastal colloidal carbon: a s tudy of its seasonal variation and the possibility of river input. Estuarine Coastal Mar. Sci., 9: 559--567.