
Molecular Spectroscopy of Living Systems
63
Ji-Xin Cheng 1 Molecular Spectroscopy of Living Systems June 20, 2016 International Symposium of Molecular Spectroscopy
Transcript of Molecular Spectroscopy of Living Systems

Ji-Xin Cheng
1
Molecular Spectroscopy of Living Systems
June 20, 2016 International Symposium of Molecular Spectroscopy

(Science, Review Article, in press)
In vivo spectroscopic imaging
Metabolites in C. elegans
Myelin
Liver
Skin cancer
Protein synthesis
Plaque Brain cancer 9
Cheng&Xie, Science, 2015, 350: 1054
2

Angew Chem Int Ed, 2014, 53: 11787. In collaboration with Heidi Tissenbaum (U Mass).
Cholesterol; fat droplets; oxidized lipid; protein
b Daf-2, L2
Intestinal cells
a WT N2, L2
Bar: 50 µm
Fingerprinting Lipid Metabolism in Live C.elegans Longevity: C. elegans as in vivo test tube
3

k-means clustering 1 2 3 4
1640 1680 1720 1760 18000
5
10
15
20
Inte
nsity (
Vo
lts)
Raman shift (cm-1)
Oxidized lipid
Fat droplets
LROs
Protein
Multivariate curve resolution
Angewandte Chemie, 2014, 53: 11787. 4

In vivo Molecular Spectroscopic Imaging Outline
1. Pushing the physical limits of spectroscopic imaging
• Speed
• Sensitivity
• Depth
• Resolution
• Volume
3. Moving into clinic for molecule-based diagnosis
– Lipid-laden plaque
–Breast cancer margin
–precision surgery
2. Shedding new light on cellular machinery
• Cell metabolism
• Stem cell marker
• Membrane voltage
5

In vitro spectroscopy
In vivo spectroscopic
imaging
Spectrometer + Microscope
Cheng&Xie, Review, Science, 2015, 350: 1054 6

Spontaneous Raman
Pump Stokes Anti-Stokes
Pump
Inp
ut
Ou
tpu
t
Pump Stokes
CARS
SRL SRG
Anti-Stokes Pump Stokes
CARS
SRL SRG
Anti-Stokes
Pump Stokes
Pump Stokes
Coherent Raman Scattering
Single Frequency Multiplex
CARS : coherent anti-Stokes Raman scattering SRL: stimulated Raman loss, SRG: stimulated Raman gain
SRS: Woodbury, E. J.; Ng, W. K. Proc. Inst. Radio Eng. 1962, 50, 2367. CARS: Terhune, R. W.; Maker, P. D.; Savage, C. M. Phys. Rev. Lett. 1965, 14, 681-684.
Coherent Raman Boosts the Speed
7

Picosecond Pulse Excitation for CARS
Femtosecond
pulses
Picosecond
pulses
Wavenumber
Raman bands
Focus the energy on a single Raman band; high spectral resolution
Cheng, Volkmer, Book, Xie, J. Phys. Chem. B 105, 1277 (2001) 8

Axon
Axon
Axon
Axon
Axon
2600 2800 30000
10
20
30
40
50
CA
RS
In
ten
sity (
a.u
.)
Raman shift (cm-1)
CARS spectrum of myelin
Biophys. J. 2005, 89: 581-591.
CARS image of myelin sheath

Single-frequency CARS or SRS microscope (100 ns per pixel, 5 cm-1 window) Xie et al, PNAS 2005; Science 2010
Spe
ctra
l win
do
w (
cm
1)
Speed (pixel dwell time) Milliseconds Micro-seconds nanoseconds
Spontaneous Raman microscope (Milliseconds per spectrum, full window)
Broadband CARS microscope (3.5 ms per spectrum, 3000 cm-1 window ) Cicerone et al, Nat. Photonics 2014
3
300
3000
Multiplex SRS microscope (5 µs per spectrum, 200 cm-1 window) Cheng et al, Light Sci. & Appl. 2015; Cheng et al, Science Advances 2015
Spectral imaging speed versus spectral width
10

11
Top Story in 2015, Biophotonics Magazine

2850 2900 2950 3000 3050
0
4x10⁻⁴
Raman (3 sec)
AC
/ D
C (
dI/I)
Raman shift (cm-1)
SRL (30 s)
AC
DMSO solution
12
32-channel tuned amplifier for s Raman
5

High-throughput single cell analysis by stimulated Raman flow cytometer
Jesse Zhang et al Nature Comm, under review
(>10,000 particles (bacteria) /sec, 5 s per spectrum)
13

In 1666, Newton applied the word "spectrum" to describe the rainbow of colors that are revealed when white light is passed through a prism.
This wisdom becomes inefficient when dealing with highly scattered photons from an intact organism. 14

Spectral recording of a scattering specimen
a
b
Science Advances, 2015, 1: e1500738 15

C: Condenser, D: Dichoic mirror, G: Grating, GM: Galvo mirror, L: Lens,
M: Mirror, OBJ: Objective, PBS: Polarizing beam splitter, PD: Photodiode,
PS: Polygon scanner, Q: Quarter waveplate, SL: Slit, Schematic
For highly scattered photons, our scheme improves detection efficacy by 2000 times!
PBS G
PS
G
SL
M
PD C
OBJ S
GM
Q
D
PBS Q M
M
L
L L
L
L L
Spectral acquisition by a photodiode
Conventional spectral acquisition
C OBJ S
P
Spectrometer
L L
16

2800 2900 3000
0.0
0.5
Fat
Fibrosis
Nuclei
Int.
(a
.u)
Raman shift (cm-1)
A B C
29
08
cm
-1
Location A Location B Location C
MC
R
100 μm
His
tolo
gy
In situ histology: mapping single tumor cells and stroma in human patient breast tissue
Liao et al, Science Advances, 2015; chosen as a top advance in 2015 by The Scientist 17

Transportable & hand-held system for in situ spectroscopic imaging

600 700 800 900 1000 1100 12000
5
10
15
20
La
se
r In
t. (
MW
/cm
2)
Wavelength (nm)
Damage
No Damage
Longer-wavelength Excitation Reduces Photodamage to Cells in SRS Imaging
Healthy
Damaged
Cells scanned for 2 min
Max. power used for SRL imaging:
830 nm: 50 mW before microscope
1004 nm: 200 mW before microscope
1080 nm: 200 mW before microscope
Blebbing
J Phys Chem Lett 2011, 2, 1248-53

Signals in CRS microscopy are generated by ballistic photons under the tight focusing condition, thus limiting its imaging depth to ~ 100 m.
Cover: multimodal image of central nervous system
20

TPEF
CARS Adventitia
Media
Lumen
Limited Penetration Depth in CARS Microscopy Thuc Let et al. JBO 2007 Han-Wei Wang et al. Opt Comm 2008 Han-Wei Wang et al. ATVB, 2009

Time
= Distan
ce
0
Speed in soft tissues ~1500 m/s
Han-Wei Wang et al. Phys Rev Lett 2011, to be published.
PRL 106, 238106 (2011)
Boltzmann distribution
Ni/N0 = exp(E/kT)
E is the energy gap, T is the temperature, k is the Boltzmann constant. 22

23

Principle of Photoacoustic Imaging
Laser
Photoacoustic Effect
Acoustic Detection
Pressure wave generation
Absorption, thermal-elastic expansion
Pulsed radiation transducer
Lihong Wang and coworkers, 2006 Nat. Biotech.
Blood Vessel Plexus (Hemoglobin) & Melanoma –
24

1st overtone: v=0 to v=2 2nd overtone: v=0 to v=3
Molecular Vibration Acoustic Wave
JPC Letters Perspective 2013, 4, 2177-85
25

Fat
Collagen
Blood
Water
6000 7000 8000 9000 10000 110000.0
0.5
1.0
1.5
2.0
PA
Sig
nal A
mplitu
de (
V)
Wavenumber (cm-1)
Wavelength(nm)
1667 1429 1250 1111 1000 909
2nd overtone of
CH bond stretch
1st overtone and
combination of OH
stretch Collagen
PA Spectra of Biological Molecules
3rd overtone of
CH bond stretch
Phys Rev Lett 2011, 106, 238106.
26

x
y z
x
z y
Lumen
3.15 mm
Lipid core 250
200
150
100
50
0
PA Imaging of Lipid-rich Plaque
0 1 2 3 4 5 6 7 8 90.0
0.5
1.0
1.5
2.0
2.5
3.0
3.5
No
rma
lize
d V
PA
Sig
. In
t.
Thickness of Collagen Matrix (mm)
1/e 7 mm
Penetration Depth: up to 7 mm
Atherosclerotic Artery
VPA image
Speed: single pulse per pixel at 10 Hz Spatial resolution:
• Lateral resolution: from 5 m to 70 m • Axial resolution: ~135 m; 35 m is possible
Phys Rev Lett 2011, 106, 238106.
27

Raman scattering cross section ~ 1030 cm2/sr
Infrared absorption cross section
~ 1022 cm2/sr
vs.
Golf ball
Adapted from Getty Image and www.globalvideohq.com
Golf course
vs.

History of IR Spectroscopy and Imaging
[1] W.W. Coblentz, Investigations of Infra-red Spectra, Washington, DC: Carnegie Institution of Washington. (1905) [2] Perkin Elmer company website http://www.perkinelmer.com/ [3] P.R. Griffiths, Science, 222, 297 (1983) [4] Lewis, Levin et al. Anal. Chem. 67, 3377 (1995) [5] Chen, Chu et al. Anal. Chem., 84, 4118 (2012) [6] Nasse, Bhargava et al. Nature Method. 8, 413 (2011)
1905
IR spectral database By W.W. Coblentz [1]
1944
First commercial IR spectrometer available [2]
1954
First IR microscope available [2]
1983
FTIR spectrometry introduced [3]
Late 1980s
FTIR spectrometer and microscope [2]
1995
Focal plane array detector for FTIR imaging [4]
2000s
Quantum cascade laser [5], synchrotron source [6] for IR imaging
High resolution FTIR chemical imaging using synchrotron source [6]
2011

Objective
Iris
PD
stage
LIA
PD
PC RA
QCL
Mid-infrared Photothermal (MIP) Imaging: Making IR Spectroscopy in vivo
Delong Zhang et al, Science Advances 2016 In press
Dark field geometry Resolution: 0.6 micron Sensitivity: 10 µM

3D-MIP Mapping of C=O Bonds in Living Cells
20 µm
• C=O band at 1750 cm-1
• Sample: live PC-3 cell on CaF2 dish • Pump: 4 mW, Probe: 8 mW • Pixel dwell time: 1 ms Delong Zhang et al,
Science Advances 2016 In press

Pump-Probe: Spectroscopic Imaging in Time Domain
32 Warren Warren, Greg Hartland, Sunney Xie, Cheng groups

Ultrafast Pump-Probe Imaging of Nanoscale Defects in Single-layer Graphene
33
Intensity imaging 1000 frames per sec, time-resolved imaging 50 frames per sec Nature Nanotechnology, 2016, under review

Summary of Spectroscopic Imaging Modalities
p
s
Raman/CARS/SRS
p as=2p-s
Photothermal
p
pr
n2
n1 ΔT
Pump-probe
pr p
Photoacoustic
34


Altered Metabolism: Cancer’s Achilles Heel
Galluzzi et al., Nat Rev Drug Disc (2013), 12: 829
Glu: glucose Gly: Glycine Gln: Glutamine 36

SRS Imaging of de novo Lipogenesis in Single Living Cells
Junjie Li & Ji-Xin Cheng, Scientific Reports, 2014, 4: 6889. 37

Raman Probes for Imaging Cholesterol Metabolism in Living Cells
Hyeon Jeong Lee et al. Nature Scientific Reports, 2015, 5: 7930. Imaging detection limit: 900 molecules. Collaborator: Mingji Dai
Cholesterol storage in lysosomes in Niemann-Pick C mutant cells
BODIPY C≡C
NP
Cm
ut
Merge
10 µm
38
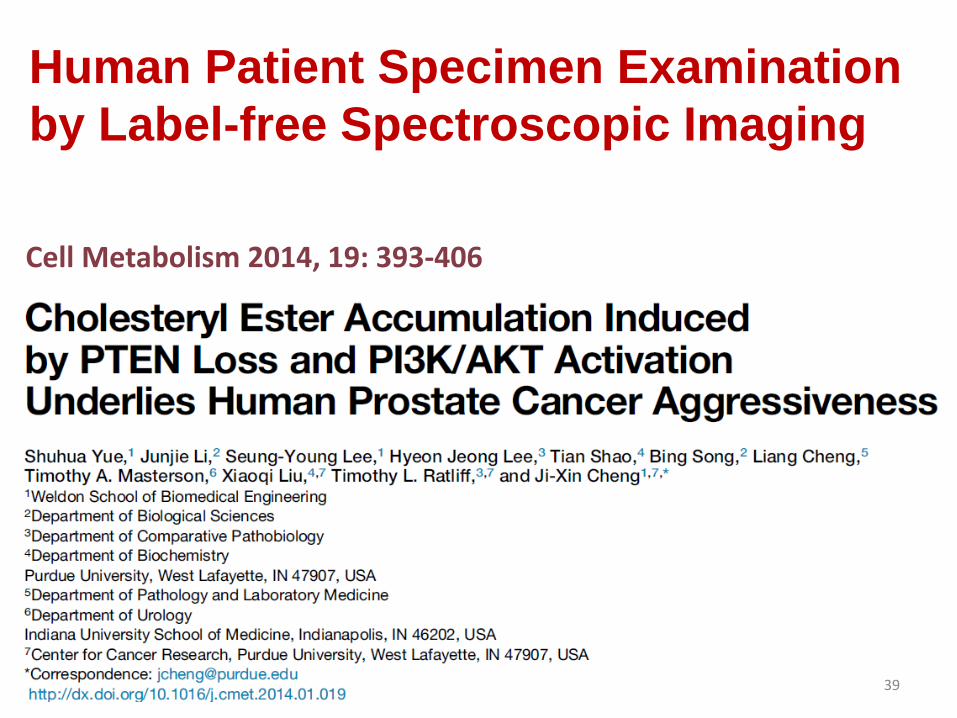
Cell Metabolism 2014, 19: 393-406
Human Patient Specimen Examination
by Label-free Spectroscopic Imaging
39
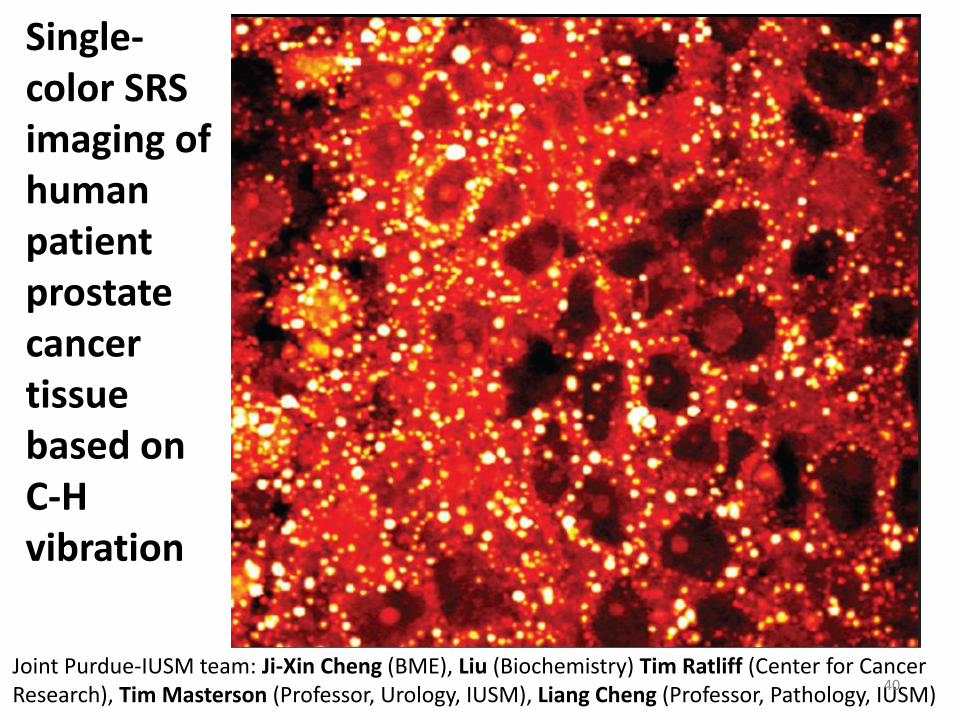
Joint Purdue-IUSM team: Ji-Xin Cheng (BME), Liu (Biochemistry) Tim Ratliff (Center for Cancer Research), Tim Masterson (Professor, Urology, IUSM), Liang Cheng (Professor, Pathology, IUSM)
Single-color SRS imaging of human patient prostate cancer tissue based on C-H vibration
40

Raman Spectromicroscopy: High-speed imaging and spectral analysis at pixels of interest
Spectrometer
PD F1
SU DM
L
PH
F3
PMT
F2
p
Combiner
S
LSM SRS or pump-probe imaging
CARS imaging
Raman spectral analysis
Mikhail Slipchenko et al., J. Phys. Chem. B 2009, 113: 7681-86. 41

Spectral Profiling Identifies Cholesteryl Ester
Raman spectrum of cholesteryl palmitate shows bands from 400 to 1200 cm−1 with the most intensive ones at 428, 538, 614 and 701 cm−1.
Krafft et al. Spectrochimica Acta Part A 61 (2005) 1529–1535
Raman shift (cm-1)
Inte
nsity (
a.u
.)
43
0 c
m−1
54
8 c
m−1
6
14
cm
−1
70
2 c
m−1
Prostate cancer cell/tissue data: C-H
C=C
42

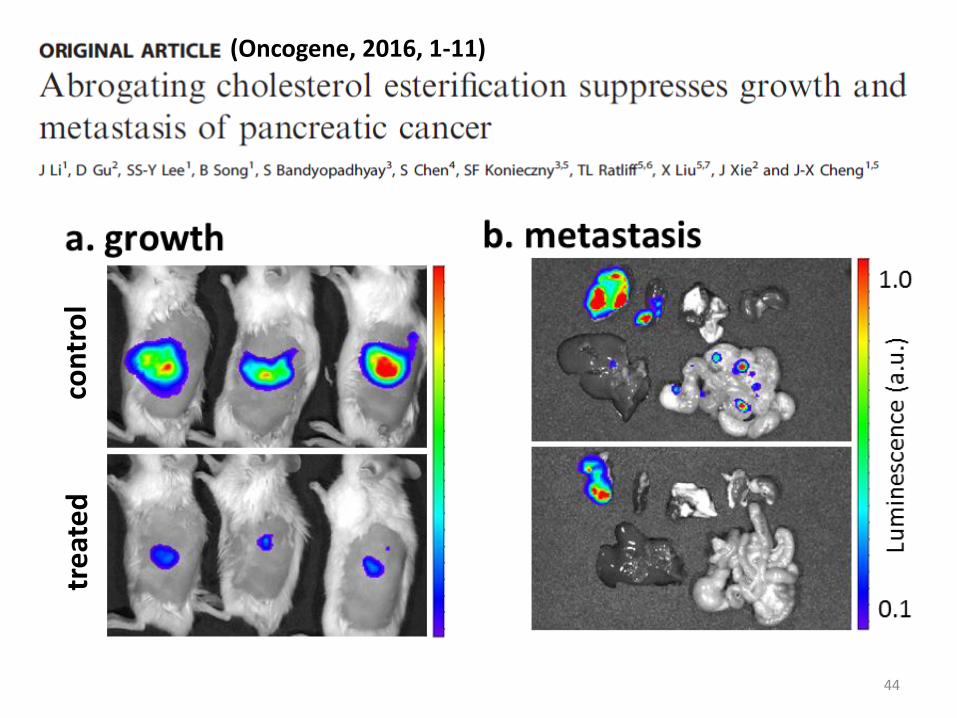
Molecular Pathways Underlying Cholesteryl Ester Accumulation
Avasimibe
FC: free cholesterol; PUFA: polyunsaturated fatty acid; AA: arachidonic acid
Cell Metabolism, 2014, 18: 393-406
LDLr
Lysosome
CE-rich LD
ER
ACAT-1
Proliferation Tumor growth
ω-6 PUFA (e.g. AA)
CE in LDL
CE in LD
FC PI3K/AKT/mTOR
PTEN loss
SREBP
43
44
(Oncogene, 2016, 1-11) co
ntr
ol
tre
ate
d

bacteria in blood were cultured, and tested for antibiotics resistance Takes 2-5 days, up to 2 weeks Some bacteria are hard to be cultured
Significance of Early Detection of Bacteria
Blood stream infections (bacteria, fungi or virus) or sepsis affects 18 millions people worldwide and 700,000 in United States annually, with mortality rate of 3040 %, partly due to the inability to rapidly detect, identify and thus treat patient with antibiotics in the early stage. Kumar A. et al. Crit. Care Med. 34, 1589–1596 (2006)
Kang DK. et al. Nat. Commun. 5, 54275437 (2014)
Jonas Hansson’s thesis: Microfluidic blood sample preparation for rapid sepsis diagnostics

In situ Detection of a Single Bacterium in complex environment (food, urine, blood)
Weili Hong et al, ChemistrySelect 2016, 3: 513-517. In collaboration with Mohamed N Seleem at Purdue
2800 2850 2900 2950 3000 30500
1
2
3
4
Inte
nsity / a
.u.
Raman shift / cm-1
S. aureus
Blood
2600 2700 2800 2900 3000 31000
2
4
6
8
Inte
nsity (
a.u
.)
Raman shift (cm-1)
E. coli
Blood
Output SRS spectra E.Coli in lysed blood
S.aureus in lysed blood
Leeuwenhoek's microscopes
46

47
Leeuwenhoek (1632 ~ 1723)'s microscope Father of microbiology

Visualizing neuronal communication
U.S. National Institutes of Health 48

Recording electrical impulses with electrophysiology
Hodgkin & Huxley. Nature (1939) 144, 710
First action potential recorded:
giant squid axon
(patch clamp)
45 49

Optical recording of neural activities
Scanziani et al. Nature (2009) 461: 930 Grienberger et al. Neuron (2012) 73: 862
Calcium indicators:
Voltage sensitive probes:
Challenges: • Toxicity • Photo-bleaching • Limited physical space
Calcium response is slow
50

Label-free spectroscopic detection of membrane potential
51

Integration of patch clamp and SRS imaging
PD: photodiode MP: micromanipulator CM: chirping medium
In collaboration with Dr. Drenan (Purdue), Dr. Barlett (Purdue), Dr. Xu (IUSM) 52

III. Moving into Clinic
53
Compact device & commercialization
Biochemistry information
Sufficient depth & large field of view,
Preclinical /clinical studies

Current Tools Lack the Ability to Identify Vulnerable Plaques
“Vulnerable”,
unstable plaque “Stable” plaque
Lipid pool
Thin fibrous cap Thick fibrous, calcified
Cap erosion, thrombosis, rupture
Heart attack
54
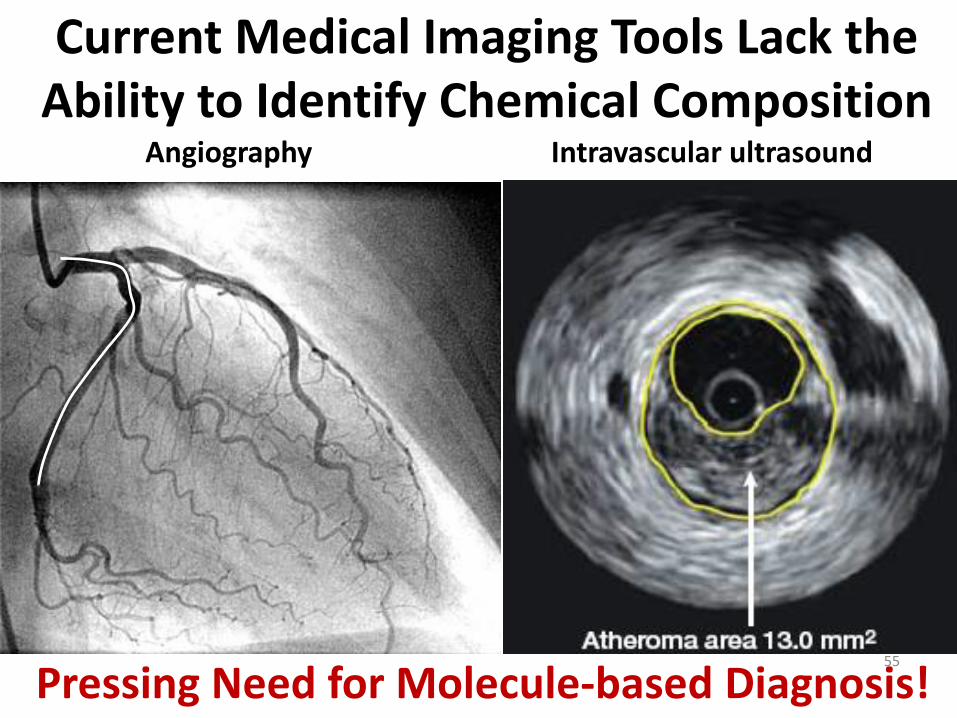
Current Medical Imaging Tools Lack the Ability to Identify Chemical Composition
Intravascular ultrasound Angiography
55
Pressing Need for Molecule-based Diagnosis!
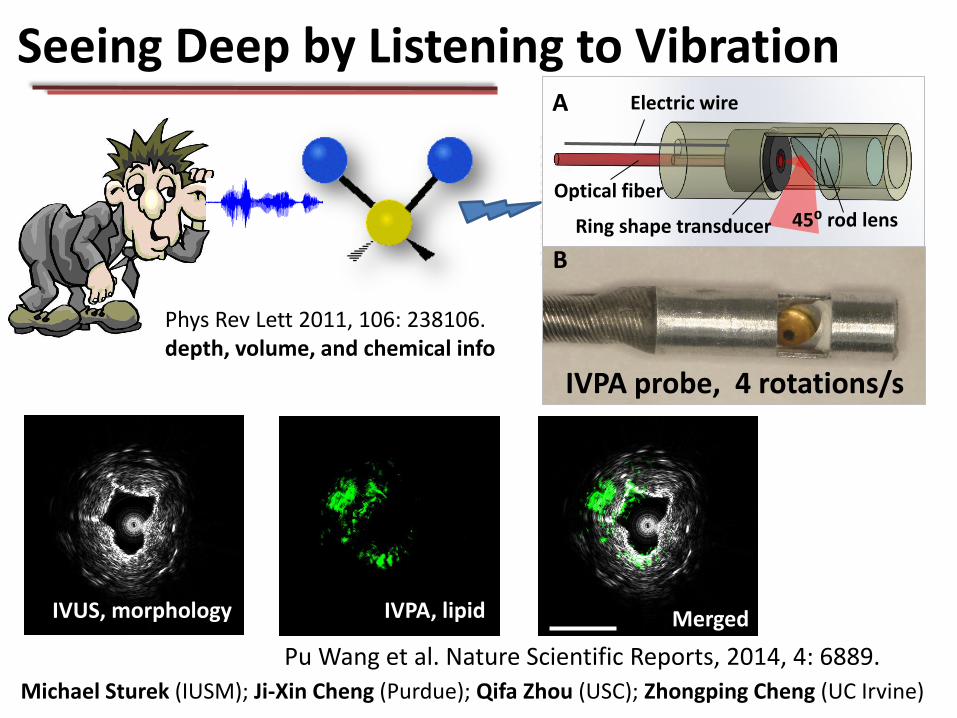
Seeing Deep by Listening to Vibration
Michael Sturek (IUSM); Ji-Xin Cheng (Purdue); Qifa Zhou (USC); Zhongping Cheng (UC Irvine)
IVUS, morphology IVPA, lipid Merged
Pu Wang et al. Nature Scientific Reports, 2014, 4: 6889.
Phys Rev Lett 2011, 106: 238106. depth, volume, and chemical info
Optical fiber
Electric wire A
45⁰ rod lens Ring shape transducer
IVPA probe, 4 rotations/s
B

First
optical window
(1.1 – 1.3 µm)
Second
optical window
(1.65 – 1.85 µm)
a
b
2vaCH2:
2vaCH3:
3vsCH3: 2vs +dCH3: 2vs +dCH2:
2vsCH2:
CH2: 3vs
va +dO-H:
O-H: vs + va
Two Windows for Vibration-based PA Imaging
p0=aF is a constant,
is the Gruneisen parameter,
a is the absorption coefficient
F is the local light fluence.
Photoacoustics (review) 2016, 4, 11-21. 57

OPO, 1730 nm, 5 ns, 500 Hz, Weibiao Chen, Shanghai 58

Collinear IVPA Catheter Yunchun Cao et al, Sci. Rep., 2016, 6:25236
59

In vivo IVPA Imaging
60

The first company founded by Purdue Foundry Co-founders: Ji-Xin Cheng, Pu Wang 2014

6th Workshop “In Vivo Spectroscopic Imaging” July 7-8, 2016, at Purdue University www.conf.purdue.edu/spectro16 Organizer: Ji-Xin Cheng, [email protected] Academic speakers: Hui Cao, Yale University; Ji-Xin Cheng, Purdue Conor Evans, Harvard; Khanh Kieu, U. Arizona Gabriel Popescu, UIUC; Adam Wax, Duke Univ. Hao Zhang, Northwestern.
62

Molecular Spectroscopic Imaging Group
Ji-Xin Cheng (Principal Investigator)
Azrielle Nunnally (Operations Manager) Vibronix Inc
Microscopy
Chi Zhang, Postdoc
Delong Zhang,
Postdoc
Jason Liao, PhD
Kai-Chih Huang PhD
Chen Li, PhD
Haonan Lin, PhD
Peng Lin, PhD
Yin-Xin Zhang (VS)
Xueli Chen (VS)
Current Funding:
Keck Foundation
R21 GM104681
R01 on SRS Flow
Biology
Pu Wang, Postdoc
Yingchun, Postdoc
Hui Jie, PhD
Rui Li, PhD
Lu Lan, PhD
Jiayingzi Wu, PhD
Yi Zhang, PhD
Ayeeshik Kole, MD
Brittani Bungart MD
Current Funding:
R01 HL125385
R41 CA192645
AHA Innovation
Therapy
Junjie Li, Postdoc
Caro Karanja PhD
Shovik, UG
Jie Nee Lee, UG
Xiaochao Qu (VS)
Current Funding:
Walther Cancer
Foundation
DoD PC130964
DoD Spinal Injury
Device
Junjie Li, Postdoc
Weili Hong, Postdoc
Shibin Deng Postdoc
Hyeon-Jeong, PhD
Pu-Ting Dong, PhD
Andy Chen, PhD
Ying Jiang, PhD
Wei Chen (VS)
Current Funding:
R21 GM114853
(SCAP Program)
R21 CA 182608
R01 HL117990 (sub)
1 2 3 4
Resarci Therapeutics
63