Molecular Phylogenetics of the Siphonophora (Cnidaria), with ...
Molecular Phylogenetics and Evolution 52 (2009) 498–511
Contents lists available at ScienceDirect
Molecular Phylogenetics and Evolution
journal homepage: www.elsevier .com/locate /ympev
Reticulate evolution and incomplete lineage sorting among the ponderosa pines
Ann Willyard a,b,c, Richard Cronn d, Aaron Liston a,*
a Department of Botany and Plant Pathology, Oregon State University, Corvallis, OR 97331, USAb Department of Biology, University of South Dakota, 414 E. Clark St, Vermillion, SD 57069, USAc Biology Department, Hendrix College, 1600 Washington Ave., Conway, AR 72032, USAd Pacific Northwest Research Station, USDA Forest Service, 3200 SW Jefferson Way, Corvallis, OR 97331, USA
a r t i c l e i n f o
Article history:Received 6 January 2009Revised 10 February 2009Accepted 13 February 2009Available online 26 February 2009
Keywords:PinusPineHybridizationLow copy nuclear lociReticulate evolutionLEAWD-40trnG
1055-7903/$ - see front matter � 2009 Elsevier Inc. Adoi:10.1016/j.ympev.2009.02.011
* Corresponding author. Fax: +1 541 737 3573.E-mail addresses: [email protected] (A. W
Cronn), [email protected] (A. Liston).
a b s t r a c t
Interspecific gene flow via hybridization may play a major role in evolution by creating reticulate ratherthan hierarchical lineages in plant species. Occasional diploid pine hybrids indicate the potential forintrogression, but reticulation is hard to detect because ancestral polymorphism is still shared acrossmany groups of pine species. Nucleotide sequences for 53 accessions from 17 species in subsection Pon-derosae (Pinus) provide evidence for reticulate evolution. Two discordant patterns among independentlow-copy nuclear gene trees and a chloroplast haplotype are better explained by introgression thanincomplete lineage sorting or other causes of incongruence. Conflicting resolution of three monophyleticPinus coulteri accessions is best explained by ancient introgression followed by a genetic bottleneck. Morerecent hybridization transferred a chloroplast from P. jeffreyi to a sympatric P. washoensis individual. Weconclude that incomplete lineage sorting could account for other examples of non-monophyly, and cau-tion against any analysis based on single-accession or single-locus sampling in Pinus.
� 2009 Elsevier Inc. All rights reserved.
1. Introduction
Many species in the genus Pinus are characterized by largeeffective population sizes, limited interspecific divergence, andcentury-long fertile life spans (Syring et al., 2007). These factorsappear to have created a remarkable evolutionary web that is pro-foundly affected by incomplete lineage sorting. Hybridization be-tween distinct Pinus species may also have created reticulaterather than strictly hierarchical patterns of descent (e.g. Matosand Schaal, 2000). Despite persistent attempts to classify pine spe-cies based on morphological, biochemical, cytological, and molec-ular characters, the taxonomic relationships among many speciesremain unsolved. There is a growing understanding of the causes.
First, Pinus is an ancient genus, diverging from other extant gen-era at least 100 million years ago in the Cretaceous (Alvin, 1960).Nevertheless, integration of genetic and fossil evidence indicatesthat many of the roughly 100 species of pine arose rather recently,especially when measured in generations rather than years. Forexample, the stem lineage of the 17 species in subsection Pondero-sae (Pinaceae, Pinus, subgenus Pinus, section Trifoliae) divergedwithin the last 15 million years, and the crown divergence beganaround 5 million years ago (Willyard et al., 2007). Using an average
ll rights reserved.
illyard), [email protected] (R.
generation time of 50 years (Syring et al., 2007), this 17-speciesclade began diverging some 300,000 generations ago and thecrown divergence occurred on the order of 100,000 generationsago. Thus, the first factor confounding their evolutionary relation-ships is that pine species may be relatively young, even though thegenus is ancient and individuals are generally long-lived.
Second, Pinus classification is bedeviled by plastic, homoplas-ious, and highly variable morphological character states. For exam-ple, serotinous cones are variable within and among populations(Borchert, 1985) and have evolved independently in several lin-eages (Gernandt et al., 2005). Abundant within-population geneticvariation appears to be the norm. Using evidence from quantitativetraits, allozymes, or molecular markers, more than 90% of variationis generally contained within vs. among populations, although afew pine species exhibit higher among-population differentiation(Ledig, 1998; Sorensen et al., 2001). The interplay between homo-plasy and intraspecific variability makes delineations betweensome groups of pine species challenging, encouraging some to pro-pose hybrid origins to explain the enigma. An important examplemay be P. densata (subgenus Pinus, section Pinus), often cited as adiploid hybrid species (Ma et al., 2006 and references therein).
A third factor affecting pine evolutionary relationships is thatlineage sorting between pine species is often incomplete. Whenmolecular sequences for multiple individuals are sampled per spe-cies, many conspecific samples lack allelic monophyly. This hasbeen attributed to incomplete lineage sorting (Syring et al.,

A. Willyard et al. / Molecular Phylogenetics and Evolution 52 (2009) 498–511 499
2007). Because loci coalesce at different rates and are affected bystochastic processes (Carstens and Knowles, 2007), incompletelineage sorting creates conflicting topologies for pine species fromunlinked loci (Syring et al., 2005). Many of the factors that delayallelic coalescence are present in woody trees (and specifically inPinus): predominantly outcrossed mating, high within-species(and within-population and within-individual) mean heterozygos-ity, long generation time, and large effective population sizeswhere alleles are rarely purged (Rosenberg, 2003). Incomplete line-age sorting may be especially troublesome in Pinus because speci-ation has been rapid relative to effective population sizes (Willyardet al., 2007).
Fourth, hybridization between diverged lineages is thought tobe an important factor in the evolution of many plants (Arnold,1997; Grant, 1981; Stebbins, 1950), an idea supported by empiricaldata (Arnold, 1993; Cronn and Wendel, 2004; Doyle et al., 2004).Interspecific gene flow has been proposed to facilitate adaptiveradiations in plants (Seehausen, 2004), the invasion of novel habi-tats by nascent species (Petit et al., 2003; Rieseberg et al., 2003;Stebbins, 1959) and the invasion of new habitats by exotic plants(Ellstrand and Schierenbeck, 2000). Many researchers have specu-lated that reticulate evolution, facilitated by introgression, mayhave influenced the observed complexities among pine species.
Putative natural hybrids have been studied between many sym-patric pine species, including P. banksiana and P. contorta (mito-chondrial restriction sites; Dong and Wagner, 1993); P. brutiaand P. halepensis (chloroplast microsatellite loci; Bucci et al.,1998); P. coulteri and P. jeffreyi (morphology; Libby, 1958; Zobel,1951); P. jeffreyi and P. ponderosa (morphology; Haller, 1962); P.edulis and P. monophylla (morphology; Lanner and Phillips,1992); P. hartwegii and P. montezumae (morphology and chloro-plast; Matos, 1995; Matos and Schaal, 2000); P. montezumae andP. pseudostrobus (chloroplast microsatellite loci; Delgado et al.,2007); P. mugo and P. sylvestris (morphology; Christensen andDar, 1997); and P. palustris and P. taeda (morphology; Namkoong,1966). Artificial hybridizations between many pine species withintaxonomic subsections yield fertile seeds (Critchfield, 1986), dem-onstrating that incomplete mating barriers between allopatric Pi-nus species are common and suggesting that geographic distanceis a major barrier to natural hybridization among pine species.However, not all hypotheses of natural pine hybridization havewithstood genetic analysis. For example, trees long suspected ofrepresenting a hybrid swarm between P. arizonica and P. ponderosa(Epperson et al., 2003) instead represent a unique third taxon(Epperson et al., 2009).
There is also substantial evidence that pine species are capableof rather rapid migrations (Petit et al., 2004). The combination ofincomplete mating barriers and the opportunity for secondary con-tact via migration may have allowed infrequent, but evolutionarilysignificant, introgression within Pinus. In fact, the long-term reten-tion of ancestral polymorphism observed in Pinus could be partiallydriven by migrant alleles from occasional interspecific hybridiza-tion. These alleles would increase the diversity within populationsand slow the process of allelic coalescence. This may mean thatreticulate evolution is an important driving force behind pine ge-netic patterns. Detection of reticulation is not at all straightfor-ward, but is vital because assuming a hierarchical relationshipfor groups with a net-like rather than tree-like history may leadto erroneous conclusions (Doolittle and Bapteste, 2007; Posadaand Crandall, 2001; McDade, 1992, 1990). Conflicting relationshipsfor the Ponderosae have been reported based on samples of differ-ent characters and exemplars (Eckert and Hall, 2006; Gernandtet al., 2005; Krupkin et al., 1996; Liston et al., 1999). However, phy-logenetic incongruence can be due to incomplete lineage sorting,recombination, natural selection, random lineage sorting, homo-plasy, errors in phylogenetic inference, and reticulate evolution.
Estimates of intraspecific genetic diversity are useful for interpret-ing causes of incongruence because a large effective populationsize (Ne) suggests that incomplete lineage sorting may providethe entire explanation for lack of monophyly and even for incon-gruent results, as genomes in diverse species may be ‘‘mosaics ofconflicting genealogies” (Pollard et al., 2006). On the other hand,incongruence among species with limited diversity may suggestthe involvement of other mechanisms, such as reticulate evolutionor drift. Despite their large current effective population sizes, it ispossible that some pine species have undergone genetic bottle-necks in the past that were severe enough for drift to affect thelineage (Ledig, 2000).
1.1. Ponderosae taxonomy
Nineteen species of Ponderosae are sometimes recognized, butwe synonymize P. nubicola J.P. Perry with P. pseudostrobus, and P.donnell-smithii Masters with P. hartwegii (Farjon and Styles,1997). Two taxa have sometimes been treated within P. ponderosa(P. arizonica and P. washoensis), but are currently recognized as dis-tinct species. Rehfeldt (1999a) provided evidence for elevating P.arizonica from its varietal status under P. ponderosa. The narrowlyendemic P. washoensis is included in the Flora of North America(Kral, 1993). Pinus ponderosa var. scopulorum and P. arizonica var.stormiae are sometimes treated at the species level. Our samplingscheme recognizes these two taxa as varieties (Table 1).
The 17 current species are divided into two major groups: theCalifornia big-coned pines (Sabinianae; Loudon, 1838) and Pondero-sae sensu stricto (s.s.; Table 1). Three species (P. sabiniana, P. coulteri,and P. torreyana) are traditionally grouped in the Sabinianae basedon shared morphology (Little and Critchfield, 1969; Price et al.,1998). Chloroplast results (Gernandt et al., 2009) support proposalsbased on heptane biochemistry (Mirov, 1961) and seed fatty acids(Wolff et al., 2000) that P. jeffreyi, despite its superficial resemblanceto P. ponderosa, belongs with the Sabinianae. We use Sabinianae torefer to all four species of California big-coned pines (Table 1).
Floristic treatments (Farjon and Styles, 1997; Martínez, 1948;Perry, 1991; Price et al., 1998) have suggested subdividing Ponder-osae s.s. species in very different ways (Table 1), but these groupshave not been supported by phylogenetic analyses (Gernandtet al., 2005).
1.2. Experiment design
Given the complexity of previous taxonomic delineations andthe potential for a mosaic genome in some pines due to the poten-tial for hybridization, it is vital to sample multiple individualswithin each species and to also sample loci that segregate indepen-dently. We included a comprehensive sample of Ponderosae specieswith two to six individuals per species that represent the geo-graphic range of each taxon wherever possible. Three independentgene regions were used: two unlinked low-copy nuclear loci and alocus from the separately-segregating chloroplast organelle. Theseregions can be used to infer independent gene trees or networks toincrease the opportunity to detect incongruence patterns that maybe attributed to interspecific hybridization. Paternally inherited Pi-nus chloroplasts can provide powerful markers for detecting intro-gression when used in conjunction with nuclear markers.However, organelle genealogies are predominantly uniparentaland therefore susceptible to introgression (Liston et al., 2007). Ifsubstitution rates are comparable, the fourfold smaller effectivepopulation size (due to haploidy and uniparental inheritance ofchloroplasts) leads to faster coalescence for chloroplast than nucle-ar loci (Birky et al., 1983). However, mean Pinus substitution ratesare about threefold faster in nuclear than chloroplast loci (roughly0.12 vs. 0.04 substitutions per site per year, respectively (Willyard
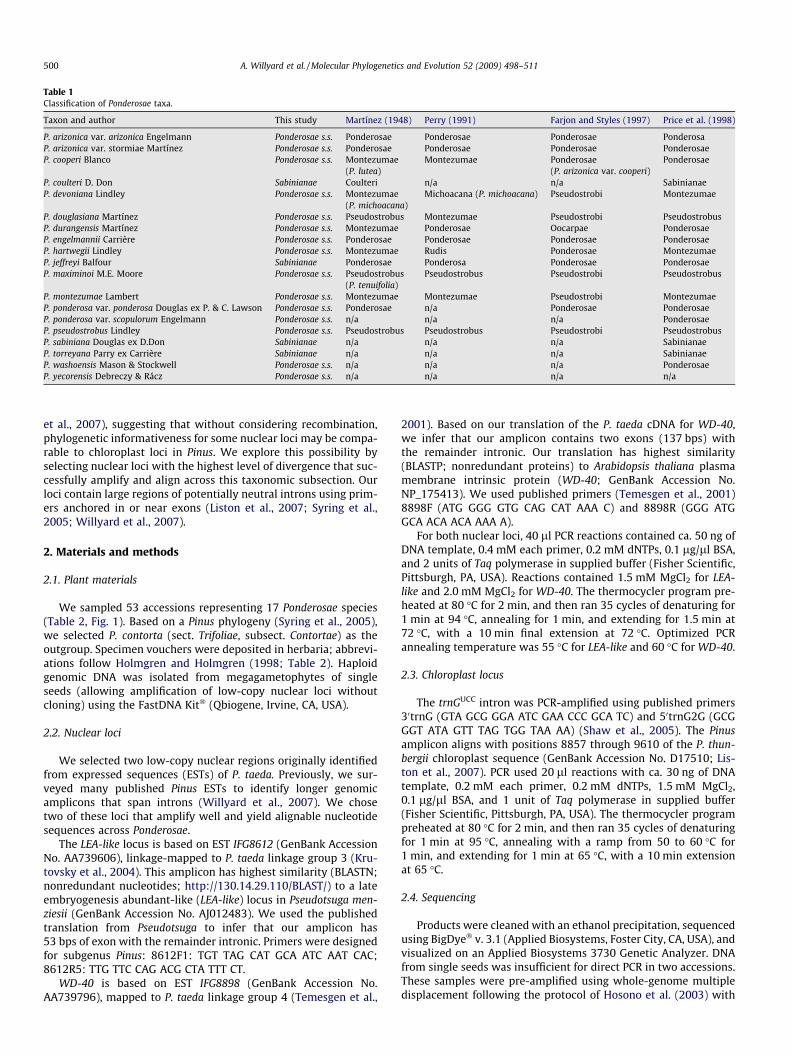
Table 1Classification of Ponderosae taxa.
Taxon and author This study Martínez (1948) Perry (1991) Farjon and Styles (1997) Price et al. (1998)
P. arizonica var. arizonica Engelmann Ponderosae s.s. Ponderosae Ponderosae Ponderosae PonderosaP. arizonica var. stormiae Martínez Ponderosae s.s. Ponderosae Ponderosae Ponderosae PonderosaeP. cooperi Blanco Ponderosae s.s. Montezumae
(P. lutea)Montezumae Ponderosae
(P. arizonica var. cooperi)Ponderosae
P. coulteri D. Don Sabinianae Coulteri n/a n/a SabinianaeP. devoniana Lindley Ponderosae s.s. Montezumae
(P. michoacana)Michoacana (P. michoacana) Pseudostrobi Montezumae
P. douglasiana Martínez Ponderosae s.s. Pseudostrobus Montezumae Pseudostrobi PseudostrobusP. durangensis Martínez Ponderosae s.s. Montezumae Ponderosae Oocarpae PonderosaeP. engelmannii Carrière Ponderosae s.s. Ponderosae Ponderosae Ponderosae PonderosaeP. hartwegii Lindley Ponderosae s.s. Montezumae Rudis Ponderosae MontezumaeP. jeffreyi Balfour Sabinianae Ponderosae Ponderosa Ponderosae PonderosaeP. maximinoi M.E. Moore Ponderosae s.s. Pseudostrobus
(P. tenuifolia)Pseudostrobus Pseudostrobi Pseudostrobus
P. montezumae Lambert Ponderosae s.s. Montezumae Montezumae Pseudostrobi MontezumaeP. ponderosa var. ponderosa Douglas ex P. & C. Lawson Ponderosae s.s. Ponderosae n/a Ponderosae PonderosaeP. ponderosa var. scopulorum Engelmann Ponderosae s.s. n/a n/a n/a PonderosaeP. pseudostrobus Lindley Ponderosae s.s. Pseudostrobus Pseudostrobus Pseudostrobi PseudostrobusP. sabiniana Douglas ex D.Don Sabinianae n/a n/a n/a SabinianaeP. torreyana Parry ex Carrière Sabinianae n/a n/a n/a SabinianaeP. washoensis Mason & Stockwell Ponderosae s.s. n/a n/a n/a PonderosaeP. yecorensis Debreczy & Rácz Ponderosae s.s. n/a n/a n/a n/a
500 A. Willyard et al. / Molecular Phylogenetics and Evolution 52 (2009) 498–511
et al., 2007), suggesting that without considering recombination,phylogenetic informativeness for some nuclear loci may be compa-rable to chloroplast loci in Pinus. We explore this possibility byselecting nuclear loci with the highest level of divergence that suc-cessfully amplify and align across this taxonomic subsection. Ourloci contain large regions of potentially neutral introns using prim-ers anchored in or near exons (Liston et al., 2007; Syring et al.,2005; Willyard et al., 2007).
2. Materials and methods
2.1. Plant materials
We sampled 53 accessions representing 17 Ponderosae species(Table 2, Fig. 1). Based on a Pinus phylogeny (Syring et al., 2005),we selected P. contorta (sect. Trifoliae, subsect. Contortae) as theoutgroup. Specimen vouchers were deposited in herbaria; abbrevi-ations follow Holmgren and Holmgren (1998; Table 2). Haploidgenomic DNA was isolated from megagametophytes of singleseeds (allowing amplification of low-copy nuclear loci withoutcloning) using the FastDNA Kit� (Qbiogene, Irvine, CA, USA).
2.2. Nuclear loci
We selected two low-copy nuclear regions originally identifiedfrom expressed sequences (ESTs) of P. taeda. Previously, we sur-veyed many published Pinus ESTs to identify longer genomicamplicons that span introns (Willyard et al., 2007). We chosetwo of these loci that amplify well and yield alignable nucleotidesequences across Ponderosae.
The LEA-like locus is based on EST IFG8612 (GenBank AccessionNo. AA739606), linkage-mapped to P. taeda linkage group 3 (Kru-tovsky et al., 2004). This amplicon has highest similarity (BLASTN;nonredundant nucleotides; http://130.14.29.110/BLAST/) to a lateembryogenesis abundant-like (LEA-like) locus in Pseudotsuga men-ziesii (GenBank Accession No. AJ012483). We used the publishedtranslation from Pseudotsuga to infer that our amplicon has53 bps of exon with the remainder intronic. Primers were designedfor subgenus Pinus: 8612F1: TGT TAG CAT GCA ATC AAT CAC;8612R5: TTG TTC CAG ACG CTA TTT CT.
WD-40 is based on EST IFG8898 (GenBank Accession No.AA739796), mapped to P. taeda linkage group 4 (Temesgen et al.,
2001). Based on our translation of the P. taeda cDNA for WD-40,we infer that our amplicon contains two exons (137 bps) withthe remainder intronic. Our translation has highest similarity(BLASTP; nonredundant proteins) to Arabidopsis thaliana plasmamembrane intrinsic protein (WD-40; GenBank Accession No.NP_175413). We used published primers (Temesgen et al., 2001)8898F (ATG GGG GTG CAG CAT AAA C) and 8898R (GGG ATGGCA ACA ACA AAA A).
For both nuclear loci, 40 ll PCR reactions contained ca. 50 ng ofDNA template, 0.4 mM each primer, 0.2 mM dNTPs, 0.1 lg/ll BSA,and 2 units of Taq polymerase in supplied buffer (Fisher Scientific,Pittsburgh, PA, USA). Reactions contained 1.5 mM MgCl2 for LEA-like and 2.0 mM MgCl2 for WD-40. The thermocycler program pre-heated at 80 �C for 2 min, and then ran 35 cycles of denaturing for1 min at 94 �C, annealing for 1 min, and extending for 1.5 min at72 �C, with a 10 min final extension at 72 �C. Optimized PCRannealing temperature was 55 �C for LEA-like and 60 �C for WD-40.
2.3. Chloroplast locus
The trnGUCC intron was PCR-amplified using published primers30trnG (GTA GCG GGA ATC GAA CCC GCA TC) and 50trnG2G (GCGGGT ATA GTT TAG TGG TAA AA) (Shaw et al., 2005). The Pinusamplicon aligns with positions 8857 through 9610 of the P. thun-bergii chloroplast sequence (GenBank Accession No. D17510; Lis-ton et al., 2007). PCR used 20 ll reactions with ca. 30 ng of DNAtemplate, 0.2 mM each primer, 0.2 mM dNTPs, 1.5 mM MgCl2,0.1 lg/ll BSA, and 1 unit of Taq polymerase in supplied buffer(Fisher Scientific, Pittsburgh, PA, USA). The thermocycler programpreheated at 80 �C for 2 min, and then ran 35 cycles of denaturingfor 1 min at 95 �C, annealing with a ramp from 50 to 60 �C for1 min, and extending for 1 min at 65 �C, with a 10 min extensionat 65 �C.
2.4. Sequencing
Products were cleaned with an ethanol precipitation, sequencedusing BigDye� v. 3.1 (Applied Biosystems, Foster City, CA, USA), andvisualized on an Applied Biosystems 3730 Genetic Analyzer. DNAfrom single seeds was insufficient for direct PCR in two accessions.These samples were pre-amplified using whole-genome multipledisplacement following the protocol of Hosono et al. (2003) with
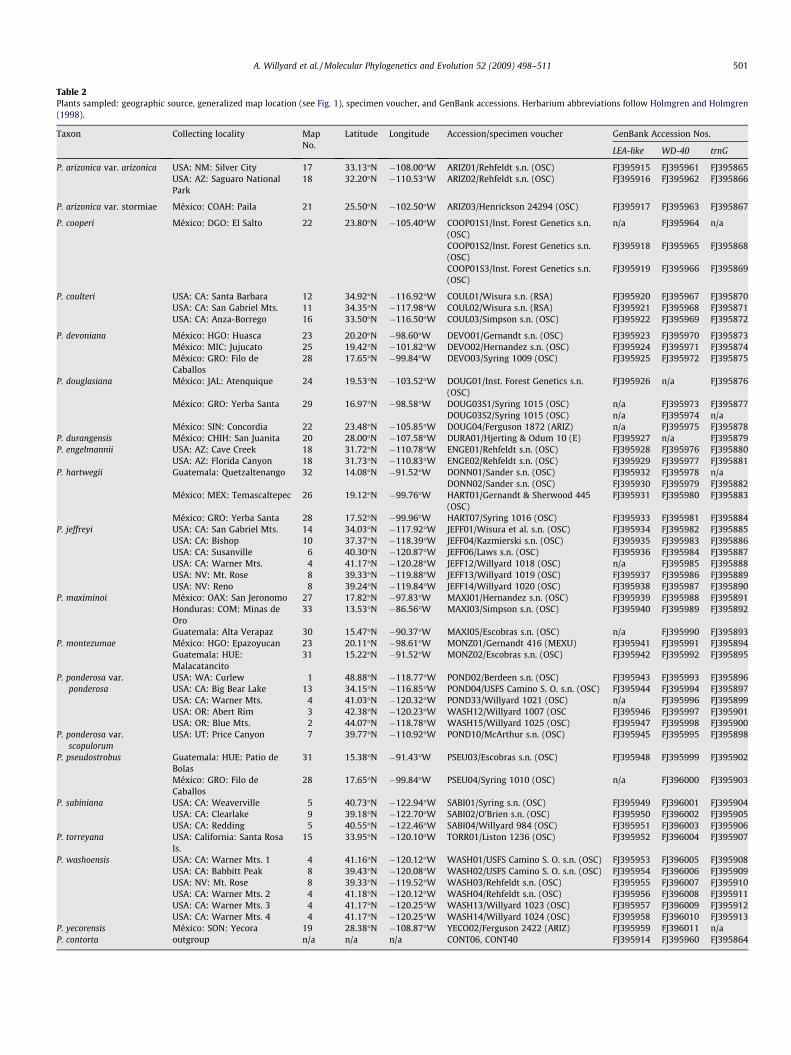
Table 2Plants sampled: geographic source, generalized map location (see Fig. 1), specimen voucher, and GenBank accessions. Herbarium abbreviations follow Holmgren and Holmgren(1998).
Taxon Collecting locality MapNo.
Latitude Longitude Accession/specimen voucher GenBank Accession Nos.
LEA-like WD-40 trnG
P. arizonica var. arizonica USA: NM: Silver City 17 33.13�N �108.00�W ARIZ01/Rehfeldt s.n. (OSC) FJ395915 FJ395961 FJ395865USA: AZ: Saguaro NationalPark
18 32.20�N �110.53�W ARIZ02/Rehfeldt s.n. (OSC) FJ395916 FJ395962 FJ395866
P. arizonica var. stormiae México: COAH: Paila 21 25.50�N �102.50�W ARIZ03/Henrickson 24294 (OSC) FJ395917 FJ395963 FJ395867
P. cooperi México: DGO: El Salto 22 23.80�N �105.40�W COOP01S1/Inst. Forest Genetics s.n.(OSC)
n/a FJ395964 n/a
COOP01S2/Inst. Forest Genetics s.n.(OSC)
FJ395918 FJ395965 FJ395868
COOP01S3/Inst. Forest Genetics s.n.(OSC)
FJ395919 FJ395966 FJ395869
P. coulteri USA: CA: Santa Barbara 12 34.92�N �116.92�W COUL01/Wisura s.n. (RSA) FJ395920 FJ395967 FJ395870USA: CA: San Gabriel Mts. 11 34.35�N �117.98�W COUL02/Wisura s.n. (RSA) FJ395921 FJ395968 FJ395871USA: CA: Anza-Borrego 16 33.50�N �116.50�W COUL03/Simpson s.n. (OSC) FJ395922 FJ395969 FJ395872
P. devoniana México: HGO: Huasca 23 20.20�N �98.60�W DEVO01/Gernandt s.n. (OSC) FJ395923 FJ395970 FJ395873México: MIC: Jujucato 25 19.42�N �101.82�W DEVO02/Hernandez s.n. (OSC) FJ395924 FJ395971 FJ395874México: GRO: Filo deCaballos
28 17.65�N �99.84�W DEVO03/Syring 1009 (OSC) FJ395925 FJ395972 FJ395875
P. douglasiana México: JAL: Atenquique 24 19.53�N �103.52�W DOUG01/Inst. Forest Genetics s.n.(OSC)
FJ395926 n/a FJ395876
México: GRO: Yerba Santa 29 16.97�N �98.58�W DOUG03S1/Syring 1015 (OSC) n/a FJ395973 FJ395877DOUG03S2/Syring 1015 (OSC) n/a FJ395974 n/a
México: SIN: Concordia 22 23.48�N �105.85�W DOUG04/Ferguson 1872 (ARIZ) n/a FJ395975 FJ395878P. durangensis México: CHIH: San Juanita 20 28.00�N �107.58�W DURA01/Hjerting & Odum 10 (E) FJ395927 n/a FJ395879P. engelmannii USA: AZ: Cave Creek 18 31.72�N �110.78�W ENGE01/Rehfeldt s.n. (OSC) FJ395928 FJ395976 FJ395880
USA: AZ: Florida Canyon 18 31.73�N �110.83�W ENGE02/Rehfeldt s.n. (OSC) FJ395929 FJ395977 FJ395881P. hartwegii Guatemala: Quetzaltenango 32 14.08�N �91.52�W DONN01/Sander s.n. (OSC) FJ395932 FJ395978 n/a
DONN02/Sander s.n. (OSC) FJ395930 FJ395979 FJ395882México: MEX: Temascaltepec 26 19.12�N �99.76�W HART01/Gernandt & Sherwood 445
(OSC)FJ395931 FJ395980 FJ395883
México: GRO: Yerba Santa 28 17.52�N �99.96�W HART07/Syring 1016 (OSC) FJ395933 FJ395981 FJ395884P. jeffreyi USA: CA: San Gabriel Mts. 14 34.03�N �117.92�W JEFF01/Wisura et al. s.n. (OSC) FJ395934 FJ395982 FJ395885
USA: CA: Bishop 10 37.37�N �118.39�W JEFF04/Kazmierski s.n. (OSC) FJ395935 FJ395983 FJ395886USA: CA: Susanville 6 40.30�N �120.87�W JEFF06/Laws s.n. (OSC) FJ395936 FJ395984 FJ395887USA: CA: Warner Mts. 4 41.17�N �120.28�W JEFF12/Willyard 1018 (OSC) n/a FJ395985 FJ395888USA: NV: Mt. Rose 8 39.33�N �119.88�W JEFF13/Willyard 1019 (OSC) FJ395937 FJ395986 FJ395889USA: NV: Reno 8 39.24�N �119.84�W JEFF14/Willyard 1020 (OSC) FJ395938 FJ395987 FJ395890
P. maximinoi México: OAX: San Jeronomo 27 17.82�N �97.83�W MAXI01/Hernandez s.n. (OSC) FJ395939 FJ395988 FJ395891Honduras: COM: Minas deOro
33 13.53�N �86.56�W MAXI03/Simpson s.n. (OSC) FJ395940 FJ395989 FJ395892
Guatemala: Alta Verapaz 30 15.47�N �90.37�W MAXI05/Escobras s.n. (OSC) n/a FJ395990 FJ395893P. montezumae México: HGO: Epazoyucan 23 20.11�N �98.61�W MONZ01/Gernandt 416 (MEXU) FJ395941 FJ395991 FJ395894
Guatemala: HUE:Malacatancito
31 15.22�N �91.52�W MONZ02/Escobras s.n. (OSC) FJ395942 FJ395992 FJ395895
P. ponderosa var.ponderosa
USA: WA: Curlew 1 48.88�N �118.77�W POND02/Berdeen s.n. (OSC) FJ395943 FJ395993 FJ395896USA: CA: Big Bear Lake 13 34.15�N �116.85�W POND04/USFS Camino S. O. s.n. (OSC) FJ395944 FJ395994 FJ395897USA: CA: Warner Mts. 4 41.03�N �120.32�W POND33/Willyard 1021 (OSC) n/a FJ395996 FJ395899USA: OR: Abert Rim 3 42.38�N �120.23�W WASH12/Willyard 1007 (OSC FJ395946 FJ395997 FJ395901USA: OR: Blue Mts. 2 44.07�N �118.78�W WASH15/Willyard 1025 (OSC) FJ395947 FJ395998 FJ395900
P. ponderosa var.scopulorum
USA: UT: Price Canyon 7 39.77�N �110.92�W POND10/McArthur s.n. (OSC) FJ395945 FJ395995 FJ395898
P. pseudostrobus Guatemala: HUE: Patio deBolas
31 15.38�N �91.43�W PSEU03/Escobras s.n. (OSC) FJ395948 FJ395999 FJ395902
México: GRO: Filo deCaballos
28 17.65�N �99.84�W PSEU04/Syring 1010 (OSC) n/a FJ396000 FJ395903
P. sabiniana USA: CA: Weaverville 5 40.73�N �122.94�W SABI01/Syring s.n. (OSC) FJ395949 FJ396001 FJ395904USA: CA: Clearlake 9 39.18�N �122.70�W SABI02/O’Brien s.n. (OSC) FJ395950 FJ396002 FJ395905USA: CA: Redding 5 40.55�N �122.46�W SABI04/Willyard 984 (OSC) FJ395951 FJ396003 FJ395906
P. torreyana USA: California: Santa RosaIs.
15 33.95�N �120.10�W TORR01/Liston 1236 (OSC) FJ395952 FJ396004 FJ395907
P. washoensis USA: CA: Warner Mts. 1 4 41.16�N �120.12�W WASH01/USFS Camino S. O. s.n. (OSC) FJ395953 FJ396005 FJ395908USA: CA: Babbitt Peak 8 39.43�N �120.08�W WASH02/USFS Camino S. O. s.n. (OSC) FJ395954 FJ396006 FJ395909USA: NV: Mt. Rose 8 39.33�N �119.52�W WASH03/Rehfeldt s.n. (OSC) FJ395955 FJ396007 FJ395910USA: CA: Warner Mts. 2 4 41.18�N �120.12�W WASH04/Rehfeldt s.n. (OSC) FJ395956 FJ396008 FJ395911USA: CA: Warner Mts. 3 4 41.17�N �120.25�W WASH13/Willyard 1023 (OSC) FJ395957 FJ396009 FJ395912USA: CA: Warner Mts. 4 4 41.17�N �120.25�W WASH14/Willyard 1024 (OSC) FJ395958 FJ396010 FJ395913
P. yecorensis México: SON: Yecora 19 28.38�N �108.87�W YECO02/Ferguson 2422 (ARIZ) FJ395959 FJ396011 n/aP. contorta outgroup n/a n/a n/a CONT06, CONT40 FJ395914 FJ395960 FJ395864
A. Willyard et al. / Molecular Phylogenetics and Evolution 52 (2009) 498–511 501

Fig. 1. Generalized collection locales for plant materials in United States of America, México, Guatemala, and Honduras (WGS 84). Map numbers correspond to Table 2.
502 A. Willyard et al. / Molecular Phylogenetics and Evolution 52 (2009) 498–511
phi29 DNA polymerase, pyrophosphatase (New England Biolabs,Ipswitch, MA, USA), and random hexamer primers (Operon, Hunts-ville, AL, USA). The whole-genome product was used as templatefor PCR. For five samples, DNA was isolated from an excised gelband with Ultra CleanTM DNA purification kit (MoBio Laboratories,Carlsbad, CA) prior to sequencing. Nucleotide sequences are avail-able in GenBank (Table 2).
2.5. Analysis of nuclear loci
Forward and reverse nucleotide reads were assembled usingCodonCode (vers. 1.4.6; CodonCode Corporation, Dedham, MA)and edited by hand to create a consensus sequence. Alignmentswere made by eye to minimize the number of inferred indels. Eachlocus was analyzed independently. For the Bayesian analysis, anucleotide substitution model was selected with the Akaike Infor-mation Criterion (AIC) using MrModeltest (vers. 2.0; Nylanderet al., 2004). Gaps were treated as missing data in the nucleotide
partition and coded as present/absent with the simple indel codingmethod (Simmons and Ochoterena, 2000) using SeqState (vers. 1.4;Müller, 2005). Indel characters were analyzed using an equal-ratebinary model. Three partitions were defined: nonsynonymous(approximated with 1st and 2nd codon positions of inferredexons); synonymous (3rd codon positions plus noncoding se-quences); and indel characters. We assessed the usefulness of par-titions with AIC scores (Akaike, 1974) and a comparison of thenumber of supported nodes.
We performed two runs using MrBayes (vers. 3.1; Ronquist andHuelsenbeck, 2003) for each locus. Each run used four simultaneouschains and 10 million generations of Metropolis-coupled MonteCarlo simulations, sampling every 1000 generations to save10,000 trees per run, with default settings for chain heating andrates allowed to vary by partition. We assessed convergence andchose the number of samples to discard as burn-in based on sta-tionarity of a plot of the generation versus log-likelihood for eachrun. We also compared plots of tree distances and split frequencies

A. Willyard et al. / Molecular Phylogenetics and Evolution 52 (2009) 498–511 503
between two runs using the Comparetree function in MrBayes. Onemajority-rule consensus tree was built for each locus by combiningtrees generated by two runs, discarding the first 1000 trees fromeach run. Branch lengths were estimated by averaging across all re-tained trees. Nodes with less than 0.95 posterior probabilities werecollapsed. Alignments and trees are available at TreeBase (studyaccession number S2297; matrix accession number M4362).
Each nuclear locus was also analyzed with the parsimony crite-rion using PAUP* (vers. 4.0b10; Swofford, 2002). The heuristicsearch used stepwise addition of starting trees, 1000 random addi-tions, with 50,000 trees retained, and tree-bisection-reconnectionbranch-swapping. Nonparametric bootstrap was performed with100 replicates, holding 50 trees each for a random addition of1000 replicates. Strict consensus trees were compared with Bayes-ian consensus trees and Bayesian-supported nodes with parsimonybootstraps less than 50 were collapsed.
Because phylogenetic models assume a hierarchical, bifurcatingtree that may not apply to these lineages, we explored an alterna-tive network method that allows reticulate evolution. Nuclear net-works were created with neighbor-net (Huson and Bryant, 2006)using SplitsTree (vers. 4.8). For distance calculations, we chosethe nucleotide substitution model favored by AIC (see Bayesianphylogeny results). Because the GTR model preferred for LEA-likeis not available in SplitsTree, we chose the most parameterizedmodel. Thus, for both loci, distances were computed under maxi-mum likelihood with an HKY85 model, transitions: transversionsweighted 2:1, and gamma, proportion of invariable sites, and basefrequencies estimated empirically.
If detected, genetic recombination or a departure from neutral-ity can offer alternative explanations for incongruence in a phylo-genetic analysis. Evidence of recombination was evaluated usingalignments with all gaps removed (Posada, 2002), excluding thedivergent P. maximinoi (Oaxaca) sequence from LEA-like, usingthe Phi test (Bruen et al., 2006) in SplitsTree and RDP, GENECONV,Chimaera, MaxChi, BootScan, SisScan, 3Seq, and LARD methods inRDP3 (vers. 3.22; Martin et al., 2005). For species with three ormore accessions per locus, we tested departure from neutralitywith: Fu and Li D and F (outgroup option; Fu and Li, 1993), Fayand Wu H (outgroup option; Fay and Wu, 2000), and Tajima D (Taj-ima, 1989) using DnaSP (vers. 4.10.9; Rozas et al., 2003). Signifi-cance at the 0.95 level was adjusted for multiple tests (Rice,1989). We also tested interspecific comparisons using all accessionsfor each locus. For this test, significance was estimated from coa-lescent simulations (no recombination, moderate recombination,or free recombination) with 15, 25, 50, and 100 bp sliding win-dows. Interspecific tests were repeated with alignments that ex-cluded all gaps and all missing data.
When lineage sorting is incomplete, multiple accessions of aspecies fail to resolve as monophyletic, and this pattern is difficultto distinguish from reticulate ancestry. We used population ge-netic theory to address the extent to which polyphyly could beexplained in the Ponderosae data set by this phenomenon ratherthan reticulate evolution. A rough approximation of the coances-try coefficient hw (Watterson, 1975) was calculated in DnaSP forthree species with five or more samples per locus (P. jeffreyi, P.ponderosa, and P. washoensis). The mean hw for two loci was usedto estimate effective population size (Ne) for each species usingthe formula Ne = hw/(4 l G), assuming generation timeG = 50 years. Because nuclear mutation rates vary widely, we cal-culated Ne using the mean rate for Pinus across nine nuclear loci(l = 0.70 � 10�9 substitutions per site per year) and for the meanplus and minus one standard deviation (SD = 0.27 � 10�9 substitu-tions per site per year; Willyard et al., 2007). We estimated thenumber of years for each species until allelic monophyly is morelikely than paraphyly using the formula: 1.665 � 2 Ne G (Rosen-berg, 2003).
As another coarse estimate of the expectation that gene treetopologies could arise through random lineage sorting, we simu-lated 1000 trees for each of three levels of effective population size(30, 100, and 200 � 103) using the option in Mesquite (vers.2, beta2; Maddison and Maddison, 2006) to generate gene trees within aspecies tree using a simple coalescence model (i.e. for a neutralgene and a constant population size). For this test, we used a speciestree that unites two polytomies (i.e. four Sabinianae and 13 Ponder-osae s.s.). The symmetric distance (Penny and Hendy, 1985) was cal-culated in PAUP* for three ‘clouds’ of 1000 simulated trees, and foreach consensus gene tree (with poorly-supported nodes collapsedas described above) against each cloud of simulated trees. We com-pared the distribution of symmetric distances for each gene tree toeach cloud versus the distribution within each cloud.
2.6. Analysis of chloroplast locus
Nucleotide sequences of trnG were aligned by hand and haplo-type networks were created using median joining (Bandelt et al.,1999) in Network vers. 4.5.0.0, www.fluxus-engineering.com.
3. Results
3.1. Nuclear alignments
Sequences from 45 individuals representing 17 species for LEA-like were aligned with a length of 1630 bps and 3.05% missing data.The inferred intron varied from 837 to 1515 bps. The simple indelcoding method inferred 71 indel characters, 33 shared and 38 sin-gletons. Sequences from 51 individuals representing 16 species forWD-40 aligned across 1182 bps with 4.43% missing data. Thelength of the inferred intronic regions varied from 1000 to1116 bps. We coded 18 indel characters for WD-40, 14 sharedand four singletons. Alignment of sequences from 49 individualsrepresenting 16 species for the trnG intron required one indel ina mononucleotide repeat, for an aligned length of 722 bps.
The LEA-like sequence for P. maximinoi (Oaxaca) is highly diver-gent, resolving as sister to the remaining Ponderosae on the genetree and yielding a hw in relation to the Honduras accession nearlythree SD from the mean (data not shown). Both accessions of P.maximinoi were verified by repeated amplification and resequenc-ing. High intraspecific divergence in both nuclear loci for P. mont-ezumae (data not shown) was also verified by repeatedamplification and resequencing. The LEA-like sequence for P. sabin-iana (Clearlake) contains several small indels in the inferred exon,suggesting that our PCR amplicon may be a pseudogene. We choseto retain this sample in our analyses.
3.2. Bayesian phylogeny
The AIC favored GTR + G for LEA-like and HKY + G for WD-40. Forboth loci, two independent Bayesian runs yielded majority-rule con-sensus trees with identical topologies (Figs. 2 and 3). For two runs,the average standard deviations of split frequencies were 0.003840and 0.003971 for LEA-like and WD-40 loci, respectively.
Analyses with and without indel coding resulted in identicaltopologies, differing only in posterior probabilities; some nodeswere moved above or below our threshold of 0.95 for well-sup-ported nodes. Inclusion of indel coding resolved more deep nodesfor LEA-like and more highly-supported nodes for WD-40. Topolo-gies were identical and branch lengths were nearly identical forboth partitioning schemes for each locus. For LEA-like (53 exonicbps), the two-partition model (nucleotides and indel-codes) waspreferred, but for WD-40 (using 103 bps from the first exon), threepartitions (synonymous, nonsynonymous, and indel coding) per-

Fig. 2. Bayesian majority-rule consensus tree for LEA-like showing only nodes with 0.95 posterior probabilities or higher. Numbers are bootstrap proportions from parsimonyanalysis. Branches are proportional to length; scale bar is substitutions per site. See Fig. 6a for trnG haplotype symbols. Node marked with a star had a parsimony bootstrapless than 50, but the Bayesian posterior probability was 0.98.
504 A. Willyard et al. / Molecular Phylogenetics and Evolution 52 (2009) 498–511
formed better. We present only trees inferred with the inclusion ofindel coding and the preferred partition.
3.3. Parsimony phylogeny
The parsimony strict consensus gene trees inferred similartopologies to their Bayesian counterparts except that in WD-40,
eight nodes with 0.95 or greater posterior probability receivedbootstrap support below 50. We collapsed these nodes as well.Based on this criterion, two nodes would collapse in LEA-like. How-ever, one node with a low bootstrap proportion (highlighted with astar in Fig. 2) received a Bayesian posterior probability of 0.98. Be-cause the low support from parsimony may be an artifact, weelected to show this node in Fig. 2.

Fig. 3. Bayesian majority-rule consensus tree for WD-40 showing only nodes with 0.95 posterior probabilities or higher and supported by parsimony bootstrap greater than50. Numbers are bootstrap proportions from parsimony analysis. Branches are proportional to length; scale bar is substitutions per site. See Fig. 6a for trnG haplotypesymbols.
A. Willyard et al. / Molecular Phylogenetics and Evolution 52 (2009) 498–511 505
3.4. Nuclear gene trees and networks
The nuclear gene trees (Figs. 2 and 3) contain numerous polyto-mies. If the basal reticulations on the LEA-like and WD-40 networks(Figs. 4 and 5) are viewed as ambiguities rather than lateral trans-fers, then these networks appear similar to their respective genetrees. A LEA-like network that excludes P. maximinoi (Oaxaca) dis-played a similar level of resolution (results not shown). LEA-like re-
solves P. maximinoi (Oaxaca) as an outlier to two clades: onecontains Ponderosae s.s., the other with the four Sabinianae (includ-ing P. jeffreyi as expected; Figs. 2 and 4). In contrast, WD-40 re-solves three clades (Figs. 3 and 5). One unites all P. arizonicasamples with P. ponderosa var. scopulorum, P. montezumae (Hidal-go), and P. maximinoi (Honduras). The second clade contains theremaining Ponderosae s.s. plus a derived, monophyletic groupingof all three samples of P. coulteri. The third clade contains all Sabin-

Fig. 4. LEA-like neighbor-net network created using maximum likelihood distances. Oval highlights clade that contains four Sabinianae species.
Fig. 5. WD-40 neighbor-net network created using maximum likelihood distances. Ovals highlight two clades that contain the four Sabinianae species.
506 A. Willyard et al. / Molecular Phylogenetics and Evolution 52 (2009) 498–511

A. Willyard et al. / Molecular Phylogenetics and Evolution 52 (2009) 498–511 507
ianae except P. coulteri, and also contains five accessions classifiedin Ponderosae s.s.: two P. ponderosa, and three P. washoensis.
3.5. Chloroplast haplotype network
We excluded position 492 in the trnG alignment due to ambigu-ities in several sequences. Six phylogenetically informative substi-tutions (positions 91, 180, 548, 563, 568, and 604 in the alignment)yield six haplotypes that differ by one or two substitutions: CTC-GAC (OUTGROUP); CTCGTC (MAIN SABINIANAE); ATCTTC (COUL-TER); ATTTTC (NORTHERN SIERRA MADRE); CTTGTC (MEXICAN);and CCTGTA (PONDEROSA) (Fig. 6). The OUTGROUP haplotype dif-fers from MAIN SABINIANAE by one substitution (position 568),and the PONDEROSA haplotype differs from MEXICAN by two un-ique substitutions (positions 180 and 604), but the main cycle ofthe network cannot be automatically resolved into a tree becausetwo alternate three-step paths (both involving positions 91, 548,and 563) connect MAIN SABINIANAE and NORTHERN SIERRA MAD-RE haplotypes with either COULTER or MEXICAN as the intermedi-ate. Plotting trnG haplotypes on nuclear gene trees (Figs. 2 and 3)suggests a substantially different chloroplast lineage. However,the trnG network cycle can be arbitrarily broken (Fig. 6b) to yield
Fig. 6. (a) Chloroplast trnG haplotype network. Single and double lines represent one an563, 568, and 604. Number of accessions in parenthesis. Species with more than one ha
a topology with a Sabinianae-Ponderosa s.s. divergence similar tothat recovered from cpDNA phylogeny (Gernandt et al., 2009).
For 13 species, only one chloroplast haplotype was observed.However, two accessions of P. arizonica var. arizonica carry theNORTHERN SIERRA MADRE, while P. arizonica var. stormiae (Coahu-ila) shares the MEXICAN haplotype. Pinus maximinoi (Honduras)and Pinus washoensis (Babbitt Peak) share the MAIN SABINIANAEhaplotype.
3.6. Recombination
Excluding the divergent P. maximinoi (Oaxaca) accession andusing alignments with all gaps removed, the Phi test finds signifi-cant evidence for recombination for LEA-like (P = 0.037), but not forWD-40 (P = 0.915). With all missing data removed from LEA-like,the Phi test is not significant (P = 0.376).
3.7. Neutrality
After correcting for multiple tests, no intraspecific test revealed asignificant departure from neutrality at either locus. Negativedeparture is indicated for LEA-like at all interspecific tests
d two nucleotide substitutions, respectively, at six aligned positions: 91, 180, 548,plotype are in bold. (b) Arbitrarily resolved network (see Section 3.5).

Table 3Projected coalescence times for three species. Effective population sizes (Ne) are inferred from the mean intraspecific coancestry coefficient (hw) for two loci assuming ageneration time G = 50. Years for monophyly to be more likely than paraphyly (million years to coalesce) are estimated with the formula 1.665 � 2 Ne G by bracketing the meanmutation rate (l = 0.70 � 10�9 substitutions per site per year) with the rate plus and minus one SD (0.27 � 10�9) as described in Section 2.5.
LEA-like WD-40 Mean Ne (� 103) Million years to coalesce
n hw n hw hw l: +1 SD/mean/�1 SD
P. jeffreyi 5 0.00433 6 0.00447 0.00440 51/31/23 9/5/4P. washoensis 6 0.01020 6 0.00650 0.00835 97/60/43 16/10/7P. ponderosa 5 0.01642 6 0.01211 0.01427 166/102/74 28/17/12
508 A. Willyard et al. / Molecular Phylogenetics and Evolution 52 (2009) 498–511
(P < 0.02), consistent with positive selection. However, these testsare not significant when all missing data are removed.
3.8. Time to monophyly
For three species with five or more samples, we used intraspe-cific diversity to infer years until allelic monophyly is more likelythan paraphyly. These calculations suggest that Ne ranges fromca. 23 � 103 to 166 � 103 and years to coalesce from ca. 4 to 28million years (Table 3).
3.9. Coalescent simulations
Distributions of symmetric distances within a 1000-tree cloudof simulated trees are nearly identical at three levels of Ne
(Fig. 7a). The WD-40 consensus gene tree differs more from a cloudof simulated trees (symmetric distances range from 68 to 70) thandoes the LEA-like consensus gene tree (symmetric distances rangefrom 64 to 66; Fig. 7b). However, ranges of mean distances fromeither consensus gene tree to the cloud (Fig. 7b) are far belowthe range of distances within each cloud of trees (94–102; Fig. 7a).
4. Discussion
Our tests did not reveal evidence for genetic recombination orfor a departure from neutrality. Thus, neither of these mechanismscan explain the lack of monophyletic species observed across the
Fig. 7. Distribution of symmetric distances for gene trees simulated using a simplecoalescent model within a species tree; (a) within ‘clouds’ of gene trees simulatedfor three levels of effective population size (Ne); (b) from the LEA-like consensusgene tree and from the WD-40 consensus gene tree to the cloud of trees simulatedusing Ne = 100,000.
nuclear gene trees. Projections based on intraspecific genetic diver-sity and on coalescent simulations hint that the retention of ances-tral polymorphism may explain most incongruence in thisPonderosae data set. Mean coalescence times for two species (P.ponderosa and P. washoensis; Table 3) approach the inferred stemage (about 15 million years) for the entire 17-species subsectionand all three species meet or exceed the inferred crown age (about5 million years) (Willyard et al., 2007), suggesting that allelicmonophyly may be unlikely for many loci across their nuclear gen-omes. Similarly, coalescent simulations for our 17-species phylog-enies reveal that tree-to-tree distances within a cloud of simulatedtrees are large enough to contain the distances of each gene tree tothe cloud. Thus, our phylogenetic trees combine two featureswhich increase the probability of incongruence: numerous tipsand species with large effective population sizes. For these phylog-enies, reticulate evolution need not be invoked to explain most in-stances of incongruence. In some data sets, the removal of aputative hybrid allele can improve the resolution. For our Ponder-osae gene trees, excluding the divergent P. maximinoi (Oaxaca)accession yields a nearly identical topology (results not shown).
A lack of allelic monophyly was also observed in a Ponderosaephylogeny based on different taxonomic sampling that used se-quences of chloroplast noncoding regions (Gernandt et al., 2009).Despite their morphological and ecological distinctiveness, a pat-tern of molecular polyphyly may be expected for these species be-cause effective population sizes are large relative to the number ofgenerations since divergence. In the Ponderosae, this pattern ex-tends rather deeply into the gene trees, and none of the previouslyproposed subdivisions within Ponderosae s.s. (Table 1) are resolvedin either gene tree. This suggests that these groupings are suffi-ciently young that incomplete lineage sorting could explain con-flicting placements within Ponderosae s.s.
However, we found support for the traditional Sabinianae-Pon-derosae s.s. clades (Figs. 2–5 and 6b). Across this deep node, con-flicts between three independent genomic regions are less likelyto be attributable to incomplete lineage sorting, and can thus beused to identify potential examples of reticulate evolution. Themost dramatic example of incongruence in our data set is the res-olution of a monophyletic P. coulteri clade within Ponderosae s.s. inWD-40 (Figs. 3 and 5). In addition, five Ponderosae s.s. resolve withSabinianae in WD-40 (Figs. 3 and 5) and two Ponderosae s.s. sharethe MAIN SABINIANAE chloroplast haplotype (Fig. 6).
4.1. Pinus coulteri
The very distinctive Coulter pine is allied with two other Cali-fornia big-cone pines (P. sabiniana and P. torreyana; Price et al.,1998). Unique allozyme alleles are observed in some P. coulteripopulations, and hybridization with P. jeffreyi was proposed as apotential source for these alleles (Ledig, 2000). In the presentstudy, three accessions of P. coulteri resolve with Ponderosae s.s.in WD-40 as a monophyletic clade with a moderate branch length.At this level of sampling (three P. coulteri; 48 others), monophylydue to random branching is highly unlikely (P < 0.01; Rosenberg,2007). Pinus coulteri’s intraspecific diversity can be roughly

A. Willyard et al. / Molecular Phylogenetics and Evolution 52 (2009) 498–511 509
approximated using the mean of two loci for three accessions inthis study as hw = 0.00729. This diversity is relatively low, suggest-ing that P. coulteri is unlikely to have maintained ancient WD-40 al-leles across its genome. However, differential retention of ancestralalleles can occur due to locus-specific effects during a geneticbottleneck.
The WD-40 gene tree topology could be explained by hybridiza-tion. Artificial and a few putative natural P. coulteri � P. jeffreyi hy-brids have been viewed as crossing the Sabinianae-Ponderosae s.s.division (Critchfield, 1966), but our results confirm that P. coulteriand P. jeffreyi are rather closely related members of the Sabinianae.Pinus coulteri has not been successfully crossed with any extantPonderosae s.s. species (Critchfield, 1966). Further, the topology ar-gues for ‘ancient’ rather than ‘recent’ introgression because thenode representing the most recent common ancestor of the ‘‘pon-derosae s.s.-style” P. coulteri alleles is relatively deep in the WD-40 gene tree.
We propose that P. coulteri might have retained WD-40 allelesfrom an unknown Ponderosae s.s. parent and that this could ac-count for the unique allozyme alleles as well. Two alternativescan be envisioned: (i) introgression after P. coulteri had speciated;or (ii) P. coulteri arising as a diploid hybrid species. In either case,hybridization was likely followed by one or more bottlenecks thatpurged part of the genome. Pinus coulteri’s massive and well-armedcones may have contributed to reproductive isolation. Adaptationto different seed predators (Borchert, 1985) might have allowedP. coulteri to move into hotter and drier foothill habitats than eitherof its parents (or its introgressing partner), providing reproductiveisolation by allopatry. Scenarios of either introgression or hybridspeciation fit a theoretical framework for hybridization as an evo-lutionary stimulus (Anderson and Stebbins, 1954) and we are con-ducting further sampling to address the origin of P. coulteri.
4.2. Pinus ponderosa and P. washoensis
Throughout much of its geographic range, P. jeffreyi meetslower-altitude P. ponderosa or higher-altitude P. washoensis atthe margins of each species’ zone. Morphological traits supporta few natural hybrids between P. jeffreyi and P. ponderosa (Haller,1962), and the nature of this putative introgression is moreinteresting in light of our current understanding that P. jeffreyiis part of the Sabinianae lineage. In LEA-like, all accessions of P.ponderosa and P. washoensis resolve as expected within Pondero-sae s.s. Our trnG network supports a transfer of the MAIN SABIN-IANAE chloroplast haplotype into one individual of P. washoensis(Babbitt Peak), which harbors a haplotype that is three substitu-tions removed from its conspecifics (Fig. 6). WD-40 resolves theBabbitt Peak accession plus two other P. washoensis and two P.ponderosa individuals with the Sabinianae. The remaining ‘mis-placed’ individuals carry the expected PONDEROSA chloroplasthaplotype (Fig. 6a). This supports a low level of ongoing intro-gression between P. jeffreyi and P. ponderosa and between P. jef-freyi and P. washoensis.
Studies that place a P. washoensis allele sister to P. jeffreyi or sis-ter to P. sabiniana (Patten and Brunsfeld, 2002; Prager et al., 1976),or that place P. jeffreyi within Ponderosae s.s. (Eckert and Hall, 2006)may be footprints of introgression. We hypothesize that reticulateancestry might contribute to a preference for high-altitude sites inP. washoensis (Haller, 1965; Mason and Stockwell, 1945). All spe-cies of Sabinianae grow in colder climates or on ultramafic soil (P.jeffreyi; Haller, 1962) or in more arid habitats (P. coulteri, P. sabin-iana, and P. torreyana) than P. ponderosa. Perhaps high-altitude Wa-shoe pines represent a lineage that has retained more of theintrogressed Sabinianae genome because of traits that are moreuseful in harsh climates. Additional information from the mater-nally inherited mitochondrial genome (Godbout et al., 2005) may
be useful to detect recent hybridization, and we are currentlyassessing introgression in P. washoensis using nuclear microsatel-lite loci for population-level samples.
The lack of reciprocal monophyly for P. ponderosa and P. washo-ensis and their shared chloroplast haplotype might be interpretedas support for the conclusion that the narrowly endemic P. washo-ensis is synonymous with the wide-ranging P. ponderosa (Bray-shaw, 1997; Lauria, 1997; Niebling and Conkle, 1990; Rehfeldt,1999b). However, we note that none of the Ponderosae speciesachieve monophyly in both of our gene trees.
4.3. Incomplete lineage sorting or reticulation?
Anomalous results for P. maximinoi and P. montezumae could beexplained by incomplete lineage sorting, but there are indicationsthat future studies designed to detect reticulate ancestry may befruitful. Pinus maximinoi encompasses an unusual range of geneticdiversity across its wide distribution. In our study, P. maximinoi(Oaxaca) is highly divergent from other LEA-like sequences, but thisaccession is unremarkable in WD-40, and it is the P. maximinoi(Honduras) allele that resolves unexpectedly in WD-40. Artificialhybrids can be created between P. maximinoi and P. taeda (subsect.Australes; Dvorak et al., 2000). These clues suggest that our resultscould be due to misidentifications, cryptic species, or introgression(perhaps even outside its taxonomic subsection).
Although our two P. montezumae accessions do not sort acrossthe Sabinianae-Ponderosae s.s. divergence, the sequences resolvein very different locations on both nuclear gene trees despite shar-ing a trnG haplotype (Fig. 6a). Because P. montezumae can be diffi-cult to distinguish from P. devoniana, P. hartwegii, and P.pseudostrobus (Perry, 1991), misidentification cannot be ruledout. Alternatively, the extreme variability may be attributed tothe complex patterns of interspecific hybridization reported for P.montezumae with P. pseudostrobus and with P. hartwegii (Delgadoet al., 2007; Matos and Schaal, 2000). Recent introgression wouldnot explain our placement of the Hidalgo accession because thegeographic ranges of the species that P. montezumae joins (P.durangensis and P. arizonica) do not extend into Hidalgo. Incom-plete lineage sorting could create the patterns we observe, but inlight of strong evidence for ongoing localized hybridization, our re-sults do not exclude ancient introgression between P. montezumaeand previously sympatric species.
4.4. Species tree
Because the gene trees inferred by LEA-like and WD-40 are dif-ferent, we do not present a combined species phylogeny. Ourtwo nuclear gene trees are too incongruent to calculate ‘‘Concor-dance Factors” for internal nodes (Baum, 2007) using BUCKy(Ané et al., 2007). We note that any quantitative assessment of dis-cordance is obscured by the astronomical number of potentialtopologies possible for a 53-tip tree (more than 7 � 1081; Felsen-stein, 2004). Although networks help visualize the extent to whichgene trees are incongruent (Figs. 4 and 5; McBreen and Lockhart,2006), they do not help distinguish between incomplete lineagesorting and reticulation. As a further example, the numerous retic-ulations suggested by T-Rex (data not shown; Makarenkov andLapointe, 2004) are difficult to interpret because they are inferredon neighbor-joining trees that resolve different nodes than ourBayesian and Parsimony gene trees.
We suggest that the low resolution observed here and in otherspecies-level Ponderosae phylogenies (Gernandt et al., 2005, 2009)is reflective of the recency of species divergence. Despite the widerange of mutation rates among Pinus loci (Willyard et al., 2007),this low resolution is likely to be mirrored across nuclear and chlo-roplast genomes.
510 A. Willyard et al. / Molecular Phylogenetics and Evolution 52 (2009) 498–511
5. Conclusions
The inference of hybrid ancestry in natural species is a challeng-ing but worthwhile endeavor. Comparing phylogenetic hypothesesbased on independent genomic regions is an important method todetect potential reticulations, but requires the exclusion of othercauses of incongruence. In this data set, we did not detect geneticrecombination or a departure from neutrality. However, our roughcalculations suggest that incomplete lineage sorting is a majorsource of the incongruence observed at all but the deepest nodesof the Ponderosae tree. Phylogenetic inferences like the one pre-sented here for reticulate evolution in P. coulteri and among P. jef-freyi, P. ponderosa, and P. washoensis, do not meet the standard ofresynthesizing a hybrid species (Rieseberg et al., 2003). Further,our imposition of a tree-like hierarchy on obviously not-quite-tree-like relationships is perilous. Nevertheless, if these methods areused and interpreted cautiously, valuable clues can be gleanedabout potential examples of reticulate evolution that are worthyof future study. This can be accomplished without the large num-ber of loci that will apparently be required (Maddison and Know-les, 2006) to infer species relationships from multiple gene trees.In particular, a phylogenetic overview like the one created herefrom independent genomic regions is crucial to the identificationof the potential gene-flow ‘players’, which may be taxonomicallydistant as well as geographically remote in their current distribu-tions. It is clear from our results that species-level diagnosis basedon either single-accession sampling or single-locus sampling in Pi-nus is inadequate.
Acknowledgments
We thank Mariah Parker-DeFeniks, Anthony Shireman, CarlaStreng, and Kathleen Farrell for laboratory work. The many collec-tors who generously contributed plant material are gratefullyacknowledged in our GenBank records. We are indebted to DavidGernandt for sharing unpublished information as well as helpfulcomments. We thank Tim Cowman, John R. Haller, Mathew Hor-ning, Susan Huber, Ronald Lanner, Molly Nepokroeff, Bernard Pfeil,Joe Reynoldson, and Conrad Schoch, and two anonymous reviewersfor valuable guidance. Funding was provided by National ScienceFoundation grant DEB 0317108 to Aaron Liston and Richard Cronnand by USDA Forest Service Pacific Northwest Research Station.
Appendix A. Supplementary data
Supplementary data associated with this article can be found, inthe online version, at doi:10.1016/j.ympev.2009.02.011.
References
Akaike, H., 1974. A new look at the statistical model identification. IEEE Trans.Automatic Control 19, 716–723.
Alvin, K.L., 1960. Further conifers of the Pinaceae from the Wealden Formation ofBelgium. Institut Royal des Sciences Naturelles de Belgique. Mémoires 146, 1–39.
Anderson, E., Stebbins Jr., G.L., 1954. Hybridization as an evolutionary stimulus.Evolution 8, 378–388.
Ané, C., Larget, B., Baum, D.A., Smith, S.D., Rokas, A., 2007. Bayesian estimation ofconcordance among gene trees. Mol. Biol. Evol. 24, 412–426.
Arnold, M.L., 1993. Iris nelsonii (Iridaceae): origin and genetic composition of ahomoploid hybrid species. Am. J. Bot. 80, 577–583.
Arnold, M.L., 1997. Natural Hybridization and Species Concepts. Oxford Univ. Press,New York, NY.
Bandelt, H.-J., Forster, P., Röhl, A., 1999. Median-joining networks for inferringintraspecific phylogenies. Mol. Biol. Evol. 16, 37–48.
Baum, D.A., 2007. Concordance trees, concordance factors, and the exploration ofreticulate genealogy. Taxon 56, 417–426.
Birky Jr., C.W., Maruyama, T., Fuerst, P., 1983. An approach to population andevolutionary genetic theory for genes in mitochondria and chloroplasts, andsome results. Genetics 103, 513–527.
Borchert, M., 1985. Serotiny and cone-habit variation in populations of Pinus coulteri(Pinaceae) in the southern Coast Ranges of California. Madroño 32, 29–48.
Brayshaw, T.C., 1997. Washoe and ponderosa pines on Promontory Hill near Merritt,B.C., Canada. Ann. Naturhist. Mus. Wien 99B, 673–680.
Bruen, T.C., Philippe, H., Bryant, D., 2006. A simple and robust statistical test fordetecting the presence of recombination. Genetics 172, 2665–2681.
Bucci, G., Anzidei, M., Madaghiele, A., Vendramin, G.G., 1998. Detection ofhaplotypic variation and natural hybridization in halepensis-complex pinespecies using chloroplast simple sequence repeat (SSR) markers. Mol. Ecol. 7,1633–1643.
Carstens, B.C., Knowles, L., 2007. Estimating species phylogeny from gene-treeprobabilities despite incomplete lineage sorting: an example from Melanoplusgrasshoppers. Syst. Biol. 56, 400–411.
Christensen, K.I., Dar, G.H., 1997. A morphometric analysis of spontaneous andartificial hybrids of Pinus mugo �sylvestris (Pinaceae). Nordic J. Bot. 17, 77–86.
Critchfield, W.B., 1966. Crossability and relationships of the California big-conepines. USDA Forest Service Research Paper NC-6, pp. 36–44.
Critchfield, W.B., 1986. Hybridization and classification of the white pines (Pinussection Strobus). Taxon 35, 647–656.
Cronn, R., Wendel, J.F., 2004. Cryptic trysts, genomic mergers, and plant speciation.New Phytol. 161, 133–142.
Delgado, P., Salas-Lizana, R., Vásquez-Lobo, A., Wegier, A., Anzidei, M., Alvarez-Buylla, E.R., Vendramin, G.G., Piñero, D., 2007. Introgressive hybridization inPinus montezumae Lamb and Pinus pseudostrobus Lindl. (Pineaceae):morphological and molecular (cpSSR) evidence. Int. J. Plant Sci. 168, 861–875.
Dong, J., Wagner, D.B., 1993. Taxonomic and population differentiation ofmitochondrial diversity in Pinus banksiana and Pinus contorta. Theor. Appl.Genet. 86, 573–578.
Doolittle, W.F., Bapteste, E., 2007. Pattern pluralism and the Tree of Life hypothesis.Proc. Natl. Acad. Sci. USA 104, 2043–2049.
Doyle, J.J., Doyle, J.L., Rauscher, J.T., Brown, A.H.D., 2004. Diploid and polyploidreticulate evolution throughout the history of the perennial soybeans (Glycinesubgenus Glycine). New Phytol. 161, 121–132.
Dvorak, W.S., Hamrick, J.L., Furman, B.J., Hodge, G.R., Jordan, A.P., 2000.Conservation efforts for Pinus maximinoi in Mesoamerica and its potential as ahybrid with Pinus taeda in South America. In: CAMCORE (Ed.), Conservation andtesting of tropical and subtropical forest tree species. North Carolina State Univ.,Raleigh, NC, p. 16.
Eckert, A.J., Hall, B.D., 2006. Phylogeny, historical biogeography, and patterns ofdiversification for Pinus (Pinaceae): phylogenetic tests of fossil-basedhypotheses. Mol. Phylogenet. Evol. 40, 166–182.
Ellstrand, N.C., Schierenbeck, K.A., 2000. Hybridization as a stimulus for theevolution of invasiveness in plants? Proc. Natl. Acad. Sci. USA 97, 7043–7050.
Epperson, B., Chung, M., Telewski, F., 2003. Spatial pattern of allozyme variation in acontact zone of Pinus ponderosa and P. arizonica (Pinaceae). Am. J. Bot. 90, 25–31.
Epperson, B., Telewski, F., Willyard, A., 2009. Chloroplast diversity in a putativehybrid swarm of Ponderosae. Am. J. Bot. 96.
Farjon, A., Styles, B., 1997. Flora Neotropica, Monograph 75, Pinus (Pinaceae). TheNew York Botanical Garden, New York, NY, USA.
Fay, J.C., Wu, C.-I., 2000. Hitchhiking under positive Darwinian selection. Genetics155, 1405–1413.
Felsenstein, J., 2004. Inferring Phylogenies. Sinauer Assoc. Inc., Sunderland, MA.Fu, Y.-X., Li, W.-H., 1993. Statistical tests of neutrality of mutations. Genetics 133,
693–709.Gernandt, D.S., Hernández-León, S., Salgado-Hernández, E., Pérez de la Rosa, J.A.,
2009. Phylogenetic relationships of Pinus subsection Ponderosae inferred fromrapidly evolving cpDNA regions. Sys. Bot. 34.
Gernandt, D.S., Gaeda López, G., García, S.O., Liston, A., 2005. Phylogeny andclassification of Pinus. Taxon 54, 29–42.
Godbout, J., Jaramillo-Correa, J.P., Beaulieu, J., Bousquet, J., 2005. A mitochondrialDNA mnisatellite reveals the postglacial history of jack pine (Pinus banksiana), abroad-range North American conifer. Mol. Ecol. 14, 3497–3512.
Grant, V., 1981. Plant Speciation, second ed. Columbia Univ. Press, New York, NY.Haller, J.R., 1962. Variation and hybridization in ponderosa and Jeffrey pines. Univ.
Calif. Publ. Bot. 34, 123–165.Haller, J.R., 1965. Pinus washoensis in Oregon: taxonomic and evolutionary
implications. Am. J. Bot. 52, 646.Holmgren, P.K., Holmgren, N.H., 1998 [continuously updated]. Index Herbariorum:
a global directory of public herbaria and associated staff. New York BotanicalGarden’s Virtual Herbarium. Available from: <http://sweetgum.nybg.org/ih/>.
Hosono, S., Faruqi, A.F., Dean, F.B., Du, Y., Sun, Z., Wu, X., Du, J., Kingsmore, S.F.,Egholm, M., Lasken, R.S., 2003. Unbiased whole-genome amplification directlyfrom clinical samples. Genome Res. 13, 954–964.
Huson, D.H., Bryant, D., 2006. Application of phylogenetic networks in evolutionarystudies. Mol. Biol. Evol. 23, 254–267.
Kral, R., 1993. Pinus. In: Flora of North America Editorial Committee (Ed.), Flora ofNorth America, vol. 2. Oxford Univ. Press, New York, NY, pp. 373–398.
Krupkin, A.B., Liston, A., Strauss, S.H., 1996. Phylogenetic analysis of the hard pines(Pinus subgenus Pinus, Pinaceae) from chloroplast DNA restriction site analysis.Am. J. Bot. 83, 489–498.
Krutovsky, K.V., Troggio, M., Brown, G.R., Jermstad, K.D., Neale, D.B., 2004.Comparative mapping in the Pinaceae. Genetics 168, 447–461.
Lanner, R.M., Phillips, A.M., 1992. Natural hybridization and introgression of pinyonpines in northwestern Arizona. Int. J. Plant Sci. 153, 250–257.

A. Willyard et al. / Molecular Phylogenetics and Evolution 52 (2009) 498–511 511
Lauria, F., 1997. The taxonomic status of Pinus washoensis H. Mason & Stockw.(Pinaceae). Ann. Naturhist. Mus. Wien 99B, 655–671.
Ledig, F.T., 1998. Genetic variation in Pinus. In: Richardson, D.M. (Ed.), Ecology andBiogeography of Pinus. Cambridge Univ. Press, Cambridge, UK, pp. 251–280.
Ledig, F.T., 2000. Founder effects and the genetic structure of Coulter pine. J. Hered.91, 307–315.
Libby, W.J., 1958. The backcross hybrid Jeffrey � (Jeffrey � Coulter) pine. J. For. 56,840–842.
Liston, A., Parker-Defeniks, M., Syring, J.V., Willyard, A., Cronn, R., 2007. Interspecificphylogenetic analysis enhances intraspecific phylogeographic inference. A casestudy in Pinus lambertiana. Mol. Ecol. 16, 3926–3937.
Liston, A., Robinson, W.A., Piñero, D., Alvarez-Buylla, E.R., 1999. Phylogenetics ofPinus (Pinaceae) based on nuclear ribosomal DNA internal transcribed spacerregion sequences. Mol. Phylogenet. Evol. 11, 95–109.
Little, E.L., Critchfield, W.B., 1969. Subdivisions of the genus Pinus (Pines). USDAForest Service Misc. Pub. 1144.
Loudon, J., 1838. Arboretum et fruticetum britannicum. James Ridgeway and Sons,London.
Ma, X.-F., Szmidt, A.E., Wang, X.-R., 2006. Genetic structure and evolutionary historyof a diploid hybrid pine Pinus densata inferred from the nucleotide variation atseven gene loci. Mol. Biol. Evol. 23, 807–816.
Maddison, W.P., Maddison, D., 2006. Mesquite: a modular system for evolutionaryanalysis, vers. 1.12. Available from: <http://mesquiteproject.org>.
Maddison, W.P., Knowles, L.L., 2006. Inferring phylogeny despite incomplete lineagesorting. Syst. Biol. 55, 21–30.
Makarenkov, V., Lapointe, F.-J., 2004. A weighted least-squares approach forinferring phylogenies from incomplete distance matrices. Bioinformatics 20,2113–2121.
Martin, D.P., Williamson, C., Posada, D., 2005. RDP2: recombination detection andanalysis from sequence alignments. Bioinformatics 21, 260–262.
Martínez, M., 1948. Los Pinos Mexicanos, Segunda Edicion. Ediciones Botas, MexicoCity, Mexico.
Mason, H.L., Stockwell, W.P., 1945. A new pine from Mount Rose, Nevada. Madroño8, 61–63.
Matos, J.A., 1995. Pinus hartwegii and P. rudis: a critical assessment. Syst. Bot. 20, 6–21.Matos, J.A., Schaal, B.A., 2000. Chloroplast evolution in the Pinus montezumae
complex: a coalescent approach to hybridization. Evolution 54, 1218–1233.McBreen, K., Lockhart, P.J., 2006. Reconstructing reticulate evolutionary histories of
plants. Trends Ecol. Evol. 11, 398–404.McDade, L., 1990. Hybrids and phylogenetic systematics I. Patterns of character
expression in hybrids and their implications for cladistic analysis. Evolution 44,1685–1700.
McDade, L., 1992. Hybrids and phylogenetic systematics II. The impact of hybrids oncladistic analysis. Evolution 46, 1329–1346.
Mirov, N.T., 1961. Composition of gum turpentines of pines. USA For. Service Tech.Bull. 1239.
Müller, K., 2005. SeqState—primer design and sequence statistics for phylogeneticDNA data sets. Appl. Bioinform. 4, 65–69.
Namkoong, G., 1966. Statistical analysis of introgression. Biometrics 22, 488–502.Niebling, C.R., Conkle, M.T., 1990. Diversity of Washoe pine and comparisons with
allozymes of ponderosa pine races. Can. J. For. Res. 20, 298–308.Nylander, J.A.A., Ronquist, F., Huelsenbeck, J.P., Nieves-Aldrey, J.L., 2004. Bayesian
phylogenetic analysis of combined data. Syst. Biol. 53, 47–67.Patten, A., Brunsfeld, S., 2002. Evidence of a novel lineage within the Ponderosae.
Madroño 49, 189–192.Penny, D., Hendy, M.D., 1985. The use of tree comparison metrics. Syst. Zool. 34, 75–
82.Perry Jr., J.P., 1991. The Pines of Mexico and Central America. Timber Press, Portland,
OR, USA.Petit, R.J., Bialozyt, R., Garnier-Gére, P., Hampe, A., 2004. Ecology and genetics of tree
invasions: from recent introductions to Quaternary migrations. For. Ecol.Manag. 197, 117–137.
Petit, R.J., Bodénès, C., Ducousso, A., Roussel, G., Kremer, A., 2003. Hybridization as amechanism of invasion in oaks. New Phytol. 161, 151–164.
Pollard, D.A., Iyer, V.N., Moses, A.M., Eisen, M.B., 2006. Widespread discordance ofgene trees with species tree in Drosophila: evidence for incomplete lineagesorting. PLoS Gen. 2, 1634–1646.
Posada, D., 2002. Evaluation of methods for detecting recombination from DNAsequences: empirical data. Mol. Biol. Evol. 19, 708–717.
Posada, D., Crandall, K.A., 2001. Intraspecific gene genealogies: trees grafting intonetworks. Trends Ecol. Evol. 16, 37–45.
Prager, E.M., Fowler, D.P., Wilson, A.C., 1976. Rates of evolution in conifers(Pinaceae). Evolution 30, 637–649.
Price, R.A., Liston, A., Strauss, S.H., 1998. Phylogeny and Systematics of Pinus. In:Richardson, D.M. (Ed.), Ecology and Biogeography of Pinus. Cambridge Univ.Press, Cambridge, UK, pp. 49–68.
Rehfeldt, G.E., 1999a. Systematics and genetic structure of Ponderosae taxa(Pinaceae) inhabiting the mountain islands of the Southwest. Am. J. Bot. 86,741–752.
Rehfeldt, G.E., 1999b. Systematics and genetic structure of Washoe pine:applications in conservation genetics. Silvae Genet. 48, 167–173.
Rice, W.R., 1989. Analyzing tables of statistical tests. Evolution 43, 223–225.Rieseberg, L.H., Raymond, O., Rosenthal, D.M., Lai, Z., Livingstone, K., Nakazato, T.,
Durphy, J.L., Schwarzbach, A.E., Donovan, L.A., Lexer, C., 2003. Major ecologicaltransitions in wild sunflowers facilitated by hybridization. Science 301, 1211–1216.
Ronquist, F., Huelsenbeck, J.P., 2003. MrBayes 3: Bayesian phylogenetic inferenceunder mixed models. Bioinformatics 19, 1572–1574.
Rosenberg, N.A., 2003. The shapes of neutral gene genealogies in two species:probabilities of monophyly, paraphyly, and polyphyly in a coalescent model.Evolution 57, 1465–1477.
Rosenberg, N.A., 2007. Statistical tests for taxonomic distinctiveness fromobservations of monophyly. Evolution 61, 317–323.
Rozas, J., Sánchez-DelBarrio, J.C., Messeguer, X., Rozas, R., 2003. DnaSP, DNApolymorphism analyses by the coalescent and other methods. Bioinformatics19, 2496–2497.
Seehausen, O., 2004. Hybridization and adaptive radiation. Trends Ecol. Evol. 19,198–207.
Shaw, J., Lickey, E.B., Beck, J.T., Farmer, S.B., Liu, W., Miller, J., Siripun, K.C., Winder,C.T., Schilling, E.E., Small, R.L., 2005. The tortoise and the hare II: relative utilityof 21 noncoding chloroplast DNA sequences for phylogenetic analysis. Am. J.Bot. 92, 142–166.
Simmons, M.P., Ochoterena, H., 2000. Gaps as characters in sequence-basedphylogenetic analyses. Syst. Biol. 49, 369–381.
Sorensen, F.C., Mandel, N.L., Aagaard, J.E., 2001. Role of selection versus historicalisolation in racial differentiation of ponderosa pine in southern Oregon: aninvestigation of alternative hypotheses. Can. J. For. Res. 31, 1127–1139.
Stebbins, G.L., 1950. Variation and Evolution in Plants. Columbia Univ. Press, NewYork, NY.
Stebbins, G.L., 1959. The role of hybridization in evolution. Proc. Am. Phil. Soc. 103,231–251.
Swofford, D., 2002. PAUP*: phylogenetic analysis using parsimony (* and othermethods), vers. 4.0 b10. Sinauer Assoc. Inc., Sunderland, MA, USA.
Syring, J., Farrell, K., Businsky, R., Cronn, R., Liston, A., 2007. Widespreadgenealogical nonmonophyly in species of Pinus subgenus Strobus. Syst. Biol.56, 163–181.
Syring, J., Willyard, A., Cronn, R., Liston, A., 2005. Evolutionary relationships amongpine (Pinaceae) subsections inferred from multiple low-copy nuclear loci. Am. J.Bot. 92, 2086–2100.
Tajima, F., 1989. Statistical method for testing the neutral mutation hypothesis byDNA polymorphism. Genetics 123, 585–595.
Temesgen, B., Brown, G.R., Harry, D.E., Kinlaw, C.S., Sewell, M.M., Neale, D.B., 2001.Genetic mapping of expressed sequence tag polymorphism (ESTP) markers inloblolly pine (Pinus taeda). Theor. Appl. Genet. 102, 664–675.
Watterson, G.A., 1975. On the number of segregating sites in genetical modelswithout recombination. Theor. Pop. Biol. 7, 256–276.
Willyard, A., Syring, J., Gernandt, D.S., Liston, A., Cronn, R., 2007. Fossil calibration ofmolecular divergence infers a moderate mutation rate and recent radiations forPinus. Mol. Biol. Evol. 24, 90–101.
Wolff, R.L., Pédrono, F., Pasquier, E., Marpeau, A.M., 2000. General characteristics ofPinus spp. seed fatty acid compositions, and importance of D5-olefinic acids inthe taxonomy and phylogeny of the genus. Lipids 35, 1–22.
Zobel, B., 1951. The natural hybrid between Coulter and Jeffrey pines. Evolution 5,405–413.

![[MP] 02 - Phylogenetics - biologia.campusnet.unito.it · Molecular Phylogenetics Basis of Molecular Phylogenies Overview ¾Phylogenetics Definitions ¾Genetic Variation and Evolution](https://static.fdocuments.us/doc/165x107/5c6216d809d3f238158b4601/mp-02-phylogenetics-molecular-phylogenetics-basis-of-molecular-phylogenies.jpg)