Molecular Outflows in Local ULIRGs: Energetics from … · trace the outflowing gas out...
41
Molecular Outflows in Local ULIRGs: Energetics from Multitransition OH Analysis E. González-Alfonso 1,2 , J. Fischer 3 , H. W. W. Spoon 4 , K. P. Stewart 3 , M. L. N. Ashby 2 , S. Veilleux 5 , H. A. Smith 2 , E. Sturm 6 , D. Farrah 7 , N. Falstad 8 , M. Meléndez 5,9,10 , J. Graciá-Carpio 6 , A. W. Janssen 6 , and V. Lebouteiller 11 1 Universidad de Alcalá, Departamento de Física y Matemáticas, Campus Universitario, E-28871 Alcalá de Henares, Madrid, Spain 2 Harvard-Smithsonian Center for Astrophysics, 60 Garden Street, Cambridge, MA 02138, USA 3 Naval Research Laboratory, Remote Sensing Division, 4555 Overlook Avenue SW, Washington, DC 20375, USA 4 Cornell University, Cornell Center for Astrophysics and Planetary Science, Ithaca, NY 14853, USA 5 Department of Astronomy and Joint Space-Science Institute, University of Maryland, College Park, MD 20742, USA 6 Max-Planck-Institute for Extraterrestrial Physics (MPE), Giessenbachstraße 1, D-85748 Garching, Germany 7 Department of Physics, Virginia Tech, Blacksburg, VA 24061, USA 8 Department of Earth and Space Sciences, Chalmers University of Technology, Onsala Space Observatory, Onsala, Sweden 9 NASA Goddard Space Flight Center, Greenbelt, MD 20771, USA 10 KBRwyle Science, Technology and Engineering Group, 1290 Hercules Avenue, Houston, TX 77058, USA 11 Laboratoire AIM—CEA/Saclay, Orme des Merisiers, F-91191 Gif-sur-Yvette, France Received 2016 September 5; revised 2016 December 7; accepted 2016 December 18; published 2017 February 3 Abstract We report on the energetics of molecular outflows in 14 local ultraluminous infrared galaxies (ULIRGs) that show unambiguous outflow signatures (P Cygni profiles or high-velocity absorption wings) in the far-infrared lines of OH measured with the Herschel/PACS spectrometer. All sample galaxies are gas-rich mergers at various stages of the merging process. Detection of both ground-state (at 119 and 79 μm) and one or more radiatively excited (at 65 and 84 μm) lines allows us to model the nuclear gas (300 pc) and the more extended components using spherically symmetric radiative transfer models. Reliable models and the corresponding energetics are found in 12 of the 14 sources. The highest molecular outflow velocities are found in buried sources, in which slower but massive expansion of the nuclear gas is also observed. With the exception of a few outliers, the outflows have momentum fluxes of (2–5)×L IR /c and mechanical luminosities of (0.1–0.3)% of L IR . The moderate momentum boosts in these sources (3) suggest that the outflows are mostly momentum driven by the combined effects of active galactic nuclei (AGNs) and nuclear starbursts, as a result of radiation pressure, winds, and supernova remnants. In some sources (∼20%), however, powerful (10 10.5–11 L e ) AGN feedback and (partially) energy- conserving phases are required, with momentum boosts in the range of 3–20. These outflows appear to be stochastic, strong AGN feedback events that occur throughout the merging process. In a few sources, the outflow activity in the innermost regions has subsided in the past ∼1 Myr. While OH traces the molecular outflows at subkiloparsec scales, comparison of the masses traced by OH with those previously inferred from tracers of more extended outflowing gas suggests that most mass is loaded (with loading factors of ˙ – = M SFR 1 10) from the central galactic cores (a few×100 pc), qualitatively consistent with an ongoing inside-out quenching of star formation. Outflow depletion timescales are <10 8 yr, shorter than the gas consumption timescales by factors of 1.1–15, and are anticorrelated with the AGN luminosity. Key words: galaxies: ISM – infrared: galaxies – ISM: jets and outflows – line: formation – line: profiles – radiative transfer 1. Introduction The correlations found between the masses of supermassive black holes (SMBHs) and the velocity dispersions, masses, luminosities, light concentrations, and Sérsic indices of the spheroidal components of their host galaxies (e.g., Magorrian et al. 1998; Ferrarese & Merritt 2000; Gebhardt et al. 2000; Graham et al. 2001; Tremaine et al. 2002; Marconi & Hunt 2003; Ferrarese & Ford 2005; Graham & Driver 2007; Beifiori et al. 2012; Shankar et al. 2016) suggest a fundamental link between SMBH growth and stellar mass assembly. In addition, the color distribution of local galaxies (e.g., Strateva et al. 2001; Baldry et al. 2004; Schawinski et al. 2014), with the blue galaxies actively forming stars and red-and-dead early- type galaxies evolving passively, suggests that the color of red early-type galaxies must have evolved rapidly, with star formation terminated on short timescales (e.g., Hopkins et al. 2006b; Schawinski et al. 2014). Spatially resolved observations of z∼2.2 massive galaxies show an inside-out quenching of star formation, on timescales of <1 Gyr in the inner regions (Tacchella et al. 2015). An appealing way to explain these observations is via a self-regulated feedback model involving the morphological transformation of late-type to early-type galaxies through mergers, which first funnel large amounts of gas into the circumnuclear regions 12 of the system, leading to both a circumnuclear starburst and the growth of an SMBH. Above an SMBH critical mass, the energy or momentum released by the SMBH limits efficiently the accretion onto the SMBH and quenches the starbursts through the expulsion of the interstellar gas from which stars are formed (negative feedback), ultimately yielding the SMBH–σ relationship (Silk & Rees 1998; Fabian 1999, 2012; King 2003, 2005; di Matteo et al. 2005; Murray et al. 2005; Springel et al. 2005; Hopkins et al. 2006a; King & Pounds 2015). Violent relaxation of the stellar component deeply changes the morphology from premerger disk galaxies to a coalescence system with a The Astrophysical Journal, 836:11 (41pp), 2017 February 10 doi:10.3847/1538-4357/836/1/11 © 2017. The American Astronomical Society. All rights reserved. 12 We use the terms “nuclear region” and “nuclear starburst” for spatial scales 300 pc, to differentiate from the term “circumnuclear” that is more generally used for scales 1–2 kpc. 1
Transcript of Molecular Outflows in Local ULIRGs: Energetics from … · trace the outflowing gas out...

Molecular Outflows in Local ULIRGs: Energetics from Multitransition OH Analysis
E. González-Alfonso1,2, J. Fischer3, H. W. W. Spoon4, K. P. Stewart3, M. L. N. Ashby2, S. Veilleux5, H. A. Smith2, E. Sturm6,D. Farrah7, N. Falstad8, M. Meléndez5,9,10, J. Graciá-Carpio6, A. W. Janssen6, and V. Lebouteiller11
1 Universidad de Alcalá, Departamento de Física y Matemáticas, Campus Universitario, E-28871 Alcalá de Henares, Madrid, Spain2 Harvard-Smithsonian Center for Astrophysics, 60 Garden Street, Cambridge, MA 02138, USA
3 Naval Research Laboratory, Remote Sensing Division, 4555 Overlook Avenue SW, Washington, DC 20375, USA4 Cornell University, Cornell Center for Astrophysics and Planetary Science, Ithaca, NY 14853, USA
5 Department of Astronomy and Joint Space-Science Institute, University of Maryland, College Park, MD 20742, USA6Max-Planck-Institute for Extraterrestrial Physics (MPE), Giessenbachstraße 1, D-85748 Garching, Germany
7 Department of Physics, Virginia Tech, Blacksburg, VA 24061, USA8 Department of Earth and Space Sciences, Chalmers University of Technology, Onsala Space Observatory, Onsala, Sweden
9 NASA Goddard Space Flight Center, Greenbelt, MD 20771, USA10 KBRwyle Science, Technology and Engineering Group, 1290 Hercules Avenue, Houston, TX 77058, USA
11 Laboratoire AIM—CEA/Saclay, Orme des Merisiers, F-91191 Gif-sur-Yvette, FranceReceived 2016 September 5; revised 2016 December 7; accepted 2016 December 18; published 2017 February 3
Abstract
We report on the energetics of molecular outflows in 14 local ultraluminous infrared galaxies (ULIRGs) that showunambiguous outflow signatures (P Cygni profiles or high-velocity absorption wings) in the far-infrared lines ofOH measured with the Herschel/PACS spectrometer. All sample galaxies are gas-rich mergers at various stages ofthe merging process. Detection of both ground-state (at 119 and 79 μm) and one or more radiatively excited (at 65and 84 μm) lines allows us to model the nuclear gas (300 pc) and the more extended components usingspherically symmetric radiative transfer models. Reliable models and the corresponding energetics are found in 12of the 14 sources. The highest molecular outflow velocities are found in buried sources, in which slower butmassive expansion of the nuclear gas is also observed. With the exception of a few outliers, the outflows havemomentum fluxes of (2–5)×LIR/c and mechanical luminosities of (0.1–0.3)% of LIR. The moderate momentumboosts in these sources (3) suggest that the outflows are mostly momentum driven by the combined effects ofactive galactic nuclei (AGNs) and nuclear starbursts, as a result of radiation pressure, winds, and supernovaremnants. In some sources (∼20%), however, powerful (1010.5–11 Le) AGN feedback and (partially) energy-conserving phases are required, with momentum boosts in the range of 3–20. These outflows appear to bestochastic, strong AGN feedback events that occur throughout the merging process. In a few sources, the outflowactivity in the innermost regions has subsided in the past ∼1Myr. While OH traces the molecular outflows atsubkiloparsec scales, comparison of the masses traced by OH with those previously inferred from tracers of moreextended outflowing gas suggests that most mass is loaded (with loading factors of ˙ –=M SFR 1 10) from thecentral galactic cores (a few×100 pc), qualitatively consistent with an ongoing inside-out quenching of starformation. Outflow depletion timescales are <108 yr, shorter than the gas consumption timescales by factors of1.1–15, and are anticorrelated with the AGN luminosity.
Key words: galaxies: ISM – infrared: galaxies – ISM: jets and outflows – line: formation – line: profiles – radiativetransfer
1. Introduction
The correlations found between the masses of supermassiveblack holes (SMBHs) and the velocity dispersions, masses,luminosities, light concentrations, and Sérsic indices of thespheroidal components of their host galaxies (e.g., Magorrianet al. 1998; Ferrarese & Merritt 2000; Gebhardt et al. 2000;Graham et al. 2001; Tremaine et al. 2002; Marconi &Hunt 2003; Ferrarese & Ford 2005; Graham & Driver 2007;Beifiori et al. 2012; Shankar et al. 2016) suggest a fundamentallink between SMBH growth and stellar mass assembly. Inaddition, the color distribution of local galaxies (e.g., Stratevaet al. 2001; Baldry et al. 2004; Schawinski et al. 2014), with theblue galaxies actively forming stars and red-and-dead early-type galaxies evolving passively, suggests that the color of redearly-type galaxies must have evolved rapidly, with starformation terminated on short timescales (e.g., Hopkins et al.2006b; Schawinski et al. 2014). Spatially resolved observationsof z∼2.2 massive galaxies show an inside-out quenching ofstar formation, on timescales of <1 Gyr in the inner regions
(Tacchella et al. 2015). An appealing way to explain theseobservations is via a self-regulated feedback model involvingthe morphological transformation of late-type to early-typegalaxies through mergers, which first funnel large amounts ofgas into the circumnuclear regions12 of the system, leading toboth a circumnuclear starburst and the growth of an SMBH.Above an SMBH critical mass, the energy or momentumreleased by the SMBH limits efficiently the accretion onto theSMBH and quenches the starbursts through the expulsion ofthe interstellar gas from which stars are formed (negativefeedback), ultimately yielding the SMBH–σ relationship (Silk& Rees 1998; Fabian 1999, 2012; King 2003, 2005; di Matteoet al. 2005; Murray et al. 2005; Springel et al. 2005; Hopkinset al. 2006a; King & Pounds 2015). Violent relaxation of thestellar component deeply changes the morphology frompremerger disk galaxies to a coalescence system with a
The Astrophysical Journal, 836:11 (41pp), 2017 February 10 doi:10.3847/1538-4357/836/1/11© 2017. The American Astronomical Society. All rights reserved.
12 We use the terms “nuclear region” and “nuclear starburst” for spatial scales300 pc, to differentiate from the term “circumnuclear” that is more generallyused for scales 1–2 kpc.
1

spheroidal component, which dominates over the reformed diskin the case of major mergers with limited gas fraction (e.g.,Hopkins et al. 2009). Observational evidence for the quenchingof star formation by active galactic nucleus (AGN) feedbackhas been reported recently (e.g., Farrah et al. 2012; Alataloet al. 2015). There are alternative explanations of the MBH–
Mbulge correlation, e.g., gas accretion onto the black hole (BH)from a viscous inner disk with limited replenishment by starformation in an outer disk (Burkert & Silk 2001), gravitationalcollapse of the inner regions of an isothermal bulge (Adamset al. 2001), and hierarchical assembly of BH and stellar massthrough cycles of galaxy merging (Peng 2007; Jahnke &Macciò 2011). Other ways to account for the bimodality ofgalaxy colors and the quenching of star formation includesuppression of cold inflows of gas (Dekel & Birnboim 2006)and gravitational heating of the intracluster medium in mergers(Khochfar & Ostriker 2008). While these environmentmechanisms of quenching, as well as “strangulation” on longtimescales (Peng et al. 2015), may dominate the secularevolution of late-type galaxies, a much more rapid morpholo-gical and quenching (tquench250Myr) evolution is favoredfor producing early-type galaxies (Schawinski et al. 2014).
While feedback processes such as superwinds in ultralumi-nous infrared galaxies (ULIRGs) and starbursts have beenobserved for decades in lines of ionized and neutral atomic gas(e.g., Heckman et al. 1990; Rupke et al. 2002, 2005a, 2005b,2005c; Lípari et al. 2005, 2009; Veilleux et al. 2005; Spoon &Holt 2009), outflows observed in lines that trace the molecularmedium are also key to understanding and quantifying thisprocess, because the molecular phase may carry a significant oreven dominant fraction of the momentum and mass outflowrates in buried stages. Far-IR spectroscopy with Herschel SpaceObservatory Photoconductor Array Camera and Spectrometer(PACS) (Pilbratt et al. 2010; Poglitsch et al. 2010) has indeedrevealed powerful molecular outflows in ULIRGs traced byOH, with velocities exceeding 1000 km s−1 in some sourcesand mass outflow rates of several hundred solar masses per year(Fischer et al. 2010; Sturm et al. 2011; Spoon et al. 2013;Veilleux et al. 2013; González-Alfonso et al. 2014b,hereafter GA14). The high-velocity outflows discovered withHerschel were found to be ubiquitous and thus inferred to bewide angle in local ULIRGs (Veilleux et al. 2013; Stoneet al. 2016). These investigations also revealed a correlationbetween the outflow velocity and the AGN luminosity. In thefar-IR, the outflows are also traced by the line wing emission ofthe [C II] 158 μm transition (Janssen et al. 2016). High-velocitymolecular outflows are detected at (sub)millimeter wavelengthsin lines of CO, HCN, and HCO+ (e.g., Feruglio et al. 2010,2015; Aalto et al. 2012, 2015; Cicone et al. 2012, 2014;García-Burillo et al. 2015; Lindberg et al. 2016). Lower-velocity molecular outflows are also detected in millimeterlines of the above species and in CS (Sakamoto et al. 2009;Bolatto et al. 2013; Alatalo et al. 2015; Tunnard et al. 2015;Martín et al. 2016). The (sub)millimeter lines are now routinelyobserved with high angular resolution and in some sourcestrace the outflowing gas out to kiloparsec scales.
Far-IR molecular observations can provide key and uniqueinsights into the outflow phenomenon: (i) the strength andoptical depth of the far-IR continuum generate P Cygni lineprofiles in some lines, unambiguously indicating the presenceof outflowing gas, discarding other alternatives such as highturbulence or noncircular rotation motions (e.g., Guillard
et al. 2015; Díaz-Santos et al. 2016); (ii) blueshifted absorptioncan be traced to low velocities, probing low-velocity outflowsthat may be missed from pure emission lines, due to confusionwith the line core; (iii) despite the relatively poor spatialresolution of far-IR telescopes, multitransition observationsincluding high-lying transitions provide a robust means toquantify the main outflow parameters (mass outflow rate,momentum flux, etc.).OH in particular is an excellent tracer of these molecular
outflows (Fischer et al. 2010; Sturm et al. 2011; Spoon et al.2013; Veilleux et al. 2013, GA14), with high abundances inactive regions, including photodissociated regions (PDRs),cosmic-ray-dominated regions (CRDRs), and X-ray-dominatedregions (XDRs) (e.g., Goicoechea & Cernicharo 2002; Goi-coechea et al. 2011; Meijerink et al. 2011; González-Alfonsoet al. 2012, 2013). Owing to the spin–orbit interaction, itsrotational level structure is characterized by two ladders (2Π3/
2 and2Π1/2), with the cross-ladder transitions much more
optically thin than intra-ladder ones, thus enabling theestimation of column densities. With high Einstein A-coefficients, the high-lying transitions along the 2Π3/2 ladder,observed in absorption in galaxies, require strong far-IRradiation densities to be excited. Specifically, the high-lyingOH doublet at 65 μm is an excellent tracer of the short-livedbut most active and buried phase of (U)LIRG evolution(González-Alfonso et al. 2015, hereafter GA15), tracing the gasthat lost its angular momentum during the merger, falling ontothe ∼100 pc nuclear region where it generates a nuclearstarburst (Hopkins et al. 2009). It is just in such an obscuredphase when most BH accretion is expected to occur, asindicated by the cosmic X-ray background (Fabian & Iwasawa1999), and when outflows are expected to be most efficientlyaccelerated (Stern et al. 2016).
2. Guide to the Astrophysical Issues Addressedin This Paper
Here we present the results of our study of molecularoutflows in a sample of local ULIRGs observed in OH withHerschel/PACS. Our multitransition analysis aims (i) to inferand describe the presence of outflowing gas in high-lying OHtransitions, which probe the nuclear regions of ULIRGs that arefirst exposed to the feedback action of an AGN and a nuclearstarburst, and compare and relate the line profiles of these high-lying lines with those of the ground-state lines; (ii) to analyzequantitatively the OH observations to infer the main physicalparameters and energetics of the molecular outflows (out-flowing mass, mass outflow rate, momentum flux, and energyflux), comparing our results with those obtained from othertracers and establishing depletion timescales; and (iii) to giveinsight into the accelerating mechanism of these outflows byassessing the relative roles of an AGN and a nuclear starburst,the relative contribution to the acceleration by radiationpressure on dust grains and winds, and whether the observedoutflows are found in momentum- or energy-conservingphases.The observations, data treatment, and sample selection
criteria are described in Section 3, where we define a modelingsample of 14 ULIRGs observed in at least three far-infrared OHdoublets. While all of them are gas-rich mergers or interactingsystems, they show a high morphological diversity in themerging stage. The sample spans AGN luminosities of(0.3–2)×1012 Le and star-forming rates of 50–350Me yr−1.
2
The Astrophysical Journal, 836:11 (41pp), 2017 February 10 González-Alfonso et al.

In Section 4 we present the observational results of ourmultitransition profile analysis. We identify the presence of gasoutflowing from the nuclear regions (<300 pc) traced byradiatively excited, high-lying OH transitions. We show thatthe highest molecular outflow velocities, traced by the OHdoublet at 119 μm (Spoon et al. 2013; Veilleux et al. 2013), arefound in buried sources that show strong absorption in the OH65 μm transition at systemic velocities. The highly excited lineprofiles also show evidence for slower expansion of the nuclearregions of the ULIRGs that show P Cygni profiles in theground-state OH doublet at 119 μm.
In Section 5 we describe our library of spherically symmetricradiative transfer models, our methods of achieving best-fitsolutions to the line profiles, and our method of estimating theenergetics of the outflows (outflowing mass, mass outflow rate,momentum flux, and energy flux).
The results of our quantitative analysis are presented inSection 6. We compare our results with the maximumestimated momentum and energy rates that the AGN and thestarburst can provide. We find that while nuclear starbursts canprovide a non-negligible contribution to the observed outflows,they are most likely unable to drive them alone. An AGN isrequired in most cases and clearly dominates in some ULIRGs.Outflow depletion timescales are <108 yr, significantly shorterthan the gas consumption timescales, and show an antic-orrelation with LAGN. We also find that the nuclear outflowingactivity has recently subsided in a few sources of the sample.The outflowing masses inferred from OH, which probes theoutflows at subkiloparsec scales, are similar to those obtainedfrom other tracers of more extended outflowing gas.
The inferred outflow energetics are further interpreted interms of simple dynamical models in Section 7. An importantquestion discussed in the literature, and related to the growth ofthe SMBH and to the normalization of the MBH–σ correlation,is whether the outflows are momentum-conserving (e.g., drivenby the ram pressure of winds and radiation pressure on dustgrains) or energy-conserving (e.g., driven by the thermalpressure of a hot bubble that cannot cool on the timescale of itsexpansion). We find that the total momentum deposited into theinterstellar medium (ISM) by the combined effects of the AGNand starburst is enough to explain the outflows in most sources,but significant momentum boosts are apparently required insome (∼20%) ULIRGs. The inferred momentum boosts of themost powerful outflows depend on whether the gravitationalpotential well is assumed to be balanced by rotation and on theassumed geometrical dilution of the outflowing gas, and theyare estimated to be in the range of 3–20. These are, in mostcases, lower than the maximum momentum boosts predicted bytheoretical studies on energy-conserving outflows. Partiallyenergy-conserving phases, which we find associated withcompact outflow components with high columns, appear torepresent short stages with high AGN luminosities and areuncorrelated with the merger stage. Our analysis indicates thatalthough radiation pressure on dust grains may (nearly) supportthe gas in the direction of the rotation axis, it cannot drive theoutflows, and thus winds are required.
Our main conclusions are summarized in Section 8. Wedescribe in more detail the individual sources and model fits inAppendix A. A comparison of the present results with thoseobtained from ionized lines in starburst galaxies (Heckmanet al. 2015) is given in Appendix B. Radiation pressure support
is evaluated in Appendix C, and some discussion of thevelocity fields in the outflows is given in Appendix D.
3. Observations and Data Analysis
3.1. Selection of the ULIRG Outflow Modeling Sample
We based the selection of our outflow modeling sample on allHerschel/PACS OH observations of local ULIRGs for which atleast these three doublets were available: the OH 2Π3/2J=5/2–3/2 doublet at 119 μm (hereafter OH119), the cross-ladder 2Π1/2−2Π3/2 J=1/2–3/2 doublet at 79μm (OH79),and the OH 2Π3/2 J=9/2–7/2 doublet at 65 μm (OH65). Inmost sources, the 2Π3/2 J=7/2–5/2 doublet at 84 μm(OH84) has also been observed. An energy level diagram ofOH showing these transitions can be found in GA14. TheOH119 and OH79 lines are ground-state transitions, withOH119 40×more optically thick than OH79 (Fischeret al. 2010). The OH84 and OH65 transitions have excitedlower levels with energies of ≈120 and ≈300 K above theground state, respectively.Five Herschel observing programs included spectroscopic
velocity-resolved observations of ULIRGs in the aboverotational transitions of OH: the Herschel guaranteed timekey program SHINING (PI: E. Sturm), the open time programHerMoLIRG (PI: E. González-Alfonso), a program thatprovided the full far-infrared spectra of two (U)LIRGs (PI: J.Fischer), the HERUS program (PI: D. Farrah; Farrah et al.2013), and a directors discretionary program focused on thetwo outflow sources of the HERUS sample with the mostprominent OH119 absorption at high velocities (PI: H. Spoon;Spoon et al. 2013). The first three programs observed three ormore OH lines in all 20 ULIRGs in the Revised Bright GalaxySample (RBGS; Sanders et al. 2003). The last two programsobserved the ground-state OH119 and OH79 transitions in anadditional complete set of 24 more distant ULIRGs out toz<0.2 and followed up with profiles of the excited OH84 andOH65 transitions in IRAS03158+4227 and IRAS20100−4156. In all, 22 ULIRGs at z<0.2 were observed in threeor more OH transitions.To define the ULIRG outflow modeling sample discussed in
Sections 5–7, we further constrained the sample describedabove to the ULIRGs in which (i) a P Cygni profile or a high-velocity blue wing in OH119 is detected (Veilleux et al. 2013;Spoon et al. 2013) and (ii) the excited OH84 and/or OH65doublets are detected. Of all ULIRGs reported in the OH65doublet (GA15), the former condition rules out the followingsources: Arp220, IRAS15250+3609, IRASF17207−0014,and IRASF22491−1808, where the OH119 doublet isdominated by foreground absorption at redshifted velocities,and IRAS07251−0248, where no OH119 redshifted emissionfeature is seen and the very strong and flat absorption featuredoes not clearly indicate outflowing gas. Modeling thesesources requires a specific approach with more than the three-component scheme used in Section 5. We also do not modelIRAS12112+0305 and IRAS19542+1110, both showing a PCygni profile in OH119 (Veilleux et al. 2013), because of amispointing in the three observed doublets (OH119, OH79, andOH65), resulting in the placement of the source near the edgeof a spaxel, which causes a skewing of the instrumental profile.This results in a modeling sample of 14 local ULIRGs, whichare listed in Table 1, together with some basic properties of thesources and the observation identification numbers (OBSIDs)
3
The Astrophysical Journal, 836:11 (41pp), 2017 February 10 González-Alfonso et al.

of the OH observations. The excluded sources have similarluminosities to the modeled ones, but some have lower AGNcontributions that may be lower limits due to high far-IRextinction (Arp 220, IRAS 07251−0248, and IRAS F17207−0014; Veilleux et al. 2013).
The modeling sample, individually described in Appendix A,is somewhat biased to the most prominent outflowing sources,but may still be considered a good representation of the diversityof the molecular outflow phenomenon in local ULIRGs. Allsample sources are morphologically classified in the optical asmergers or interacting systems, albeit with a high diversity inevolving stages (Appendix A): from widely separated galaxies(∼50 kpc, IRAS 03158+4227) to double nuclei systems withprojected separation <10 kpc (IRAS 08572+3915, Mrk 273,IRAS 14348−1447, IRAS 20100−4156), multiple collidingsystems (IRAS 10565+2448, IRAS 19297−0406), and advancedmergers showing a single nucleus with tidal tails (IRAS 05189−2524, IRAS 09022−3615, Mrk 231, IRAS 13120−5453,IRAS 14378−3651, IRAS 20551−4250, IRAS 23365+3604).They also have a diversity in the AGN contribution to theluminosity (Table 1), resulting in estimated AGN luminosities inthe range of (0.3–2)×1012 Le (due to high extinction at far-IRwavelengths (GA15), some values of LAGN could be under-estimated). Assuming Eddington luminosities, the impliedSMBH masses are 107–108Me.
3.2. Data Analysis
For the basic analysis developed in Section 4 (Sections 4.3–4.8), we have used the OH observations of these ULIRGstogether with those of luminous infrared galaxies (LIRGs,LIR>1011 Le), as well as the nearby bright infrared galaxy(BIRG) NGC 4945, also detected in excited OH transitions(GA15). In all these sources, we also used additional
observations of the [C II] 158 μm, [O I] 63 μm, and [O I]145 μm lines from the programs listed above (Graciá-Carpioet al. 2011; Farrah et al. 2013).All lines were observed in the highly sampled range mode of
the PACS spectrometer, with the exception of NGC 4945,which was observed in line spectroscopy mode with Nyquistsampling. Most of our analysis was based on pipeline-processed spectra created by the Herschel Science Centre(HSC) using the Herschel Data Processing system; theStandard Product Generation version was HIPE 14.0.1, withcalibration tree version 72. We downloaded the level-2 dataproducts13 as needed from the Herschel Science Archive(HSA). Because both the molecular absorption lines and thecontinua are basically point-like in the sources studied in thiswork, we have used the point-source-calibrated spectra “c129,”which scale the emission from the central ≈9″×9″ spatialpixel to the total emission from the central 3×3 spaxels(“c9”), which is itself scaled according to the point-sourcecorrection. The absolute flux scale is robust to potentialpointing jitter, with continuum flux reproducibility of ±15%.The PACS spectral resolution is 290, 160, 145, and 190 km s−1
at 119, 79, 84, and 65 μm, respectively.In some specific cases, the HSA spectra showed significant
fluctuations in the continuum level close to or within thewavelength range where the line wings could be expected. Wereprocessed those data by applying polynomial fits to the flat-fielding with masking windows around the observed absorptionand emission features, which usually significantly improved thequality of the baselines. Nevertheless, the uncertainty in theequivalent width and flux in the line wings is usuallydominated by the fitted baseline and in some cases may beup to ∼25%.
Table 1Modeling Sample Galaxies and Herschel OBSIDs of the OH Doublets
Galaxy zCII D LIR αAGN OH119 OH79 OH84 OH65Name (Mpc) (1012 Le) OBSID OBSID OBSID OBSID(1) (2) (3) (4) (5) (6) (7) (8) (9)
IRAS F03158+4227 0.13459 658 4.27 0.47 1342238963 1342263478 1342262940 1342263479IRAS F05189−2524 0.04272 186 1.38 0.72 1342219441 1342219442 1342248556 1342219445IRAS F08572+3915 0.05824 261 1.32 0.70 1342208956 1342184687a 1342253600 1342208954IRAS 09022−3615 0.05963 268 1.92 0.55 1342209402 1342209403 L 1342209406IRAS F10565+2448 0.04309 193 1.14 0.47 1342207787 1342207788 1342254243 1342207790Mrk 231 0.04218 186 3.37 0.67 1342186811 1342186811 1342253537 1342207782IRAS 13120−5453 0.03107 136 1.86 0.33 1342214628 1342214629 1342248348 1342214630Mrk 273 0.03780 166 1.45 0.34 1342207801 1342207802 1342257293 1342207803IRAS F14348−1447 0.08257 376 2.09 0.17 1342224243 1342224242 L 1342224244IRAS F14378−3651 0.06812 304 1.46 0.21 1342204337 1342204338 1342250130 1342204339IRAS F19297−0406 0.08558 383 2.46 0.23 1342208890 1342208891 L 1342208893IRAS F20100−4156 0.12971 632 4.68 0.27 1342216371 1342216371 1342267942 1342268108IRAS F20551−4250 0.04295 185 1.02 0.57 1342208933 1342208934 1342253748 1342208936IRAS F23365+3604 0.06449 281 1.43 0.45 1342212514 1342212515 1342257685 1342212517
Note. Columns: (1) Galaxy name. (2) Redshifts inferred from Gaussian fits to the [C II] 158 μm line. (3) Distance to the galaxy; adopting a flat universe with H0=71km s−1 Mpc−1 and ΩM=0.27. (4) IR luminosity (8–1000 μm), estimated using the fluxes in the four IRAS bands (Sanders et al. 2003; Surace et al. 2004). (5)Estimated AGN contribution to the bolometric luminosity, as derived from the f15/f30 ratio (Veilleux et al. 2009; Spoon et al. 2013). This method yields αAGN=0.8in Mrk231, but we have reduced the value in this source to 2/3 because the nuclear starburst has an estimated contribution to the bolometric luminosity of 25%–40%(Davies et al. 2004). Our adopted value, while basically consistent with the f15/f30 diagnostic, enables easy comparison with the works by Cicone et al. (2014) andFeruglio et al. (2015), who adopted just half that value (αAGN≈1/3, based on Nardini et al. 2010). We have adopted =L L1.15bol IR (Veilleux et al. 2009, 2013). TheAGN and starburst luminosities are LAGN=αAGN Lbol and L*=(1−αAGN) Lbol. (5)–(8) OBSIDs of OH119, OH79, OH84, and OH65.a The line was also targeted in instrument verification observations with OBSIDs 1342184688, 1342184689, 1342184690, 1342184691, and 1342184692, and theaveraged spectrum is used.
13 http://herschel.esac.esa.int/Docs/PACS/html/pacs_om.html
4
The Astrophysical Journal, 836:11 (41pp), 2017 February 10 González-Alfonso et al.

The observation of the OH119 doublet in IRAS03158+4227 was mispointed by about half a spaxel (Spoon et al.2013). We have examined spaxels 12 (central) and 13, wherethe OH119 absorption/emission is detected, and found asimilar wing with velocities exceeding ∼1500 km s−1 in bothspaxels, though the actual value is relatively uncertain, due toinsufficient baseline on the blue side of the spectra. Theredshifted emission feature is, however, slightly stronger in thecentral spaxel, so the central spaxel profile is used here forsubsequent analysis.
Baseline fitting was subsequently performed with polyno-mials of order 1–2, and the fits were used to generatecontinuum-normalized spectra and to extract the far-IRcontinuum flux densities. Gaussians were fitted to absorptionand emission features to obtain the peak velocities and linestrengths, as discussed in Section 4.
4. Results
4.1. Description of the OH Spectra
Figure 1 shows the continuum-normalized OH spectra in all14 sources of our modeling sample. The OH119 and someOH79 and higher-excitation OH profiles were previouslypresented by Fischer et al. (2010), Veilleux et al. (2013),Spoon et al. (2013), Sturm et al. (2011), and GA14 based onearlier HIPE pipeline reductions. The velocity scale in Figure 1uses the redshifts obtained from Gaussian fits to the highsignal-to-noise ratio [C II] 158 μm line, which is stronglydominated by the core of the line (Janssen et al. 2016). In allsources, the excited [O I] 145 μm line was also observed withHerschel/PACS, giving velocity shifts relative to the [C II] lineof �40 km s−1, and in most (nine) sources �20 km s−1.
The blue arrows in Figure 1 indicate the location of possiblecontamination by lines of H2O, dozens of which appear in thefar-IR spectra of some (U)LIRGs (e.g., Falstad et al. 2015;González-Alfonso et al. 2012, hereafter GA12). The strongestof these lines is the 423–312 (Elower=250 K) centered at≈−1400 km s−1 in the OH79 spectra. The line is most likelycontaminating the OH79 blueshifted wing in IRAS03158+4227 at velocities −1400 km s−1. It is clearly detected inother sources in which the OH79 wing does not blend with it.Potentially more problematic are instances of possiblecontamination of OH79 spectra by the H2O 615–524 at≈−720 km s−1. However, this line is much higher in energy(Elower≈600 K), and it is a factor of 2–7 weaker than thelower-energy line in the extremely buried sources NGC4418and Arp220, respectively (GA12). It is likely that this linesignificantly contaminates the OH79 spectra of IRAS14348−1447 and IRAS20100−4156. In some cases, the OH65doublet may be slightly contaminated by the H2O 625–514 line(Elower≈580 K) at +160 km s−1, which could have the effectof shifting the velocity of peak absorption of the OH65 bluecomponent to less negative velocities. There are other possiblecontaminating lines as well. In the OH119 profiles ofIRAS03158+4227, Mrk231, Mrk273, IRAS14348−1447,IRAS20100−4156, and IRAS23365+3604, there is substan-tial absorption by CH+ J=3−2 and 18OH at velocities>1000 km s−1 (>500 km s−1 relative to the red component ofthe OH119 doublet), which may significantly weaken theemission feature of the OH119 doublet.
The high-velocity absorption wings or P Cygni profilesobserved in OH119 unambiguously indicate outflowing gas in
all sample galaxies. The maximum blueshifted velocitiesobserved in OH119 range from the very moderate∼250 km s−1 in IRAS09022−3615 to ∼1800 km s−1 inIRAS03158+4227, while most sources show maximumvelocities in the range of 600–1300 km s−1 (see Sturmet al. 2011; Spoon et al. 2013; Veilleux et al. 2013). Withthe exception of IRAS19297−0406, all sources in Figure 1also show P Cygni profiles or high-velocity blueshifted wingsin the cross-ladder OH79 transition. Relative to the absorptionstrength, the redshifted emission feature is usually stronger inOH79 than in OH119. This is most likely because OH79 emitsboth through direct absorption and reemission of 79 μmcontinuum photons and via absorption of 53 and 35 μmphotons and cascades down to the ground state through the Π1/
2 J=1/2 level (GA12), while the OH119 doublet onlyefficiently scatters through direct absorption and reemission of119 μm continuum photons.In contrast, P Cygni profiles in the excited OH84 and OH65
doublets are only observed in IRAS03158+4227 (OH84),IRAS08572+3915 (OH84 and OH65), and IRAS23365+3604 (OH84). This can be attributed to the fact that theexcited lines are formed closer to the optically thick far-IRsource responsible for their excitation (GA14), and thus theiremission from the far side is obscured. Nevertheless, OH84blueshifted line wings are observed up to velocities of∼1000 km s−1 in IRAS03158+4227, IRAS08572+3915,Mrk231, IRAS14378−3651, and IRAS20100−4156, whilesignificant wings with velocities <400 km s−1 are alsoobserved in IRAS05189−2524, IRAS13120−5453,Mrk273, IRAS20551−4250, and IRAS23365+3604. TheOH65 transition requires high columns to be excited (GA15);thus, high-velocity absorption wings in this line are only foundin the most extreme sources: IRAS03158+4227, IRAS08572+3915, Mrk231, and IRAS20100−4156. We argue inSection 5 that a high-velocity wing in OH65 is the mostreliable indicator of powerful AGN feedback.It is also worth noting that in most sources in our sample, the
main absorption features of the OH84 and OH65 doubletcomponents, while peaking at around central velocities, areslightly blueshifted relative to the systemic velocities asmeasured in the [C II] 158 μm line. This systematic effect isfurther explored in Section 4.5, where we conclude that highcolumns of gas (if not most of the gas) are slowly expandingfrom the nuclear regions of ULIRGs, thus potentially changingthe morphology of these regions and shifting the star formationto increasing radii.
4.2. Comparing Outflow Properties as Tracedby Both OH and CO
It is instructive to compare some observational parameters ofmolecular outflows as derived independently from OH and COobservations. Studies of outflows in local ULIRGs based onCO observation have been carried out for five of our sources(Feruglio et al. 2010; Cicone et al. 2012, 2014; Feruglio et al.2015): Mrk231, Mrk273, IRAS08572+3915, IRAS23365+3604, and IRAS10565+2448. More recently, CO observa-tions have also been obtained in two additional OHoutflow sources, IRAS03158+4227 and IRAS20100−4156(A. Gowardhan et al. 2017, in preparation). Given that the COluminosity in the line wings is expected to be proportional tothe gas mass of the molecular outflow, comparison betweenOH and CO sheds light on the physical properties associated
5
The Astrophysical Journal, 836:11 (41pp), 2017 February 10 González-Alfonso et al.
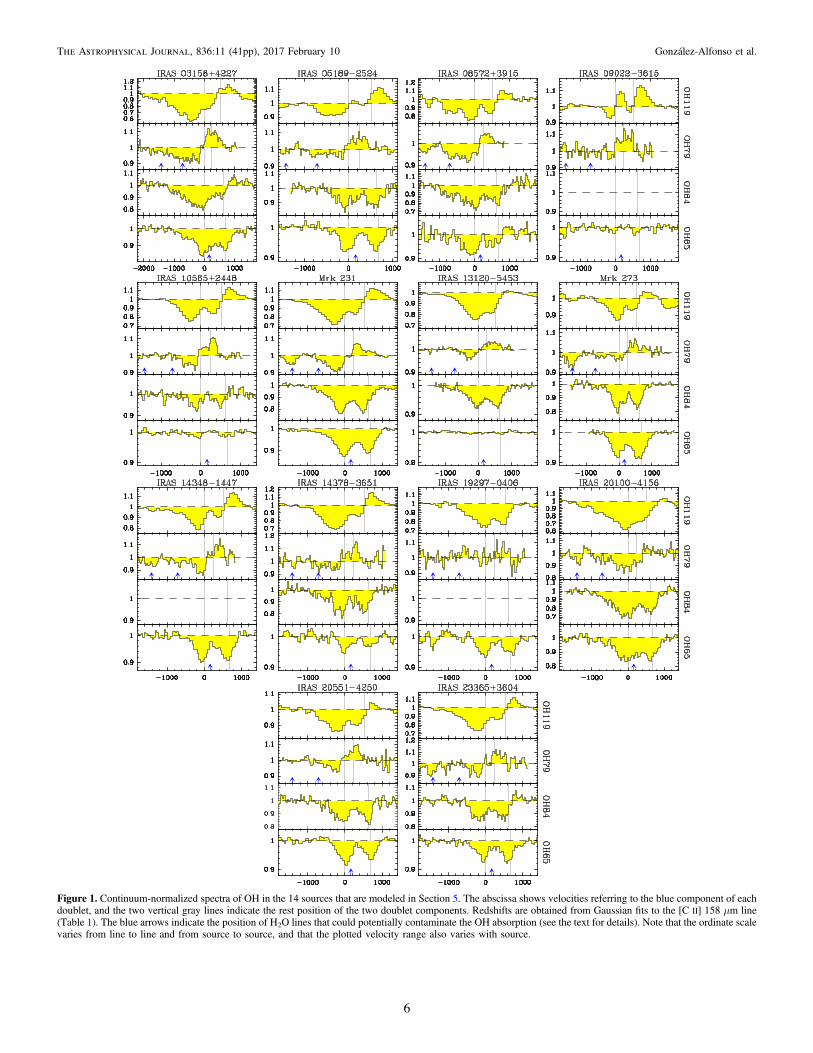
Figure 1. Continuum-normalized spectra of OH in the 14 sources that are modeled in Section 5. The abscissa shows velocities referring to the blue component of eachdoublet, and the two vertical gray lines indicate the rest position of the two doublet components. Redshifts are obtained from Gaussian fits to the [C II] 158 μm line(Table 1). The blue arrows indicate the position of H2O lines that could potentially contaminate the OH absorption (see the text for details). Note that the ordinate scalevaries from line to line and from source to source, and that the plotted velocity range also varies with source.
6
The Astrophysical Journal, 836:11 (41pp), 2017 February 10 González-Alfonso et al.

with the OH doublets. In Figures 2(a) and 2(b) we plot theequivalent widths of OH119 and OH79 as a function of the CO(1–0) flux in the blueshifted line wing multiplied by the squareof distance (a quantity proportional to the outflow mass). TheOH equivalent widths have been calculated for the samevelocity ranges as used for the CO blueshifted line wings givenin Cicone et al. (2012, 2014) and A. Gowardhan et al. (2017, inpreparation). There is a hint of correlation between Weq
(OH119) and SCO1−0D2 (correlation coefficient of 0.79),
though with notable dispersion. Since the OH119 absorptionstrength is basically measuring the covering factor of the119 μm continuum by the outflow ( f119; see Section 4.3), thetrend in Figure 2(a) generally indicates higher outflow masswith increasing covering factor, but the correlation is limitedmost likely because of the high optical depth of OH119 at mostvelocities. A better linear correlation is indeed found betweenWeq of the more optically thin OH79 absorption strength andSCO1–0D
2 (slope of 0.91± 0.09 in the log–log plane, andcorrelation coefficient of 0.93). Therefore, the absorptionstrength of the OH79 doublet is sensitive to the mass of theoutflow, from which we may expect to be able to infer reliablevalues for the outflow energetics. A trend was also foundbetween the outflowing gas mass inferred from the [C II]158 μm line wings and that from OH (discussed in Section 5;see Janssen et al. 2016).
Although OH119 might be expected to have moderateoptical depths at the highest outflow velocities, the maximumoutflow velocities observed on the blue sides of the OH119 andCO lines show intriguing differences (Figure 2(c)), with OHshowing higher blueshifted velocities than CO in IRAS03158+4227, Mrk231, and IRAS23365+3604 and lower velocitiesin Mrk273. This is consistent with the fact that the two speciesmay probe, at least at the highest outflowing velocities,somewhat different components of the galaxies. We mayexpect that OH generally traces more inner regions than CO: asthe expanding gas breaks into clumps and moves away fromthe central region, the collisionally excited CO emission willstill be observed if the density remains high enough within theclumps (i.e., if they are efficiently confined by the interclump-ionized medium), but these clumps will cover a decreasingfraction of the far-IR continuum and will thus produce lowerabsorption and emission in the OH molecules that are
radiatively excited. On the other hand, CO is less sensitive toa compact outflowing shell with small radius and mass, evenwith enough column density to ensure detection in OH119.
4.3. The Covering Factor of the 119 μm Continuum
Given that the OH119 doublet is optically thick, itsabsorption strength constrains the covering factor of the119 μm continuum by the outflowing OH. Figure 3 showsthe peak absorption (panel (a)) and emission (panel (b))strengths as a function of the OH119 peak absorption velocity(Vp,abs
OH119) for all the observed ULIRGs that show the peakabsorption more blueshifted than −80 km s−1. We thus excludehere the sources that peak in OH119 at systemic velocities,because the strength of the peak absorption in these galaxies isdetermined by non-outflowing gas components. Figure 3(a)indicates that the strength of the peak absorption in OH119attains a maximum of 44% in IRAS03158+4227 and is as lowas ≈10% in IRAS05189−2524. Most sources have, however,peak absorption troughs of 20%–30% of the continuum (seealso Figure 1), with hints of increasing absorption strength withincreased blueshifted velocity.The absorption strengths are significantly lower than those
predicted from simple models of an outflowing spherical shellsurrounding and fully covering a source of far-IR emission(GA14; see also Section 5). For instance, a shell with a velocityfield varying linearly with radius, with gas velocities ofvint=400 and vout=200 km s−1 at the inner and outer radiusand velocity dispersion of ΔV=100 km s−1, generates inOH119 a P Cygni profile with peak absorption of ≈60% of the119 μm continuum at = - -V 260 km sp,abs
OH119 1. This is abouttwice the absorption observed in Mrk231, IRAS14378−3651,and IRAS23365+3604, where the OH119 absorption peaks atsimilar velocities (Figure 3(a)). Since the OH119 doublet isoptically thick, and thus insensitive to the OH column densityat least at velocities close to the maximum absorption trough,the discrepancy indicates that OH only covers a fraction (half inthe example above) of the observed 119 μm continuum. Hence,the covering factor of the galaxy 119 μm continuum by theoutflowing OH can be estimated.The observed values in Figure 3 are then compared with
simple modeling results (colored lines and symbols) described
Figure 2. Comparison of the observed OH and CO outflow properties. The equivalent width of the (a) OH119 and (b) OH79 doublets, as a function of the CO flux inthe blueshifted line wing multiplied by the square of distance. The OH Weq have been measured over the same velocity ranges as the CO fluxes. The dotted lines inpanels (a) and (b) indicate chi-square fitting in the log–log plane, giving ( ) ( ) ( ) ( )= - + -W S Dlog OH119 3.56 0.53 1.10 0.10 log10 eq 10 CO1 0
2 (correlationcoefficient of 0.79) and ( ) ( ) ( ) ( )= - + -W S Dlog OH79 3.17 0.47 0.91 0.09 log10 eq 10 CO1 0
2 (correlation coefficient of 0.93). (c) Comparison of the maximumblueshifted velocity of OH119 (corrected for the PACS spectral resolution at 119 μm) and CO (1–0). The dotted line indicates equal velocities. Abbreviated sourcenames are indicated. The CO data are taken from Cicone et al. (2012, 2014) and A. Gowardhan et al. (2017, in preparation).
7
The Astrophysical Journal, 836:11 (41pp), 2017 February 10 González-Alfonso et al.

in Section 5. Rather than the multicomponent models generatedin Section 5 to fit simultaneously all observed OH line profiles,we use here single models to explain the regularities observedin the data set of Figure 3, with no attempt to fit the OH119 lineprofile. We adopt a central continuum source with Tdust=55 Kand τ100=1, surrounded by an extended shell of outflowinggas, with vout=30 and 200 km s−1 (blue and green curves,respectively), variable vint�900 km s−1, and velocity disper-sion ΔV=100 km s−1. From the emergent theoretical spectra,convolved with the PACS resolution, Vp,abs
OH119 and the strengthsof the peak absorption and emission were calculated andmultiplied by the appropriate factor f119, the covering factor ofthe 119 μm continuum by the outflowing OH, to match theobservations. Figure 3 indicates that most of the observedOH119 absorption and emission strengths can be explainedwith f119 ranging from 0.15 (dashed curves) to 0.50 (solidcurves).
P Cygni profiles occur when the absorbing and approachinggas in front of a continuum source and the emitting andreceding gas behind it radiatively decouple from one anotherowing to the expansion. This explains the increase of the peakstrengths with increasing outflow velocities for fixed f119. Inspite of the varying covering factors that may be expected to bepresent in our sample, the effect of this decoupling is apparentin the data. For high outflow velocities and an outflowsignificantly more extended than the continuum source, theabsorption and emission features are expected to be similar, as
the OH merely redistributes the continuum in velocity space.The strength of the emission feature is decreased withdecreasing velocities, due to extinction at 119 μm by thecontinuum source, which accounts for the fact that theabsorption feature is stronger than the emission one. For lowvelocities, only the absorption feature is expected to bedetectable. The modeling values in Figure 3 do not sensitivelydepend on fixed parameters such as Tdust, τ100, or NOH, butdepend on the gas velocity dispersion and of course ongeometry, as our values apply to spherical symmetry.The inferred range f119=0.15–0.50 is similar to the range
obtained from the multicomponent analysis in Section 6(0.17–0.67; the highest value is found in IRAS03158+4227). These values are significantly lower than 1, indicatingthat the outflowing OH covers in most sources only a fractionof the observed 119 μm continuum. On the other hand,f119∼0.50 appears to be too high to be produced by acollimated jet, thus favoring wide-angle coverage as recentlyfound in the outflow of Mrk231 from high angular resolutionCO (2−1) observations (Feruglio et al. 2015). InIRAS17208–0014, the outflow observed in CO (2−1) at thehighest blueshifted velocities (v<−450 km s−1) appears to berelatively collimated (García-Burillo et al. 2015), while theOH119 absorption at the same velocities is shallow (�2%).This independently suggests that OH119 is primarily sensitiveto wide-angle outflows. However, the sources in Figure 3(a)with relatively low absorption troughs, IRAS05189−2524 andIRAS20551−4250 (also Mrk 273; IRAS 09022−3615 isoptically thin in the far-IR), may have a molecular outflowthat is significantly collimated. In any case, the fractionalabsorption may be attributed to clumpiness of the outflowinggas, to biconical (two-lobed) structure, and to the fact that somefar-IR-emitting regions of the host galaxy are not affected bythe outflow.
4.4. Outflowing Gas and Buried Sources
GA15 showed that OH65 is a unique tracer of warm andoptically thick cores that account for a significant fraction (if notmost) of the (U)LIRG’s luminosity, confirming early indicationsthat ULIRGs are optically thick in the far-IR (Downes et al. 1993;Solomon et al. 1997). The extreme properties inferred for thesecores may imply that they represent the most deeply buried stagesof AGN–starburst coevolution. The OH outflows are expected toemanate from these active central cores. For this reason weexamine here the relationship between the OH65 absorption (atcentral velocities) and the velocity of the outflows as measuredwith the most sensitive ground-state OH doublet, OH119.Weq(OH65)20 km s−1 indicates warm (Tdust60 K) andoptically thick (continuum optical depth at 100 μm 1, orNH1024 cm−2) cores. Results are shown in Figure 4, where theoutflow velocity is characterized by V84(OH119), the velocitybelow which 84% of the absorption in the OH119 doublet takesplace (Veilleux et al. 2013; Stone et al. 2016).In the V84(OH119)–Weq(OH65) plane, galaxies occupy three
distinct regions, indicated in Figure 4 with shaded rectangles:galaxies with the highest ∣ ∣ -V 500 km s84
1 are also strong inOH65 (region I), establishing the connection between theburied and warm cores and the high-velocity outflows. Sincethe maximum outflowing velocity in OH is correlated with theAGN luminosity (Sturm et al. 2011; Spoon et al. 2013;Veilleux et al. 2013; Stone et al. 2016), this relationshipsuggests that the warm material probed by the OH65 doublet
Figure 3. Strength, relative to the continuum at 119 μm (C119), of (a) the peakabsorption feature ( - S C1 p,abs
OH119119) and (b) the peak emission feature
( -S C 1p,emsOH119
119 ) of the OH119 doublet as a function of the velocity of thepeak absorption feature (Vp,abs
OH119). Values are obtained from Gaussian fits to theemission and absorption features. Only sources with < - -V 80 km sp,abs
OH119 1 areincluded; abbreviated names are indicated. The green (vout=200 km s−1) andblue (vout=30 km s−1) curves show the results of single-component radiativetransfer models for two covering factors of the 119 μm continuum by theoutflowing OH, f119=0.5 (solid curves) and f119=0.15 (dashed curve; seethe text for details).
8
The Astrophysical Journal, 836:11 (41pp), 2017 February 10 González-Alfonso et al.

ultimately provides the conditions for copious BH accretionand strong AGN feedback.
Nevertheless, the converse does not occur, because a number ofsources with very strong OH65, including three very extremesources (IRAS 15250+ 3609, IRAS 07251–0248, and the LIRGNGC 4418), have low ∣ ∣V84 (region III). Although most ULIRGsin region III are associated with a low attributed contribution ofthe AGN to the luminosity, the lack of high OH velocities in thesesources does not fully preclude an energetically dominant AGN,because the velocities are expected to decrease with increasingcolumn of gas that is accelerated, and the optically thick cocoonsin these sources may cover a large solid angle.
In addition, at least two sources have relatively high ∣ ∣ ~V84-500 km s 1 but are weak in OH65 (region II; IRAS 10565+
3609 and IRAS 13120-5453). The optical spectral types, denotedby symbol color in Figure 4, and the AGN fractions inferred fromthe mid-IR continua, denoted by symbol shape, do not account forthe differences between sources in the three regions, althoughAGN-dominated sources are more clearly identified in regions Iand II than in region III. Most region III sources have a redshiftedOH119 and OH79 peak absorption and/or redshift absorption inthe [O I] 63μm line (IRAS 15250+3609, NGC 4418,IRAS F17207–0014, Arp 220, IRAS 22491–1808), indicating acomplex velocity field with ground-state far-IR molecular lineshapes dominated by non-outflowing foreground gas that, at leastin some cases, appears to be inflowing (see Section 4.8). We thusfocus our modeling in Section 5 on sources in regions I and II (seealso Section 3.1).
4.5. Expansion of the Nuclear Regions
In this section we examine the evidence for low-velocityoutflows detected in the excited OH65 and OH84 doublets.
Because OH65 is a key tracer of warm and optically thicknuclear regions of galaxies (GA15), outflowing signatures inOH65 may be expected to indicate expansion motions of theregions preferentially exposed to feedback from an SMBH oran extreme starburst. However, one crucial point whenstudying velocity shifts in OH65 is the redshift, or velocitycenter, of the nuclear region. Because OH65 is a very highlying transition, it is only excited in regions with a strong far-IRfield and thus with high extinction in the far-IR, and hence theredshifted reemission feature from behind the continuumsource is mostly obscured and not detected. Only one source,IRAS08572+3915, shows direct evidence for a true P Cygniin OH65 (Figure 1). For all the other sources we must infer thenuclear molecular outflows by measuring velocity shifts andidentifying absorption wings in OH65.In Figure 5, we compare the profiles of the [C II] 158 μm
line, the blue and red components of the OH65 doubletseparately, and the OH79 doublet in six sources that showindications of nuclear outflowing gas. Velocity profiles forOH65 are then presented for both the blue and red componentsin separate panels, while the profiles for OH79 are presentedfor the blue component of the doublet (the zero velocity of thered component is also indicated by a dashed vertical line at≈230 km s−1). To infer the velocity of peak absorption inboth the blue and red components of OH65 (Vp,abs
OH65),“truncated” Gaussian fits have been applied to each of theOH65 components in such a way that contamination by theother l-doubling component and by high-velocity wings isminimized, and they are also shown in Figure 5 in blue and red,respectively. We note that Vp,abs
OH65 of the blue component mayactually be lower (more negative) than the fitted value in somesources, due to contamination by the high-lying H2O 625–514
Figure 4. Equivalent width of the high-lying OH65 doublet at central velocities (between −200 and +200 km s−1, Weq(OH65); GA15) as a function of V84, thevelocity below which 84% of the absorption in the OH119 doublet takes place (from Veilleux et al. 2013). We do not include NGC 6240 in this plot because of thepresence of a blueshifted emission feature beyond the OH119 P-Cygni profile (J. Fischer et al., in preparation). Red, green, blue, cyan, and black colors indicate HII,LINER, Seyfert 1, Seyfert 2, and unclassified optical spectral types, respectively (from Veilleux et al. 1995, 1999, 2009; Kim et al. 1998; Rupke et al. 2005b; García-Marín et al. 2006; Véron-Cetty & Véron 2006; or NED/SIMBAD). Circles and triangles indicate sources with fractional AGN contribution to the bolometricluminosity of αAGN�40% and <40%, respectively, as derived from f15/f30 (Veilleux et al. 2009). Three regions (I, II, and III) marked with shaded rectangles areidentified in this plane (see the text). The highest outflow velocities, as measured from the sensitive and ground-state OH119 doublet, are found in sources with strongOH65 absorption (i.e., in buried and warm sources), but the reciprocal does not apply: sources with high OH65 absorption are also found with low ∣ ∣V84 . In addition,two sources with weak OH65 absorption have relatively high ∣ ∣ ~ -V 500 km s84
1.
9
The Astrophysical Journal, 836:11 (41pp), 2017 February 10 González-Alfonso et al.

Figure 5. [C II] 158 μm, the blue and red components of OH65, and the OH79 line shapes in six sources where evidence for nuclear outflowing gas is found. Redshiftsused for all profiles have been taken in all cases from Gaussian fits to [C II] 158 μm (in green). The OH65 blue and red components have also been fitted withGaussians (blue and red curves), showing significant velocity blueshifts or asymmetries relative to [C II] 158 μm in all these cases. The blue arrows indicate theposition of the H2O 625–514 line, which could be contaminating the blue component of some OH65 profiles. The cyan arrows in the lower panels indicate theapproximate peaks of absorption and emission in the OH79 P Cygni line profiles, while the OH79 absorption features have their counterpart in the blueshifted OH65doublet absorption features.
10
The Astrophysical Journal, 836:11 (41pp), 2017 February 10 González-Alfonso et al.

line, the position of which is indicated with blue arrows.Therefore, we mostly rely on the velocities inferred from theOH65 red component to infer the detection of outflowing gas inOH65. The bottom panels in Figure 5 show the OH79 profilesin these sources, which all show P Cygni line shapes.
The OH65 profiles are broad, extending all the way to−500 km s−1 on the blue wing, and in some cases beyond thelimits of the [C II] emission at zero intensity. (Note, however, thatthe [C II] line wings observed in Janssen et al. (2016) are hardlyperceptible in Figure 5, due to the linear scale used for theordinates.) In addition, clear velocity shifts of 50–200 km s−1
between the OH65 peak absorption and the [C II] peak emissionare seen in Figure 5. In IRAS 08572+3915, IRAS 14348–1447,Mrk 273, and IRAS 23365+3604, the OH65 feature is blue-shifted relative to [C II]. In IRAS 20551–4250, OH65 peaks at thesystemic velocity but shows an asymmetric blue wing in bothOH65 components up to −400 km s−1.
Blueshifts in OH65 relative to [C II] can be attributed to (i)differences between the nuclear redshift(s) and that of the bulk ofthe host galaxy as traced by [C II], possibly due to nuclear motionsassociated with the merger; (ii) noncircular motions in the nuclearregion due to bar-like or oval distortions and warps (leading toelliptical orbits; e.g., Sanders 1989); or (iii) OH65 absorption thatis tracing expanding (radial) gas flows in the nuclear region.While the first two possibilities should be considered, particularlyin ULIRGs where the rotating, merging nuclei might indeedgenerate such velocity shifts, comparison of the OH65 and OH79profiles suggests that the third possibility is clearly favored insome sources. The OH79 line profiles show P Cygni profiles in allsources presented in Figure 5, and in IRAS08572+3915,IRAS14348–1447, and more tentatively in Mrk 273 the blue-shifted absorption features in OH79 have counterparts both in
emission at positive velocities in OH79 (indicated by the cyanarrows) and in absorption at the same velocities in the OH65doublet. It is this OH79–OH65 correspondence in the blue part ofthe profiles, together with the P Cygni in OH79 (as well as thepreponderance of OH65 blueshifted absorption as discussedbelow), that enables us to distinguish between rotating andoutflowing motions in the nuclear regions from the OH65 profiles.The inferred outflows do not preclude, however, the simultaneousincidence of a non-outflowing component in OH65.Figure 6 shows Vp,abs
OH65 in all sources that are detected inOH65 (GA15, thus including more than the 14 sources of ourmodeling sample), as well as the corresponding quantity forOH84 in those sources where the doublet is available. With theexceptions of IRAS07251–0248 and IRAS 17208–0014 (thelatter showing evidence for outflowing gas in CO; García-Burillo et al. 2015), all other sources in Figure 6 withsignificant blueshifted OH65 absorption show a P Cygni profilein OH119, which is indicated in Figure 6 by magenta coloredsource names, while the incidence of a P Cygni OH119 lineshape in sources with no OH65 blueshift is significantly lower.Three sources, IRAS14378–3651, IRAS20551−4250, andIRAS12112+0305, show P Cygni profiles in OH119, but theirOH65 doublets peak at central velocities. IRAS20551−4250,however, has a blueshifted wing in OH65 that is alsoattributable to outflowing gas (Figure 5). The intermediateOH84 doublet confirms the velocity shifts seen in OH65 inmost cases. Specifically, IRAS10565+2448 is weak in OH65(but detected; GA15), and its Vp,abs
OH65 value has largeuncertainties. However, shifts of ∼130 km s−1 are clearly seenin OH84. In IRAS23365+3604, the velocity shifts in OH84are larger than in OH65, as is also the case in Mrk231 (GA14).
Figure 6. Velocity of peak absorption of the OH65 (Vp,absOH65, upper) and OH84 (Vp,abs
OH84, lower) doublets relative to the velocity of the [C II] 158 μm line, in all sourceswhere the OH65 doublet is detected (GA15), including the 14 ULIRGs of the modeling sample. Blue and red symbols indicate peak absorption velocities of the blueand red components of the doublets, obtained from Gaussian fits to each doublet component. Vp,abs
OH65 of the blue component is systematically lower than that of the redcomponent, most likely due to contamination of the blue component by the high-lying H2O 625–514 line. Error bars are 2σ, and the error bars on the right-hand sideindicate potential “skewness” error from pointing drifts, which we adopt as 0.01 μm (i.e., ≈45 km s−1 for OH65; see Section 4.7.2 of the PACS Observer’sManual, http://herschel.esac.esa.int/Docs/PACS/html/pacs_om.html). Abbreviated source names are indicated; those in magenta indicate that clear signatures ofoutflowing gas (P Cygni or wings) in the ground-state OH119 doublet are observed. Sources are sorted according to the component-average value of Vp,abs
OH65.
11
The Astrophysical Journal, 836:11 (41pp), 2017 February 10 González-Alfonso et al.

Identifying outflowing gas in excited OH transitions may misssome molecular outflow sources, such as Arp220 where clearindication of low-velocity outflowing molecular gas is seen inseveral species, including OH (Sakamoto et al. 2009;González-Alfonso et al. 2012; Tunnard et al. 2015; Martínet al. 2016).
A detailed comparison of the blueshifted absorption wings inOH119, OH79, OH84, and OH65 is shown in Figure 7 for the 14sources modeled in Section 5. Besides Mrk231, IRAS03158+4227, IRAS20100−4156, and IRAS08572+3915, where thehigh-velocity outflowing gas in OH65 is evident, Mrk273 andIRAS14348−1447 show similar line shapes in OH65 and in theP Cygni OH119–OH79 doublets, indicating that OH65 is alsotracing outflowing gas. Similarly, the OH65 line wing inIRAS23365+3604 has its counterpart in OH119 and OH84,both showing P Cygni profiles (Figure 1). We conclude that, inaddition to Mrk231 (GA14), IRAS03158+4227, andIRAS20100−4156, the six sources in Figure 5 show evidencefor outflowing gas in the high-lying OH65 transition. In addition,IRAS09022−3615 and IRAS10565+2448, although weak inOH65 (GA15), show hints of blueshifted OH65 absorption aswell (Figure 1).
Could these velocity shifts observed in OH65 be associatedwith merging motions, rather than outflowing or inflowing gas?We compare the peak velocities of the OH65 doublet (inabsorption) to those of the [O I] 63 μm (hereafter OI63)emission line in Figure 8(a). These velocities tend to beanticorrelated: when the OH65 peak is blueshifted, the OI63peak tends to be redshifted and vice versa. Figure 8(b) showsVp,abs
OH65 as a function of the OI63 red–blue asymmetry.Consistent with panel (a), panel (b) shows that, when OH65is blueshifted, the OI63 line usually has a “red-type” profile(and vice versa), i.e., the profile is distorted by a reduction ofthe intensity on the blue side. This is fully consistent with thescenario of atomic oxygen also outflowing with the OH, andthus absorbing the continuum and line emission arising frombehind.14 It also rules out that the OH65 shifts are the result ofglobal nuclear motion relative to the more tenuous and
Figure 7. Detailed comparison of the blueshifted side of the OH119 (black histograms), OH79 (green), OH84 (blue), and OH65 (red) line profiles observed in the 14sources that are modeled in Section 5. We only show the relevant velocity ranges of each doublet for clarity. The H2O 423–312 line is most likely producing absorptionat velocities −1400 km s−1 in the OH79 spectra of IRAS03158+4227 and IRAS20100−4156.
14 Although some continuum is absorbed, the OI63 line is not seen inabsorption because it has an Einstein A-coefficient of ∼10−4 s−1 (much lowerthan OH65, ≈1.2 s−1) and is thus easily excited through collisions in warm anddense nuclear regions. The OI63 line is only seen in absorption in sourceswhere high columns of oxygen are found in extended, low-density regions infront of the 63 μm continuum source (GA12; Falstad et al. 2015).
12
The Astrophysical Journal, 836:11 (41pp), 2017 February 10 González-Alfonso et al.

extended region probed by the [C II] line, because in the lattercase one would expect the OH65 and OI63 to peak at the samevelocities, contrary to the observed trends.
To put these results on a first quantitative framework, themoderate velocities found here are similar to those predicted byKing (2003) in his analytical modeling of outflows driven by awind with momentum flux comparable to the Eddington-limited radiation field (Ledd/c), i.e., ( )s=v G L f c2m gedd
2 1 2,giving ≈80 km s−1 for Ledd=1012 Le, velocity dispersionσ=200 km s−1, and gas fraction fg=0.16. The derivation ofvm in King (2003) assumes an isothermal sphere of dark matter,involving an outflowing gas mass of 3×10⁸×(σ/200 km s−1)2×(r/100 pc) Me and a column density of2×1023×(σ/200 km s−1)2×(r/100 pc)−1. It ignores thepotential well, implicitly assuming that the gas is supportedby radiation pressure or rotation.
These results show that the nuclear regions of galaxies withhigh-velocity outflows (as seen in OH119) also show slowernuclear outflows, i.e., the far-IR “photospheres” where OH65 isformed are (partially or completely) expanding at lowvelocities. Since OH65 requires high columns to be detected,star formation may proceed at significant rates in thisexpanding material, with the consequence that star formationpropagates outward.
4.6. Velocity Components
Figure 9 summarizes the relationship between Vp,absOH65 and the
velocities inferred from OH79 and OH119. Some sources have» » <V V V 0p,abs
OH65p,absOH119
p,absOH79 (Figure 9), indicating the pre-
sence of nuclear outflowing gas with the three lines tracingbasically the same gas. In other sources, OH65 peaks atdifferent velocities than OH119 and OH79, indicating thatdifferent components are traced by the OH doublets. It is also
apparent from Figures 7 and 9 that the ground-state OH119doublet usually traces gas at more blueshifted velocities thanthe other doublets in most sources. The peak absorptionvelocities of the four doublets are compared in Figure 10 for allsources where OH65 is detected, clearly showing a tendencyfor the high-lying OH65 and OH84 lines to trace gas at lowervelocities than the ground-state OH119 and OH79 doublets. Inthe ground-state lines, absorption and reemission at systemicvelocities take place over large volumes and tend to cancel eachother (see Figure4 in Spoon et al. 2013; Figure 8 in GA14),leading to clear P Cygni profiles due to absorption andreemission at higher velocities. This cancellation cannothappen in the high-lying lines, in which lower-velocity shiftsindicate higher column densities of gas with lower outflowingvelocities.
4.7. Compact and Extended Outflows
Despite the relatively low spatial resolution of Herschel/PACS, the OH excitation can nevertheless constrain the spatialextent of the outflows. In IRAS08572+3915, Mrk273, andIRAS20551−4250, the absorption in the excited OH84transition is almost as strong as (or even stronger than) theOH119 absorption (Figure 7). In these objects, essentially alloutflowing gas traced by the ground-state and optically thickOH119 is significantly excited by the far-IR field, indicatingrelatively small distances to the nuclear region and thus acompact outflow. Mrk273 in particular was found by Ciconeet al. (2014) from high-resolution CO (1–0) observations tohave the smallest size among all their detected ULIRGs. In theother sources, OH119 is much stronger than OH84 at least atsome negative velocities, indicating the presence of a spatiallyextended outflow component.
Figure 8. Velocity of peak absorption of the OH65 doublet (blue component of the doublet) as a function of (a) the velocity centroid of the [O I] 63 μm emission lineand (b) the [O I] 63 μm red–blue asymmetry, which is defined as ( ) ( )- ++ - + -F F F F , where F+ (F−) is the flux measured at positive (negative) velocities. Thedotted line in panel (a) indicates equal velocities. The error bars in the upper left corner of each panel indicate potential “skewness” uncertainties due to pointing drifts.The two sources in our sample with evidence for inflowing gas, IRAS11506−3851 and IRAS15250+3609 (see Section 4.8), are labeled in panel (b).
13
The Astrophysical Journal, 836:11 (41pp), 2017 February 10 González-Alfonso et al.

4.8. Inflows
Besides the prevalent outflowing motions traced by OH, inflowsignatures are also seen in a few (U)LIRGs as observed withHerschel/PACS. In addition to the previously studied case ofNGC4418 (González-Alfonso et al. 2012), where the inflow hasalso been inferred from high angular resolution observations(Costagliola et al. 2013; Sakamoto et al. 2013), the case ofZw049, where an inverse P Cygni profile is also observed in the[O I]63μm line (Falstad et al. 2015), the inverse P Cygni profileof OH119 in Circinus (Stone et al. 2016), and the inflow observedin OH119 around Arp299a (Falstad et al. 2017), the clearestexamples are the LIRG IRAS11506−3851 and the ULIRGIRAS15250+3609. Their OH spectra are shown in Figure 11,
where the redshifts are obtained from Gaussian fits to the [C II]158 μm profiles. In IRAS11506−3851, the OH119, OH79, andOH84 peak absorption velocities are redshifted relative to [C II],while the highest-lying OH65 velocity is more centered than theothers but still slightly redshifted (see also Figure 10). Thestrongest evidence for inflow comes from OH79, which shows aninverse P Cygni profile with an emission feature at∼−100 km s−1 and a concomitant asymmetry between the redand blue components of the doublet. The emission feature appearsto have a weak counterpart in OH119 as well. In addition, thehigh-lying OH84 line shows hints of a blueshifted line wing inabsorption as observed in CO (Pereira-Santaella et al. 2016),possibly indicating the coexistence of an outflow in the nuclearregion. In IRAS15250+3609, the observed OH119, OH79, andOH65 doublets are also redshifted relative to [C II], and OH119shows a broad emission feature between ∼−300 and−1000 km s−1. Rather than a simple infall around a central warmsource, the extreme velocities in this source rather suggest anapproaching double-nucleus system, with the strongest source offar-IR radiation associated with the nucleus closer to the observerand illuminating the secondary nucleus responsible for the OH119emission feature, which may be disrupted by tidal forces.Interestingly, this is the source with the highest equivalent widthin OH65 (GA15; see also Figure 4), and a blueshifted line wing inthis doublet also suggests the simultaneous occurrence of anuclear outflow, as observed in HCO+ 3–2 (Imanishi et al. 2016).Both IRAS11506−3851 and IRAS15250+3609 show a blue-shift profile in the OI63 line, i.e., the line shows a reduction of theintensity on the red side (Figure 8(b)). These sources will bestudied in more detail in future work.
5. Radiative Transfer Models
5.1. A Library of Model Components
In order to quantitatively estimate the energetics associatedwith the observed outflows, we have developed a library ofmodel components with the radiative transfer code describedin González-Alfonso & Cernicharo (1997, 1999). In short, themethod calculates the statistical equilibrium populations in allshells of a spherically symmetric source, as well as theemergent continuum and velocity profiles of all lines after
Figure 9. Velocity of peak absorption of the OH65 doublet, Vp,absOH65, as a function of the velocity of peak absorption (a) of the OH119 doublet (blue transition) and (b)
of the OH79 doublet (blue transition). Blue and red symbols indicate Vp,absOH65 of the blue and red transitions of the OH65 doublet. Abbreviated names are indicated for
some sources. The dotted lines indicate equal velocities, =V Vp p,absOH65
,absOH119 and =V Vp p,abs
OH65,abs
OH79. The error bars in the lower right corner of each panel indicate potential“skewness” uncertainties due to pointing drifts.
Figure 10. Velocity of peak absorption (Vp,abs) of the OH119, OH79, OH84,and OH65 doublets in all sources where OH65 and or OH84 are detected.∣ ∣Vp,abs decreases with increasing excitation energy. The error bar indicatespotential “skewness” uncertainties from pointing drifts. Abbreviated sourcenames are indicated.
14
The Astrophysical Journal, 836:11 (41pp), 2017 February 10 González-Alfonso et al.

convolution with the PACS spectral resolution. The approachis thus non-LTE and nonlocal, takes into account the radiativepumping by both local and nonlocal dust (the dust is mixedwith the gas), and accurately includes the effects of both lineand continuum opacity effects and line overlap between the l-doubling components of OH. The gas velocity field can becomposed of pure turbulence and radially outflowing motionswith or without velocity gradients. The radial velocity isallowed to vary continuously within any shell. We developedtwo types of models to fit the continuum and line emission ofour sample sources: “CORE” and “ENVELOPE” models(Figure 12). They are described below.
CORE models. These models are intended to describe thecontinuum emission and line absorption at systemic velocitiesproduced in the nuclear regions of galaxies (GA15). Theyconsist of a source of dust with temperature Tdust and radialoptical depth at 100 μm τ100. The OH, mixed with the dust, hasturbulence ΔV, and its column is determined by τ100 accordingto Equation(1) in González-Alfonso et al. (2014a), with an OHabundance relative to H nuclei of XOH=2.5×10⁻⁶. Theadopted abundance is, within a factor of ∼3, consistent with thevalue inferred from multitransition observations of OH in theGalactic SgrB2 and Orion KL outflow (Goicoechea &Cernicharo 2002; Goicoechea et al. 2006) and in buried galaxynuclei (GA12; Falstad et al. 2015), and with chemical models
of dense photodissociation regions (the peak value; Sternberg& Dalgarno 1995) and of cosmic-ray- and X-ray-dominatedregions (Meijerink et al. 2011). The source structure includesexpansion with constant velocity vout to describe the low-velocity blueshifts of the peak absorption of OH65 that indicateoutflowing gas in the nuclear region (Section 4.5), and it isdivided into shells to account for the varying excitation with
Figure 11. Observed OH line shapes in IRAS11506−3851 and IRAS15250+3609, where inflow signatures are detected. The vertical gray lines in all panels indicatethe rest position of the two l-doubling components, with the velocity scale taken relative to the blue component of each doublet. The arrow in the OH65 panel indicatespossible contamination by a high-lying H2O line.
Figure 12. Schematic representation of the two types of model components,CORE and ENVELOPE, and independent parameters (Section 5.1) used to fitthe observed OH line profiles.
15
The Astrophysical Journal, 836:11 (41pp), 2017 February 10 González-Alfonso et al.

depth into the source. The free parameters of the COREcomponents that are varied from model to model are then Tdust,τ100, ΔV, and vout.
ENVELOPE models. These models also consist of a centralsource of only dust that is surrounded by an expanding shell ofgas and dust (which is also divided into shells to account for thevarying physical conditions with distance to the central source).The gas velocity is allowed to vary linearly with radius acrossthe expanding shell (GA14), and thus the free parameters areTdust and τ100 of the central source and Rout/Rint, vint, vout, ΔV,and NOH of the expanding shell. The density of dust across theshell is determined by the OH density, assuming alsoXOH=2.5×10⁻⁶ and a gas-to-dust ratio by mass of 100(GA14). In all models we assume a constant mass outflow rate,so that nH v r2 is uniform between Rint and Rout (GA14).
5.2. χ2 Fitting
Our approach relies on the assumption that the OH profiles canbe considered a superposition of the single-component modelsdescribed above. This is questionable mostly at central velocities,where there may be radiative coupling between different gascomponents, but has the overall advantage of simplicity.
Up to NC=3 model components were allowed to becombined in order to simultaneously fit the continuum-normalized OH119, OH79, OH84 (when available), andOH65 spectra in a given source. For each combination ofcomponents, the modeled continuum-normalized value of line iand velocity channel j is
( )å= +=
S f s1 , 1ijl
N
il ijl1
C
where the sum extends to the NC components of the combination.Here fil is the ratio of the continuum flux density of model l to thetotal (observed) continuum, at the wavelength of line i:
( )=f C C , 2il il i,OBS
where C stands for the continuum flux density and OBS refersto the observed values. Parameter sijl is the continuum-normalized model prediction minus 1:
( )= -s F C 1, 3ijl ijl il
where Fijl and Cil are the predicted line flux density andcontinuum flux density, respectively, for model component l.Our minimization process calculates, for each combination ofmodel components, the values of fil that best fit the observedspectra. For a given model component l, however, the values offil for different lines are related to each other through
( )=f fC C
C C, 4il l
il l
iOH119,
OH119,
,OBS OH119,OBS
and thus only the values of fOH119,l are fitted. The reduced χ2
value for a given combination that we aim to minimize is
( )[ ] ( )
( )
åååc
s=
--
= = =N i NS E
1 1, 5
l
Nv C i
N
j
N i
iij ij
2
1 1 12
2C
l v
where Nl is the number of lines fitted in a given source, Nv(i)and σi are the number of velocity channels of and the rms noisearound line i, respectively, and Eij is the observed continuum-normalized value of line i at velocity channel j. The NC
parameters that are varied to minimize χ2 for each combinationare f lOH119, , and this is done using standard methods.In practice, we used the same “line-averaged” value for all σi
in a given source and increased the relative weight of channelsin the line wings, in which we are mostly interested. Dependingon the observed line shapes in a given source, we selected(NCORE, NENVELOPE) as (1, 2), or (1, 1). The minimizationprocedure was done for all possible combinations allowed bythe following restrictions: (i) The predicted spectral energydistribution (SED) for the components should be as warm as orwarmer than the observed SED. As the OH expands, themolecules are subject to a progressively colder far-IR SED, butnot colder than the average galaxy SED as seen by theobserver. (ii) In some sources, a maximum Tdust was imposedfor the CORE models, to avoid overestimating the continuumat short wavelengths. More than 100 CORE models and morethan 400 ENVELOPE models were generated, giving from∼105 to several×106 allowed combinations.In addition to χ2, we calculated the corresponding value
χBW2 that uses only the velocity channels at blueshifted
velocities. A first selection was done including all combina-tions with a value of χ2 within 20% of the minimum χ2.Among all these combinations, the best fit was selected as thecombination that gives the minimum value of cBW
2 . Figures 13–16 show our best-fit composite models for OH119, OH79,OH84, and OH65 in the 14 modeled sources (Section 3).
5.3. Approaching the Minimum χ2
Since the number of input parameters involved in theENVELOPE models is high, the following three-step strategyto approach the minimum was generally adopted: (i) We firstdeveloped a coarse grid of models, common to all sources, byvarying the velocity field, NOH, and Tdust, for two values of Rout/Rint=1.3 and 1.6, and keeping τ100=1 and ΔV=100 km s−1
fixed. A first search of the minimum was then performed, and thegrid was additionally refined in some regions of parameter spaceif no satisfactory fit was found. (ii) The grid was additionallyrefined by varying the velocity field, NOH, and Tdust around theminimum and also varying to a greater extent Rout/Rint and τ100.A second search of the minimum χ2 was carried out. (iii) Thefinal step consisted in further refining the model grid around theminimum, varying also ΔV and with special consideration ofNOH. The region around the minimum was then sufficientlypopulated to determine the error bars associated with theenergetics (see Section 5.5).
5.4. Continuum and Minimum Size
Our fitting procedure uses the observed continuum-normal-ized OH spectra and the corresponding theoretical continuum-normalized spectra, as well as the observed far-IR colors in theOH bands as inputs (Equation (4)). Once the value of f lOH119, isfitted, we use the observed absolute value of the continuumflux density at 119 μm, COH119,OBS, to infer the absolute valueof the 119 μm continuum flux density associated with modelcomponent l, = ´C f Cl lOH119, OH119, OH119,OBS. Since thenormalized SED for any component is fully determined forgiven Tdust and τ100, the inferred C lOH119, value gives a specificprediction for the absolute SED of the underlying far-IR sourceassociated with component l. The absolute calibration of themodels is thus based on the far-IR continuum, which in turn isthe source of the OH excitation.
16
The Astrophysical Journal, 836:11 (41pp), 2017 February 10 González-Alfonso et al.

With the absolute SED known, the required solid angle ΔΩof component l is obtained, and hence the minimum size of thecomponent through p= DWR D1 , where D is the distance tothe source. This minimum radius implicitly assumes that theOH in each outflow component is not clumpy (we relax thisassumption below when calculating the energetics), so that
<f 1lOH119, is due to additional continuum from the galaxy notassociated with the l-component (i.e., associated with other OHcomponents or with far-IR emission unrelated to OH).
We compare the predictions for the galaxy continua with theobserved SEDs for all modeled sources in Figure 17, where thered curves indicate the total continua (i.e., the sum of allcomponents, including the non-outflowing one). Our superpositionapproach is consistent with observations as long as the modeledcontinuum does not exceed the observed one at any wavelength (itcan underestimate the observed continuum if some of it isunassociated with OH). In two sources, IRAS03158+4227 andIRAS14348−1447, the modeled continuum slightly exceeds theobserved SED at λ<50μm, indicating that the continua from thedifferent components are not independent in these sources.
5.5. Estimating the Energetics
Using the thin-shell approximation, the mass of theoutflowing gas associated with a given component l is
( )p m=M R m N4 , 6out 12
H H
where μ=1.4 is the mass per H nucleus and NH=NOH/XOH.Both R1 (=Rout for the CORE models, and =(Rint+Rout)/2 forthe ENVELOPE models) and NOH are directly inferred fromthe fitting procedure.Since the continuum of each component underpredicts the
observed SED, the observations can also be interpreted in termsof a clumpy distribution, where the source radius R is actuallylarger than R1, = -R f Rc
1 21, and the outflowing OH only
covers a fraction fc of the underlying continuum source. Wedetermine the minimum value of fc such that the modeled fluxdensity does not overpredict the observed SED at anywavelength.15 The outflowing gas mass is, nevertheless, thesame as in Equation (6), which we now express as
( )p m=M f R m N4 , 7cout2
H H
but the mass outflow rate and momentum flux (see below)decrease by a factor of fc
1 2. For the CORE models withvout>0, where the whole source is expanding, we limit NH to5×1023 cm−2 if the column through the source exceeds thatvalue because this is the column that yields a continuum opticaldepth of ∼1 at 60 μm.While we consider R to be the most likely value of the
outflow radius, and thus a clumpy distribution is adopted, the
Figure 13. Model fits to the observed OH119 doublets (shown as yellow-shaded histograms) in 14 sources. The models simultaneously fit the line profiles of all(OH119, OH79, OH84 when available, and OH65) doublets observed in each source through χ2 minimization using combinations of model components taken from alibrary. Dashed lines indicate different components (up to three in each source, in blue, green, magenta), and red is total. The two vertical lines in each panel indicatethe rest position of the doublet transitions. The velocity scale is relative to the blue transition of the doublet. The fits to the other OH doublets are shown in Figures 14–16, and the predicted far-IR continua are compared with the observed SEDs in Figure 17.
15 Note that fc>f119 in warm components, because the predicted flux densityat λ<100 μm is closer to the observed one than that at 119 μm.
17
The Astrophysical Journal, 836:11 (41pp), 2017 February 10 González-Alfonso et al.

value of R1 is relevant as it indicates the radius below which theOH is predicted to cover the full 4π sr. This value is used in oursimple dynamical model in Section 7.
There are two limiting approaches to the estimation of theenergetics associated with a given component: the local(maximum) or instantaneous values and the average (mini-mum) values (see also Rupke et al. 2005c). The local estimatesuse the inferred density nH of the expanding gas:
˙ ( )p m= =D
M f R m n vM v
R4 , 8cloc
2H H
out
˙ ˙ ( )=P M v, 9loc loc
˙ ˙ ( )=E M v1
2, 10loc loc
2
where ΔR=Rout−Rint is the thickness of the outflowingshell. These local estimates give the mass, momentum, andenergy crossing instantaneously per unit time a sphericalsurface of radius R, and they can only be considered “time-averaged” if we assume that the outflowing gas extends tor=0, although we only observe a fraction of it owing to far-IRopacity (extinction) and line opacity effects. This approach wasused in Sturm et al. (2011) and GA14. The average valuesassume, by contrast, that there is no more outflowing gas insidethe curtain of dust, so that
˙ ( )p m= =M f R mN v
R
M v
R4 , 11cout
2H
H out
˙ ˙ ( )=P M v, 12out out
˙ ˙ ( )=E M v1
2. 13out out
2
Evidently, the average values are a factor of ΔR/R lowerthan the local values. In this paper, we use the mostconservative Mout, Pout, and Eout values to characterize theoutflows. These are the “time-averaged thin-shell” values inRupke et al. (2005c), which have also been used by a numberof authors describing the energetics of the ionized and neutralphases of outflows (e.g., Arav et al. 2013; Borguet et al. 2013;Rupke & Veilleux 2013a; Heckman et al. 2015), and are mostappropriate for comparison with outflow models (e.g., Faucher-Giguère & Quataert 2012; Stern et al. 2016; Thompson et al.2015). In some studies, a factor of 3 higher values have beenused because the emitting spherical (or multiconical) volume isassumed to be filled with uniform density (e.g., Feruglio et al.2010, 2015; Maiolino et al. 2012; Rodríguez Zaurín et al. 2013;Cicone et al. 2014; Harrison et al. 2014; García-Burilloet al. 2015). For a steady flow with constant velocity, however,we would expect a density at the outer radius only 1/3 that ofthe average, thus also yielding the expression in Equation (11).On the other hand, the assumed flow timescale (R/v ) is
overestimated in this expression if a fraction of the gas isloaded (and suddenly accelerated) at some distance from thecenter, which is relevant here given the compact sizes we inferbelow. However, if the gas is smoothly accelerated from thecenter, the flow timescale will be longer than R/v by a factor of∼2. Our assumption of spherical symmetry (the 4π factor) may
Figure 14. Model fits to the OH79 doublets in 14 sources. Blue arrows indicate possible contamination by H2O. See also caption of Figure 13.
18
The Astrophysical Journal, 836:11 (41pp), 2017 February 10 González-Alfonso et al.

overestimate the energetics by a factor of ∼2 in the case ofbipolar emission with no gas flowing along the plane of sky. Insystems where gas flows primarily along the plane of sky, theenergetics will obviously be underestimated. In the aboveexpressions involving v, we use the average of vint and vout.
The total values that characterize a given source are the sumof Mout, Mout, Pout, and Eout over all components (Rupke et al.2005c),
( ˙ ˙ ˙ ) ( ˙ ˙ ˙ ) ( )å=M M P E M M P E, , , , , , . 14tot tot tot totcomp
out out out out
Mtot, Ptot, and Etot are plotted in Figure 18 as a function of Lbol,LAGN, and L* (see also Figure 19).
To estimate the uncertainties of the total values inEquation (14), we calculate the values of Mtot, Mtot, Ptot, andEtot, for all model combinations that yield χ2 and cBW
2 to within20% of their minimum values, and we conservatively use themaximum and minimum values of the energetics of all thesecombinations to define the error bars. Uncertainties usuallyrange from 50% of the best-fit value to more than a factor of 2in some cases, and do not include systematic uncertainties dueto our adopted OH abundance.
We also calculate the mass-loading factor of each outflowcomponent, ˙h = M SFRout , where SFR is the star formation rate(SFR=10−10 L*Me yr−1, where L* has units of Le). Thestarburst and AGN contributions to LIR (see Table 1) areestimated from the flux densities at 15 and 30 μm according toVeilleux et al. (2009, 2013). The total value of η is also obtainedby summing the contributions from all outflowing components.
6. Modeling Results
6.1. Overall Model Fits
Our best fits to the OH119, OH79, OH84, and OH65doublets are shown in Figures 13–16, respectively. Table 2 liststhe parameters of the outflowing components for the best-fitcombination, together with the derived energetics. The totalenergetics of the outflows are listed in Table 3.In IRAS09022−3615, where OH65 is not detected and
OH84 is not available, we use only one model component to fitOH119 and OH79. In IRAS13120−5453, where OH65 is alsoundetected, we use two model components. Similarly, we useonly two components in IRAS19297−0406, where OH79 isundetected. In the rest of the sources, three components arerequired to obtain a reasonable model fit. One of them is usedto match the absorption in the excited OH84 and OH65doublets at central velocities (CORE models), though the fitsometimes requires expansion velocities of up to 100 km s−1.The other two components are needed to fit line absorption andemission at higher velocities (200 km s−1). With our limitednumber of components, some very high velocity wings seen inOH119 (IRAS 03158+4227, IRAS 13120−5453, IRAS 14348−1447, IRAS 14378−3651, and IRAS 23365+3604) are notfitted, because the associated energetics from only OH119 arerelatively uncertain.The overall goodness of the fits to the line shapes indicates
that, in spite of the two-lobed structure generally observed forthe outflows traced by CO (e.g., Alatalo et al. 2011; Ciconeet al. 2014; Feruglio et al. 2015; García-Burillo et al. 2015), the
Figure 15. Model fits to the OH84 doublets in 14 sources. See also caption of Figure 13.
19
The Astrophysical Journal, 836:11 (41pp), 2017 February 10 González-Alfonso et al.

spherical symmetry implicit in the model is, as a firstapproximation, a reliable approach to the outflow systems, inline with the wide-angle outflow geometry inferred fromOH119 detection statistics (Veilleux et al. 2013; see alsoSection 4.3). However, some sources show indications ofsignificant departures from sphericity, which is best seen in thefits to the OH119 doublet in Figure 13. In strict sphericalsymmetry, an OH119 redshifted emission feature that is weakrelative to the absorption feature can only be attributed to far-IR extinction of the emission behind the continuum source, anddetection of OH65 (a tracer of optically thick continuum at119 μm) would be consistent with this explanation. InIRAS13120−5453, however, there is essentially no reemis-sion at redshifted velocities, but OH65 is undetected. Themodeled OH119 profile indeed strongly overpredicts theredshifted emission, indicating that the gas responsible forthe absorption is not accompanied by comparable amounts ofOH on the other side of the continuum source. Significantoverpredictions of the OH119 redshifted emission are also seenin IRAS03158+4227 (absorption by CH+ may reduce theOH119 emission feature in this source; Section 4.1),IRAS10565+2448, IRAS19297−0406, and IRAS23365+3604. On the other hand, the opposite effect is seen inIRAS09022−3615, where the OH119 emission feature isstronger than the absorption feature. This can be explained byeither collisional excitation of the OH119 line or a relativeexcess of outflowing gas behind the continuum source. Weconsider the energetics inferred from the models ofIRAS09022−3615 and IRAS19297−0406 relatively
uncertain, and we do not include them in the analysis below.As argued in Section 4.3, the molecular outflows inIRAS05189−2524, Mrk273, and IRAS20551−4250, inwhich the OH119 absorption trough is relatively weak, aremost likely relatively collimated.
6.2. Overall Continua and Energetics
The predictions for the galaxy continua are compared withthe observed SEDs in Figure 17, showing that the totalpredicted continuum in most sources (in red) is similar to theobserved SED in the transition from mid- to far-IR wavelengths(i.e., from 25 to ∼50 μm). This total predicted continuum alsoincludes the warm components with non-outflowing (or slowlyoutflowing) OH, so that the good fits of the modeled continuaindicate that OH is an excellent tracer of the warm regions inULIRGs with and without outflowing gas. The close agreementwe find in most sources, however, fails in IRAS09022−3615and IRAS13120−5453, where OH65 is not detected. In mostsources, the far-IR emission at 60 μm is underpredicted,indicating the presence of cold dust unrelated to OH.The mass outflow rate and momentum and energy fluxes,
Mout, Pout, and Eout, associated with a given component dependon four parameters (Equations (11)–(13)): the size R, thecolumn density NH, the gas velocity v, and the covering factorfc. The dependence of Mout on all these parameters is shown inFigure 20 for all individual components involved in the best-fitmodels of our sample. The individual components can beclassified according to their predicted spatial extent. Compo-nents with R<350 pc are considered “compact” and are
Figure 16. Model fits to the OH65 doublets in 14 sources. Blue arrows indicate possible contamination by H2O. See also caption of Figure 13.
20
The Astrophysical Journal, 836:11 (41pp), 2017 February 10 González-Alfonso et al.

indicated with circles in Figures 20, while those withR>350 pc are considered “extended” and shown withsquares. With typical radii of ∼100 pc, all CORE componentsare compact, as well as most ENVELOPE models. The smallradii in these models are a direct consequence of the need to
match the outflowing gas observed in high-lying OH84 andOH65 doublets, which require high Tdust70 K for theassociated continuum source to pump the excited OH levels,and hence small sizes to avoid overestimating the continuumemission. Conversely, the extended components reproduce the
Table 2Physical Parameters of Individual Outflowing Components
Galaxy T V R1 R NH fc Mout Mout Pout EoutName (km s−1) (pc) (pc) (1021 cm−2) (106 Me) (Me yr−1) (1034 dyn) (1041 erg s−1)(1) (2) (3) (4) (5) (6) (7) (8) (9) (10) (11)
IRAS 03158+4227 E 800 160 270 120 0.36 420 1300 660 2700E 1200 260 400 8 0.41 75 230 170 1000
IRAS 05189–2524 E 200 77 170 120 0.21 100 120 16 16E 550 130 340 40 0.14 89 150 52 140
IRAS 08572+3915 E 500 62 110 160 0.33 88 410 130 330E 950 50 110 80 0.20 28 240 150 700
IRAS 10565+2448 E 250 340 480 10 0.51 170 88 14 17E 420 240 400 20 0.34 160 160 43 90
Mrk 231 C 100 100 160 500 0.39 730 460 29 14E 550 300 600 20 0.26 260 240 84 230E 700 74 170 120 0.18 91 380 170 590
IRAS 13120–5453 E 420 280 470 16 0.36 180 160 43 89Mrk 273 E 300 67 130 80 0.28 51 120 23 35
E 700 79 340 120 0.05 110 220 99 350IRAS 14348–1447 C 100 190 240 500 0.63 2500 1100 69 34
E 600 160 370 20 0.17 68 110 43 130E 300 180 340 80 0.27 350 310 60 90
IRAS 14378–3651 E 600 170 270 12 0.39 47 110 41 120E 250 110 240 40 0.22 71 76 12 15
IRAS 20100–4156 E 500 170 300 120 0.35 510 880 280 690E 1100 190 300 12 0.40 58 220 150 850
IRAS 20551–4250 E 300 86 160 80 0.27 83 160 30 44E 600 67 190 20 0.13 13 41 16 47
IRAS 23365+3604 C 100 70 100 500 0.46 340 340 22 11E 350 73 190 60 0.14 45 82 18 32E 470 260 450 20 0.33 190 200 59 140
Note. Columns: (1) Galaxy name. (2) Type of model. C: CORE; E: ENVELOPE. (3) Average velocity. (4) Minimum radius. (5) Adopted radius, after correcting forthe covering factor fc. (6) Hydrogen column density, adopting an abundance X(OH)=2. 5×10⁻⁶ relative to H nuclei. (7) Covering factor of the far-IR continuum bythe outflowing OH, as defined in Section 5.5. (8) Outflowing gas mass. (9) Mass outflow rate. (10) Momentum flux. (11) Energy flux.
Table 3Total Outflow Energetics Inferred from Models of OH
Galaxy Mtot (HV) Mtot (T) Mtot (HV) Mtot (T) Ptot (HV) Ptot (T) Etot (T)Name (107 Me) (107 Me) (Me yr−1) (Me yr−1) (1034 dyn) (1034 dyn) (1042 erg s−1)(1) (2) (3) (4) (5) (6) (7) (8)
IRAS 03158+4227 -+50 24
9-+50 24
120-+1500 280
340-+1500 280
830-+840 140
290-+840 140
290-+370 81
170
IRAS 05189–2524 -+19 11
27 L -+270 130
22 L -+67 29
13 L -+16 7
4
IRAS 08572+3915 -+12 8
5-+12 7
33-+650 340
230-+650 320
390-+280 110
170-+280 99
170-+100 33
100
IRAS 10565+2448 -+32 10
13-+32 10
28-+250 81
25-+250 81
150-+57 21
13-+57 20
13-+11 4
4
Mrk 231 -+35 14
1-+110 8
20-+620 260
25-+1100 150
41-+250 110
36-+280 97
38-+83 26
23
IRAS 13120–5453 -+18 4
4 L -+160 33
34 L -+43 9
9 L -+9 2
2
Mrk 273 -+16 8
2-+16 8
60-+350 150
35-+350 130
490-+120 63
10-+120 63
44-+38 26
10
IRAS 14348–1447 -+42 29
71-+290 35
97-+430 280
180-+1500 250
270-+100 63
97-+170 48
97-+25 12
32
IRAS 14378–3651 -+12 1
13 L -+180 33
180 L -+53 14
37 L -+14 5
6
IRAS 20100-4156 -+56 41
22 L -+1100 620
830 L -+430 250
620 L -+150 80
320
IRAS 20551–4250 -+10 5
11 L -+200 100
210 L -+45 21
81 L -+9 4
29
IRAS 23365+3604 -+24 13
26-+58 47
73-+280 160
260-+620 430
490-+77 43
90-+99 48
110-+18 8
45
Note. Columns: (1) Galaxy name. (2)−(3) Outflow gas mass. (4)−(5) Mass outflow rate. (6)−(7) Momentum flux. (8) Energy flux. HV refers to the values calculatedfor only the high-velocity (>200 km s−1) component(s), and the T columns include the values of the low-velocity components (only tabulated when the value or erroris different from that of the corresponding HV column). The contribution of the low-velocity components to the energy flux is negligible, and only the total value isgiven.
21
The Astrophysical Journal, 836:11 (41pp), 2017 February 10 González-Alfonso et al.

observed absorption and emission in the ground OH119 andOH79 doublets at velocities where no contribution is seen fromthe high-lying lines, with effective Tdust∼55 K.
The highest mass outflow rates ˙ M M300out yr−1 aremostly found in compact components and can exhibit both lowand high gas velocities, but they consistently show highcolumn densities (NH1023 cm−2). From Equations (11)–(13), we express
˙
˙
˙
( )
= ´ ´ ´
´
= ´ ´ ´
´
= ´ ´ ´ ´
´
-
-
-
-
-
-
⎜ ⎟
⎜ ⎟
⎛⎝
⎞⎠
⎛⎝
⎞⎠
Mf R N
v
Pf R N
v
Ef R N
v
3200.3 150 pc 10 cm
500 km s,
100.3 150 pc 10 cm
500 km s,
2.5 100.3 150 pc 10 cm
500 km s, 15
c
c
c
outH
23 2
1
out36 H
23 2
1
2
out43 H
23 2
1
3
in Me yr−1, dyn, and erg s−1, respectively. The observationalrequirement for high column densities, NOH2×1017 cm−2,comes from the absorption in the high OH84 and OH65 doublets.
Very high values of Mout are also associated with moderateexpansion velocities of the CORE components, although they areuncertain owing to the dependence on the adopted redshift. Thecomponents showing the highest momentum fluxes ( ˙ >P 10out
36
dyn; blue symbols in Figure 20) are found in IRAS03158+4227,IRAS08572+3915, Mrk231, and IRAS20100−4156 and areassociated with either high columns or extreme velocities(>1000 km s−1). In spite of their higher radii and overall highoutflow velocities, most extended components have moderate˙ <M 300out Me yr−1, because values of NOH5×1016 cm−2
are enough to account for the ground-state OH doublets.The total Mtot estimates (Figure 18) show hints of a positive
correlation with LIR. Most sources with LIR2×1012 Le have˙ ~ -M M200 yrtot
1, with Mtot increasing sharply forLIR>2×10¹² Le. We note that IRAS08572+3915 is notnecessarily an outlier, because its luminosity may be significantlyhigher than the apparent one according to the model by Efstathiouet al. (2014). Mtot appears also to be weakly correlated with LAGNand L*, the latter indicating loading factors of 1–10.With the exception of IRAS14348−1447, the low-velocity
components transport relatively low momentum in comparisonwith the high-velocity components. Starburst99 models(Leitherer et al. 1999) predict that a 40Myr old continuousstarburst can supply a maximum momentum (see also Veilleuxet al. 2005; Heckman et al. 2015) of ˙
* *~P L c3.5 (includingradiation pressure at a level of L*/c), which is marked as ashaded rectangle in Figure 18. Our inferred total momentum
Figure 17. Predictions for the continuum of the models for OH shown in Figures 13–16, compared with the observed SEDs. Blue, green, and magenta lines indicatethe continua associated with the OH components shown with the same colors in Figures 13–16, and red is total. In some sources, the continuum associated with theOH components closely matches the observed SED between 20 and 50 μm, but the continuum is usually underpredicted at longer wavelengths.
22
The Astrophysical Journal, 836:11 (41pp), 2017 February 10 González-Alfonso et al.

flux measurements are ˙*P L c3tot (Figure 18), indicating
that starbursts alone are most likely unable to drive the outflowsvia momentum-conserving winds, but may play an importantrole in some sources. The momentum supplied by the AGNmay approach ˙ ~P L c2AGN AGN (treating both radiationpressure on dust grains and AGN inner winds as LAGN/c),also below the inferred total values. Nevertheless, Figures 19(a)–(c) show the absolute values of Ptot as a function of˙ ˙*P P, AGN, and ˙ ˙
* +P PAGN, indicating a remarkable similaritybetween Ptot and the combined momentum rates supplied by thestarburst and the AGN in most galaxies. The outflows inIRAS03158+4227, IRAS08572+3915, Mrk231, andIRAS20100−4156 (Figures 19) seem to require significantmomentum boosts. These rough estimates are refined inSection 7.1, where consideration of the covering factors, theextended nature of the starburst, the potential well, and themomentum boost due to radiation trapping is made, and inwhich we show that momentum-driven winds may indeed beresponsible for some outflow components with the combinedeffect of the AGN (in most cases dominant) and the starburst.
It is estimated that supernovae and stellar winds can providea mechanical luminosity of up to ∼1.8% of the starburstluminosity (Leitherer et al. 1999; Veilleux et al. 2005; Harrisonet al. 2014), and only a fraction of the mechanical power willgo into bulk motion of the ISM (1/4 according to Weaveret al. 1977). Energy-conserving winds from the starburst arethen probably unable to drive the molecular outflows inMrk231, IRAS08572+3915, IRAS03158+4227, andIRAS20100−4156, where mechanical luminosities of >1%of L* are inferred (Figure 18). For the rest of the sources, anexpanding energy-conserving bubble generated by supernovaecould in principle account for the observed outflows, withcoupling efficiencies of ∼10%–50%. We also refine theseestimates in Section 7.2, where we find that only some low-velocity components can be driven in this way. Energy-conserving bubbles generated by AGN winds are believed to beable to supply a power of up to ∼5% of LAGN (e.g., King &Pounds 2015), from which a fraction of ∼1/2 may go into bulkmotion of the ISM (Faucher-Giguère & Quataert 2012).Figure 18 shows that the energy flux is 5% for all sources,including the strong AGNs Mrk231, IRAS08572+3915,
Figure 18. Estimated energetics of 12 out of 14 sources modeled in this paper; modeling results for IRAS09022–3615 and IRAS19297–0406 are relatively uncertainand not considered. Mtot, Ptot, and Etot are the total values defined in Equation (14) (see Section 5.5). Filled circles indicate the values obtained by ignoring the(uncertain) low-velocity (<200 km s−1) components, while open circles include them. Sources are labeled as follows: (1) IRAS03158+4227, (2) IRAS05189−2524,(3) IRAS08572+3915, (4) IRAS10565+2448, (5) Mrk231, (6) IRAS13120−5453, (7) Mrk273, (8) IRAS14348−1447, (9) IRAS14378−3651, (10)IRAS20100−4156, (11) IRAS20551−4250, (12) IRAS23365+3604. The dashed lines in the upper right panel indicate mass-loading factors of ˙h = =M SFR 2tot ,4, and 8. Shaded rectangles mark the momentum and energy rates that can be supplied by an AGN and a starburst according to several models discussed inSection 6.2.
23
The Astrophysical Journal, 836:11 (41pp), 2017 February 10 González-Alfonso et al.

IRAS03158+4227, and IRAS20100−4156, in general agree-ment with theoretical predictions. We show in Section 7.2 thatpartially energy-conserving flows driven by the AGN aregenerally required for the high-velocity components.
The most powerful outflows (Figures 19(d)–(f)) are found inIRAS03158+4227 (belonging to a widely separated pair),IRAS08572+3915 and IRAS20100−4156 (mergers withprojected separation of ≈5.5 kpc), and Mrk231 (post-merger),
Figure 19. Top: inferred total momentum fluxes (Ptot, Equation (14)) as a function of (a) the estimated momentum rate supplied by the starburst ( ˙* *~P L c3.5 ), (b)
the estimated momentum rate supplied by the AGN ( ˙ ~P L c2AGN AGN ), and (c) the sum of both. The gray diagonal lines indicate ratios of ˙ ˙* =P P 1tot ,AGN,TOTAL , 2,
and 10. Bottom: estimated total energy fluxes (Etot) as a function of (d) the starburst luminosity, (e) the AGN luminosity, and (f) the sum of both. The gray diagonallines indicate ratios ˙
* =E L 0.2tot ,AGN,TOTAL %, 1%, and 5%. Filled circles indicate the values obtained by ignoring the (uncertain) low-velocity (<200 km s−1)components, while open circles include them. Galaxies are labeled as in Figure 18.
Figure 20. Mass outflow rate, Mout, of the individual components involved in the best-fit models, shown as a function of the radius R, velocity v, column density NH,and covering factor fc. Red symbols indicate CORE components; others indicate ENVELOPE components (see Figure 12). Blue symbols indicate components withhigh ˙ > ´P 1.0 10out
36 dyn. (a) The dashed vertical line marks the value we use for the classification of compact (R<350 pc) and extended (R>350 pc)components. (b)–(d) Circles and squares indicate compact and extended components, respectively.
24
The Astrophysical Journal, 836:11 (41pp), 2017 February 10 González-Alfonso et al.

apparently unrelated to merging stage. They are mostlyassociated with high AGN luminosities (Figure 19(e)). Theyare best identified by high-velocity absorption in the high-lyingOH65 doublet and represent∼20% of all local ULIRGs observedin OH65. This suggests that stochastic and episodic strong AGNfeedback events occur throughout the merger process.
6.3. Comparison with Other Tracers
Our calibration of the energetics from OH observations isbased on (i) the reliability of the present models, and in particularof the inferred outflow sizes that are not directly observed butinferred from the OH excitation and the observed and predictedcontinuum; and (ii) our adopted OH abundance relative to Hnuclei, XOH=2.5×10⁻⁶ (GA14; GA15), which in turn isbased on both observations and chemical models. Theseassumptions are worth checking by comparing our values ofMtot, Mtot, and Ptot (Equations (14)) with the values inferred fromtotally independent measurements of CO for the five sourceswhere both OH and CO have been observed and analyzed:Mrk231, IRAS08572+3915, Mrk273, IRAS10565+2448,and IRAS23365+3604 (Cicone et al. 2012, 2014). Since COis not sensitive to low-velocity outflows, due to contamination bythe core of the line, the values we include here from OH excludethe low-velocity (<200 km s−1) components. On the other hand,we divide the values of MOF and POF in Cicone et al.(2012, 2014) by a factor of 3 to match our definitions given inEquations (11) and (12).
The outflowing masses, Mout, are compared in Figure 21(a).The agreement is within a factor of 2 in all sources exceptIRAS08572+3915, where Mout(OH) is a factor of ∼4 lowerthan Mout(CO). Since Mout(OH)∝R2 but Mout(CO) isindependent of R, the discrepancy is a consequence of thevery compact outflow (∼100 pc) inferred for OH: bothcomponents (moderate and high velocities) are very excited,with OH84 as strong as OH119, as well as absorption in OH65(Figure 7). Since the observed absorption is dominated by thehigh amounts of outflowing nuclear OH, and the source of far-IR absorption is expected to be compact, OH is not sensitive tothe more extended outflowing gas in this source. On theredshifted side of the OH spectrum, in addition, IRAS08572+3915 shows an emission feature in OH84 (and marginallyalso in OH65) at positive velocities that is not fitted (seeFigure 1) and does not appear to belong to the samecomponents we model in Figure 15. Nevertheless, the values
of Mtot and Ptot inferred from both species (Figures 21(b), (c))are similar in this source, because the flow timescale,tflow∼R/v, is correspondingly higher in CO.In all other sample sources, Mtot and Ptot are somewhat higher
for OH than for CO. The largest discrepancies are found forIRAS10565+2448 and IRAS23365+3604, where we inferhigher values by factors of ∼2 and ∼4 for OH, respectively.These discrepancies are a consequence of the extendedemission estimated in CO, R>1 kpc (Cicone et al. 2014),while we infer R∼0.4–0.5 kpc and R∼0.2–0.45 kpc for OHin IRAS10565+2448 and IRAS23365+3604, respectively.High-resolution CO observations in these sources will checkwhether there is a decrease in M with increasing distance to thecenter, as found in Mrk231 (GA14; Feruglio et al. 2015).Nevertheless, the difference in the OH and CO spatialdistributions may be real, as the maximum velocity observedin CO is lower than in OH in both sources (Figure 2).It is also interesting to compare the energetics inferred from
OH with those derived from Na I D (Rupke & Veilleux 2013a)for the four sources that have been analyzed in both species.Rupke & Veilleux (2013a) used the same expressions for themass, momentum, and energy flux as we use in this study(Equations (7), (11)–(13)). The comparisons are shown inFigure 22, where the comparable values of the outflow massesinferred from the two species is remarkable. This is surprisingbecause Mout∝R2 NH; while our inferred values of R are<1 kpc, the radii observed by Rupke & Veilleux (2013a) are2–5 kpc, but the much higher columns inferred from OHcompensate for this, thus resulting in similar total masses. Themass, momentum, and energy fluxes are then much higher forthe molecular gas.The similar outflow masses found for OH and for the more
spatially extended CO and Na I D suggest that a significantfraction of the total outflow mass is loaded at small radii (afew × 100 pc), and the outflows are less efficient in evacuatingthe gas initially located in the extended kiloparsec-scale disks.The total momentum fluxes (Ptot) inferred for ULIRGs are
compared in Figure 23 with the analogous quantities inferredby Heckman et al. (2015) from observations of UV ionizedlines in a sample of starburst galaxies. Most of the compositeULIRGs lie close to the line ˙ ˙
*=P Ptot , which is also a good fitfor a number of pure starbursts, but usually lie above it,probably due to the AGN contribution. The comparisonappears to indicate that nuclear starbursts also contribute to
Figure 21. Comparison between the total properties of the outflows, Mtot, Mtot, and Ptot, derived from OH and from CO (1–0) (Cicone et al. 2014) for the sources thathave been analyzed in both species. For OH, only the high-velocity (>200 km s−1) components are considered. The values of Mtot and Ptot in Cicone et al. (2014) havebeen divided by 3 to match our definitions in Equations (11) and (12).
25
The Astrophysical Journal, 836:11 (41pp), 2017 February 10 González-Alfonso et al.

the molecular feedback in most ULIRGs, but are not enough todrive the observed outflows alone in most sources. As acorollary, if our estimate of the relative contributions of theAGN and the starburst is sufficiently accurate, it appears thatfeedback from various combinations of the AGN and thenuclear starburst regulates the star formation and the growth ofthe SMBH in gas-rich mergers. However, the four outlierULIRGs labeled in Figure 23 appear to require very strongAGN contribution, likely in the form of energy-conservingwinds. Comparison of the inferred molecular outflow propertieswith those of the ionized outflow phase in starburst galaxies(Heckman et al. 2015) is further explored in Appendix B.
Overall, the comparison of the energetics inferred from OHand CO, especially the mass outflow rate and the momentumflux, and the comparison between the observed SEDs and themodel predictions in Figure 17 are satisfactory. We now pushonward to the analysis of the molecular outflows byconsidering the individual components of our fits in the nextsection, as different components in a given source havedifferent associated energetics.
7. Discussion
In our initial analysis of the momentum deposition ratessupplied by the AGN and the starburst in Section 6.2(Figure 19), we ignore the clumpiness of the molecularoutflows, the momentum boost due to trapping of infraredradiation, and the finite extension of the starbursts, as well asthe gravitational potential well in the central regions of thegalaxies. We attempt to overcome these limitations with asimple model that accounts for these aspects, in the frameworkof momentum-driven and energy-driven outflows.
7.1. Momentum-driven Outflows
We attempt to evaluate the impact of radiation pressure ondust grains from both the AGN and the compact, but not point-like, central starburst, as well as the role of momentumdeposition by the AGN winds, stellar winds, and supernovae inlaunching the molecular outflows, using a simple analyticalmodel of momentum-driven flows based on recent work in theliterature (Heckman et al. 2015; Ishibashi & Fabian 2015;Murray et al. 2005; Thompson et al. 2015). As pointed out byStern et al. (2016), the observed momentum fluxes are theresult of the time-averaged forces acting on the outflowing gas.It is therefore necessary to integrate the equation of motionbeginning from the time that the outflowing shell is close to theenergy source (and presumably covering a large fraction of the4π sr), taking into account the change of the covering factorwith increasing radius. The dynamics of the gas are given by
˙ ( ) ˙ ( ) ( )*= - + +dP
dt
M v
rP r P r , 16mod out cir
2
AGN
where Pmod is the (modeled) momentum of the outflow, andvcir is the “circular” velocity characterizing the potential well ofan isothermal sphere (Heckman et al. 2015). We follow theapproach of Murray et al. (2005) and use s=v 2cir
2 2 for thesources where σ, the stellar velocity dispersion tabulated inDasyra et al. (2006) and Genzel et al. (2001), is available.Mrk231 has an unusually low value of σ (Tacconi et al. 2002),and we adopt vcir=240 km s−1 to account for the dynamicalmass of 6.7×10⁹ Me within r=500 pc (Davies et al. 2004).For the rest of the sources we adopt vcir=205, 150, 220, and260 km s−1 in IRAS08572+3915, IRAS10565+2448,IRAS03158+4227, and IRAS20100−4156, respectively,based on our fits to the OH65 doublet, and vcir=226 km s−1
in IRAS13120−5453 based on recent molecular observations
Figure 22. Comparison between the properties of the outflows, Mtot, Mtot, Ptot, and Etot, derived from OH and from Na I D (Rupke & Veilleux 2013a) for the sourcesthat have been analyzed in both species. For OH, only the high-velocity (>200 km s−1) components are considered.
Figure 23. Total momentum fluxes (Ptot) of ULIRGs (red symbols, inferredfrom OH) and of starburst galaxies (black symbols, inferred from ionized UVlines in Heckman et al. 2015) plotted as a function of the momentum ratesupplied by the starburst ( ˙
* *= ´P L c3.5 ). The blue line indicates equalvalues in both axes.
26
The Astrophysical Journal, 836:11 (41pp), 2017 February 10 González-Alfonso et al.

with ALMA (Privon et al. 2016). Our vcir values are notcorrected for rotation and flattening and are thus lower limits;nevertheless, the high Mout values in the nuclear regions ofULIRGs (Table 2) suggest gas that is emanating from therotating structures where the bulk of the nuclear gas mass isstored, with significant rotational support.
˙ ( )*P r and ˙ ( )P rAGN are the rates of momentum depositiononto the ISM at radial position r due to the starburst and theAGN, respectively. For the starburst,
˙ ( ) ( ) ( ) ( ) ( )* **t t= + +P r f r
L r
c1 , 17cIR ,w
,encl
where τIR is the infrared opacity of the outflowing shell andaccounts for the momentum boost due to absorption of re-radiatedIR emission (Thompson et al. 2015). Although τIR is expected tovary with r, we avoid overestimating its effect (see Rothet al. 2012) by simply taking a characteristic constant value ofμmHkIRNH, where an absorption-mass coefficient of kIR=5cm2 g−1 of gas is adopted (Ishibashi & Fabian 2015; Thompsonet al. 2015). *t ,w describes the contribution of stellar winds andsupernova remnants, for which we adopt *t = 2.5,w based onStarburst99 (Leitherer et al. 1999; Veilleux et al. 2005; Heckmanet al. 2015). fc(r) is the covering factor of the starburst feedback bythe outflowing OH, for which we adopt two approaches: (i) Thefirst is a “mixed” shell-cloud approach, in which a shell withfc=1 is used for r�R1 (see Equation (6)), while ( )=f R rc 1
2
for r>R1 owing to shell breakup and geometrical dilution of thecloud ensemble. We thus neglect here the expansion of cloudsincluded in Thompson et al. (2015) because the high-densitymolecular tracers HCN and HCO+ are detected in the outflow ofMrk231 at large distances from the center (Aaltoet al. 2012, 2015; Lindberg et al. 2016). (ii) An “aligned-momenta” approach is also considered in which fc=1 at all radii,reflecting the possibility that the AGN and starburst momenta arepreferentially released in the same directions as the clumpy,outflowing OH. ( )*L r,encl is the starburst luminosity enclosedwithin radius r. While in Mrk231 Davies et al. (2004) fitted thespatial distribution of the nuclear starburst intensity with anexponential ( ) { }= -I r I r rexp d0 , where rd=150–200 pc, wehave approximated the corresponding enclosed luminosity as alinear function of r,
( ) ( )* * =L rr
rL r r
3, 3 , 18
dd,encl
where L* is the total starburst luminosity, and applied thisexpression to all galaxies with rd=150 pc. We thus assume avery compact starburst to avoid underestimating its momentumdeposition.16 Since in Equation (16) we also neglect the inwardforce exerted by the stars formed outside r, the role of thenuclear starburst in launching the outflows is most likely notunderestimated.
The momentum deposition due to AGN feedback isdescribed as
˙ ( ) ( ) ( ) ( )t t= + +P r f rL
c1 , 19cAGN IR AGN,w
AGN
with t = 1AGN,w (e.g., Zubovas & King 2012). We implicitlyassume that, after being scattered by electrons in a Compton-thickmedium, most photons peak in the UV and are absorbed by dust,thus contributing at least twice (for fc=1) to the momentumdeposition onto the ISM. Comparison of this simple momentum-driven model with observations enables us to evaluate the role ofenergy-driven flows (e.g., DeBuhr et al. 2012; Faucher-Giguère &Quataert 2012; Zubovas & King 2012; Feruglio et al. 2015;Tombesi et al. 2015; Stern et al. 2016) in the OH outflows, whichis considered below in Section 7.2.In the following we ignore different terms in Equations (17)
and (19) to isolate the relative roles of radiation pressure ondust grains and winds. The equation of motion is thenintegrated from the “launching” radius (R0; see below) to the“observed” radius (R, Table 2), by assuming a constantoutflowing gas mass, so that the first member in Equation (16)is M dv dr0.5 out
2 . By defining the modeled momentum flux inthe same way as for the observations, i.e., ˙ =P M v Rmod out
2
(Equation (12)), the model predictions can be directlycompared with our values for the observed momentum ratesinferred for the individual components, Pout (Section 5.5,Table 2). We also rely on the AGN fractions (αAGN=LAGN/Lbol; Table 1) given in Veilleux et al. (2013), some of thembeing uncertain owing to high extinction even at far-IRwavelengths (GA15).
7.1.1. Can Radiation Pressure on Dust Grains Drive the Outflows?
First, we ignore the terms proportional to *t ,w and tAGN,w inEquations (17) and (19), thus taking into account only radiationpressure from both the AGN and the starburst. By alsoneglecting the gravitational term (superscript NG) and assum-ing that the outflow is launched at very small radii (takingR0=0), a strong upper limit is found for the momentum fluxthat can be attained as a result of radiation pressure in the shell-cloud approach:
˙ ( ) ˙ ( )
˙ ( ) ( )
*= +
+ -⎜ ⎟
⎡⎣⎢
⎛⎝⎜
⎞⎠⎟
⎤⎦⎥
⎛⎝
⎞⎠
P RR
RP R
R
R
R
RP R
R
R
1 2 ln
22 , 20
mod,RPNG 1
11
1AGN 1
1
where ˙ ( ) ( ) ( )* *t= +P R L R cr1 3 d1 IR 1 and ˙ ( ) (= +P R 1AGN 1
)t L cIR AGN only include the radiative terms. We compare inFigure 24(a) the observed momentum fluxes Pout with the strongupper limits of Equation (20), showing that the observed valuesare above the limiting values for most high-velocity components.By now including the gravitational term, we obtain the critical
momentum flux ˙ ( ) =P r M v rcrit out cir2 that must be overcome at
some position r by ˙ ( ) ˙ ( )* +P r P rAGN in order to allow theoutflow launching to proceed (Heckman et al. 2015; Thompsonet al. 2015). In the shell-cloud approach, this condition should bemet at least at r=R1, where ( ˙ ( ) ˙ ( )) ˙ ( )* +P r P r P rAGN crit ishighest, and thus we compare in Figure 24(b) ˙ ( ) ºP RRP 1˙ ( ) ˙ ( )* +P R P R1 AGN 1 and ˙ ( )P Rcrit 1 . Interestingly, both values arefound to be similar in most sources within the uncertainties,indicating that, together with rotation, radiation pressure(dominated by the AGN in most cases) is able to support thestructures against gravity, particularly in the direction of therotation axis (see also Murray et al. 2005; GA15). This support isfurther explored in Appendix C.
16 The implied stellar luminosity-to-mass ratio within 3rd is ( ) ( )* * =L r M r,encl ,encl( )*G L r v3 d cir
2 , which gives 240 Le/Me for L*=1012 Le and vcir=200 km s−1.
27
The Astrophysical Journal, 836:11 (41pp), 2017 February 10 González-Alfonso et al.

For the model components that satisfy ˙ ( ) ˙ ( )>P R P RRP 1 crit 1 ,we calculate the expected momentum flux at the observedposition R:
˙ ( ) ˙ ( )
˙ ( )
˙ ( ) ( )
*
=-
+ - +
+ - -
⎡⎣⎢⎢
⎛⎝⎜
⎞⎠⎟
⎤⎦⎥⎥
⎡⎣⎢
⎤⎦⎥
P RR
RP R
R
R
R
RP R
R
R
R
R
R
RP R
R
R
R
R
2ln
1 2 ln
22 , 21
mod,RP1
crit 10
11
0
1
2
1
1AGN 1
0
1
1
where R0 is the launching radius ( ˙ ( ) ˙ ( )=P R P RRP 0 crit 0 ). Theresulting values are compared with the observed momentumrates in Figure 24(c), showing that no outflowing componentcan be explained with this model. We conclude that radiation
pressure alone can provide (partial) support against gravitationin the vertical direction (see also Thompson et al. 2005), butcan hardly drive the observed outflows.
7.1.2. Inclusion of Winds
We now include the terms proportional to *t ,w and tAGN,w inEquations (17) and (19) and follow the same three steps as inSection 7.1.1. In the shell-cloud approach, the relevantequations have the same forms as Equations (20) and (21).Ignoring the gravitational term, Figure 25(a) shows that theobserved momentum fluxes are mostly lower than or similar tothe predictions. This scenario may describe gas that isrotationally supported and radially pushed, flowing close tothe equatorial plane of the disk. Because of this extra support,molecular outflows coplanar with the disk can be roughly
Figure 24. Evaluation of the possibility that radiation pressure from the AGN and the starburst can drive the observed molecular outflows with the shell-cloudapproach (Section 7.1.1). Circles and triangles indicate components with τIR�0.5 and <0.5, respectively, thus distinguishing components with significantmomentum boost owing to radiation trapping. (a) Ratio of the observed momentum rates for the individual components, Pout, and the values predicted byEquation (20), which ignores the effect of the potential well. (b) Ratio of the rates of momentum deposition due to radiation pressure, PRP, to the critical momentumflux Pcrit that needs to be overcome in order to launch the outflow. Both values are evaluated at position R1, where the ratio is expected to be maximum. (c) Ratio of theobserved momentum rates to the values predicted by Equation (21) that include the gravitational term (only those components that satisfy ˙ ( ) ˙ ( )>P R P RRP 1 crit 1 havesolutions). Galaxies are labeled as in Figure 18.
Figure 25. Evaluation of the possibility that momentum-driven winds and radiation pressure from the AGN and the starburst can drive the observed molecularoutflows with the shell-cloud approach (Section 7.1.2). Circles and triangles indicate components with τIR�0.5 and <0.5, respectively, thus indicating thecomponents with significant momentum boost due to radiation trapping. (a) Ratio of the observed momentum rates for the individual components, Pout, and thepredicted values when the potential well is ignored. (b) Ratio of the rates of momentum deposition due to radiation pressure and winds, PT, and the critical momentumflux Pcrit that must be overcome in order to launch the outflow. Both values are evaluated at position R1, where the ratio is expected to be maximum. (c) Ratio of theobserved momentum rates and the values predicted by including the gravitational term (only those components that satisfy ˙ ( ) ˙ ( )>P R P RT 1 crit 1 have solutions). Galaxiesare labeled as in Figure 18.
28
The Astrophysical Journal, 836:11 (41pp), 2017 February 10 González-Alfonso et al.
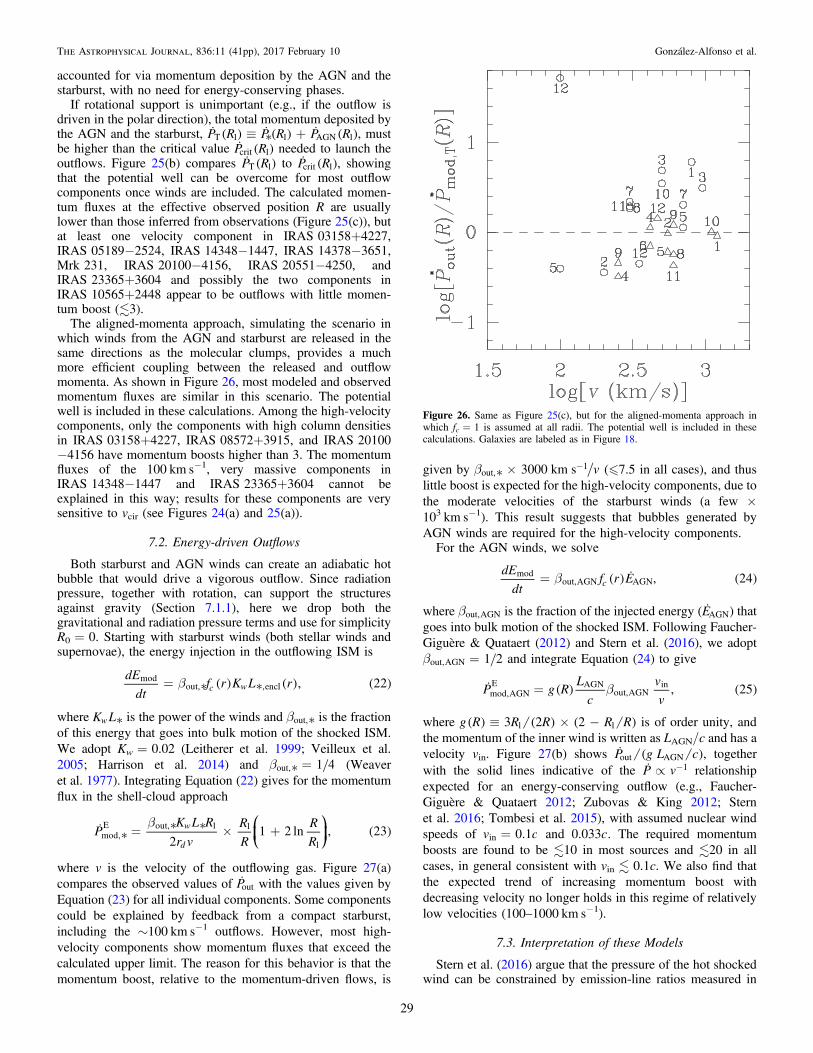
accounted for via momentum deposition by the AGN and thestarburst, with no need for energy-conserving phases.
If rotational support is unimportant (e.g., if the outflow isdriven in the polar direction), the total momentum deposited bythe AGN and the starburst, ˙ ( ) ˙ ( ) ˙ ( )*º +P R P R P RT 1 1 AGN 1 , mustbe higher than the critical value ˙ ( )P Rcrit 1 needed to launch theoutflows. Figure 25(b) compares ˙ ( )P RT 1 to ˙ ( )P Rcrit 1 , showingthat the potential well can be overcome for most outflowcomponents once winds are included. The calculated momen-tum fluxes at the effective observed position R are usuallylower than those inferred from observations (Figure 25(c)), butat least one velocity component in IRAS03158+4227,IRAS05189−2524, IRAS14348−1447, IRAS14378−3651,Mrk231, IRAS20100−4156, IRAS20551−4250, andIRAS23365+3604 and possibly the two components inIRAS10565+2448 appear to be outflows with little momen-tum boost (3).
The aligned-momenta approach, simulating the scenario inwhich winds from the AGN and starburst are released in thesame directions as the molecular clumps, provides a muchmore efficient coupling between the released and outflowmomenta. As shown in Figure 26, most modeled and observedmomentum fluxes are similar in this scenario. The potentialwell is included in these calculations. Among the high-velocitycomponents, only the components with high column densitiesin IRAS03158+4227, IRAS08572+3915, and IRAS20100−4156 have momentum boosts higher than 3. The momentumfluxes of the 100 km s−1, very massive components inIRAS14348−1447 and IRAS23365+3604 cannot beexplained in this way; results for these components are verysensitive to vcir (see Figures 24(a) and 25(a)).
7.2. Energy-driven Outflows
Both starburst and AGN winds can create an adiabatic hotbubble that would drive a vigorous outflow. Since radiationpressure, together with rotation, can support the structuresagainst gravity (Section 7.1.1), here we drop both thegravitational and radiation pressure terms and use for simplicityR0=0. Starting with starburst winds (both stellar winds andsupernovae), the energy injection in the outflowing ISM is
( ) ( ) ( )* *b=dE
dtf r K L r , 22c w
modout, ,encl
where *K Lw is the power of the winds and *bout, is the fractionof this energy that goes into bulk motion of the shocked ISM.We adopt Kw=0.02 (Leitherer et al. 1999; Veilleux et al.2005; Harrison et al. 2014) and *b = 1 4out, (Weaveret al. 1977). Integrating Equation (22) gives for the momentumflux in the shell-cloud approach
˙ ( )** *b
= ´ +⎛⎝⎜
⎞⎠⎟P
K L R
r v
R
R
R
R21 2 ln , 23w
dmod,E out, 1 1
1
where v is the velocity of the outflowing gas. Figure 27(a)compares the observed values of Pout with the values given byEquation (23) for all individual components. Some componentscould be explained by feedback from a compact starburst,including the ∼100 km s−1 outflows. However, most high-velocity components show momentum fluxes that exceed thecalculated upper limit. The reason for this behavior is that themomentum boost, relative to the momentum-driven flows, is
given by *b ´ - v3000 km sout,1 (�7.5 in all cases), and thus
little boost is expected for the high-velocity components, due tothe moderate velocities of the starburst winds (a few ×103 km s−1). This result suggests that bubbles generated byAGN winds are required for the high-velocity components.For the AGN winds, we solve
( ) ˙ ( )b=dE
dtf r E , 24c
modout,AGN AGN
where bout,AGN is the fraction of the injected energy (EAGN) thatgoes into bulk motion of the shocked ISM. Following Faucher-Giguère & Quataert (2012) and Stern et al. (2016), we adoptb = 1 2out,AGN and integrate Equation (24) to give
˙ ( ) ( )b=P g RL
c
v
v, 25mod,AGN
E AGNout,AGN
in
where ( ) ( ) ( )º ´ -g R R R R R3 2 21 1 is of order unity, andthe momentum of the inner wind is written as LAGN/c and has avelocity vin. Figure 27(b) shows ˙ ( )P g L cout AGN , togetherwith the solid lines indicative of the ˙ µ -P v 1 relationshipexpected for an energy-conserving outflow (e.g., Faucher-Giguère & Quataert 2012; Zubovas & King 2012; Sternet al. 2016; Tombesi et al. 2015), with assumed nuclear windspeeds of =v c0.1in and c0.033 . The required momentumboosts are found to be 10 in most sources and 20 in allcases, in general consistent with vin0.1c. We also find thatthe expected trend of increasing momentum boost withdecreasing velocity no longer holds in this regime of relativelylow velocities (100–1000 km s−1).
7.3. Interpretation of these Models
Stern et al. (2016) argue that the pressure of the hot shockedwind can be constrained by emission-line ratios measured in
Figure 26. Same as Figure 25(c), but for the aligned-momenta approach inwhich fc=1 is assumed at all radii. The potential well is included in thesecalculations. Galaxies are labeled as in Figure 18.
29
The Astrophysical Journal, 836:11 (41pp), 2017 February 10 González-Alfonso et al.

the colder line-emitting gas. They showed that in quasarsradiation pressure is probably dominating at all scales, with anupper limit Phot/Prad�6 for the spatial domain we samplewith OH. Stern et al. (2016) also indicated that high momentumboosts could only be obtained in buried quasars where theshocked wind was tightly confined, and the high momentumboosts reported for quasars in the literature could thus only beobtained early in their evolution, during the buried stage. Thisconclusion is consistent with Zubovas & Nayakshin (2014),who found that an energy-conserving bubble with escapechannels for the hot gas cools adiabatically and hence is lessefficient in driving the ISM, leading to small momentum booststhat approach the momentum-conserving scenario.
GA15 argued that OH65 is an excellent tool to probe thisburied stage. All sources in the present sample exceptIRAS09022−3615, IRAS13120−5453, and IRAS10565+2448 show strong OH65 features. Figure 4 shows that thehighest OH velocities are indeed found in sources with strongOH65 features, consistent with the model described byZubovas & Nayakshin (2014) and Stern et al. (2016). However,some sources with very strong OH65 absorption only showlow-velocity outflows, or even lack evidence of outflows(region III in Figure 4), suggesting that they are still in an earlystage of this process, and the columns around some extremelyobscured sources are so high that they cannot (yet) beaccelerated to high velocities and dispersed. Therefore, perhapsit is not surprising that high-velocity molecular outflows arefound in moderately (but not extremely) obscured sources, inwhich the shocked wind is moderately confined but finds pathswith columns 1023 cm−2 that can be efficiently accelerated.Once these paths are found and the wind emerges, its pressurewill decrease and moderate momentum boosts are expected, asfound here in most ULIRGs.
Our results for the momentum boost are, however, sensitiveto the way in which the gravitational potential well and thegeometrical dilution of the outflowing gas are treated(Figures 25(a), (c) and 26). If the AGN and starburst windsare not isotropic but restricted to the solid angles of theoutflowing OH (the aligned momentum approach discussed inSection 7.1.2.), no geometrical loss of momentum is expectedand most outflows approach the momentum-conservingscenario. On the other hand, rotationally supported structures(i.e., ignoring the potential well; Section 7.1.2) are obviouslymore easily launched and accelerated, and a momentum-conserving approach would be enough to account for most ofthe inferred momenta (Figure 25(a)). However, this onlyapplies to the outflow components that are launched close tothe equatorial plane of the nuclear disk or torus around theAGN. Because we require high columns to account for themolecular outflows, which are observed against strong sourcesof far-IR radiation (and hence against regions with highcolumns), at least some low-velocity components can indeed beassociated with “equatorial” flows. This may not be the case formost high-velocity components, as recent CO interferometricobservations show that the high-velocity gas is not coplanarwith the rotating disk in NGC1614 and IRAS17208−0014(García-Burillo et al. 2015) and in Mrk231 (Feruglio et al.2015). Nevertheless, the OH outflows are wide-angle, and thepossibility that some low-velocity components flow close to theequatorial plane in a momentum-driven phase is againconsistent with the theoretical approach by Zubovas &Nayakshin (2014), who found that in the directions of higherresistance, the ISM is mainly affected by the incidentmomentum of the inner outflow, while the outflow energytends to escape along leaky paths. This makes the deposition ofAGN energy in the ISM (feedback) less efficient, potentiallyexplaining the large masses that SMBHs attain and, likewise,
Figure 27. Predictions for energy-driven outflows, which use a shell-cloud approach and assume that gravity and radiation pressure balance and thus are both ignored(Section 7.2). (a) Ratio of the observed momentum rates for the individual components, Pout, and the predicted maximum values for starburst winds (Equation (23)).(b) Ratio of the observed momentum rates and gLAGN/c, where g is of order unity (Equation (25)). In energy-driven flows, this ratio is expected to be b v vout,AGN in ,where vin is the velocity of the inner AGN wind and bout,AGN is the fraction of the injected energy that goes into bulk motion of the ISM gas. The two solid lines showthe expected relationship for =v c0.1in and c0.033 , with b = 1 2out,AGN . Filled symbols indicate components that, within a factor of 3, can be explained neitherthrough momentum driven by the starburst and AGN nor through energy driven by the starburst, and thus require an energy-conserving phase driven by the AGN.Galaxies are labeled as in Figure 18.
30
The Astrophysical Journal, 836:11 (41pp), 2017 February 10 González-Alfonso et al.

the MBH–σ relation (Zubovas & Nayakshin 2014; King &Pounds 2015).
In some ULIRGs, energy-conserving phases with momen-tum boosts in the range of ∼3–20 are most likely required toexplain some outflowing components (Figures 25(c), 26, and27(b)). The corresponding sources are IRAS03158+4227,IRAS08572+3915, IRAS20100−4156, and possiblyMrk231 and Mrk273, although the momentum boost in the
last two objects is small if fc=1 is assumed (Figure 26). Mostof these galaxies have strong absorption in OH65 at blueshiftedvelocities. Our model for Mrk273, however, is relativelyuncertain because of the weakness of the high-velocity(∼700 km s−1) spectral feature in OH119, OH79, and OH84,which suggests a jet-driven collimated outflow with energeticsunrelated to the source luminosity. Momentum boosts of<20 are lower than the values obtained in theoreticalapproaches to energy-conserving outflows for an inner windvelocity of =v c0.1in (e.g., Faucher-Giguère & Quataert 2012;King & Pounds 2015). Since this may be indicative of onlypartial covering and confinement of the hot shocked gas (Sternet al. 2016) even in optically thick ULIRGs, we denote thisscenario as “partially energy-conserving outflows.”
7.4. Depletion Time and Flow Timescales
Figure 28(a) shows the depletion timescales (tdep) calculatedfrom the ratios of total molecular gas masses (MH2) to total mass-loss rates Mtot. The ratios lie mostly between 107 and 108 yr,except in the powerful IRAS03158+4227, IRAS08572+3915,and IRAS20100−4156. These timescales are significantlyshorter than the gas consumption timescales due to starformation (tcon; asterisks in Figure 28(a); see also Evans et al.2002), and they are much shorter than the strangulationtimescales of local galaxies (Peng et al. 2015). The values ofMH2 used to estimate both tdep and tcon, as inferred in most casesfrom simple scaling values of CO (1–0) luminosities (GA15),should be considered with caution because the fraction of the COpopulation in the lowest rotational levels is tiny; values of themass-to-CO luminosity ratio a factor of ∼2 higher are notexcluded (Solomon et al. 1997). In addition, the mass stored inthe neutral (atomic) and ionized gas components is not taken intoaccount. The gas masses may be some factor higher thanmeasured in CO, but an upper limit of tdep108 yr can beestablished within uncertainties. The tcon/tdep=1.1–15 ratio is,however, independent of gas mass and indicates that theoutflows mainly limit the amount of gas that will be convertedinto stars, i.e., the outflows are mainly responsible for thequenching of star formation. The flow timescales, defined as thetime required for the outflows to arrive at the current (inferred)
Figure 28. (a) Outflow depletion time (filled circles) calculated from the totalmolecular mass (MH2) of the galaxy and the total values of the mass outflowrates, ˙=t M Mdep H2 tot. Most MH2 values have been inferred from the CO (1–0)emission, (with references in GA15 and A. Gowardhan et al. 2016, inpreparation); in the case of IRAS13120−5453, MH2=7.5×10⁹ Me in thecentral 1 kpc diameter region is estimated from the continuum associated withthe H2O submillimeter emission (Privon et al. 2016). The values of Mtot
(Equation (14)) only include the high-velocity components (>200 km s−1).Asterisks show the gas consumption timescales, MH2/SFR, where
( ) ( ) *=- -M L LSFR yr 101 10 . (b) Flowing times for the individual outflowingcomponents, calculated as tflow=r/v. Open and filled squares indicate low-velocity (<300 km s−1) and high-velocity (>300 km s−1) components,respectively. (c) Fraction of the total molecular gas of the galaxy involved inthe observed outflows. Open (filled) squares include (do not include) low-velocity (<200 km s−1) components. Error bars in panels (a) and (c) onlyinclude uncertainties in Mtot and Mtot, respectively.
Figure 29. Flow times for the individual outflow components (see Figure 28)as a function of the equivalent width of the OH65 doublet (between −200 and+200 km s−1; GA15). Open and filled squares indicate low-velocity(<300 km s−1) and high-velocity (>300 km s−1) components, respectively.Recent outflow events are found in active sources as diagnosed by theabsorption in the high-lying OH65 doublet.
31
The Astrophysical Journal, 836:11 (41pp), 2017 February 10 González-Alfonso et al.

radial position, are shown in Figure 28(b) for the individualcomponents, indicating that they are much shorter than tdep.Some low-velocity components (<300 km s−1; open symbols)have tflow comparable to that of the high-velocity components inthe same source, suggesting that they may be a consequence ofthe same AGN “event.” The fraction of the total molecular masscarried by the high-velocity outflows (Figure 28(c)) is 10%, sothat the current “cycle” would have to be repeated a dozen timesto deplete the galaxy’s molecular gas. We show in Figure 29,however, that sources with weak absorption in OH65 havetflow1Myr, while shorter tflow are only found in sources withstrong absorption in OH65, i.e., the regions that are expected torepresent the most buried and active stage of nuclear starburst–AGN coevolution (GA15). The two sources with weak OH65absorption, IRAS13120−5453 and IRAS10565+2448 (seealso Figure 4), show outflowing signatures that may be a vestigeof past strong nuclear activity, which has subsided over time as aresult of the outflowing activity. This suggests that the molecularoutflows are efficient at evacuating the nuclear regions ofULIRGs, but less efficient at expelling the gas located at largerdistances.
7.5. Negative Feedback: The Relative Rolesof the AGN and the Starburst
The outflow depletion timescale is plotted as a function ofLIR, LAGN, and L* in Figure 30. Since tdep is sensitive to boththe cumulative effect (the MH2 reservoir decreases as themolecular gas is expelled) and the present effect (through Mtot)of the negative feedback, Figure 30 allows us to check therelative roles of the AGN and the starburst in quenching thestar formation in the sources. The middle and right panelsindicate that tdep is better correlated with LAGN than with L*,indicating that the AGN is primarily responsible for the shorttdep107 yr found in IRAS08572+3915, IRAS03158+4227, IRAS20100−4156, Mrk231, IRAS05189−2524,and most probably Mrk273. The tdep−LAGN correlation wouldbe even tighter if IRAS08572+3915 had an AGN luminositywell in excess of 1012 Le, as was argued by Efstathiou et al.
(2014). The LAGN threshold for AGN-dominated feedback,∼1012 Le, is similar to that found by Veilleux et al. (2013),1011.8 Le, from the analysis of the outflow velocities inferredfrom the OH119 doublet in a larger sample of (U)LIRGs.For the rest of the sources, the starburst may have a
significant role in the observed feedback, but the relative rolesof the AGN and the starburst are more uncertain. According tothe models developed in Sections 7.1 and 7.2, and taking atface value the αAGN values in Table 1, the AGN appears todominate in IRAS20551−4250 and IRAS23365+3604, andthe starburst may have a comparable contribution inIRAS10565+2448 and a dominant role in IRAS13120−5453, IRAS14348−1447, and IRAS14378−3651. How-ever, the main caveats for these assignments are as follows: (i)the extended outflow components may be the relic of an epochwhen the AGN was very active, but has since subsided; (ii)LAGN may be underestimated in sources with strong OH65absorption, as in IRAS14348−1447; (iii) the presence of high-velocity wings in the OH119 doublet in all these sources (withvelocities approaching or exceeding 800 km s−1; see Figure 13)may be difficult to explain through supernova explosions(Martizzi et al. 2016), perhaps indicating the dominance of theAGN in driving at least this extremely high velocitymolecular gas.
8. Conclusions
8.1. Observational Results
The main observational results of our analysis of the lineintensities and profiles of four OH doublets (at 119, 79, 84, and65 μm) in a sample of 14 (U)LIRGs observed with Herschel/PACS are as follows:
1. In ULIRGs in which a P Cygni profile or a high-velocityblueshifted absorption wing is detected in the ground-state OH119 transition, we confirm that the moreoptically thin OH79 transition also shows clear indicationof outflowing gas in its line shape, though at lowervelocities (see also Sturm et al. 2011).
Figure 30. Depletion timescales (Figure 28(a)) as a function of LIR, LAGN, and L*. The source with tdep∼2×10⁶ yr is IRAS08572+3915, for which LAGN (and henceLIR) is probably underestimated (Efstathiou et al. 2014). The best anticorrelation is found between tdep and LAGN (correlation coefficient of −0.59, and −0.74 ifIRAS 08572+3915 is excluded), indicating that the feedback from the AGN dominates the quenching of star formation at least for LAGN1012 Le.
32
The Astrophysical Journal, 836:11 (41pp), 2017 February 10 González-Alfonso et al.

2. OH119 is optically thick even in the line wings, and itsstrength provides a measure of the covering factor of the119 μm continuum by the outflowing OH. The overallcovering factor ranges from 0.1 to >0.5 (Section 4.3).
3. The highest outflowing velocities arise in sources withstrong absorption in the high-lying OH65 doublet atcentral velocities (Section 4.4), indicating that the buriednuclear regions of ULIRGs are most efficient inlaunching and accelerating the molecular outflows.
4. From the velocity shifts observed in OH65 and theircorrespondence with those of OH79, we find evidence forlow-velocity expansion of the nuclear regions in severalULIRGs, mostly in those sources that also present PCygni line shapes in OH119. The peak absorptionvelocity in the high-lying lines is usually closer tosystemic than in the ground-state OH119 and OH79doublets (Section 4.5), indicating increasing columndensities for lower outflow velocities.
5. Spatially compact and extended outflows are bestdistinguished by the OH84/OH119 ratio at blueshiftedvelocities (Section 4.7).
8.2. Modeling Results
We have modeled the observed OH doublet profiles in 14ULIRGs through χ2 minimization of combinations of single-component models (Section 5.1). The models yield satisfactoryfits to the observed OH doublets in 12 sources, while closelymatching the observed SEDs in the transition from mid- to far-IR wavelengths (25–50 μm; Figures 13–17). The modelsenable us to estimate the energetics associated with theindividual components and with each source globally(Section 5.5).
1. Excluding the low-velocity (∼100 km s−1) components,the total mass outflow rates range from ∼150 to∼1500Me yr−1 (Table 3), the mass-loading factors are1.5–8 (Figure 18), the momentum fluxes are(2–20)×LIR/c, and the energy fluxes are (0.1–3)% ofLIR. The corresponding momentum boosts are <10 if themomentum rates due to radiation pressure, winds, andsupernovae supplied by the AGN ( L c2 AGN ) and thestarburst ( *L c3.5 ) are combined (Section 6.2, Figure 19).These values may be significantly higher in some sources(e.g., IRAS 14348−1447, IRAS 23365+3604, Mrk 231)if the low-velocity components are included.
2. The most powerful outflows, with energy fluxes of∼1010.5–1011 Le (Figure 19(f)), are found in IRAS03158+4227 (belonging to a widely separated pair),IRAS08572+3915 and IRAS20100−4156 (mergerswith projected separation of ≈5.5 kpc), and Mrk231(post-merger), apparently uncorrelated with the mergingstage. They are best identified by high-velocity absorp-tion in the high-lying OH65 doublet and represent ∼20%of all local ULIRGs observed in OH65. This suggestsstochastic episodic strong AGN feedback events through-out the ULIRG phase of the merging process.
3. Overall, the energetics inferred from OH are consistentwith those derived from CO. The similar outflow massesfound for OH and for the more spatially extended CO andNa I suggest that a significant fraction of the total outflowmass is loaded at small radii (a few × 100 pc), and the
outflows are less efficient at evacuating the gas initiallylocated in the extended kiloparsec-scale disks.
4. We use a simple analytical model for momentum-drivenflows to check whether radiation pressure due to the AGNand starburst and momentum-conserving winds canaccount for the observed OH outflows (Section 7.1).Our primary adopted geometry is a combination of a shellfor small radii and a collection of clouds at larger radiiwith decreasing covering factor relative to the releasedmomenta, but we also check the results obtained with nogeometrical loss of input momentum. The model alsoroughly simulates the extended nature of the starburstsand the momentum boost due to radiation trapping. Wefind that radiation pressure may partially support the gasagainst gravity (Section 7.1.1 and Appendix C), but isunable to drive the outflows. Inclusion of momentum-conserving winds (Section 7.1.2) could explain some ofthe outflowing components, in particular if the gravita-tional potential well is assumed to be balanced by rotationor the input momentum is not geometrically lost.However, partially energy-conserving phases are mostlikely required for some high-velocity components withhigh columns (IRAS 03158+4227, IRAS 08572+3915,IRAS 20100−4156, and possibly Mrk 231).
5. Energy-conserving flows are treated separately for thestarburst and AGN (Section 7.2). Using limiting valuesfor feedback from a nuclear starburst, some low-velocitycomponents can be accounted for. Winds from the AGNwith energy-conserving phases are required to explainsome of the highest-velocity OH outflows, with momen-tum boosts relative to LAGN/c that, for the individualcomponents, do not exceed a factor of ∼20 and aremostly 10. These values are mostly lower than themaximum momentum boosts predicted by theoreticalmodels for energy-driven outflows. For the<1000 km s−1 outflows probed by OH, the momentumflux carried by the highest-velocity components is usuallyhigher than that carried by lower-velocity components.Our results indicate that energy-driven and momentum-driven outflows may coexist in the same sources.
6. Depletion timescales generally lie between 107 and108 yr, except in the cases of IRAS03158+4227,IRAS08572+3915, and IRAS20100−4156, where tdepis somewhat shorter (Figure 28). These estimates arecomparable to but significantly shorter than the gasconsumption timescales. The flow timescales (∼R/v ) aremuch shorter, ∼105–106 yr, and also favor recent orongoing nuclear outflow activity in highly excited andburied sources as probed by the absorption in the high-lying OH65 doublet.
7. We find an anticorrelation between tdep and LAGN,indicating that the AGN is primarily responsible for theshort tdep107 yr found in IRAS08572+3915,IRAS03158+4227, IRAS20100−4156, Mrk231,IRAS05189−2524, and most probably Mrk273. Forthe rest of the sources the relative roles of the AGN andthe starburst are more uncertain, but the AGN eitherdominates or has a significant role in the observednegative feedback.
We thank Avani Gowardhan for providing us with the COfluxes of IRAS03158+4227 and IRAS20100−4156 prior to
33
The Astrophysical Journal, 836:11 (41pp), 2017 February 10 González-Alfonso et al.

the publication. E.G.-A. acknowledges the hospitality of theHarvard-Smithsonian Center for Astrophysics, where part ofthe present study was carried out. We would also like toacknowledge the contribution made by Will Lewitus whocarried out some early data analysis on these outflows while astudent intern at NRL. PACS has been developed by aconsortium of institutes led by MPE (Germany) and includingUVIE (Austria); KU Leuven, CSL, IMEC (Belgium); CEA,LAM (France); MPIA (Germany); INAFIFSI/OAA/OAP/OAT, LENS, SISSA (Italy); and IAC (Spain). This develop-ment has been supported by the funding agencies BMVIT(Austria), ESA-PRODEX (Belgium), CEA/CNES (France),DLR (Germany), ASI/INAF (Italy), and CICYT/MCYT(Spain). E.G.-A. is a Research Associate at the Harvard-Smithsonian Center for Astrophysics and thanks the SpanishMinisterio de Economía y Competitividad for support underprojects FIS2012-39162-C06-01 and ESP2015-65597-C4-1-Rand NASA for support through grant ADAP NNX15AE56G.Basic research in IR astronomy at NRL is funded by the USONR; J.F. also acknowledges support from NHSC/JPLsubcontracts 139807 and 1456609. H.S. acknowledges supportfrom NHSC/JPL subcontract 1483848. S.V. thanks NASA forpartial support of this research through NASA grant ADAPNNX16AF24G. This research has made use of NASA’sAstrophysics Data System (ADS) and of GILDAS software(http://www.iram.fr/IRAMFR/GILDAS).
Facilities: Herschel Space Observatory (PACS).
Appendix AIndividual Sources
Mrk 231. Our three-component model fit is consistent with themore detailed, four-component model reported in GA14: we fit a“quiescent” component (QC) that accounts for the high-lyingabsorption at systemic velocities, a compact component with gasoutflowing up to >1300 km s−1 (HVC), and an extendedcomponent (EC) with intermediate velocities. The HVC andEC have associated ˙ ~M 400 and ∼250Me yr−1, respectively.These values are roughly consistent with the inferred valuesfrom CO (2–1) by Feruglio et al. (2015) once their values arecorrected to match our definition. Tentatively, we find in thecurrent work that the QC is also expanding at ∼100 km s−1 andwith ∼450Me yr−1, matching the velocity of peak absorption inthe OH84 doublet though not that of the OH65 doublet. On theother hand, we find that the EC could be more compact thanadopted in GA14 (which was based on interferometric CO (1–0)emission in Cicone et al. 2012); a good match to the line profilesis also obtained with R∼400 pc.
IRAS 08572+3915. This is an AGN-dominated double-nucleussource with CO detected only in the NW nucleus (Evans et al.2002), and with no trace of PAH emission at 3.3 μm (Imanishiet al. 2008). It shows strong absorption in the blue wings ofOH119, OH79, and OH84 out to −1000 km s−1, and somewhatmore tentatively in OH65. At blueshifted velocities, OH84 isalmost as strong as OH119 (Figure 7), indicating a compactoutflow. There are also hints of the presence of a non-outflowing(i.e., peaking at systemic velocities) component, but it is spectrallydiluted by the prominent wings. It is the only source in our samplethat shows a P Cygni profile in the highly excited OH65 doublet.Our best-fit model for the blueshifted wing requires twocomponents for the outflow, though both are very compact withsimilar r∼110 pc. The lower-velocity (200–800 km s−1) comp-onent, with NH∼1.5×1023 cm−2, and the high-velocity
(800–1100 km s−1) component, with NH∼8×1022 cm−2, bothhave similar ˙ ( – )~ ´P 1.3 1.5 10out
36 dyn, about 3 times themomentum supplied by the dominant AGN and the starburst(∼5×1035 dyn). However, Efstathiou et al. (2014) argue that thisSeyfert 2 galaxy has a much larger AGN luminosity, but theradiation mainly escapes along the axis of the torus away from ourline of sight. If this is the case and the AGN has a luminosity of∼1013 Le (Efstathiou et al. 2014), it would supply a momentumrate of 2.5×1036 dyn, which is just the sum of the momentumfluxes estimated for the two OH outflowing components.With ∼100 pc resolution, Rupke & Veilleux (2013b) have
resolved the outflow in H2 rovibrational lines, showing ablueshifted wing similar to OH119 with extent up to 400 pcand centered at ∼200 pc from the center. This is more extendedthan the radius inferred for OH, which is perhaps consistent withthe high extinction of the nuclear source at far-IR wavelengths.Nevertheless, the OH appears to be missing the more extendedcomponent of the outflow. Cicone et al. (2014) indeed measureda radius of ∼0.8 kpc based on CO emission, but, in contrast withother sources, OH does not show evidence for extended emissionin the blueshifted wing. This may be due to the compactness ofthe far-IR continuum. OH84 shows a prominent P Cygni profile(see Figure 1), but the redshifted emission (at velocities between1000 and 1600 km s−1 relative to the blue component, very likelyextended) does not appear to belong to the componentresponsible for the blue absorption wing. This redshifted featureappears to have its counterpart in CO (1–0) (Cicone et al. 2014)and has not been modeled.Shirahata et al. (2013) have detected the outflow in the
rovibrational lines of CO at ∼5 μm, up to blueshifted velocitiesof −400 km s−1, and derived a column of NH∼5×1022 cm−2.Since the 5 μm continuum emission that CO is absorbing isexpected to arise from a very warm, small region close to theAGN (Shirahata et al. 2013), CO and OH probably probedifferent regions, but the two tracers indicate high columns ofoutflowing gas close to the central engine.Mrk 273. This is a double system with the northern nucleus
containing most of the molecular mass and probably also anAGN that accounts for roughly 1/3–1/2 of the total luminosity(Rupke & Veilleux 2013a). Mrk273 is similar in OH79 toIRAS05189−2524. In addition, both sources (and alsoIRAS 20551−4250) show an OH119 absorption trough of only∼10% of the continuum, and OH79 correspondingly shows weakabsorption and emission in comparison with other ULIRGs withsimilar luminosity such as IRAS23365+3604, but extending tohigher velocities. This indicates a relatively low covering factorof the continuum by the outflow, perhaps associated with thebiconical shape of the outflowing gas (Rupke & Veilleux 2013a).At systemic velocities, the high-lying OH84 and OH65 doubletsshow strong absorption, most likely associated with the verycompact molecular core detected by Downes & Solomon (1998).Mrk273 shows two well-defined velocity components on theblue side of the OH profiles, both detected in OH84, suggesting acompact molecular outflow. Cicone et al. (2014) indeed foundthe shortest radius in Mrk273, ∼0.55 kpc, among the ULIRGoutflows observed in CO. The ∼300 km s−1 component, detectedin both OH84 and OH65, appears to be extremely compact(∼130 pc) and has high columns (NH∼8×1022 cm−2), yield-ing ˙ ~ ´P 2 10out
35 dyn. If the northern nucleus harbors anembedded AGN with 1/3–1/2 of the total luminosity, the abovemomentum flux is 1–2 times that provided by the AGN. Whilesuggesting a moderate momentum boost, overcoming the deep
34
The Astrophysical Journal, 836:11 (41pp), 2017 February 10 González-Alfonso et al.

potential well is the main drawback to explaining this outflowcomponent through momentum-driven approach. For the high-velocity (∼700 km s−1) component, which is detected in OH84with similar strength to OH119, we infer NH∼1×1023 cm−2
and r∼350 pc, giving ˙ ~P 10out36 dyn, i.e., nearly twice the
momentum rate supplied by the starburst and the AGNcombined. A high momentum boost is required (Figure 27),though we cautiously note the weakness of the OH119, OH79,and OH84 high-velocity wings, which may suggest a jet-drivencollimated outflow component.
IRAS 20551−4250. This is an advanced merger with a singlenucleus that shows evidence for both a deeply embedded AGNand a starburst from hard X-rays to mid-IR emission (Genzel et al.1998; Franceschini et al. 2003; Haan et al. 2011; Sani &Nardini 2012). The relative contribution from the AGN and thestarburst based on mid-IR line diagnostics may be misleading, as[Ne II] and [O IV] are not detected but the equivalent width of thePAH 6.2 μm feature is low, suggesting high extinction (Farrahet al. 2007). The strong OH65 absorption indeed indicates that thesource is optically thick even at far-IR wavelengths (GA15). Sani& Nardini (2012) estimated a 26% contribution by the AGN,while Veilleux et al. (2013) estimated 57% from the f15/f30 fluxdensity ratio. OH65 shows a blueshifted line wing up to−400 km s−1, while the rest of the doublets show absorption upto −800 km s−1. These are best matched with two outflowingcomponents that provide a total momentum flux of ∼4.5×1035
dyn, 15% in excess of the combined momentum rate supplied bythe AGN and the starburst.
IRAS 23365+3604. This LINER-type ULIRG shows noevidence of a double nucleus (Downes & Solomon 1998), and thetidal tails observed in the optical (Murphy et al. 1996) suggest apost-coalescence, late-stage merger (Martin & Soto 2016). Abouthalf of its luminosity is associated with an AGN (Veilleux et al.2013). Besides OH119 and OH79, OH84 also shows a P Cygniprofile in this source, and the OH65 peak absorption is blueshiftedby ≈100 km s−1 relative to [C II] 157 μm. OH119 shows blueabsorption up to −1000 km s−1 and possibly more, but the otherdoublets only show absorption up to −500 km s−1. Our best-fitmodel involves three outflowing components, with the COREcomponent outflowing at ∼100 km s−1 ( ˙ ~M 340 Me yr−1). Theother two components (green and magenta curves in Figures 13–16) are probably not independent. They combine to give a total˙ ~ ´P 7.5 10out
35 dyn, ∼4× the momentum rate supplied by theAGN. If a compact starburst is considered, the outflow inIRAS23365+3604 requires little momentum boost for bothcomponents (3).
IRAS 14348−1447. No evidence for broad-line emission orvery high ionization lines in the optical and near-IR is found inthis LINER-type ULIRG (Veilleux et al. 1997), suggesting eithera weak AGN contribution to the luminosity or an extremelyburied AGN. In the far-IR, the strong absorption found in OH65(GA15, Figure 16) strengthens the latter possibility. It is a verymassive merger, with projected nuclear separation of ∼5 kpc,and with the two CO (1–0) components associated with thestellar nuclei (Evans et al. 2000). The southwest (SW) nucleus isthe most luminous in both CO (Evans et al. 2000) and the near-IR (Scoville et al. 2000), and the OH profiles suggest that that itis the source of the outflow because its redshift, zSW=0.0827(Evans et al. 2000), is in good agreement with the center of theOH119 P Cygni profile (Figure 13). We have used in Figures 13–16 zCII=0.08257 (see Table 1; but a better fit to OH119 andOH79 is obtained with zSW). A very high velocity wing, in
excess of 1000 km s−1, is observed in OH119. An interestingcharacteristic of this source is the blueshift of ≈100 km s−1
observed in the OH65 absorption feature (Figures 5 and 16).Although the northeast (NE) nucleus has a redshift that coincideswith that of the OH65 feature, the close correspondence betweenthe OH65 and the OH79 absorptions strongly suggests thatOH65 is also produced toward the SW nucleus, i.e., the nucleusis expanding. The associated momentum flux,∼7×1035 dyn, isof the same order as the momentum rate that can be supplied bythe dominant energy source, whether starburst or AGN, and canbe explained through a momentum-driven approach if it isrotationally supported. Still, some non-negligible contribution ofthe NE nucleus may be present, and the above estimates areupper limits. The other, higher-velocity components togetheraccount for ∼1036 dyn.IRAS 05189−2524. This is an AGN-dominated ULIRG,
with αAGN ranging from 0.6 to 1 using the six diagnostics inVeilleux et al. (2009). It has a single identifiable nucleus and isproposed to be a late-stage merger system, due to the observedtidal tails in the optical (Sanders et al. 1988). Its opticalclassification is Seyfert 2, but it shows broad (∼2000 km s−1)emission near-IR lines (Paα, Paβ, He) and is thus classified asSeyfert 1 in the near-IR (Severgnini & Risaliti 2000). Spoon &Holt (2009) found from blueshifted [Ne III] and [Ne V] mid-IRemission lines detected in this and other ULIRGs that the gasionization increases with increasing blueshift. While theground-state OH119 and OH79 profiles show well-defined PCygni line shapes, the excited OH84 and OH65 profiles showstrong absorption at systemic velocities (GA15). At moderateblueshifted velocities (∼−200 km s−1), OH79 has an out-flowing counterpart in both OH84 and OH65 (Figure 5),indicating a compact component with NH∼1023 cm−2 andmomentum flux ( ˙ ~ ´P 1.5 10out
35 dyn) somewhat lower thanthat provided by the AGN (∼3×1035 dyn), suggesting amomentum-driven shell (Figures 25(c) and 27(b)). OH119shows a flat absorption profile between −200 and −600 km s−1
at ≈10% level, indicating that the high-velocity gas, notdetected in OH84 or OH65, is more extended and with a lowcovering factor. With r∼340 pc, the high-velocity componentcan be roughly explained with NH∼4×1022 cm−2, yielding˙ ~ ´P 5 10out
35 dyn and thus requiring moderate momentumboost. Although the OH79 absorption at v<−600 km s−1 isnot quite reproduced, this is the AGN-dominated ULIRG withthe lowest momentum boost (Figure 18).IRAS 14378−3651. Duc et al. (1997) found no obvious
optical companion to this distorted galaxy, which the authorssuggest is a final-stage merger. This is consistent with the OHobservations: the prominent outflow probed by the OH119,OH79, and OH84 doublets appears to have expelled asignificant fraction of the nuclear molecular gas, leaving arelatively weak OH65 absorption (GA15, Figure 16). Amoderate (250 km s−1) velocity component, mostly responsiblefor the broad and blueshifted OH84 absorption, and a high-velocity component give a total momentum flux of ∼5×1035
dyn, which is of the same order as the momentum rate suppliedby the (dominant) starburst. This suggests at most moderatemomentum boost (3).IRAS 10565+2448. In the optical (r band) this galaxy
appears to be a triple system (Murphy et al. 1996), but CO isonly detected in the western nucleus (Downes & Solomon1998), which dominates the luminosity of the system (Shih &Rupke 2010; Rupke & Veilleux 2013a). The AGN luminosity
35
The Astrophysical Journal, 836:11 (41pp), 2017 February 10 González-Alfonso et al.

may be significantly lower than that of the starburst (Veilleuxet al. 2009, 2013; Rupke & Veilleux 2013a) since the value ofαAGN=0.47 is higher than that obtained from otherdiagnostics in Veilleux et al. (2009). The source showsprominent OH119 and OH79 P Cygni profiles with blueabsorption trough and red emission strength similar to orstronger than that of AGN-dominated sources, although withlower-velocity extent (Figures 13 and 14). The ground-stateOH lines thus indicate outflow parameters for the extendedcomponent of the outflow that are similar to AGN-dominatedULIRGs. Our model fits two outflow components withNH∼(1–2)×1022 cm−2 and r∼400–500 pc each, yielding˙ ~ ´P 5.5 10tot
35 dyn. This is ∼1.2 times the momentumsupplied by the starburst and AGN combined, suggesting amomentum-conserving molecular outflow. The high totaloutflowing molecular mass of ∼3×10⁸ Me still falls shortof the outflowing atomic gas of ∼109 Me inferred from Na I Dby Rupke & Veilleux (2013a), which extends out to at least∼4 kpc from the western nucleus (Shih & Rupke 2010). Inspite of the prominent extended outflow inferred from theground-state OH119 and OH79 doublets, the source showsweak OH65 and OH84 absorption, indicative of relatively lowcolumns or dust temperatures in the central region (GA15).This may be consistent with the model by Downes & Solomon(1998), who fitted an unfilled disk (i.e., with a central gap) tothe CO (1−0) interferometric data. In addition, the weak OH84appears to be globally shifted to the blue (Figure 15), indicatingthat a significant part of the excited, nuclear region isoutflowing, and that the source recently rid itself of most gasin the nuclear region. Together, these clues appear to indicatethat, in spite of the high luminosity of the source, the nuclearoutflowing activity in IRAS 10565+2448 has subsided in thepast ∼1Myr. This is consistent with the fact that the mostobscured regions are found spatially coincident with thehighest-velocity outflow, rather than with the western nucleus(Rupke & Veilleux 2013a).
IRAS 13120−5453. This ULIRG is classified as a post-merger with a single nucleus (Stierwalt et al. 2013). Itsluminosity is dominated by the starburst, though it has aCompton-thick AGN (Iwasawa et al. 2011; Teng et al. 2015).The source is not detected in OH65 (GA15), indicating that thematerial responsible for the AGN obscuration is too compact tohave any significant contribution to the far-IR. Our fit to theOH doublets consists of a central velocity component, bestidentified in OH84 (Figure 15), and an outflow component withmoderate column density (∼1.5×1022 cm−2) and probablyextended. It gives an estimated momentum flux of ∼4×1035
dyn, which is significantly lower than the predicted momentumrate supplied by the starburst and the AGN. This suggests amomentum-conserving flow. A weak but apparent blueshiftedwing in OH119 up to velocities of ∼−1500 km s−1 (Figure 13)is not modeled and could reveal the feedback by theburied AGN.
IRAS 19297−0406. This is a multiple colliding systemdominated by star formation. Though the source is undetectedin OH79, it still shows a prominent absorption in OH65 atsystemic velocities. The energetics of the outflow are veryuncertain, but the model is consistent with an outflowing columnof NH∼1022 cm−2, Mout∼4×10⁷Me, ˙ ~ -M M100 yr 1,and ˙ ~ ´P 3 1035 dyn. This is significantly lower than themomentum rate that a galaxy with LIR∼2.5×10¹² Le can
provide, suggesting that only a single component of the multiplesystem is involved in the outflow.IRAS 09022−3615. Optically classified as a star-forming
galaxy (Lee et al. 2011), the red near-IR continuum in the L-band suggests a buried AGN in this ULIRG (Lee et al. 2012).The OH65 absorption in this source is weak but detected andshows a slight blueshift relative to the systemic velocity. This isthe only source in our sample where the emission feature inOH119 is stronger than the absorption feature, thus involvingimportant geometrical effects or significant collisional excita-tion. Our model is thus relatively uncertain, though it involves˙ ~ -M M130 yr 1 and ˙ ~ ´P 1 1035 dyn. As in the case ofIRAS 19297−0406, this is significantly lower than themomentum rate that the galaxy could supply based on itsluminosity. However, the energetics could be significantlyunderestimated if the weak absorption is due to low far-IRcontinuum brightness, rather than to low column densities.IRAS 03158+4227. This galaxy has a companion (projected
separation of ∼50 kpc) with no apparent sign of interaction inthe r band (Murphy et al. 1996), but Meusinger et al. (2001)found a curved tail in the companion that matches the expectedresult of a binary interaction. The optical spectrum shows noindication of an AGN (Meusinger et al. 2001), and Risaliti et al.(2000) find no evidence for an AGN from hard X-ray activity.However, this is (together with IRAS 20100−4156) the mostextreme source in our sample. At systemic velocities the OH65absorption is very deep, with nearly flat absorption between thetwo doublet components (Figure 1). This indicates very highextinction in the far-IR, capable of obscuring any AGNsignature at shorter wavelengths. On the other hand, theoutflow is observed out to 1500 km s−1 in OH119, asemphasized by Spoon et al. (2013). In OH79 the observed PCygni profile has a blueshifted wing apparently extending up to−1700 km s−1, though it may be contaminated by H2Oprimarily at velocities more blueshifted than −1300 km s−1.The OH84 absorption trough is deep, 10% at −800 km s−1, anda very prominent OH65 absorption is seen up to−1000 km s−1. Our simple three-component model approachcannot account for all spectroscopic details in the wide velocityrange depicted by the OH doublets. Even neglecting the high-velocity wing in OH79, the OH65 absorption at centralvelocities is underpredicted and OH84 is slightly overpredictedover the full velocity range. Nevertheless, the model capturesthe presence of a compact, massive (4×10⁸Me), and excitedcomponent flowing at high velocities (300–1300 km s−1), withan estimated mass outflow rate of 1300Me yr−1 and amomentum flux of ∼7×1036 dyn. These astonishing valuescannot be understood in terms of the momentum rate suppliedby a galaxy with even such high luminosity as IRAS03158+4227, and a very high momentum boost is required. This isprobably an “exploding” quasar, with enormous masses of gassuddenly accelerated to high velocities, and a nuclear-energy-conserving phase within this extremely buried source isrequired to understand the involved energetics. In addition,another outflowing component is required to account for theextremely high velocity OH wings. Our model for the lattercomponent is more uncertain but probably does not dominatethe energetics of the source and can be explained through amomentum-conserving phase (Figure 25(c)).IRAS 20100−4156. From optical and near-IR images, Duc
et al. (1997) classify this galaxy as a close interacting pair of diskgalaxies (projected separation of ≈5.4 kpc), with a starburst or
36
The Astrophysical Journal, 836:11 (41pp), 2017 February 10 González-Alfonso et al.

LINER-type spectrum. A possible third component of the mergerwas identified by Bushouse et al. (2002) with NICMOS. Thegalaxy shows strong megamaser emission in OH at centimeterwavelengths (Harvey-Smith et al. 2016), with a plateau of OHemission whose blue wing traces the velocities of the absorptionfound in the far-IR OH doublets. Searches in X-rays haveidentified the possible presence of a buried AGN (Franceschiniet al. 2003). The OH doublets indicate a galaxy with extremeproperties. The OH65 absorption is very deep and broad, withlittle decrease of the absorption at wavelengths between the twodoublet components. Absorption in OH119 is observed out to−1300 km s−1, and to −1000 km s−1 in the other three doublets.Similar to IRAS03158+4227, our model involves a compact,massive (5×10⁸Me), and excited component flowing atvelocities up to 800 km s−1 with a momentum flux of∼3×1036 dyn. It most likely requires a high momentum boost.A second, even higher-speed component with one order ofmagnitude lower mass accounts for ∼1.5×1036 dyn, and couldbe explained via a momentum-driven outflow. The OH119absorption is underestimated by our model on the red side of theprofile, suggesting additional, foreground absorption. The veryhigh velocities in this source suggest that the AGN contribution tothe luminosity is underestimated.
Appendix BComparison with Ionized Lines in Starburst Galaxies
We compare here the outflow properties of local starburstgalaxies inferred by Heckman et al. (2015) and of ULIRGs as
derived in this work. Since these properties are derived inbasically the same way (i.e., Equations (6), (11), and (12),while the starburst galaxies are analyzed in lines of ions, thecomparison is relevant to contrast different phases of theoutflow and to infer the main differences between purestarburst galaxies and ULIRGs where the AGN plays animportant role. Figure 31 shows the outflow column density,mass, velocity, mass outflow rate, and momentum flux, as afunction of the outflow radius, for the starburst galaxies (blacksymbols) and the ULIRGs (individual components, in red).A quantitative difference between the two phases is found in
their column densities, which are moderate in the ionizedoutflow phase of starburst galaxies, ∼1021 cm−2, but are muchlarger, 1022 cm−2, for the molecular outflows in ULIRGs.The outflow size, which is adopted as twice the size of thestarburst in Heckman et al. (2015), is also larger than theextents we have derived for the OH outflows. The outflowinggas mass (Equation (6)) is then found roughly similar in bothtypes of sources and phases. The derived mass outflow ratesand momentum fluxes are significantly higher for the OHoutflows.
Appendix CRadiation Pressure Support of the Highly
Excited Nuclear Structures
Thompson et al. (2015) consider two types of structures thatare subject to radiation pressure: a spherical shell and a cloudensemble. We show here that the pressure exerted by the
Figure 31. Comparison of the outflow properties of local starburst galaxies inferred by Heckman et al. (2015) (black symbols) with those of ULIRGs as inferred fromOH (individual components, in red) in this work. The column density (NH), outflowing mass (Mout), velocity (v ), mass outflow rate (Mout), and momentum flux (Pout)are shown as a function of the estimated radius (r).
37
The Astrophysical Journal, 836:11 (41pp), 2017 February 10 González-Alfonso et al.

radiation responsible for the observed molecular excitation inULIRGs is close to that required for support against gravity,but probably not enough to overcome gravity and drive anoutflow under typical physical conditions in the nuclear regionsof ULIRGs. Starting with a shell at initial position r0 and IRoptical depth τIR?1, the ratio of Eddington luminosity to gasmass is (from Equation(8) in Thompson et al. 2015)
( )
p= = ´
´ ´⎛⎝⎜⎜
⎞⎠⎟⎟
⎛⎝⎜
⎞⎠⎟
L
M
c G
f k
f kL M
41.76 10
0.15 5 cm g, 26
g
g
EDD
gas IR
4
2
IR
where Mgas denotes the gas mass within r0, fg is the gas massfraction in that region, and kIR (dependent on Tdust) is the IRopacity. Combes et al. (2013) estimate that the average fg inlocal galaxies is 0.10, though with high dispersion, andDownes & Solomon (1998) derived fg∼0.17 in the nuclearregions of ULIRGs. We adopt a reference value of fg=0.15.
Figure 32(a) shows the Planck-averaged opacity kIR as afunction of Tdust, based on the mass-absorption coefficient ofdust given in González-Alfonso et al. (2014a) and a nominalgas-to-dust ratio by mass of g/d=100. The reference valuegiven by Thompson et al. (2015), kIR=5 cm−2 g−1 of gas, isobtained for Tdust=140 K. Based on this kIR profile and onEquation (26), we plot in Figure 32(b) LEDD/Mgas (gray curve)
as a function of Tdust. We also show in Figure 32(b) thecalculated values of LIR/Mgas (squares, solid line) for aspherical source with τ100=1, the minimum value we inferredfrom radiative transfer models to the OH65 doublet (GA15). Tocalculate Mgas from τ100, we adopt an absorption coefficient of0.45 cm−2 g−1 of gas at 100 μm (based again on González-Alfonso et al. 2014a) and g/d=100.The figure indicates that Tdust≈140 K is required for
radiation pressure support against gravity for τ100=1. Forτ100>1, the LIR/Mgas values would be lower because LIRwould remain nearly the same owing to the fact that the far-IRemission is optically thick; hence, higher Tdust would berequired.In the far-IR, the values of Tdust as directly inferred from the
OH and H2O excitation in buried nuclei (GA12; GA14; GA15;Falstad et al. 2015) are 100–150 K, suggesting that thesenuclear regions are close to the regime of radiation pressuresupport against gravity in the vertical direction (Thompsonet al. 2005), but may be insufficient to drive an outflow. Themost excited source in our original sample is the LIRGNGC4418, where Tdust∼150 K is inferred (GA12), but nomolecular outflow is detected in this source. We emphasize thatin these sources that are optically thick in the far-IR, higherTdust are expected to be prevalent within the cocoon of dust,due to radiation trapping, but the relevant values for radiationpressure support at the scales probed by the far-IR are the
Figure 32. Radiation pressure support in (U)LIRGs with measurable absorption in the high-lying OH65 doublet. (a) Planck-averaged mass-absorption coefficient (kIR)as a function of the dust temperature (Tdust). (b) The gray curve shows LEDD/Mgas as predicted by Equation (26) with a gas fraction of fg=0.15 and the kIR profile ofpanel (a). The solid line (squares) shows the calculated LIR/Mgas for a continuum optical depth at 100 μm of unity (GA15). For these optically thick sources we expectradiation pressure support for ~T 140dust K. (c) Infrared luminosities (LIR) as a function of the velocity dispersion (σ) for all (U)LIRGs where OH65 is detected(GA15). σ is calculated from Gaussian fits to the OH65 doublet. The dashed and dotted lines indicate the Eddington luminosities LEDD predicted by Equation (27) for
=T 100dust and 150 K, respectively.
38
The Astrophysical Journal, 836:11 (41pp), 2017 February 10 González-Alfonso et al.

surface values where the material is illuminated from basicallyone side.
An alternative way to illustrate this result is by substitutingMgas=2σ2 fg r0/G in Equation (26), as is appropriate for anisothermal sphere, and ( )ps»r L T40 EDD SB dust
4 1 2, where σSBis the Stefan–Boltzmann constant, yielding
( )
ps
s
s
= = ´ ´
´ ´-
⎜ ⎟
⎛⎝⎜
⎞⎠⎟
⎛⎝⎜
⎞⎠⎟
⎛⎝
⎞⎠
Lc
k T T
kL
161.34 10
100 K
5 cm g
200 km s. 27
EDD
2
IR2
SB dust4
4 13
dust
4
2
IR
2
1
4
Figure 32(c) shows the IR luminosity as a function of thevelocity dispersion σ, which is here measured from Gaussianfits to the high-lying OH65 doublet to filter the nuclear regions,for all (U)LIRGs where OH65 is detected (GA15). The OH65doublet is in part broadened owing to radial motions, but σ isnot corrected for inclination effects, and thus the intrinsicvalues are higher than in Figure 32(c); in addition, the LIRvalues are also upper limits because a fraction of the luminositymost likely arises from more extended regions. The linesindicate the LEDD values for Tdust=100 and 150 K as given byEquation (27). The results are roughly consistent withFigure 32(b), i.e., radiation pressure support in the verticaldirection of the region sampled by OH65 is expected forTdust=100–150 K, coinciding with the highest values of Tdustinferred from the high-lying OH and H2O lines in somesources, but this is insufficient to drive an outflow.
Using now the cloud approach in Thompson et al. (2015,their Equation(38)), the ratio of Eddington luminosity to gasmass is
( )
p m= = ´
´ ´-
⎜ ⎟⎛⎝⎜⎜
⎞⎠⎟⎟
⎛⎝
⎞⎠
L
M
c G m N
f
f
NL M
21.03 10
0.15
10 cm, 28
g
g
EDD
gas
H H 4
H23 2
where NH is the column density of the cloud, which is assumedto have τIR1. Writing again Mgas in terms of σ and Tdust, wefind
( )
p ms
s
s
=
= ´ ´
´ ´- -
⎜ ⎟ ⎜ ⎟
⎛⎝⎜
⎞⎠⎟
⎛⎝
⎞⎠
⎛⎝
⎞⎠
Lc m N
T
T
NL
4
4.60 10100 K
10 cm 200 km s. 29
EDD
2 2H2
H2
SB dust4
4
12
dust
4
H23 2
2
1
4
We have assumed here that the impinging radiation field on thecloud is UV dominated (Thompson et al. 2015), but we notethat the outflows are observed in absorption lines against astrong far-IR field, and thus the radiation has been alreadyreprocessed and reemitted at far-IR wavelengths. Hence,Equations (28) and (29) probably underestimate L MEDD gas
and LEDD by a factor of ∼2.
Appendix DVelocity Field
In GA14, we favored a decelerating velocity field inMrk231 based on three arguments: (i) OH84 and OH65showed absorption at extreme velocities (−1000 km s−1),indicating the presence of high-velocity gas close to the nuclearsource of far-IR radiation, while the extended outflowingcomponent probed by OH119 and OH79 indicated expandingvelocities significantly lower, up to ≈900 km s−1. (ii) CO (1–0)and (2–1) emission in the line wings, tracing an extendedoutflow, was found up to ≈800 km s−1 (Cicone et al. 2012),significantly lower than OH. (iii) In our nonclumpy sphericalmodels, the line profiles are better fit with decelerating flows.We examine here whether the decelerating flows are also
applicable to the other ULIRGs of our sample. Figure 10indicates that, in all sample sources except Mrk273 andIRAS08572+3915, the ground-state OH119 and OH79doublets peak at more blueshifted velocities than the excitedOH84 and OH65. In addition, Figure 7 shows that, in allsources except IRAS03158+4227, Mrk231, IRAS08572+3915, and IRAS20100−4156 (and IRAS 09022−3615,where OH65 is not detected), OH119 shows absorption wellin excess of 500 km s−1, but the OH65 absorption is restrictedto expanding velocities v<500 km s−1. Since the very excitedOH65 is formed very close to the nuclear source of strong far-IR emission and OH119 is generally generated farther from it,does this observational evidence indicate that the gas isaccelerated as it moves away from the nuclear region?Not necessarily. Besides high Tdust, significant absorption of
OH65 requires high columns of gas. If the gas column per unitof velocity decreases with increasing outflowing velocity, it isexpected that the high-velocity gas will not be detected inOH65 owing to insufficient columns, even if a significantfraction of it is located close to the nuclear region. In addition,absorption and reemission in the ground-state doublets overlarge volumes can bring the intensity close to zero at centralvelocities, thus shifting the velocity of the peak absorption tohigh velocities, while this effect cannot happen in the excitedlines (Section 4.5).For instance, based on our models of IRAS14378−3651
(see Table 2), the high-velocity component has a moderatecolumn of NOH=3×1016 cm−2 and is not expected togenerate any OH65 absorption even though it is located only200–300 pc from the center. On the other hand, in IRAS20551−4250 and IRAS10565+2448, both the high- and low-velocity components have similar spatial distributions.Although our model components also include acceleratedflows, the best fits are mostly found for decelerating orconstant-velocity fields (except in two components), thoughthis may be an artificial effect of our nonclumpy approach.Our favored interpretation for the apparent higher spatial extent
of the high-velocity relative to the low-velocity gas in our samplegalaxies is not necessarily that the gas is smoothly acceleratedfrom the central region, but that the different doublets tracecomponents with different columns that have been accelerated todifferent velocities. The escape velocity is given by
» -v M R200 km sesc 9 2001, where =M M M109
9 andR200=R/200 pc, so that a significant fraction of the low-velocitygas may not escape the central potential well of the host galaxy,while the high-velocity gas will escape and be observed at largerdistances.
39
The Astrophysical Journal, 836:11 (41pp), 2017 February 10 González-Alfonso et al.

References
Aalto, S., García-Burillo, S., Muller, S., et al. 2012, A&A, 537, A44Aalto, S., García-Burillo, S., Muller, S., et al. 2015, A&A, 574, A85Adams, F. C., Graff, D. S., & Richstone, D. O. 2001, ApJL, 551, L31Alatalo, K., Blitz, L., Young, L. M., et al. 2011, ApJ, 735, 88Alatalo, K., Lacy, M., Lanz, L., et al. 2015, ApJ, 798, 31Arav, N., Borguet, B., Chamberlain, C., Edmonds, D., & Danforth, C. 2013,
MNRAS, 436, 3286Baldry, I. K., Glazebrook, K., Brinkmann, J., et al. 2004, ApJ, 600, 681Beifiori, A., Courteau, S., Corsini, E. M., & Zhu, Y. 2012, MNRAS, 419, 2497Bolatto, A. D., Warren, S. R., Leroy, A. K., et al. 2013, Natur, 499, 450Borguet, B. C. J., Arav, N., Edmonds, D., Chamberlain, C., & Benn, C. 2013,
ApJ, 762, 49Burkert, A., & Silk, J. 2001, ApJL, 554, L151Bushouse, H. A., Borne, K. D., Colina, L., et al. 2002, ApJS, 138 1Cicone, C., Feruglio, C., Maiolino, R., et al. 2012, A&A, 543, A99Cicone, C., Maiolino, R., Sturm, E., et al. 2014, A&A, 562, A21Combes, F., García-Burillo, S., Braine, J., et al. 2013, A&A, 550, A41Costagliola, F., Aalto, S., Sakamoto, K., et al. 2013, A&A, 556, A66Dasyra, K. M., Tacconi, L. J., Davies, R. I., et al. 2006, ApJ, 651, 835Davies, R. I., Tacconi, L. J., & Genzel, R. 2004, ApJ, 613, 781DeBuhr, J., Quataert, E., & Ma, C.-P. 2012, MNRAS, 420, 2221Dekel, A., & Birnboim, Y. 2006, MNRAS, 368, 2di Matteo, T., Springel, V., & Hernquist, L. 2005, Natur, 433, 604Díaz-Santos, T., Assef, R. J., Blain, A. W., et al. 2016, ApJL, 816, L6Downes, D., & Solomon, P. M. 1998, ApJ, 507, 615Downes, D., Solomon, P. M., & Radford, S. J. E. 1993, ApJL, 414, L13Duc, P.-A., Mirabel, I. F., & Maza, J. 1997, A&AS, 124, 533Efstathiou, A., Pearson, C., Farrah, D., et al. 2014, MNRAS, 437, L16Evans, A. S., Mazzarella, J. M., Surace, J. A., & Sanders, D. B. 2002, ApJ,
580, 749Evans, A. S., Surace, J. A., & Mazzarella, J. M. 2000, ApJL, 529, L85Fabian, A. C. 1999, MNRAS, 308, L39Fabian, A. C. 2012, ARA&A, 50, 455Fabian, A. C., & Iwasawa, K. 1999, MNRAS, 303, L34Falstad, N., González-Alfonso, E., Aalto, S., et al. 2015, A&A, 580, A52Falstad, N., González-Alfonso, E., Aalto, S., & Fischer, J. 2017, A&A,
597, A105Farrah, D., Bernard-Salas, J., Spoon, H. W. W., et al. 2007, ApJ, 667, 149Farrah, D., Lebouteiller, V., Spoon, H. W. W., et al. 2013, ApJ, 776, 38Farrah, D., Urrutia, T., Lacy, M., et al. 2012, ApJ, 745, 178Faucher-Giguère, C.-A., & Quataert, E. 2012, MNRAS, 425, 605Ferrarese, L., & Ford, H. 2005, SSRv, 116, 523Ferrarese, L., & Merritt, D. 2000, ApJL, 539, L9Feruglio, C., Fiore, F., Carniani, S., et al. 2015, A&A, 583, A99Feruglio, C., Maiolino, R., Piconcelli, E., et al. 2010, A&A, 518, L155Fischer, J., Sturm, E., González-Alfonso, et al. 2010, A&A, 518, L41Franceschini, A., Braito, V., Persic, M., et al. 2003, MNRAS, 343, 1181García-Burillo, S., Combes, F., Usero, A., et al. 2015, A&A, 580, A35García-Marín, M., Colina, L., Arribas, S., Alonso-Herrero, A., & Mediavilla, E.
2006, ApJ, 650, 850Gebhardt, K., Bender, R., Bower, G., et al. 2000, ApJL, 539, L13Genzel, R., Lutz, D., Sturm, E., et al. 1998, ApJ, 498, 579Genzel, R., Tacconi, L. J., Rigopoulou, D., Lutz, D., & Tecza, M. 2001, ApJ,
563, 527Goicoechea, J. R., & Cernicharo, J. 2002, ApJL, 576, L77Goicoechea, J. R., Cernicharo, J., Lerate, M. R., et al. 2006, ApJL, 641, L49Goicoechea, J. R., Joblin, C., Contursi, A., et al. 2011, A&A, 530, L16González-Alfonso, E., & Cernicharo, J. 1997, A&A, 322, 938González-Alfonso, E., & Cernicharo, J. 1999, ApJ, 525, 845González-Alfonso, E., Fischer, J., Aalto, S., & Falstad, N. 2014a, A&A,
567, A91González-Alfonso, E., Fischer, J., Bruderer, S., et al. 2013, A&A, 550, A25González-Alfonso, E., Fischer, J., Sturm, E., et al. 2015, ApJ, 800, 69González-Alfonso, E., Fischer, J., Graciá-Carpio, J., et al. 2012, A&A, 541, A4González-Alfonso, E., Fischer, J., Graciá-Carpio, J., et al. 2014b, A&A, 561,
A27 (GA14)Graciá-Carpio, J., Sturm, E., Hailey-Dunsheath, S., et al. 2011, ApJL, 728, L7Graham, A. W., & Driver, S. P. 2007, ApJ, 655, 77Graham, A. W., Erwin, P., Caon, N., & Trujillo, I. 2001, ApJL, 563, L11Guillard, P., Boulanger, F., Lehnert, M. D., et al. 2015, A&A, 574, A32Haan, S., Surace, J. A., Armus, L., et al. 2011, AJ, 141, 100Harrison, C. M., Alexander, D. M., Mullaney, J. R., & Swinbank, A. M. 2014,
MNRAS, 441, 3306Harvey-Smith, L., Allison, J. R., Green, J. A., et al. 2016, MNRAS, 460, 2180
Heckman, T. M., Alexandroff, R. M., Borthakur, S., Overzier, R., &Leitherer, C. 2015, ApJ, 809, 147
Heckman, T. M., Armus, L., & Miley, G. K. 1990, ApJS, 74, 833Hopkins, P. F., Cox, T. J., Younger, J. D., & Hernquist, L. 2009, ApJ,
691, 1168Hopkins, P. F., Hernquist, L., Cox, T. J., et al. 2006a, ApJS, 163, 1Hopkins, P. F., Hernquist, L., Cox, T. J., Robertson, B., & Springel, V. 2006b,
ApJS, 163, 50Imanishi, M., Nakagawa, T., Ohyama, Y., et al. 2008, PASJ, 60, 489Imanishi, M., Nakanishi, K., & Izumi, T. 2016, AJ, 152, 218Ishibashi, W., & Fabian, A. C. 2015, MNRAS, 451, 93Iwasawa, K., Sanders, D. B., Teng, S. H., et al. 2011, A&A, 529, A106Jahnke, K., & Macciò, A. V. 2011, ApJ, 734, 92Janssen, A. W., Christopher, N., Sturm, E., et al. 2016, ApJ, 822, 43Khochfar, S., & Ostriker, J. 2008, ApJ, 680, 54Kim, D.-C., Veilleux, S., & Sanders, D. B. 1998, ApJ, 508, 627King, A. 2003, ApJL, 596, L27King, A. 2005, ApJL, 635, L121King, A., & Pounds, K. 2015, ARA&A, 53, 115Lang, P., Wuyts, S., Somerville, R. S., et al. 2014, ApJ, 788, 11Lee, J. C., Hwang, H. S., Lee, M. G., Kim, M., & Kim, S. C. 2011, MNRAS,
414, 702Lee, J. C., Hwang, H. S., Lee, M. G., Kim, M., & Lee, J. H. 2012, ApJ, 756, 95Leitherer, C., Schaerer, D., Goldader, J. D., et al. 1999, ApJS, 123, 3Lindberg, J. E., Aalto, S., Muller, S., et al. 2016, A&A, 587, A15Lípari, S., Sánchez, S. F., Bergmann, M., et al. 2009, MNRAS, 392, 1295Lípari, S., Terlevich, R., Zheng, W., et al. 2005, MNRAS, 360, 416Magorrian, J., Tremaine, S., Richstone, D., et al. 1998, AJ, 115, 2285Maiolino, R., Gallerani, S., Neri, R., et al. 2012, MNRAS, 425, 66Marconi, A., & Hunt, L. K. 2003, ApJL, 589, L21Martin, C. L., & Soto, K. 2016, ApJ, 819, 49Martín, S., Aalto, S., Sakamoto, K., et al. 2016, A&A, 590, A25Martizzi, D., Fielding, D., Faucher-Giguère, C.-A., & Quataert, E. 2016,
MNRAS, 459, 2311Meijerink, R., Spaans, M., Loenen, A. F., & van der Werf, P. P. 2011, A&A,
525, A119Meusinger, H., Stecklum, B., Theis, C., & Brunzendorf, J. 2001, A&A,
379, 845Murphy, T. W., Jr., Armus, L., Matthews, K., et al. 1996, AJ, 111, 1025Murray, N., Quataert, E., & Thompson, T. A. 2005, ApJ, 618, 569Nardini, E., Risaliti, G., Watabe, Y., Salvati, M., & Sani, E. 2010, MNRAS,
405, 2505Peng, C. Y. 2007, ApJ, 671, 1098Peng, Y., Maiolino, R., & Cochrane, R. 2015, Natur, 521, 192Pereira-Santaella, M., Colina, L., García-Burillo, S., et al. 2016, A&A,
594, A81Pilbratt, G. L., Riedinger, J. R., Passvogel, T., et al. 2010, A&A, 518, L1Poglitsch, A., Waelkens, C., Geis, N., et al. 2010, A&A, 518, L2Privon, G. C., Aalto, S., Falstad, N., et al. 2016, ApJ, in press (arXiv:1612.
04401)Risaliti, G., Gilli, R., Maiolino, R., & Salvati, M. 2000, A&A, 357, 13Rodríguez Zaurín, J., Tadhunter, C. N., Rose, M., & Holt, J. 2013, MNRAS,
432, 138Roth, N., Kasen, D., Hopkins, P. F., & Quataert, E. 2012, ApJ, 759, 36Rupke, D. S., & Veilleux, S. 2013a, ApJ, 768, 75Rupke, D. S., & Veilleux, S. 2013b, ApJL, 775, L15Rupke, D. S., Veilleux, S., & Sanders, D. B. 2002, ApJ, 570, 588Rupke, D. S., Veilleux, S., & Sanders, D. B. 2005a, ApJ, 632, 751Rupke, D. S., Veilleux, S., & Sanders, D. B. 2005b, ApJS, 160, 87Rupke, D. S., Veilleux, S., & Sanders, D. B. 2005c, ApJS, 160, 115Sakamoto, K., Aalto, S., Costagliola, F., et al. 2013, ApJ, 764, 42Sakamoto, K., Aalto, S., Wilner, D. J., et al. 2009, ApJL, 700, L104Sanders, D. B., Mazzarella, J. M., Kim, D.-C., Surace, J. A., & Soifer, B. T.
2003, AJ, 126, 1607Sanders, D. B., Soifer, B. T., Elias, J. H., et al. 1988, ApJ, 325, 74Sanders, R. H. 1989, IAUS, 136, 77Sani, E., & Nardini, E. 2012, AdAst, 2012, 783451Schawinski, K., Urry, C. M., Simmons, B. D., et al. 2014, MNRAS, 440, 889Scoville, N. Z., Evans, A. S., Thompson, R., et al. 2000, AJ, 119, 991Severgnini, P., & Risaliti, G. 2000, MemSAI, 72, 63Shankar, F., Bernardi, M., Sheth, R. K., et al. 2016, MNRAS, 460, 3119Shih, H.-Y., & Rupke, D. S. N. 2010, ApJ, 724, 1430Shirahata, M., Nakagawa, T., Usuda, T., et al. 2013, PASJ, 65, 5Silk, J., & Rees, M. J. 1998, A&A, 331, L1Solomon, P. M., Downes, D., Radford, S. J. E., & Barrett, J. W. 1997, ApJ,
478, 144
40
The Astrophysical Journal, 836:11 (41pp), 2017 February 10 González-Alfonso et al.

Spoon, H. W. W., Farrah, D., Lebouteiller, V., et al. 2013, ApJ, 775, 127Spoon, H. W. W., & Holt, J. 2009, ApJL, 702, L42Springel, V., Di Matteo, T., & Hernquist, L. 2005, ApJL, 620, L79Stern, J., Faucher-Giguère, C.-A., Zakamska, N. L., & Hennawi, J. F. 2016,
ApJ, 819, 130Sternberg, A., & Dalgarno, A. 1995, ApJS, 99, 565Stierwalt, S., Armus, L., Surace, J. A., et al. 2013, ApJS, 206, 1Stone, M., Veilleux, S., Meléndez, M., et al. 2016, ApJ, 826, 111Strateva, I., Ivezić, Z., Knapp, G., et al. 2001, AJ, 122, 1861Sturm, E., González-Alfonso, E., Veilleux, S., et al. 2011, ApJL, 733, L16Surace, J. A., Sanders, D. B., & Mazzarella, J. M. 2004, AJ, 127, 3235Tacchella, S., Carollo, C. M., Renzini, A., et al. 2015, Sci, 348, 314Tacconi, L. J., Genzel, R., Lutz, D., et al. 2002, ApJ, 580, 73Teng, S. H., Rigby, J. R., Stern, D., et al. 2015, ApJ, 814, 56Thompson, T. A., Fabian, A. C., Quataert, E., & Murray, N. 2015, MNRAS,
449, 147
Thompson, T. A., Quataert, E., & Murray, N. 2005, ApJ, 630, 167Tombesi, F., Meléndez, M., Veilleux, S., et al. 2015, Natur, 519, 436Tremaine, S., Gebhardt, K., Bender, R., et al. 2002, ApJ, 574, 740Tunnard, R., Greve, T. R., García-Burillo, S., et al. 2015, ApJ, 800, 25Veilleux, S., Cecil, G., & Bland-Hawthorn, J. 2005, ARA&A, 43, 769Veilleux, S., Kim, D.-C., & Sanders, D. B. 1999, ApJ, 522, 113Veilleux, S., Kim, D.-C., Sanders, D. B., Mazzarella, J. M., & Soifer, B. T.
1995, ApJS, 98, 171Veilleux, S., Meléndez, M., Sturm, E., et al. 2013, ApJ, 776, 27Veilleux, S., Rupke, D. S. N., Kim, D.-C., et al. 2009, ApJS, 182, 628Veilleux, S., Sanders, D. B., & Kim, D.-C. 1997, ApJ, 484, 92Véron-Cetty, M.-P., & Véron, P. 2006, A&A, 455, 773Weaver, R., McCray, R., Castor, J., Shapiro, P., & Moore, R. 1977, ApJ,
218, 377Zubovas, K., & King, A. 2012, ApJL, 745, L34Zubovas, K., & Nayakshin, S. 2014, MNRAS, 440, 2625
41
The Astrophysical Journal, 836:11 (41pp), 2017 February 10 González-Alfonso et al.