
Molecular Dynamics Simulations of Folding and Insertion of the … · 2019-09-03 · Molecular...
6
Molecular Dynamics Simulations of Folding and Insertion of the Ebola Virus Fusion Peptide into a Membrane Bilayer Mark A. Olson 1 , In-Chul Yeh 2 , and Michael S. Lee 1,3 1 US Army Medical Research Institute of Infectious Diseases, Ft. Detrick, MD, USA 2 Biotechnology High Performance Computing Software Applications Institute, Ft. Detrick, MD, USA 3 US Army Research Laboratory, Aberdeen Proving Ground, MD, USA Abstract - This paper presents replica-exchange molecular dynamics simulations of the folding and insertion of a 16- residue Ebola virus fusion peptide into a membrane bilayer. We applied a multi-resolution computational approach of modeling the peptide at the all-atom level and the membrane-aqueous bilayer by a generalized Born continuum approximation. We found that interfacial folding of the peptide is not required for membrane insertion and that regardless of the starting conformation (either folded or unfolded) the simulations of 20 ns converged to yield a conformational preference of forming an (i,i+4) backbone α-helical structure with the central residues embedded approximately 4-6 Å below the surface of the membrane and the two terminal charged residues exposed to the solvent layer. The conformational population distributions of the peptide and a possible folding/insertion pathway are discussed in terms of energy landscape theory. Keywords: replica-exchange conformational sampling, generalized Born solvent models, free-energy landscape, virus-host interactions 1 Introduction Ebola and Marburg viruses are nonsegmented, negative-strand RNA viruses, which together constitute the family Filoviridae. The most pathogenic strain (Zaire) of Ebola virus causes a severe form of hemorrhagic fever in humans and nonhuman primates. Unlike many other viruses, the filoviruses contain a highly compact genome, consisting of only seven encoded proteins. Of the encoded proteins, the glycoprotein (GP) is responsible for receptor binding and membrane fusion, providing viral penetration into cells. GP is expressed as a single-chain precursor of 676 residues that is posttranslationally processed into disulfide-linked fragments GP1 (receptor-binding domain) and GP2 (transmembrane domain). Because of issues dealing with protein stability and crystallization conditions, known structures of GP are only of the GP2 ectodomain and lack the ‘‘fusion-peptide’’ region near the N terminus, which is thought to insert directly into the target membrane at an early stage in the membrane-fusion process. Very recently, a NMR structure was reported of a 16-residue Zaire Ebola virus fusion peptide (Ebo-16) of GP2 [1]. To better understand the mechanics of GP-membrane fusion and viral entry at atomic-level detail, we report replica-exchange molecular dynamics (REMD) simulations of how the Ebo-16 peptide folds and inserts into a membrane bilayer. Our computational strategy is a multi- resolution approach of modeling the 16-residue peptide at the all-atom force-field level while the membrane is modeled by a mean-field approximation as a low-dielectric continuum and the aqueous layer by an implicit solvent model. We investigate the issue of whether interfacial folding of the peptide is required for efficient insertion into the membrane and determine the most probable conformational basins in configurational space of the folded structures. We will illustrate the results from the simulations using ideas of energy landscape theory. 2 Computational methods In this section, we first describe the modeling methods and simulation protocols used in this study. We then outline methods to estimate free energies and a clustering scheme to separate calculated structures into conformational basins. 2.1 Simulation models Molecular dynamics simulations were performed using the all-atom CHARMM 22 force field with CMAP modification for proteins [2,3]. The membrane is represented by an implicit membrane model based on a generalized Born Smoothing Window (GBSW) implicit solvent model [4]. Implicit membrane models have been successfully applied to study membrane-insertions of various model peptides [5,6]. The membrane thickness is modeled at 25 Å with a membrane smoothing length of 5 Å for transitioning the dielectric constant of ε wtr = 80 for the aqueous layer to a dielectric constant of ε mem = 1 for the membrane. Our treatment of the hydrophobic effect is based on a surface-area (SA) representation with a surface tension coefficient set to 0.04 kcal/(mol-Å 2 ). Initial structures of the Ebo-16 peptide (residues GAAIGLAWIPYFGPAA) for simulations were modeled either as a fully extended conformation or the 3 10 -helix structure from the determined by NMR [1]. These starting structures are illustrated in Fig. 1. The Z-axis is defined as Presented at the 2008 International Conference on Bioinformatics and Computational Biology, July 14 – 17, 2008, Las Vegas, NV 660
Transcript of Molecular Dynamics Simulations of Folding and Insertion of the … · 2019-09-03 · Molecular...

Molecular Dynamics Simulations of Folding and Insertion of the Ebola Virus Fusion Peptide into a
Membrane Bilayer Mark A. Olson1, In-Chul Yeh2, and Michael S. Lee1,3
1US Army Medical Research Institute of Infectious Diseases, Ft. Detrick, MD, USA 2Biotechnology High Performance Computing Software Applications Institute, Ft. Detrick, MD, USA
3US Army Research Laboratory, Aberdeen Proving Ground, MD, USA
Abstract - This paper presents replica-exchange molecular dynamics simulations of the folding and insertion of a 16-residue Ebola virus fusion peptide into a membrane bilayer. We applied a multi-resolution computational approach of modeling the peptide at the all-atom level and the membrane-aqueous bilayer by a generalized Born continuum approximation. We found that interfacial folding of the peptide is not required for membrane insertion and that regardless of the starting conformation (either folded or unfolded) the simulations of 20 ns converged to yield a conformational preference of forming an (i,i+4) backbone α-helical structure with the central residues embedded approximately 4-6 Å below the surface of the membrane and the two terminal charged residues exposed to the solvent layer. The conformational population distributions of the peptide and a possible folding/insertion pathway are discussed in terms of energy landscape theory.
Keywords: replica-exchange conformational sampling, generalized Born solvent models, free-energy landscape, virus-host interactions
1 Introduction Ebola and Marburg viruses are nonsegmented, negative-strand RNA viruses, which together constitute the family Filoviridae. The most pathogenic strain (Zaire) of Ebola virus causes a severe form of hemorrhagic fever in humans and nonhuman primates. Unlike many other viruses, the filoviruses contain a highly compact genome, consisting of only seven encoded proteins. Of the encoded proteins, the glycoprotein (GP) is responsible for receptor binding and membrane fusion, providing viral penetration into cells. GP is expressed as a single-chain precursor of 676 residues that is posttranslationally processed into disulfide-linked fragments GP1 (receptor-binding domain) and GP2 (transmembrane domain). Because of issues dealing with protein stability and crystallization conditions, known structures of GP are only of the GP2 ectodomain and lack the ‘‘fusion-peptide’’ region near the N terminus, which is thought to insert directly into the target membrane at an early stage in the membrane-fusion process. Very
recently, a NMR structure was reported of a 16-residue Zaire Ebola virus fusion peptide (Ebo-16) of GP2 [1]. To better understand the mechanics of GP-membrane fusion and viral entry at atomic-level detail, we report replica-exchange molecular dynamics (REMD) simulations of how the Ebo-16 peptide folds and inserts into a membrane bilayer. Our computational strategy is a multi-resolution approach of modeling the 16-residue peptide at the all-atom force-field level while the membrane is modeled by a mean-field approximation as a low-dielectric continuum and the aqueous layer by an implicit solvent model. We investigate the issue of whether interfacial folding of the peptide is required for efficient insertion into the membrane and determine the most probable conformational basins in configurational space of the folded structures. We will illustrate the results from the simulations using ideas of energy landscape theory.
2 Computational methods In this section, we first describe the modeling methods and simulation protocols used in this study. We then outline methods to estimate free energies and a clustering scheme to separate calculated structures into conformational basins.
2.1 Simulation models Molecular dynamics simulations were performed using the all-atom CHARMM 22 force field with CMAP modification for proteins [2,3]. The membrane is represented by an implicit membrane model based on a generalized Born Smoothing Window (GBSW) implicit solvent model [4]. Implicit membrane models have been successfully applied to study membrane-insertions of various model peptides [5,6]. The membrane thickness is modeled at 25 Å with a membrane smoothing length of 5 Å for transitioning the dielectric constant of εwtr = 80 for the aqueous layer to a dielectric constant of εmem = 1 for the membrane. Our treatment of the hydrophobic effect is based on a surface-area (SA) representation with a surface tension coefficient set to 0.04 kcal/(mol-Å2). Initial structures of the Ebo-16 peptide (residues GAAIGLAWIPYFGPAA) for simulations were modeled either as a fully extended conformation or the 310-helix structure from the determined by NMR [1]. These starting structures are illustrated in Fig. 1. The Z-axis is defined as
Presented at the 2008 International Conference on Bioinformatics and Computational Biology, July 14 – 17, 2008, Las Vegas, NV
660

an axis oriented parallel to the membrane normal with the membrane center as its origin so that the membrane thickness of 25 Å is bounded by two planes at Z = ± 12.5 Å. The Z-component of the center-of-mass (COM) position of the peptide with respect to the membrane center was calculated from the simulation trajectories. For monitoring the nucleation of α-helix structure formation, we applied the reaction coordinate corresponding to the distance between Cα atoms of residues 9 and 12. A time step of 2 fs was used in the REMD simulations. Langevin dynamics with a friction coefficient of 5.0 ps−1 was used for the temperature control. Covalent bonds between the heavy atoms and hydrogens were constrained by the SHAKE algorithm. Distances used for the onset of a switching function for non-bonded interaction, the cutoff for non-bonded interactions, and the cutoff for non-bonded list generation were 20, 22 and 25 Å, respectively. Additional constraints were placed on the peptide to prevent artificial hydrogen-bond interactions between the C-terminal and polar groups. Coordinates were saved at every 1 ps for further analysis. We performed REMD simulations [7] by running the CHARMM simulation program with the Multiscale Modeling Tools for Structural Biology [8]. Temperatures used for REMD simulations were 32 temperatures exponentially spaced over the range from 300 to 800 K. The exchange of the conformations in neighboring temperatures was attempted at every 500 time-steps (1 ps) according to the Metropolis criterion. Simulations for modeling peptide insertion were calculated for 20 ns and for modeling the peptide in aqueous solution without the membrane for 10 ns. The latter was used to calculate the transfer free energies of moving the peptide from solvent to the membrane interior.
2.2 Energy calculations and clustering Peptide conformational states interacting with the membrane are determined by minimum values of the free energy, G(ξ), found by exploring over all possible values of ξ on the energy landscape. We define G(ξ) as
conf confB conf( ) ( ) k ln ( ) ( ) ( ),G G T g G TSξ = ξ − ξ = ξ − ξ (1)
where conf ( )G ξ is the free energy of the most probable peptide conformation in state ξ taken at absolute temperature T, the function g(ξ) describes the multiplicity of conformations and determines the conformational entropy, Sconf, and kB is the Boltzmann constant. The free energy G(ξ) corresponds to an ensemble of conformations that collectively have some common subset of ξ, and thus are referred to as basins. Typical descriptors of basins are clusters of structures with similar conformational properties, such as atomic coordinate distances. The individual term Gconf is calculated for each conformation as the sum of the CHARMM22 force-field potential energy plus GBSW/SA solvent energy. In a similar fashion, the free energy for the
Figure 1. Starting conformations for replica-exchange molecular dynamics simulations. Membrane is modeled as an infinite plane in the x-y direction. The top figure is the unfolded Ebo-16 peptide structure and the bottom figure is the starting structure using the determined NMR conformation [1].
peptide in aqueous solution without the membrane is given by an equivalent sum of terms and is denoted as Gwtr. Culled conformations from the REMD simulations were clustered based on global pairwise atomic distances, measured as backbone coordinate root mean square deviations (RMSD). A clustering scheme was applied that includes an agglomerative approach with automatic stopping criteria [7]. To score the clusters, we took into account configurational entropy of populating a given basin and apply the following approximation
( )cluster conf,cluster wtr B clusterk ln ,G G G T M= − − (2)
where conf,clusterG is the average energy Gconf of structures
representing the peptide-membrane assembly in a RMSD cluster, M is the multiplicity of structures in a given cluster, and wtrG is the average energy of the free peptide in solvent.
3 Results and discussion 3.1 Simulation trajectories Illustrated in Fig. 2 are plots showing structural properties extracted from the REMD simulation trajectories for calculations starting from the unfolded and folded structures of Ebo-16. Properties as a function of simulation time include the Z-component of the COM position and the free-energy difference between each calculated peptide
25 Å
unfolded
folded
membrane
membrane
Presented at the 2008 International Conference on Bioinformatics and Computational Biology, July 14 – 17, 2008, Las Vegas, NV
661
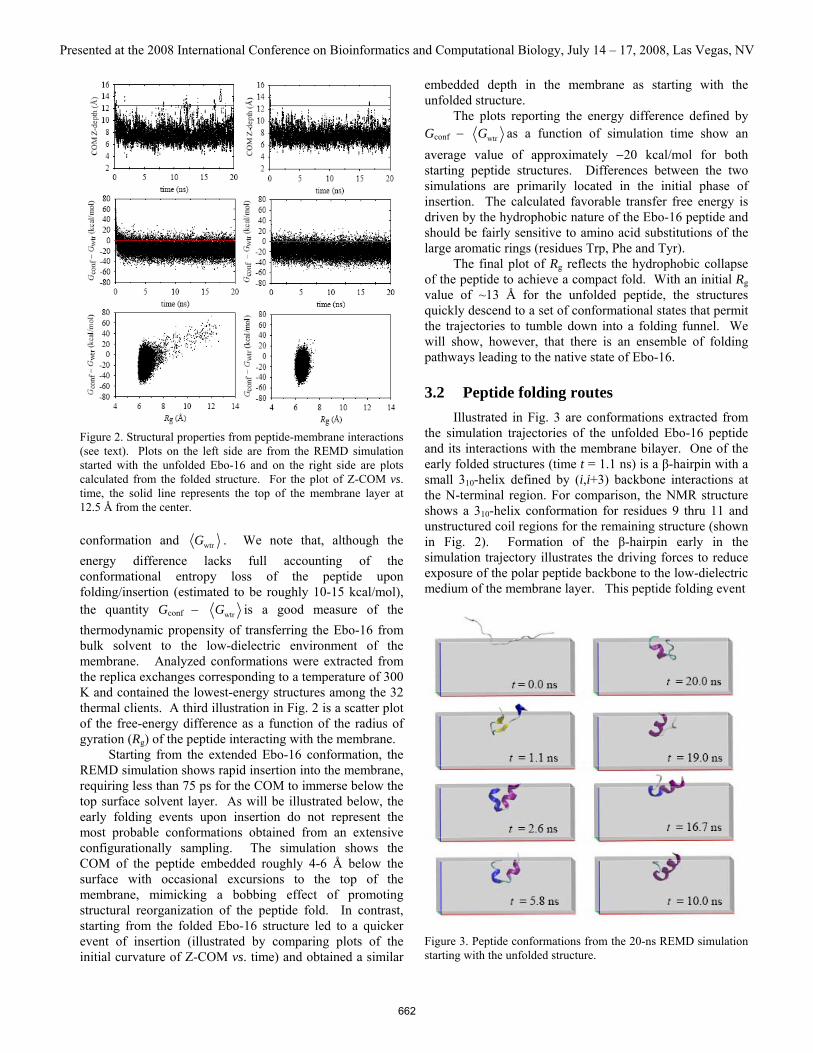
Figure 2. Structural properties from peptide-membrane interactions (see text). Plots on the left side are from the REMD simulation started with the unfolded Ebo-16 and on the right side are plots calculated from the folded structure. For the plot of Z-COM vs. time, the solid line represents the top of the membrane layer at 12.5 Å from the center.
conformation and wtrG . We note that, although the energy difference lacks full accounting of the conformational entropy loss of the peptide upon folding/insertion (estimated to be roughly 10-15 kcal/mol), the quantity Gconf − wtrG is a good measure of the thermodynamic propensity of transferring the Ebo-16 from bulk solvent to the low-dielectric environment of the membrane. Analyzed conformations were extracted from the replica exchanges corresponding to a temperature of 300 K and contained the lowest-energy structures among the 32 thermal clients. A third illustration in Fig. 2 is a scatter plot of the free-energy difference as a function of the radius of gyration (Rg) of the peptide interacting with the membrane. Starting from the extended Ebo-16 conformation, the REMD simulation shows rapid insertion into the membrane, requiring less than 75 ps for the COM to immerse below the top surface solvent layer. As will be illustrated below, the early folding events upon insertion do not represent the most probable conformations obtained from an extensive configurationally sampling. The simulation shows the COM of the peptide embedded roughly 4-6 Å below the surface with occasional excursions to the top of the membrane, mimicking a bobbing effect of promoting structural reorganization of the peptide fold. In contrast, starting from the folded Ebo-16 structure led to a quicker event of insertion (illustrated by comparing plots of the initial curvature of Z-COM vs. time) and obtained a similar
embedded depth in the membrane as starting with the unfolded structure. The plots reporting the energy difference defined by Gconf − wtrG as a function of simulation time show an average value of approximately −20 kcal/mol for both starting peptide structures. Differences between the two simulations are primarily located in the initial phase of insertion. The calculated favorable transfer free energy is driven by the hydrophobic nature of the Ebo-16 peptide and should be fairly sensitive to amino acid substitutions of the large aromatic rings (residues Trp, Phe and Tyr). The final plot of Rg reflects the hydrophobic collapse of the peptide to achieve a compact fold. With an initial Rg value of ~13 Å for the unfolded peptide, the structures quickly descend to a set of conformational states that permit the trajectories to tumble down into a folding funnel. We will show, however, that there is an ensemble of folding pathways leading to the native state of Ebo-16.
3.2 Peptide folding routes Illustrated in Fig. 3 are conformations extracted from the simulation trajectories of the unfolded Ebo-16 peptide and its interactions with the membrane bilayer. One of the early folded structures (time t = 1.1 ns) is a β-hairpin with a small 310-helix defined by (i,i+3) backbone interactions at the N-terminal region. For comparison, the NMR structure shows a 310-helix conformation for residues 9 thru 11 and unstructured coil regions for the remaining structure (shown in Fig. 2). Formation of the β-hairpin early in the simulation trajectory illustrates the driving forces to reduce exposure of the polar peptide backbone to the low-dielectric medium of the membrane layer. This peptide folding event
Figure 3. Peptide conformations from the 20-ns REMD simulation starting with the unfolded structure.
Presented at the 2008 International Conference on Bioinformatics and Computational Biology, July 14 – 17, 2008, Las Vegas, NV
662

is followed by converting the β-strands into a helical hairpin, whereby producing a fold that consists of an α-helix with (i,i+4) interactions packed against a 310-helix. Once the helical nature of the peptide is formed, the subsequent folding events consist of structural transitions within the population distribution of secondary structure among different peptide conformations. At t = 10.0 ns the conformation is an α-helix fold constructed of residues 2-12 and a small 310-helix turn near the C-terminal. Conformational reorganization takes place at t = 16.7 ns, showing a helical structure for residues 2-8 and a 310-helix for 9-11. These two latter conformations show an inserted peptide orientation with a tilt angle near the top membrane surface. The final conformation at t = 20.0 ns is a “U” shape configuration formed by interacting a short α-helix fold with the C-terminal coil region.
3.3 Reaction coordinate Given the multiple transitions observed in the simulation starting from the unfolded Ebo-16 peptide, we constructed a reaction coordinate to monitor helical formation. While there are many different reaction coordinates that can be applied, we chose the coordinate distance between Cα atoms of residue 9 and 12 (denoted by the notation rC). For comparison purposes, the starting folded structure from the NMR study shows a distance of rC =5.5 Å. Reported in Fig. 4 is the reaction coordinate calculated from the simulations imitated from the two Ebo-16 peptide structures interacting with the membrane bilayer. Starting with the unfolded peptide, which shows an initial value of rC = ~12 Å, the simulation at the early onset of folding finds conformational states at rC of 9-10 Å. The trajectory then lands at rC = ~8 Å followed by additional folding to a large manifold of states at rC = ~6 Å. Various further transitions take place that lead to added compactness of the peptide (rC = 4 Å) and then excursions are made to states that open up the fold. This is followed by revisits to nascent folded conformations. In contrast with the simulation started with the unfolded conformation, the folded Ebo-16 peptide shows considerable reduction of the repertoire of conformational states that are visited during the simulation trajectory. The principal manifold of states is located between rC = ~6 Å and ~5 Å. There are few contractions of the reaction coordinate and similarly there are only occasional jumps to more open conformations of the distance between residues 9 and 12. The membrane insertion initiated from the folded structure shows better agreement with the NMR conformation in terms of the envelope of rC values obtained from the trajectory, however, we will show that the propensity of secondary structure favors an (i,i+4) helix rather than the (i,i+3) conformation observed in the reported experimental determination [1].
Figure 4. Reaction coordinate defined for observing helical formation during peptide folding and insertion in the membrane bilayer as a function of the simulation time. The top plot is the simulation trajectory started from the unfolded Ebo-16 peptide and the bottom plot is the simulation started from the folded structure. The solid line at 5.5 Å corresponds to the NMR structure used as the initial folded peptide conformation.
3.4 Folding free-energy landscape Because of the multi-dimensional complexity of the trajectory data from the REMD simulations of modeling the folding and insertion of the Ebo-16 peptide into a membrane, we constructed two-dimensional probability density contour profiles. Figure 5 illustrates the computed profiles for both REMD simulations. The profiles are based on the reaction coordinate rC and the COM Z-depth. Projected onto these two coordinates is the transfer free energy Gconf − wtrG . To simplify the profiles, we emphasized only the most favorable basins by showing contours with energies that are more favorable than a value of −10 kcal/mol. Free energies greater than this threshold were culled into a single common energy bin. Peptide conformations extracted from the simulations corresponding to the basins were scored according to the free energy given in Eq. (2) and represent the most probable conformations. A total of 20,000 structures were analyzed.
Presented at the 2008 International Conference on Bioinformatics and Computational Biology, July 14 – 17, 2008, Las Vegas, NV
663
Residues 9 & 12 Cα−Cα distance (Å)5 6 7 8 9 10
CO
M Z
-dep
th (Å
)
4
6
8
10
12
14
Residues 9 & 12 Cα−Cα distance (Å)5 6 7 8 9 10
CO
M Z
-dep
th (Å
)
4
6
8
10
12
14Gcluster = 45 kcal/mol
Gcluster = −13 kcal/mol
Gcluster = −35 kcal/mol
Gcluster = −28 kcal/mol
Gcluster = −35 kcal/mol
Gcluster = −37 kcal/mol
Starting conformation
Gcluster = −20 kcal/mol
Gcluster = −24 kcal/mol
Gcluster = −39 kcal/mol
Gcluster = −32 kcal/mol
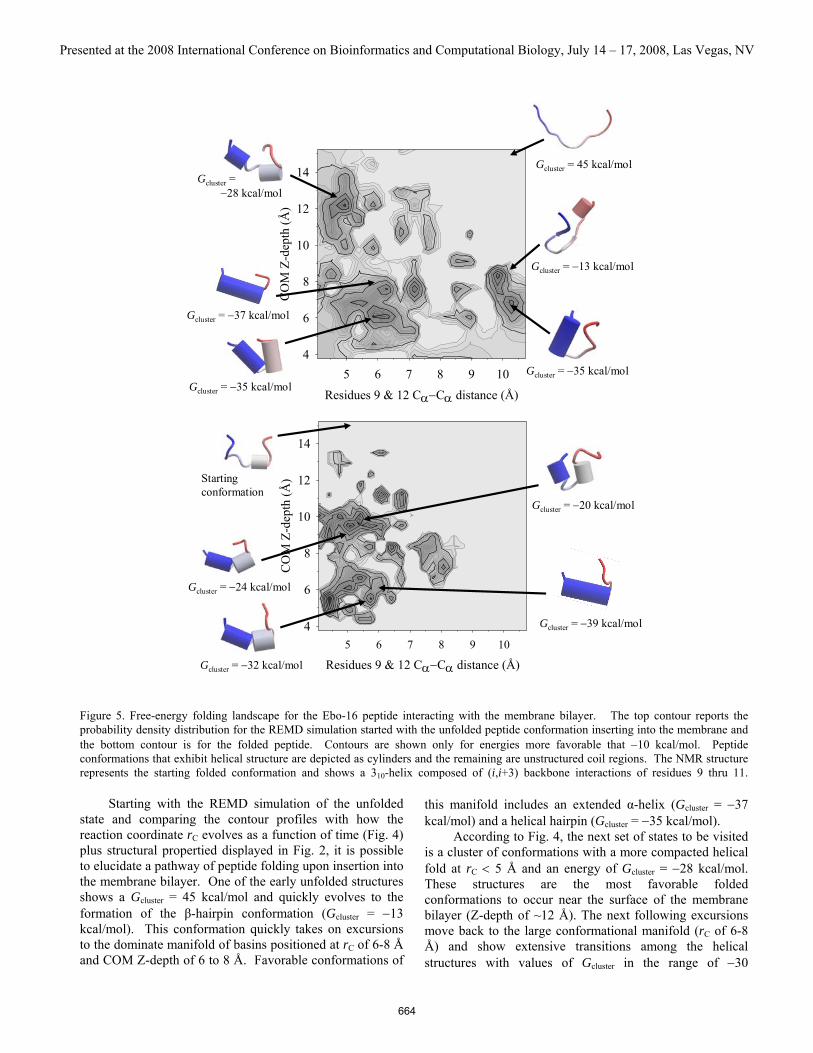
Figure 5. Free-energy folding landscape for the Ebo-16 peptide interacting with the membrane bilayer. The top contour reports the probability density distribution for the REMD simulation started with the unfolded peptide conformation inserting into the membrane and the bottom contour is for the folded peptide. Contours are shown only for energies more favorable that −10 kcal/mol. Peptide conformations that exhibit helical structure are depicted as cylinders and the remaining are unstructured coil regions. The NMR structure represents the starting folded conformation and shows a 310-helix composed of (i,i+3) backbone interactions of residues 9 thru 11.
Starting with the REMD simulation of the unfolded state and comparing the contour profiles with how the reaction coordinate rC evolves as a function of time (Fig. 4) plus structural propertied displayed in Fig. 2, it is possible to elucidate a pathway of peptide folding upon insertion into the membrane bilayer. One of the early unfolded structures shows a Gcluster = 45 kcal/mol and quickly evolves to the formation of the β-hairpin conformation (Gcluster = −13 kcal/mol). This conformation quickly takes on excursions to the dominate manifold of basins positioned at rC of 6-8 Å and COM Z-depth of 6 to 8 Å. Favorable conformations of
this manifold includes an extended α-helix (Gcluster = −37 kcal/mol) and a helical hairpin (Gcluster = −35 kcal/mol). According to Fig. 4, the next set of states to be visited is a cluster of conformations with a more compacted helical fold at rC < 5 Å and an energy of Gcluster = −28 kcal/mol. These structures are the most favorable folded conformations to occur near the surface of the membrane bilayer (Z-depth of ~12 Å). The next following excursions move back to the large conformational manifold (rC of 6-8 Å) and show extensive transitions among the helical structures with values of Gcluster in the range of −30
Presented at the 2008 International Conference on Bioinformatics and Computational Biology, July 14 – 17, 2008, Las Vegas, NV
664
kcal/mol. The most significant transitions involve the two conformations illustrated on the contour profile. The last cluster of states visited during the REMD simulation started with unfolded peptide is the basin located at rC ~10 Å and inserted at Z-depth of ~7 Å. Conformations extracted from these clusters reflect folded structures that contain more coil segments of the C-terminal region packed against the α-helix The free-energy landscape computed from the REMD simulation initiated with the folded structure reveals two major basins, both positioned at rC ~5-6 Å. The first visited basin during insertion is located is at COM Z-depth of ~10 Å and shows early transitions to conformations that exhibit helical hairpins followed by structures with a kink producing two separate helices. These structures then tumble down an energy funnel to yield structures that show transitions between an extended helix (Gcluster = −39 kcal/mol) and a broken helix (Gcluster = −32 kcal/mol).
4 Comparison with experiment A comparison between the most probable conformation from REMD simulations of the Ebo-16 peptide (determined as Gcluster = −37 kcal/mol for starting with the unfolded structure and Gcluster = −39 kcal/mol for the folded) and the structure derived from the reported NMR study [1] shows the calculations obtained the more thermodynamically stable helical conformation of (i,i+4) backbone interactions rather than the weaker (i,i+3). The RMSD value between the highest-ranked conformation from simulations and the experimental structure is roughly 3.3 Å. Differences are likely due to the low-dielectric environment of the implicit membrane model, which is thought to mimic dimyristoylphosphatidylcholine rather than sodium dodecyl sulfate micelles used in the NMR study. This dissimilarity in dielectric environments and their response to structural perturbations is expected to alter conformational preferences and the depth of peptide insertion [1]. 5 Conclusions We conducted ab initio molecular dynamics simulations of the folding and insertion of a 16-residue Ebola virus fusion peptide into a membrane bilayer. The results show that interfacial folding of the peptide is not required for membrane insertion. Consistencies among the most probable conformations were observed from REMD simulations started from either the unfolded conformation or the folded form. Using a free-energy approach to evaluate the conformations, we found that the highest ranked conformation is an extended helix of (i,i+4) backbone interactions for residues 2-12. Residues of the peptide helix are found inserted into the membrane with a Z-axis center-of-mass 4-6 Å below the surface. The highest ranked structures were observed to exhibit an orientation that shows a tilt angle respect to the membrane top surface and
the two terminal residues remained exposed to the solvent layer. While the REMD simulations started from the unfolded structure found similar favorable basins as those observed from simulations initiated from the folded peptide, the latter was more efficient in tumbling down the free-energy funnel towards the most probable conformations.
6 Acknowledgments We thank Dr. A. Wallqvist for helpful discussions on modeling peptide-membrane interactions. Financial support for this work comes from DTRA grant 4.10011_07_RD_B (awarded to MAO), from the Department of Defense High Performance Computing Modernization Program Office (HPCMO) and the Biotechnology High Performance Computing Software Applications Institute (BHSAI). The opinions or assertions contained herein are the private views of the authors and are not to be construed as official or as reflecting the views of the U. S. Army or of the U. S. Department of Defense. This paper has been approved for public release with unlimited distribution.
7 References [1] Freitas MS, Gaspar LP, Lorenzoni M, Almeida FC, Tinoco LW, Almeida MS, Maia LF, Degrève L, Valente AP, Silva JL. Structure of the Ebola fusion peptide in a membrane-mimetic environment and the interaction with lipid rafts. J. Biol. Chem., 282, 27306-27314, 2007. [2] Brooks BR, Bruccoleri RE, Olafson BD, States DJ, Swaminathan S, Karplus M. CHARMM: a program for macromolecular energy, minimization and dynamics calculations. J. Comp. Chem., 4:187-217, 1983. [3] Mackerell AD, Feig M, Brooks CL. Extending the treatment of backbone energetics in protein force fields limitations of gas-phase quantum mechanics in reproducing protein conformational distributions in molecular dynamics simulations. J. Comput. Chem., 25, 1400-1415, 2004. [4] Im W, Brooks CL. Interfacial folding and membrane insertion of designed peptides studied by molecular dynamics simulations. Proc. Natl. Acad. Sci. U.S.A., 102, 6771-6776, 2005. [5] Im W, Feig M, Brooks CL. An implicit membrane generalized Born theory for the study of structure stability and interactions of membrane proteins. Biophys. J., 85, 2900-2918, 2003. [6] Yeh I-Y, Olson MA, Lee MS, Wallqvist A. Free energy of membrane-insertion of the M2 transmembrane peptide from influenza A virus. Biophys. J. (submitted 2008). [7] Sugita Y, Okamoto Y. Replica-exchange molecular dynamics method for protein folding. Chem. Phys. Lett., 314, 141-151, 1999. [8] Feig M, Karanicolas J, Brooks CL. MMTSB Tool Set: enhanced sampling and multiscale modeling methods for applications in structural biology. J. Mol. Graph. Model., 22, 377-395, 2004.
Presented at the 2008 International Conference on Bioinformatics and Computational Biology, July 14 – 17, 2008, Las Vegas, NV
665

![[6] Atomic Simulations of Protein Folding, Using the Replica … · 2008. 9. 11. · [6] Atomic Simulations of Protein Folding, Using the Replica Exchange Algorithm By Hugh Nymeyer,S.Gnanakaran,](https://static.fdocuments.us/doc/165x107/5fc922344356a5585c13057a/6-atomic-simulations-of-protein-folding-using-the-replica-2008-9-11-6.jpg)