Mohammad Daliri Supervisor: Prof. Mariano BuccinoMohammad Daliri Supervisor: Prof. Mariano Buccino...
201
. A CFD STUDY ON THE STRUCTURAL RESPONSE OF A SLOPING TOP CAISSON SUBJECT TO WAVE OVERTOPPING Mohammad Daliri Supervisor: Prof. Mariano Buccino In partial fulfillment of the requirements for the Degree doctor of philosophy at The University of Napoli Federico II Department of Civil, Building and Environmental Engineering
Transcript of Mohammad Daliri Supervisor: Prof. Mariano BuccinoMohammad Daliri Supervisor: Prof. Mariano Buccino...
.
A CFD STUDY ON THE STRUCTURAL RESPONSE OF A SLOPINGTOP CAISSON SUBJECT TO WAVE OVERTOPPING
Mohammad Daliri
Supervisor: Prof. Mariano Buccino
In partial fulfillment of the requirements for the Degree doctor of philosophy atThe University of Napoli Federico II
Department of Civil, Building and Environmental Engineering

II
Acknowledgment
I would like to thank my supervisor, Professor Mariano Buccino, for the opportunity to work in
the exciting field of computational fluid dynamics. This thesis would not have been possible
without his help, unwavering support, reading materials and patience. I am grateful for his
guidance, concern and advice throughout these years.
I would like to thank my incredibly wonderful wife, Shadi. Thank you for your unconditional
love, understanding and sacrifice. Your love, continuous support and care have made this goal
possible.
My deepest gratitude goes to my family, my father Ali, my mother Fariba and my sisters Ensieh
and Hanieh, to whom I dedicate all the work done in these years. Their love and patience made
me stronger and more determined.
Last but not least, thanks to all my friend and colleges at University of Naples for their time and
friendship. I particularly wish to thank: Farhad bahmanpouri, Bikash maharaj and Natalino Di
Maio.

III
TABLE OF CONTENTS
ACKNOWLEDGMENT .............................................................................................. II
TABLE OF CONTENTS ............................................................................................III
LIST OF TABLES .................................................................................................. VII
LIST OF FIGURES .............................................................................................. VIII
LIST OF SYMBOLS ............................................................................................ XIX
ABSTRACT .................................................................................................. XXII
CHAPTER 1: INTRODUCION ...................................................................... 1
1.1 General introduction .......................................................................................... 1
1.2 Objective of the research ................................................................................... 6
1.3 Organization of the thesis .................................................................................. 7
CHAPTER 2: WAVE FORCES ON VERTICAL BREAKWATERS ……..9
2.1 Introduction ....................................................................................................... 9
2.2 Structural failure of caisson breakwaters due to wave loads .............................. 10
2.3 Classification of reasons for failures ................................................................ 13
2.3.1 Reasons inherent to the structure itself ................................................. 13
2.3.2 Reasons inherent to hydraulic conditions and loads .............................. 15
2.3.3 Geotechnical and other ’hidden’ progressive failures ........................... 17
IV
2.4 Design of caisson breakwaters ......................................................................... 18
2.4.1 Outline of design procedures and general considerations ..................... 18
2.4.2 Hydraulic performance ........................................................................ 20
2.5 Wave loading of caissons with plain front walls ............................................... 24
2.5.1 Wave load classification ...................................................................... 24
2.5.2 Wave Forces on vertical Walls ................................................................... 26
2.6 Wave impact theory .................................................................................................. 37
2.6.1 Theoretical model studies ................................................................... 37
2.6.2 Pressure-impulse theory for liquid impact problems............................. 38
CHAPTER 3: HYDRAULIC CHARACTERISTICS OF SLOPING TOPBREAKWATER ............................................................................................. 46
3.1 Introduction ..................................................................................................... 46
3.2 Brief review of sloping-top breakwater experience in Italy ............................... 47
3.3 Hydraulic characteristic of a sloping top breakwaters ....................................... 49
3.3.1 Wave force acting on loping top breakwater ......................................... 49
3.3.2 Wave transmission……………………………………………………..53
3.3.3 Wave reflection .................................................................................... 53
3.3.4 Wave overtopping ................................................................................ 54
3.4 Seaward wave loadings .................................................................................... 54
3.4.1 Evidence of Seaward Failures .............................................................. 55
3.4.2 Quasi-static loads ............................................................................... 56
3.4.3 Impulsive wave loads ........................................................................... 58
V
CHAPTER 4: NUMERICAL SETUP AND PRIMARY RESULTS ........ 66
4.1 Introduction ..................................................................................................... 66
4.2 Numerical model ............................................................................................. 67
4.2.1 Governing equations ............................................................................ 68
4.3 Numerical model validation ............................................................................. 68
4.4 Numerical model set-up ................................................................................... 71
4.4.1 Physics and fluids ................................................................................ 71
4.4.2 Meshing .............................................................................................. 73
4.4.3 Sensitivity analysis .............................................................................. 74
4.4.4 Boundary and initial conditions ........................................................... 76
4.4.5 Numerical simulations options............................................................. 78
4.5 Hydraulic performance of numerical simulation .............................................. 78
4.5.1 Waves and measurements .................................................................... 78
4.5.2 Wave reflection coefficient................................................................... 82
4.5.3 Wave overtopping ................................................................................ 85
CHAPTER 5: ANALYSIS OF WAVE LOADINGS ACTING ON SLOPINGTOP BREAKWATER ...................................................................................... 91
5.1 Introduction ................................................................................................... 105
5.2 Analysis of horizontal forces associated with the front face of the structure. 94
5.2.1 Wave shapes and loading features at the outer face ............................. 94
5.2.2 Statistical landward loading distribution ............................................. 98
5.2.3 Direction of the design force .............................................................. 102
VI
5.2.4 Global characteristics of horizontal wave loading ............................... 105
5.3 Effect of the transmitted wave field ................................................................ 114
5.3.1 Global characteristics of net wave loading .......................................... 121
5.4 Analysis of horizontal forces associated with the rear face of the structure … 136
5.4.1 Breaker-Type classification ................................................................ 137
5.4.2 Identification of Impulsive seaward loads mechanism ......................... 139
5.4.3 Impact pressure induced by wave overtopping and upward deflected...144
5.4.4 Impact pressure induced by generated plunging wave ........................... 156
5.4.5 Global characteristics of transmitted wave loadings ............................ 158
CHAPTER 6: COCLUSION ............................................................................... 164
LIST OF REFERENCES ................................................................................... 167

VII
LIST OF TABLES
1.1 Review of vertical breakwater failures………………………………………….....4
2.1 Reasons for the failures of vertical structures…………………………………....14
3.1 Parameters for the theory from the experimental study. (Walkden et.al 2001)......63
4.1 Values of convergences indicators.........................................................................76
4.2 Main statistics of generated sea states...................................................................79
4.3 Non-dimensional variables along with the sampling rate ................................ ...79
4.4 Impulsiveness parameter and predictions of existing overtopping formulae..... ...79
4.5 Loading cases observed during simulation............................................................98
5.1 statistical characteristics of non-dimensional maximum pressure-Front face…..119
5.2 statistical characteristics of non-dimensional maximum pressure-Rear face…...119
5.3 Average impulse by net force…………………………………………………...135
5.4 max, min and average of overtopping parameters shown in (Fig.5.80)…………..150
5.5 RMSE between measured pressure impulse and theoretical model alongwith corresponding overtopping parameters……………………………………152
5.6 Max, min and average of overflow depth indicated in Fig 5.100………………..160

VIII
LIST OF FIGURES
1.1 Typical layout of a harbor ……………………………………………………....1
1.2 Typical different types of vertical breakwaters [Oumeraci 1994 (a)]..................2
1.3 Composite breakwaters: (a) monolith concrete block; (b) block masonry; (c)cellar block; (d) upright caisson; (e) sloping top caisson; (t) perforated wallcaisson...................................................................................................................3
1.4 Overall failure modes of vertical breakwater: (a) sliding; (b) overturning; (c) and(d) settlement due to foundation failure. 1, Upright section; 2, rubble foundation(mattress); 3, slip surface........................................................................................5
1.5 Local failure modes of vertical breakwater: (a) erosion and/or punching failure ofrubble mattress at seaward and/or shoreward edges; (b) seabed scour and mattresserosion. 1. Upright section; 2 Rubble foundation (mattress); 3. Original profile ofseabed and rubble foundation; 4. Scour in front of the upright section; 5. Potentialfailure plane............................................................................................................6
2.1 Meandering failure of caisson .......................................................................... 12
2.2 Seaward tilt of vertical breakwaters. ................................................................. 15
2.3 Impulsive wave pressure. ................................................................................. 17
2.4 Flowchart of overall design procedure (adopted from Oumeraci et.al 2001)…..19
2.5 Nomograph for determining the factor =f(d/h) ................................................. 21
2.6 Reflection coefficients of vertical breakwaters. [From Tanimoto et al. (1987)…22
2.7 Violent wave overtopping at Samphire Hoe (picture courtesy of Eurotunneland the White Cliffs Countryside Project). ....................................................... 23
2.8 Parameter map for classification of loading case (Oumeraci 2001) ................... 25
IX
2.9 Standing wave on a vertical wall ...................................................................... 26
2.10 Simplified Sainflou wave pressure diagram ..................................................... 27
2.11 Minikin wave pressure diagram on vertical wall............................................... 29
2.12 Three basic type of impulsive pressure. (From Takahashi et.al. 1994) .............. 30
2.13 Wave pressure diagram in accordance with the Hiroi pressure formula ……….31
2.14 Wave pressure diagram in accordance with the Goda pressure formula … … . . 33
2.15 The sketch of pressure against time - Pressure impulse definition......... … … . . 38
2.16 The sketch of a coastal wave impact. ........................................................ .......41
2.17 The impact of a rectangle of fluid on a vertical wall at x = 0. The impactzone stretches from the top free surface, part-way down the wall, occupyinga fraction of water height, H. The back of the wave at x = b is a free surfacewith P = 0. Image taken from Cooker Peregrine (1985) ................................... 41
2.18 Standard result for non-dimensional pressure impulse Cooker and peregrinemodel for varying with b=2 and H=1. ............................................................. 43
2.19 The pressure impulse on the wall,P=(0,y) for =0.1,0.25,0.5,0.75 and 1.0.The maximum pressure is 0.742U0Hwhen = 1andoccursaty = −1.......................44
2.20 The pressure impulse on the seabed,P=(x,-1) for =0.1,0.25,0.5,0.75 and 1.0…...45
3.1 Niigata port (japan).......................................................................................... 46
3.2 Cross-section of Italian caisson breakwaters with various superstructure……...48
3.3 Different parapet types tested for the Civitavecchia caisson breakwater. ……... 48
3.4 Current design method for sloping op caisson. Image taken from Takahashiet.al 1994 ......................................................................................................... 50
3.5 Wave force acting on the slope. Image taken from Takahashi et.al 1994……….50
X
3.6 Typical cross sections of sloping top breakwaters used in model tests. Taka-hashi et al. (1994). ........................................................................................... 51
3.7 Transmission coefficient for sloping top breakwaters. [From Takahashi etal. (1994).] ...................................................................................................... 53
3.8 Reflection coefficient for sloping top breakwaters. [From Takahashi et al. (1994).]54
3.9 Design diagram for onshore and offshore wave forces by Goda (1967)..............57
3.10 Experimental model arrangement [Walkden et.al (2001)]...................................58
3.11 (a) Trough arriving at the front face (0.2 s). (b) The jet passes over thesuperstructure causing a high landward load (0.75 s). (c) The jet plungesinto the harbor, trapping a pocket of air (0.82 s). (d) Water level rises at therear face and lowers at the front (0.95 s). ......................................................... 59
3.12 Horizontal forces during the overtopping events shown in Figure 3.11, pos-itive forces are landward. ................................................................................. 60
3.13 Body of water impacting on a still water level and respective boundaryvalue problem. ................................................................................................. 61
3.14 Results for non-dimensional pressure impulse induced by block of water impact-Cooker and peregrine (1995) model. ................................................................ 61
3.15 Distribution of pressure impulse induced by block of water impact overwidth of overtopping ....................................................................................... 62
3.16 Distribution of pressure impulse induced by block of water impact along b. . . . 62
3.17 Total non-dimensional impulse against ba, for impact on a solid body by arectangular block of water- Heavy black line: Walkden et.al (2001). Dottedline: After recalculation ................................................................................... 63
3.18 Pressure impulse problem behind the breakwater ............................................. 64
3.19 (a, b and c) Pressure impulse on the back of the caisson for waves A, Band C, respectively. Crosses denote values measured with the rear facetransducers, the broken lines represent the pressure impulse on the wall

XI
when P(air pocket) = 0, and the solid lines the predictions corrected forthe presence of the air pocket (Eq. (5)). (Walkden et.al 2001) .......................... 64
4.1 Sketch of the SSG model. Dimensions in mm. (Buccino et.al 2015) ................ 69
4.2 The foreshore with the location of the SSG. Dimensions in m. (Buccinoet.al 2015) ....................................................................................................... 69
4.3 The model of the SSG and the bathymetry in Flow 3D. (Buccino et al., 2016)...70
4.4 Numerical vs. physical chronograms of horizontal force (Test 6- Buccinoet al., 2016) ..................................................................................................... 70
4.5 A sketch of the experimental setup. .................................................................. 71
4.6 The view of computational domain in the Flow3D ........................................... 74
4.7 A close view of detailed meshing- Purple circles stand for PressureTransducers ..................................................................................................... 75
4.8 Force time series for different grid size ............................................................ 75
4.9 Geometry and boundary conditions of sloping top breakwater model ............... 77
4.10 Incident and reflected waves separated via the Zelt and Skjelbreia (1992)method.Test 1C................................................................................................ 80
4.11 Spectral density of incident and reflected waves. Test 1C ................................. 81
4.12 Force positions of pressure transducers and wave probes ................................. 81
4.13 Comparison between reflection coefficients reported by Takahashi et.al (1994) andnumerical simulation ....................................................................................... 83
4.14 Comparison between reflection coefficients reported by Calabrese and All-sop (1998) and numerical simulation ............................................................... 84
4.15 Wave reflection coefficient for sloping top breakwater predicted by Eq.4.5 ....... 85
4.16 Location and geometrical definitions for calculation of overtopping ................. 85
4.17 chorogram of the overtopping discharge for test 1A ......................................... 86

XII
4.18 Comparison of cumulative overtopping rate between Test 1A and Test 2A.........86
4.19 A non-impulsive (pulsating) wave condition at a vertical wall. (EurOtop2007).87
4.20 An impulsive (breaking) wave condition at a vertical wall. (EurOtop 2007). . . . . .87
4.21 Dimension of l’ in sloping top caisson.................................................................89
4.22 Comparison of numerical model result for mean overtopping discharge withempirical formuls................................................................................................ 90
5.1 Trapezoidal (left panel) and Rectangular (right panel) methods for calcula-tion of force..........................................................................................................91
5.2 Comparison of horizontal force signal at the wall for the tests 1A and 4A….. . .92
5.3 Comparison of horizontal force signal at the wall for the tests 2A and 3A…... .92
5.4 Example of the broken event (Test 1A). ........................................................... 93
5.5 Time history of the horizontal force for the event of Figure (5.4) ...................... 95
5.6 Example of the impact event (Test 1A). ........................................................... 95
5.7 Time history of the horizontal force for the event of Figure (5.6) ...................... 96
5.8 Example of the broken event (Test 3B)............................................................. 97
5.9 Time history of the horizontal force for the event of Figure (5.8) ...................... 97
5.10 Weibull plot and histogram for horizontal force -Test 1A ................................. 99
5.11 Weibull plot and histogram for horizontal force rise time -Test 1A ................. 100
5.12 Weibull plot and histogram for horizontal force -Test 1B................................ 100
5.13 Weibull plot and histogram for horizontal force rise time -Test 1B ................. 100
5.14 Weibull plot and histogram for horizontal force -Test 2A ............................... 101
5.15 Weibull plot and histogram for horizontal force rise time -Test 2A ................. 101

XIII
5.16 Weibull plot and histogram for horizontal force -Test 2C................................ 101
5.17 Weibull plot and histogram for horizontal force rise time -Test 2C ................. 102
5.18 Pressure impulse and distribution of pressure at the peak of forces for theevent shown in Figure (5.4) ........................................................................... 102
5.19 (a) Wave pressure distribution at the force peak of Figure (5.18); (b) timehistory of the wave pressure at the location of the maximum in the distribu-tion; (c) zoom of the time history (b), close to the peak. ................................. 103
5.20 Pressure impulse and distribution of pressure at the peak of forces for theevent shown in Figure (5.6) ........................................................................... 104
5.21 Pressure impulse and distribution of pressure at the peak of force for theevent shown in Figure (5.8) ........................................................................... 105
5.22 Maximum recorded wave force vs Takahashi et.al (1994). Only wave loading onthe outer face are considered..............................................................................106
5.23 Comparison between Takahashi et al. predictions and experimental force peaksafter smoothing the breaking induced peaks. .................................................. 107
5.24 Maximum recorded wave force after smoothing vs Takahashi et.al (1994).....107
5.25 Non-dimensional maximum landward load vs steepness. (Left panel) Beforesmoothing. (Right panel) After smoothing........................................................108
5.26 Minimum safety factor associated with the landward load (wave crest) vs wavesteepness. (Left panel) Before smoothing. (Right panel) After smoothing.......109
5.27 Percentage when seaward load exceeds landward load vs relative water depth.(Left panel) Before smoothing. (Right panel) After smoothing........................109
5.28 The ratio between maximum landward loads to maximum seaward load. (Leftpanel) Before smoothing. (Right panel) After smoothing.................................110
5.29 The ratio between average landward loads to average seaward load. (Left panel)Before smoothing. (Right panel) After smoothing............................................111
5.30 Non-dimensional maximum seaward load vs steepness. (Left panel) Beforesmoothing. (Right panel) After smoothing........................................................111
XIV
5.31 Maximum trough force vs predictions of Goda graphical model......................112
5.32 Maximum trough force vs predictions of Sainflou model................................112
5.33 Variation of ratio between Goad forces to maximum seaward force against relativewater depth...........................................................................................113
5.34 Variation of ratio between Sainflou forces to maximum seaward force againstrelative water depth...........................................................................................113
5.35 An example of wave forces in test 1A. (a) Time history of wave loading on frontface of the caisson. (b) Time history of wave loading at rear face of the caisson.(c) Net force......................................................................................................115
5.36 Maximum net landward and net seaward load for each cycle. Test 1A...........116
5.37 Maximum net landward and net seaward load for each cycle. Test 2B...........116
5.38 Maximum net landward and net seaward load for each cycle. Test N2...........117
5.39 Safety factor calculated by Net force for each cycle. Test 1A.........................117
5.40 Safety factor calculated by Net force for each cycle. Test 2B.........................117
5.41 Safety factor calculated by Net force for each cycle. Test N2.........................118
5.42 Maximum pressure measured on the front face (at the peak of force) as a functionof the relative water depth................................................................................119
5.43 Maximum pressure measured at the rear face (at the peak of force) as a function ofthe relative water depth................................................................................120
5.44 Seaward directed (trough) force peak calculated at the front face vs total force peakincluding loadings generated by wave overtopping.................................121
5.45 Landward directed (crest) force peak calculated at the front face vs total force peakincluding loadings generated by wave overtopping.................................122
5.46 Percentage when Net seaward load exceeds Net landward load vs relative waterdepth..................................................................................................................123
5.47 Percentage of the failure due to Net landward load vs wave steepness............123
XV
5.48 Percentage of the failure due to Net seaward load vs wave steepness..............124
5.49 Minimum safety factor against Net landward load vs wave steepness. (Left panel)Before smoothing. (Right panel) After smoothing............................................124
5.50 Minimum safety factor against Net seaward load vs relative wave depth. (Leftpanel) Goda seaward load. (Right panel) Sainflou seaward load....................125
5.51 Uplift force on sloping top caisson under overtopping conditions..................126
5.52 Example of sliding force signal (smoothed).Test 2A......................................127
5.53 Maximum landward sliding force vs maximum seaward (Smoothed signals)127
5.54 Maximum landward sliding force (front face) vs maximum total landward slidingforce (Smoothed signals).................................................................................128
5.55 Maximum seaward sliding force (front face) vs maximum total seaward slidingforce (Smoothed signals).................................................................................128
5.56 Minimum safety factor against landward sliding. Left panel: front face. Rightpanel: net force (Smoothed signals).................................................................129
5.57 Minimum safety factor against seaward sliding. Left panel: front face. Right panel:net force (Smoothed signals)............................................................................129
5.58 Maximum total landward load predicted by Eq.5.4 - (Smoothed signals).......131
5.59 Maximum landward load (front face) predicted by Eq.5.4- (Smoothedsignals)............................................................................................................. 131
5.60 Maximum total seaward load predicted by Eq.5.4 - (Smoothed signals).........132
5.61 Maximum seaward load (front face) predicted by Eq.5.4- (Smoothedsignals)..............................................................................................................132
5.62 Maximum total landward sliding force predicted by Eq.5.4- (Smoothedsignals)............................................................................................................. 133
5.63 Maximum landward sliding force (front face) predicted by Eq.5.4 - (Smoothedsignals)..............................................................................................................133

XVI
5.64 Maximum total seaward sliding force predicted by Eq.5.4- (Smoothedsignals)..............................................................................................................134
5.65 Maximum seaward sliding force (front face) predicted by Eq.5.4 - (Smoothedsignals)..............................................................................................................134
5.66 Variation of average net impulse per cycle as a function of Eq.5.4..................135
5.67 Failure due to excessive overtopping via seaward tilt.......................................137
5.68 Breaker classification (Oumeraci et.al.1993)....................................................137
5.69 Temporal and Spatial Pressure Distribution for Breaker Types in Fig. 5.68(Oumeraci et.al.1993)........................................................................................139
5.70 An example of impact pressure induced by wave overtopping, phase I.(Test 1A)............................................................................................................140
5.71 An example of impact pressure induced by upward deflected, phase II.(Test 1A)............................................................................................................141
5.72 An example of impact pressure induced by successive plunging jet, phase III.(Test 3A)............................................................................................................143
5.73 Time history of force during event shown in Fig. 5.70.....................................144
5.74 Time series of force on the back of the breakwater along with correspondingframes for event shown in Fig.5.70...................................................................145
5.75 Time series of force on the back of the breakwater along with distribution ofpressures for event shown in Fig. 5.70..............................................................146
5.76 Seaward directed loads induced by front wave trough and rear impulsiveload....................................................................................................................146
5.77 Time series of force on the back of the breakwater along with correspondingframes, pressure distribution and pressure impulse at the peak of force for eventshown in Fig. 5.71.............................................................................................147
5.78 Time series of force on the back of the breakwater along with correspondingframes-Test 4A..................................................................................................148

XVII
5.79 Time series of force on the back of the breakwater along with distribution ofpressures-Test 4A..............................................................................................149
5.80 Overtopping parameters used for theoretical model.........................................150
5.81 Variation of aavg/Lp vs w ave reflection coefficient..........................................151
5.82 Variation of bavg/Lp vs wave reflection coefficient...........................................151
5.83 Variation of davg/Lp vs wave reflection coefficient...........................................151
5.84 Pressure impulse on the back of the caisson for Test 1A. Left panel: Max RMSE.Right panel: Min RMSE...................................................................................153
5.85 Pressure impulse on the back of the caisson for Test 1B. Left panel: Max RMSE.Right panel: Min RMSE...................................................................................153
5.86 Pressure impulse on the back of the caisson for Test 1C. Left panel: Max RMSE.Right panel: Min RMSE...................................................................................153
5.87 Pressure impulse on the back of the caisson for Test 2A. Left panel: Max RMSE.Right panel: Min RMSE...................................................................................154
5.88 Pressure impulse on the back of the caisson for Test 2A. Left panel: Max RMSE.Right panel: Min RMSE...................................................................................154
5.89 Pressure impulse on the back of the caisson for Test 2C. Left panel: Max RMSE.Right panel: Min RMSE...................................................................................154
5.90 Pressure impulse on the back of the caisson for Test N1. Left panel: Max RMSE.Right panel: Min RMSE...................................................................................155
5.91 Pressure impulse on the back of the caisson for Test N2. Left panel: Max RMSE.Right panel: Min RMSE...................................................................................155
5.92 Pressure impulse on the back of the caisson for Test 3A. Left panel: Max RMSE.Right panel: Min RMSE...................................................................................155
5.93 Pressure impulse on the back of the caisson for Test 3B. Left panel: Max RMSE.Right panel: Min RMSE...................................................................................156
5.94 Pressure impulse on the back of the caisson for Test 4A. Left panel: Max RMSE.
XVIII
Right panel: Min RMSE...................................................................................156
5.95 Time series of force on the back of the breakwater along with frames, distributionof pressures and pressure impulse at the peak of most violent force-Test 2A..............................................................................................................157
5.96 Time histories of force generated by plunging wave. Left panel: with aircontribution. Right panel: without air contribution..........................................158
5.97 Maximum non-dimensional impact load due to overtopping vs wave reflectioncoefficient.........................................................................................................158
5.98 Average non-dimensional impact load due to overtopping vs wave reflectioncoefficient.........................................................................................................159
5.99 Minimum safety factor against impact load due to overtopping vs wavesteepness...........................................................................................................159
5.100 The instant when overflow depth has been measured.....................................160
5.101 Maximum non-dimensional impact load due to upward deflected vs liner thrustparameter..........................................................................................................161
5.102 Average non-dimensional impact load due to upward deflected vs liner thrustparameter..........................................................................................................161
5.103 Minimum safety factor against impact load due to upward deflected vs wavesteepness...........................................................................................................162
5.104 Maximum non-dimensional impact load due to plunging wave vs relativefreeboard...........................................................................................................163
5.105 Average non-dimensional impact load due to plunging wave vs relativefreeboard...........................................................................................................163
5.106Minimum safety factor against impact load due to plunging wave vs wavesteepness...........................................................................................................163
XIX
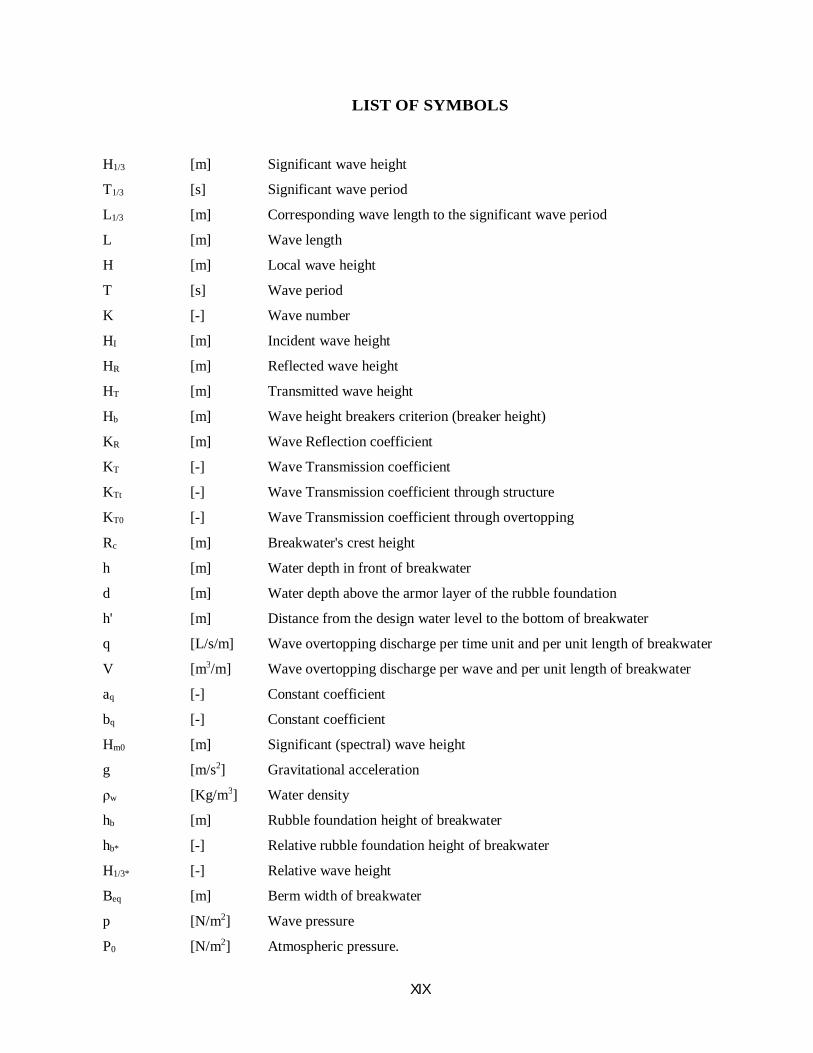
LIST OF SYMBOLS
H1/3 [m] Significant wave height
T1/3 [s] Significant wave period
L1/3 [m] Corresponding wave length to the significant wave period
L [m] Wave length
H [m] Local wave height
T [s] Wave period
K [-] Wave number
HI [m] Incident wave height
HR [m] Reflected wave height
HT [m] Transmitted wave height
Hb [m] Wave height breakers criterion (breaker height)
KR [m] Wave Reflection coefficient
KT [-] Wave Transmission coefficient
KTt [-] Wave Transmission coefficient through structure
KT0 [-] Wave Transmission coefficient through overtopping
Rc [m] Breakwater's crest height
h [m] Water depth in front of breakwater
d [m] Water depth above the armor layer of the rubble foundation
h' [m] Distance from the design water level to the bottom of breakwater
q [L/s/m] Wave overtopping discharge per time unit and per unit length of breakwater
V [m3/m] Wave overtopping discharge per wave and per unit length of breakwater
aq [-] Constant coefficient
bq [-] Constant coefficient
Hm0 [m] Significant (spectral) wave height
g [m/s2] Gravitational acceleration
ρw [Kg/m3] Water density
hb [m] Rubble foundation height of breakwater
hb* [-] Relative rubble foundation height of breakwater
H1/3* [-] Relative wave height
Beq [m] Berm width of breakwater
p [N/m2] Wave pressure
P0 [N/m2] Atmospheric pressure.

XX
pu [N/m2] Uplift pressure acting at the bottom
Fu [N/m] Uplift force acting at the bottom
ho [m] Height of the clapotis orbit center above the still water
F [Kg.m.s-2] Horizontal wave force
FSH [Kg.m.s-2] Horizontal wave force acting on sloping top breakwater
FSV [Kg.m.s-2] Vertical wave force acting on sloping top breakwater
ω0 [Kgm-2s-2] Specific weight of water
α [-] Constant coefficient
β' [-] Coefficient used to calculate wave transmission
β [-] wave attacking angle
δ [-] wave curvature angle
km [-] Added mass correction factor
kl [-] Impulsive height coefficient
ka [-] Air thickness coefficient
γ [-] Specific heat ratio
ϕ [-] Angle between the direction of wave approach and a line normal to the breakwater
λ1 λ2 and λ3 [-] Modification factors
αl [-] Impulsive pressure coefficient
B [-] Berm width of breakwater
Csw [m/s] Wave celerity in shallow water
θ', ξ and µ' [-] Scale shape
ta [s] Time just before wave impact
tb [s] Time just after wave impact
P [Nsm-2] Pressure impulse
U0 [m/s] Normal component of impact velocity
µ [-] Occupying a fraction of water height
µs [-] Structure-bottom friction factor
dc [m] Distance from design water level to the lowest point of the slope
θ [-] Sloping top angle
FU [N/m] Uplift force
λSL' and λV [-] Modification factors
Vov [m/s] Downward velocity of block of water
a [m] Width of block of water
b [m] Height of block of water
d [m] Length of trapped air area

XXI
pvap [N/m2] Gas pressure
Psat(Tv) [N/m2] Saturation pressure at the local temperature
RF2 [-] Gas constant
ρv [Kg/m3] Gas density
Tv [°C] Gas temperature
RSIZE [-] Accommodation coefficient

XXII
ABSTRACT
Vertical breakwaters are frequently employed for the protection of harbors in many
areas around the world. Their success is due to the fact that they represent, especially in
relatively deep water, a better alternative in terms of performances, construction speed, and
maintenance costs compared to traditional rubble mound breakwaters. However, they have
suffered in the past from severe damage caused by storms, which have led, in some cases,
to catastrophic failures. In such seas, where the large wave heights generate tremendous
wave forces acting on the breakwaters, a monolithic structure expressly designed to face
rough seas is the so-called sloping top caisson. A sloping top caisson has a superstructure
that is sloped to reduce the wave forces, i.e., the downward forces on the slope cancel the
uplift pressure, thereby reducing the wave pressure on the upright wall. Although this
approach may seem rational, Walkden el al., (2001) warned that, while decreasing the
landward thrust, a large amount of overtopping may cause strong seaward directed
impulsive loadings. During an extremely small set of physical experiments (3 tests only)
conducted on a small scale model of a Hanstholm type breakwater, the authors measured
rear pressure peaks so intense to lead to a seaward sliding force 40 percent larger than the
landward one. In this study, the role of air contribution was significantly highlighted. After
that pioneering study, however, the nature of the overtopping generated impacts has
surprisingly not deepened further. Despite sloping top breakwater has long been used in
the engineering practice (the first was constructed in Naples, Italy, in 1906), detailed reports
on their structural response are very few. In 1994, Takahashi et al. proposed a prediction
method to calculate wave force under the crest phase, which modifies the well-known Goda
formula for vertical walls. The method is based on few regular wave experiments and, at the
author knowledge, has been not further verified. The present thesis discusses main results
of a numerical investigation conducted with the aim to have a deeper insight on the
structural response of the sloping top caissons subjected to wave overtopping. A
XXIII
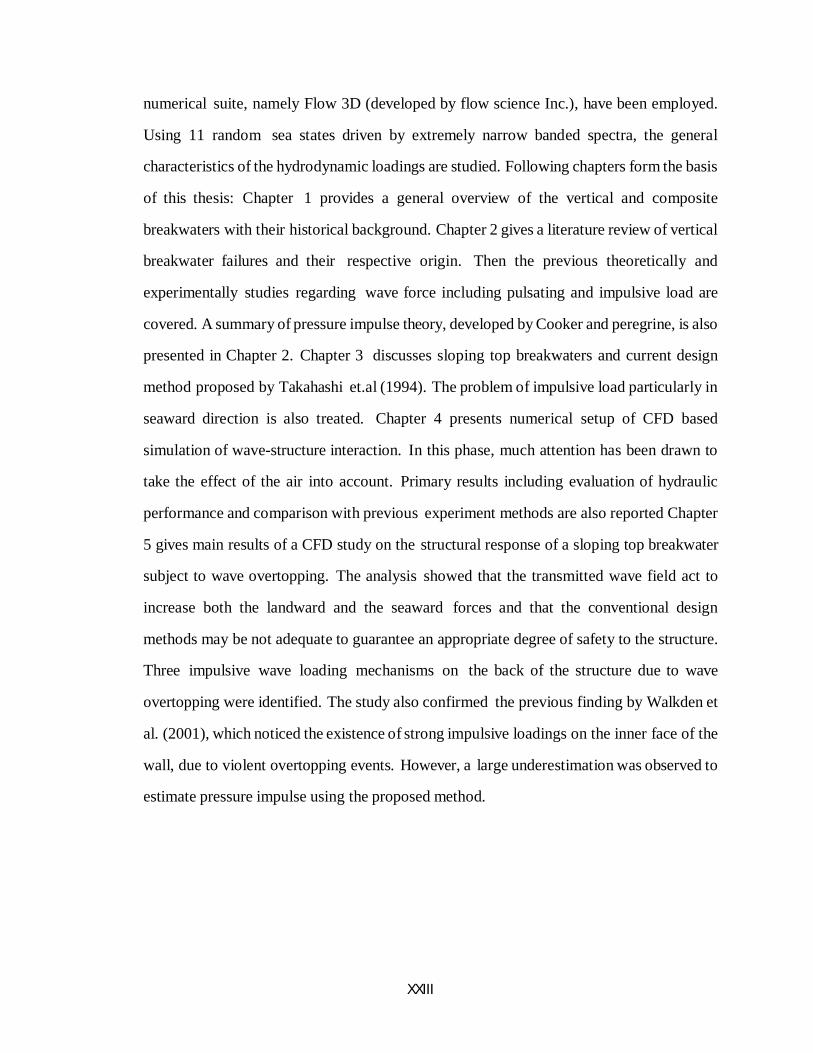
numerical suite, namely Flow 3D (developed by flow science Inc.), have been employed.
Using 11 random sea states driven by extremely narrow banded spectra, the general
characteristics of the hydrodynamic loadings are studied. Following chapters form the basis
of this thesis: Chapter 1 provides a general overview of the vertical and composite
breakwaters with their historical background. Chapter 2 gives a literature review of vertical
breakwater failures and their respective origin. Then the previous theoretically and
experimentally studies regarding wave force including pulsating and impulsive load are
covered. A summary of pressure impulse theory, developed by Cooker and peregrine, is also
presented in Chapter 2. Chapter 3 discusses sloping top breakwaters and current design
method proposed by Takahashi et.al (1994). The problem of impulsive load particularly in
seaward direction is also treated. Chapter 4 presents numerical setup of CFD based
simulation of wave-structure interaction. In this phase, much attention has been drawn to
take the effect of the air into account. Primary results including evaluation of hydraulic
performance and comparison with previous experiment methods are also reported Chapter
5 gives main results of a CFD study on the structural response of a sloping top breakwater
subject to wave overtopping. The analysis showed that the transmitted wave field act to
increase both the landward and the seaward forces and that the conventional design
methods may be not adequate to guarantee an appropriate degree of safety to the structure.
Three impulsive wave loading mechanisms on the back of the structure due to wave
overtopping were identified. The study also confirmed the previous finding by Walkden et
al. (2001), which noticed the existence of strong impulsive loadings on the inner face of the
wall, due to violent overtopping events. However, a large underestimation was observed to
estimate pressure impulse using the proposed method.

XXIV
Chapter 1. Introduction
1
CHAPTER 1
INTRODUCTION
1.1 General introduction
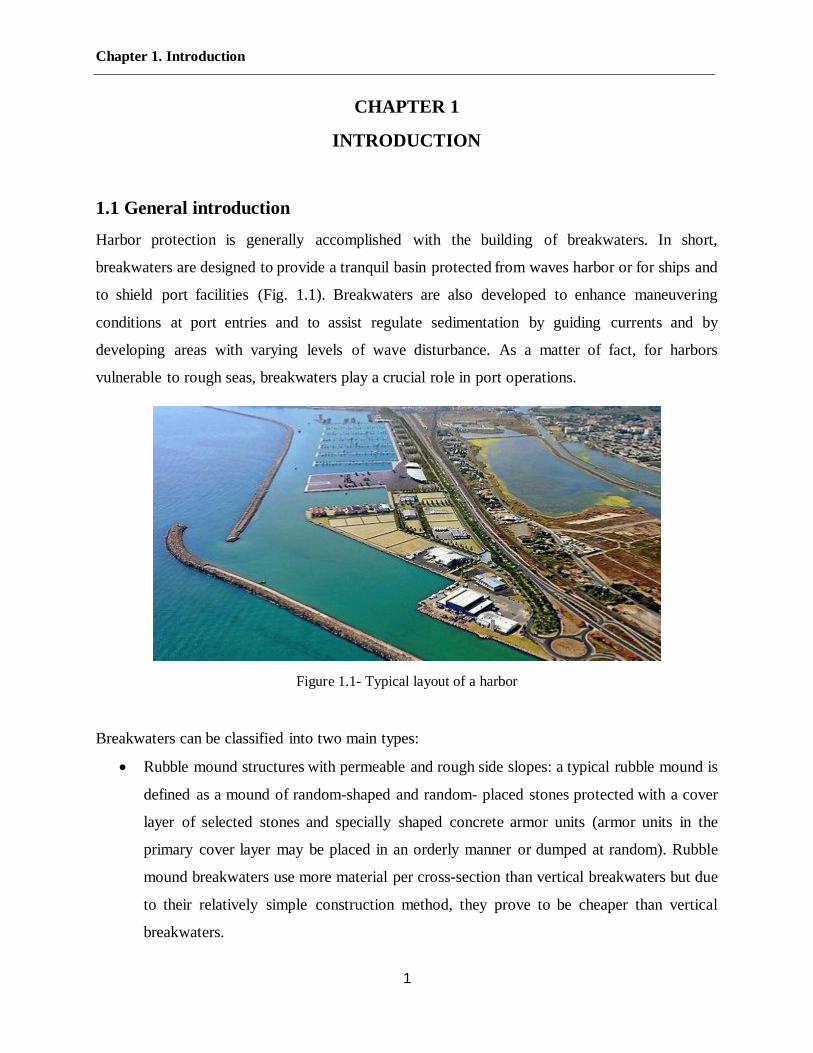
Harbor protection is generally accomplished with the building of breakwaters. In short,
breakwaters are designed to provide a tranquil basin protected from waves harbor or for ships and
to shield port facilities (Fig. 1.1). Breakwaters are also developed to enhance maneuvering
conditions at port entries and to assist regulate sedimentation by guiding currents and by
developing areas with varying levels of wave disturbance. As a matter of fact, for harbors
vulnerable to rough seas, breakwaters play a crucial role in port operations.
Figure 1.1- Typical layout of a harbor
Breakwaters can be classified into two main types:
· Rubble mound structures with permeable and rough side slopes: a typical rubble mound is
defined as a mound of random-shaped and random- placed stones protected with a cover
layer of selected stones and specially shaped concrete armor units (armor units in the
primary cover layer may be placed in an orderly manner or dumped at random). Rubble
mound breakwaters use more material per cross-section than vertical breakwaters but due
to their relatively simple construction method, they prove to be cheaper than vertical
breakwaters.
Chapter 1. Introduction
2
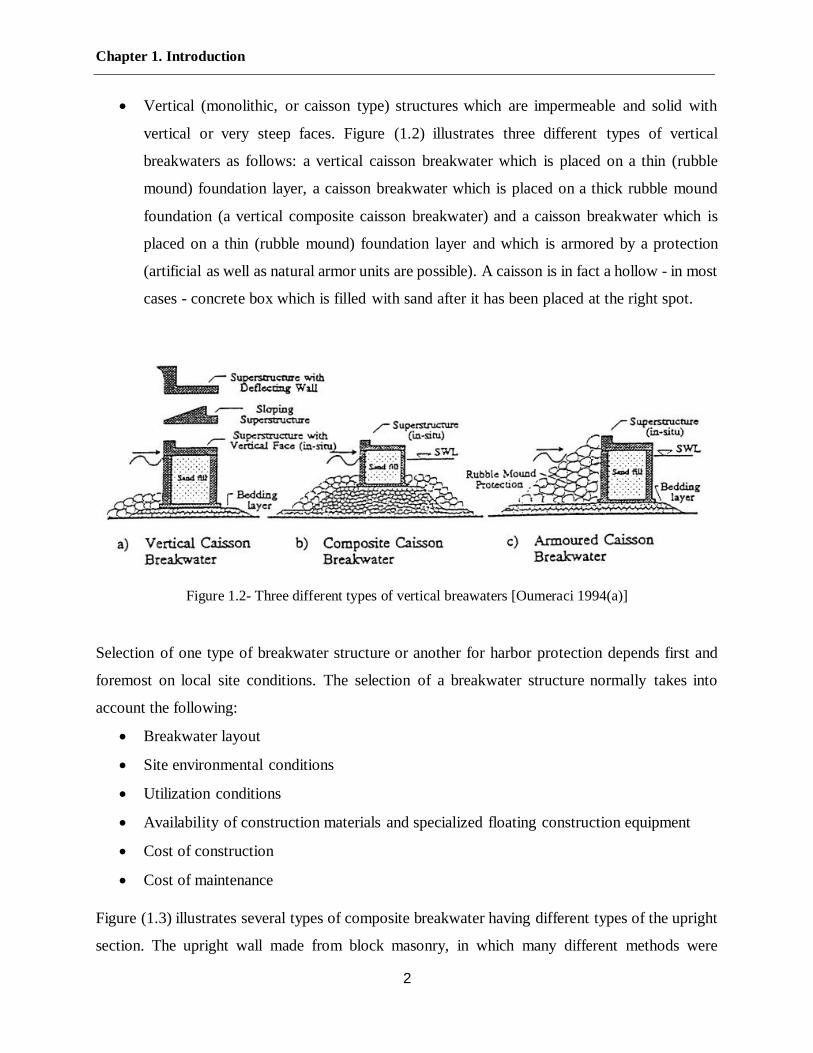
· Vertical (monolithic, or caisson type) structures which are impermeable and solid with
vertical or very steep faces. Figure (1.2) illustrates three different types of vertical
breakwaters as follows: a vertical caisson breakwater which is placed on a thin (rubble
mound) foundation layer, a caisson breakwater which is placed on a thick rubble mound
foundation (a vertical composite caisson breakwater) and a caisson breakwater which is
placed on a thin (rubble mound) foundation layer and which is armored by a protection
(artificial as well as natural armor units are possible). A caisson is in fact a hollow - in most
cases - concrete box which is filled with sand after it has been placed at the right spot.
Figure 1.2- Three different types of vertical breawaters [Oumeraci 1994(a)]
Selection of one type of breakwater structure or another for harbor protection depends first and
foremost on local site conditions. The selection of a breakwater structure normally takes into
account the following:
· Breakwater layout
· Site environmental conditions
· Utilization conditions
· Availability of construction materials and specialized floating construction equipment
· Cost of construction
· Cost of maintenance
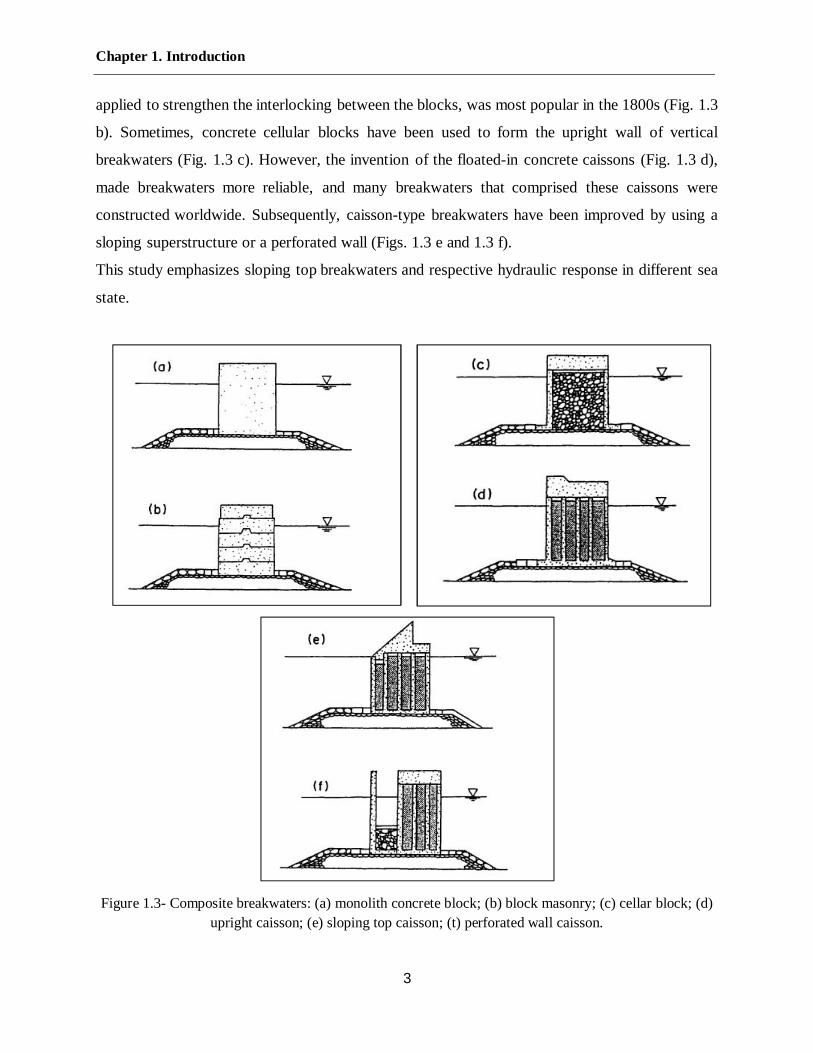
Figure (1.3) illustrates several types of composite breakwater having different types of the upright
section. The upright wall made from block masonry, in which many different methods were
Chapter 1. Introduction
3
applied to strengthen the interlocking between the blocks, was most popular in the 1800s (Fig. 1.3
b). Sometimes, concrete cellular blocks have been used to form the upright wall of vertical
breakwaters (Fig. 1.3 c). However, the invention of the floated-in concrete caissons (Fig. 1.3 d),
made breakwaters more reliable, and many breakwaters that comprised these caissons were
constructed worldwide. Subsequently, caisson-type breakwaters have been improved by using a
sloping superstructure or a perforated wall (Figs. 1.3 e and 1.3 f).
This study emphasizes sloping top breakwaters and respective hydraulic response in different sea
state.
Figure 1.3- Composite breakwaters: (a) monolith concrete block; (b) block masonry; (c) cellar block; (d)upright caisson; (e) sloping top caisson; (t) perforated wall caisson.

Chapter 1. Introduction
4
Table 1.1- Review of vertical breakwater failures
BREAKWATER(COUNTRY, YEAR)
MAJOR REASONS FOR FAILURE(MAJOR MODE OF FAILURE)
Madras(India,1881)
Breaking waves, Overtopping, Scour and erosion. (Seaward tilt)
Bizerta(Tunesia, 1915) Breaking waves, Overtopping, Erosion of rubble mound foundation
Valencia(Spain,1926)
Exceedance design wave, Breaking waves, Overtopping, Seabed scour (seaward tilt)
Antofa-Gasta(Chile,1928-29) Exceedance design wave, Non-monolithicity, Breaking wave
Catania(Italy,1930-33)
Exceedance design wave, Non-monolithicity, Breaking waves, Overtopping, Differential settlement(Sliding and seaward tilt)
Genoa(Italy, 1955)
Exceedance design wave, Non-monolithicity, Breaking waves, Wave overtopping(Sliding)
Algiers(Algeria,1930,1934)
Exceedance design wave, Breaking and overtopping, Differential settlement, Seabed scour, Erosion of rubblemound foundation (seaward tilt)
Niigata(Japan,1976)
Breaking waves, Overtopping, Differential settlement(seaward tilt)
Bari(Italy,1974)
Exceedance design wave, Wave breaking, Erosion rubble mound foundation
Palermo( Italy,1973)
Exceedance design wave, Wave breaking, Erosion rubble mound foundation
Naples(Italy,1987)
Wave breaking ( sliding and overturning)
Mashike (Japan) Exceedance design wave, Wave breaking Overtopping (non-completed at head)(sliding = 2.9 m)
Fukaura (Japan) Wave breaking Overtopping (non-completed at head) Erosion of rubble mound foundation(sliding = 3m)
Sakata (Japan) Exceedance design wave, Wave breaking, Differential settlement(sliding and shoreward tilt)
Onahama (Japan) Wave breaking, Erosion of rubble mound foundation (sliding)
Niigata- West Jetty (Japan) Wave breaking, Overtopping Erosion of rubble mound foundation(sliding = 26 m)
Niigata- West Breakw. (Japan) Wave breaking, Overtopping, Differential settlement
Breakwater(country, year)
Major reasons for failurE(major mode of failure)
Ventotene (Italy, 1966) Wave breaking, Erosion of rubble mound foundation(sliding)
Rumoi (Japan) Wave concentration at bound, Erosion of rubble mound foundation
Ishikari-New port (Japan) Seabed scouring, Erosion of rubble mound foundation
Oshidomari (japan) Settlement, Erosion of rubble mound foundation (S-shape), Wave breaking (sliding = 4.1 m)
Miyako (japan) Wave breaking, Overtopping, Erosion of rubble mound foundation(sliding= 1.5 m)

Chapter 1. Introduction
5
Vertical breakwaters are extremely sensitive to foundation failure, such as slip, settlements, sliding
or failure of the monolithic structure itself. This is a first indication of the fact that the design of a
vertical breakwater may be more complicated than the design of an ordinary rubble mound
breakwater. Because of this fact, vertical breakwaters have almost been abandoned except in
countries like Italy and Japan. However, a number of important (scientific) developments which
might promote the revival of vertical breakwaters have taken place in the last decades and
nowadays vertical breakwater are becoming more and more of interest due to the increasing
draught of vessels and off-shore land reclamations in deep water. Table 1.1, reported by Oumeraci
(1994), shows the major reasons for failure of vertical breakwaters in different countries.
Upright section of a vertical breakwater must be stable against the overall (Fig. 1.4) and local
(Figure 1.5) failure modes. The former is concerned with a wall's stability against sliding,
overturning, and overstressing the foundation material, as well as with the general stability of the
nibble foundation, and the latter concerns mainly erosion beneath both the seaward and shoreward
edges of the wall, seabed scour, and toe erosion and in some instances with the nibble punching
failure at both edges of the wall.
Figure 1.4- Overall failure modes of vertical breakwater: (a) sliding; (b) overturning; (c) and (d)settlement due to foundation failure. 1, Upright section; 2, rubble foundation (mattress); 3, slip surface.

Chapter 1. Introduction
6
In most practical cases, in vertical wall breakwater analysis, the safety factor against sliding used
is 1.4 to 1.6, and against overturning it is 1.5 to 2.0. A rather high safety factor against overturning
is normally recommended to avoid the "hummering" effect of the rubble foundation.
Figure 1.5- Local failure modes of vertical breakwater: (a) erosion and/or punching failure of rubblemattress at seaward and/or shoreward edges; (b) seabed scour and mattress erosion. 1. Upright section; 2.Rubble foundation (mattress); 3. Original profile of seabed and rubble foundation; 4. Scour in front of the
upright section; 5. Potential failure plane.
However, in many instances, wall sliding stability is more critical than overturning, especially for
breakwaters with a low crown. The dynamic response and sliding stability of vertical breakwaters
is discussed in Takahashi et al. (1994), and PIANC (2003).
1.2 Objectives of the thesis
The application of computational fluid dynamics (CFD) methods to various problems in the field
of coastal and ocean engineering is gaining importance due to the level of detail and accuracy
offered by these methods. With the advances made in the computing power over the last decade
and anticipated future increase in computational power, large and complex problems can be
handled using CFD modeling.
Here in the current study this application has been employed to simulate interaction between sea
waves and a specific type of vertical breakwater i.e. sloping top caisson. In other words, the main
objective of this thesis is a CFD based investigation of structural response of a sloping top caisson
subject to wave overtopping. As it has long been known, wave loads on vertical breakwaters or

Chapter 1. Introduction
7
seawalls may conveniently be divided into two categories, pulsating (or quasi-static) and impulsive
(or impact). Pulsating pressures change relatively slowly (approximately 0.2 and 0.5 times a wave
period) while the impulsive pressures caused by breaking waves are large and much higher than
pulsating pressures, but of shorter duration (approximately 0.01 of the mean wave period or
shorter). In this study, forces on the outer and inner face of the structure are separately analyzed
and detailed descriptions of both types of wave loadings acting on the structure are given.
Particular attention has been drawn to the landward and seaward directed loads to determine the
sliding tendency. Furthermore, it was tried to present a deeper understanding of seaward impact
loading induced by wave overtopping which is believed to be the cause of seaward-directed sliding
and overturning failures.
1.3 Organization of the thesis
Following chapters form the basis of this thesis:
Chapter 1 provides a general description of the vertical and composite breakwaters along with
review of major reasons for their failure.
Chapter 2 gives a literature review of pervious theoretically and experimentally studies related to
the wave force including pulsating and impulsive load. A summary of pressure impulse theory,
developed by Cooker and peregrine, is also presented in Chapter 2.
Chapter 3 discuses about sloping top breakwaters and current design method proposed by
Takahashi et.al (1994). The problem of impulsive load particularly in seaward direction is also
treated.
Chapter 4 presents numerical setup of CFD based simulation of wave-structure interaction. In this
phase, much attention has been drawn to take the effect of the air into account. Primary results
including evaluation of hydraulic performance and comparison with pervious experiment methods
are also reported
Chapter 5 gives main results of a CFD study on the structural response of a sloping top breakwater
subject to wave overtopping. The analysis showed that the transmitted wave field act to increase
both the landward and the seaward forces and that the conventional design methods may be not

Chapter 1. Introduction
8
adequate to guarantee an appropriate degree of safety to the structure. Three impulsive wave
loading mechanisms on the back of the structure due to wave overtopping were identified. The
study also confirmed the previous finding by Walkden et al. (2001), which noticed the existence
of strong impulsive loadings on the inner face of the wall, due to violent overtopping events.
However, a large underestimation were observed to estimate pressure impulse using proposed
method.

Chapter 2. Wave forces and impacts on a conventional vertical breakwaters.
9
CHAPTER 2
WAVE FORCES AND IMPACTS ON A CONVENTIONAL VERTICAL
BREAKWATERS
2.1 Introduction
At the end of the seventies and at the beginning of the eighties, catastrophic failures were
experienced by a series of large rubble mound breakwaters. This shock to the profession was
comparable to the first shock half a century earlier, as several vertical breakwaters collapsed. The
irony of the technical development which followed these two events was that in both cases the
profession returned to old solutions and concepts that appeared to have been almost abandoned.
The failed vertical breakwaters were rebuilt as conventional rubble mound structures, and for the
rehabilitation of the damaged rubble mound breakwaters with concrete armor units the old berm
breakwater concept was rediscovered. The principal difference between the two cases certainly
lies in the attitudes adopted by the profession with regard to the further application of such
structures. After the first shock in the thirties, the vertical breakwater was almost abandoned,
except in some countries like Japan, Taiwan, China, Korea and Italy, in favor of the rubble mound
type. On the other hand, the second shock in the eighties gave rise to extensive research activities
towards improving the design and construction of rubble mound breakwaters. The latter certainly
represents the better attitude, although no definitive solutions to the most urgent problems
(structural strength of armor units, geotechnical stability, crown-wall stability etc.) have yet been
achieved. Meanwhile, the need for breakwaters at greater depths to suit the increasing draught of
large vessels in the last decades has made the costs of such structures more prohibitive
(construction costs in the range of US$100.000 per linear meter structure). In this respect,
monolithic structures may represent a better alternative, in terms of performance, total costs,
standardization, quality control, environmental aspects, construction time and maintenance. In
addition, the situation is quite different from that in the thirties, since a number of important
developments which might promote the revival of vertical breakwaters have taken place in the last
decades. These are for instance:
1. Availability of more reliable wave observations, wave records, meteorological data and
sophisticated wave hindcast and refraction models;
Chapter 2. Wave forces and impacts on a conventional vertical breakwaters.
10
2. Considerable knowledge which has been accumulated since the thirties with respect to
wave breaking and impacts on structures;
3. Remarkable development of hydraulic modeling by using irregular waves and further
sophisticated techniques for the measurement of transient loading and response of
structures;
4. Availability of large-scale testing facilities (super wave tanks) in which the dynamic,
hydraulic and geotechnical aspects can simultaneously be investigated;
5. Developments in the offshore oil industry, especially with regard to the numerical
modeling of wave-structure-soil interaction, as well as to the technology of caisson
structures and marine foundation work.
In this respect, a large experience in the technology related to breakwaters has also been
accumulated in Japan (Tanimoto et al., 1987; Tanimoto and Goda, 1991; Takahashi et al., 1992;
Tanimoto and Takahashi, 1994b). The aforementioned, relatively new and ever-increasing need
for protective structures in deeper water, induced by the rapid increase of ship sizes in the last
decades, together with the relatively recent developments enumerated above, constitute a good
opportunity to recover the chance missed in the thirties by learning more from the failures and,
based on the lessons learned, to establish an integrated research program which will allow vertical
breakwaters to get at least as competitive as traditional rubble mound structures. It is believed that
this action towards the revival of vertical breakwaters should necessarily start with a
comprehensive review of past failures, since one can learn more from these difficult experiences,
where the forces of the sea have prevailed over the defenses of men, than from successful
experiences.
2.2 Structural failure of caisson breakwaters due to wave loads
Franco (1994) summarized the Italian experience in design and construction of vertical
breakwaters. The author gave a historical review of the structural evolution in the last century and
critically described the major documented failures (Catania, 1933; Genova, 1955; Ventotene,
1966; Bari, 1974; Palermo, 1983; Bagnara, 1985; Naples, 1987 and Gela, 1991). According to
Franco, in all cases the collapse was due to unexpected high wave impact loading, resulting from

Chapter 2. Wave forces and impacts on a conventional vertical breakwaters.
11
the underestimation of the design conditions and the wave breaking on the limited depth at the toe
of the structure.
Takahashi et al. (2000) explained the experiences of caisson breakwater failures and proposed a
design of caisson breakwaters to prevent such failures. Authors noted that the most important cause
of failures of caisson breakwaters is the caisson sliding and breakage due to impulsive wave
pressures. It should also be noted that the rubble mound/rubble foundation of composite
breakwaters is vital to prevent the failure of the upright section by scouring, as well as stabilizing
the foundation against the wave force and caisson weight. Takahashi et al. (2000) described typical
failures of composite breakwaters, they distinguished the following failure modes:
1. Meandering sliding (Sendai Port) due to local amplification of non-breaking waves for
refraction at the structure; this meandering sliding is a typical sliding phenomenon due to
nonbreaking waves. This is caused by diffracted waves from breakwater heads in an
oblique wave. (Fig. 2.1)
2. structural failure due to impulsive wave pressure (Minamino-hama Port) due to impulsive
wave pressure acting on a caisson installed on a steep seabed slope;
3. scattering of armor for rubble foundation (Sendai Port) due to strong wave-induced current
acting around the breakwater head;
4. scouring of rubble stones and seabed sand due to oblique waves;
5. erosion of front seabed;
6. seabed through-wash;
7. rubble foundation failure;
The authors analyzed 33 major failures occurred between 1983 and 1991, more than 80% of
them were caused by storm waves larger than the ones used in the design. More than 50%
suffered from the application of unexpected wave-induced loads while only 20% were due to
the scour of the foundation.
Goda and Takagi (2000) summarized the failure modes of vertical caisson breakwaters observed
in Japan over several tens of years, listed below in the order of importance:

Chapter 2. Wave forces and impacts on a conventional vertical breakwaters.
12
Figure 2.1- Meandering failure of caisson
1. Sliding of caissons;
2. Displacement of concrete blocks and large rubble stones armoring a rubble foundation
mound;
3. Breakage and displacement of armor units in the energy-dissipating mound in front of a
caisson;
4. Rupture of front walls and other damage on concrete sections of a caisson;
5. Failure in the foundation and subsoil.
The authors confirm that ruptures of caisson walls are usually reported as occurred under
exceptionally severe wave conditions while the generation of impulsive breaking wave forces is
cited as the major cause of caisson damage together with the wave concentration at a corner formed
by two arms of the breakwater.
Oumeraci (1994c) gave a comprehensive review of analyzed failure cases for both vertical and
composite breakwaters. 17 failure cases were reported for vertical breakwaters and 5 for composite
or armored vertical breakwaters. For vertical breakwaters, the type of structure, the design wave
conditions, the wave conditions responsible for the damage, the water depth conditions, the various
characteristics of the structure and its foundation, the nature of the seabed and the major reasons
for failure are given as far as the information was reported. And For armored vertical breakwaters,
the type of blocks for the protective armor, the design wave conditions, the wave conditions
Chapter 2. Wave forces and impacts on a conventional vertical breakwaters.
13
responsible for the damage, the water depth conditions, the characteristics of the structure and the
major reasons for failure were given.
2.3 Classification of reasons for failuresFor the evaluation of the reasons for failures, it is important that all relevant modes of failure are
considered and that any cause which might have contributed to the resulting failures observed
after the storms should be accounted for. The reasons which have led to the failures subdivided
into the following three categories which are shown in Table (2.1).
2.3.1 Reasons inherent to the structure itself
Among the reasons for failures which are inherent to the concrete structure and its rubble mound
foundations, one may distinguish the inadequacy of the concept of reflective structures (vertical
structures have to reflect all the incoming wave energy), the crest level of the rubble mound
foundation which is generally too high, and the crest level of the concrete structure which is too
low. In addition, there are further reasons related to the non-monolithicity of the structure and the
weakness of the concrete material.
Outdated reflective breakwater concept
Heavy storms are characterized by highly irregular and short crested waves. Wave breaking at the
wall may occur, even in deep water, due to wave-wave interaction. Therefore, vertical breakwaters
do not always work as reflective structures. The occurrence of wave breaking must always be
considered and does, in fact, represent the most important cause of damage (Oumeraci, 1994c).
Moreover, the trend is rather towards increasing use of dissipating low reflection caisson
alternatives (Takahashi, 1996; Oumeraci et al., 2000).
Non-monolithicity of the structure and weakness of the concrete
The non-monolithicity of the structure has generally led to two principal modes of failures:
1. Shoreward sliding of the superstructure and the underlying upper two or three layers of
unbonded blocks, essentially caused by the impact of breaking waves in this area.

Chapter 2. Wave forces and impacts on a conventional vertical breakwaters.
14
2. The collapse of the superstructure (generally seaward tilt) and development of a small
breach which is then widened by wave action. This generally occurred where differential
settlements were observed.
Table 2.1- Reasons for the failures of vertical structures.
Reasons Inherent to the
structure itself
Inadequacy of the "concept of reflective structures"
Non-monolithicity of the structure
Too low crest of the structure
Too high Too berm
Reasons inherent to hydraulic
conditions and loads
Exceedance of wave design conditions
Wave concentration along the structure
Wave breaking & Impact load
Wave overtopping
Reasons inherent to
foundation and seabed
morphology
Unfavorable seabed topography
Scour end erosion
Settlement
Slip failure (shear)
This reason is, however, less important since the modern caisson used nowadays for vertical
structures are necessarily monolithic structures made of good concrete.
Low structure crest and high toe berm
By examining the structures which failed and which were built as "vertical breakwaters", it can
easily be seen that most of them had too high a toe berm. On the other hand, most of the
damaged structures had a low crest and were hence heavily overtopped.
Chapter 2. Wave forces and impacts on a conventional vertical breakwaters.
15
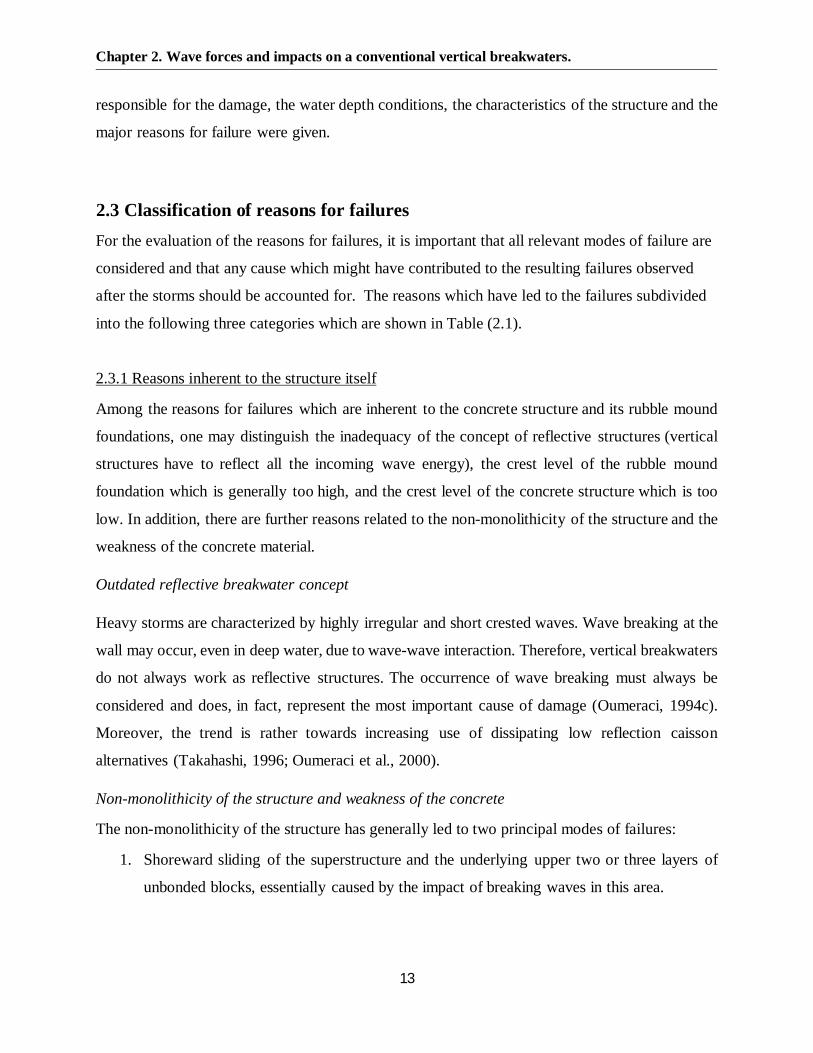
Figure 2.2- Seaward tilt of vertical breakwaters.
As a result, heavy wave overtopping and breaking on the structure took place which generally led
to differential settlements, thus resulting in the seaward tilt of the breakwater, irrespective of the
type of structure (breakwaters of Madras, Valencia, Catania, Algiers and Niigata). The actual
reasons for this "abnormal" behavior and the "abnormal" forces which prevailed are still not
understood. Two examples for the seaward tilt of low crest vertical breakwaters are shown in
Figure (2.2).
2.3.2 Reasons inherent to hydraulic conditions and loads
Among the reasons due to hydraulic influencing factors and loads there are the exceedance of
design wave conditions, the focusing of wave action at certain zones along the breakwater, wave
breaking, subsequent impact loads and wave overtopping.
Exceedance of design wave conditions
Generally, the maximum wave height with a return period of 20 to 100 years is used for design.
This is not justified in the sense that the largest waves may not reach the structures due to breaking
and that lower waves may be even more critical. Further, incremental weakening of the foundation
and other structural components sensitive to cyclic loads are caused by moderate wave conditions
Therefore, and for reasons which will become more apparent design wave load criteria should be
adopted, which can account for both sudden failure caused by an extreme single wave and gradual
failure under moderate but repetitive wave loads.

Chapter 2. Wave forces and impacts on a conventional vertical breakwaters.
16
Concentration of wave action at certain zones along the breakwater
During severe storms, wave action was generally focused at certain zones along the breakwater
where the wave height exhibits an increase in the range up to 20% as compared to the other
sections. Moreover, sometimes, a number of small breaches developed at regularly distributed
distances from each other, the first breach starting generally near the head. In other cases, the
concentration of wave action was characterized by the occurrence o f a huge breaking and
overtopping wave acting over a large front width and suddenly opening a breach of about the same
width in the structure (for instance 150 m in the case of Mustapha Breakwater) which is then
widened by the following waves. A further concentration of wave action was also observed at
singular points of the breakwater like heads, bounds, and junctions between two different types of
structure.
Breaking waves and wave impact loads
Wave breaking and breaking clapotis represent the most frequent damage source of the disasters
experienced by vertical breakwaters. The recognition of this fact had led to the development of
extensive experimental research activities on impact loading of structures subject to breaking
waves. Figure (2.3) shows a wave hitting the offshore side of a caisson at Minamino-hama Port.
The breakwater forms a jetty type breakwater designed to protect small ferry boats, with its rear
side to be used as a quay wall. Big splash in the photo is typical when an impulsive breaking wave
force act on the vertical wall. During a typhoon, waves equivalent to the design wave or larger
attacked the breakwater head caisson from the breakwater alignment direction. Plunging breakers
almost completely destroyed the caisson at the breakwater head. In fact, wave breaking was often
observed during the most severe storms which preceded the disasters, even in water depths where
breaking (due to shoaling) was not expected at all. Caisson damage started when the sidewall of
the caisson began breaking, then progressed to the whole caisson. Such caisson breakage was
caused by impulsive wave pressures acting on a caisson installed on a steep seabed slope.
Impulsive wave pressures occur when the vertical wall is attacked by an almost vertical wave front,
and therefore larger vertical wave front due to plunging or surging breakers gives larger impact
pressures. The common modes of failure caused by the horizontal wave load due to plunging
breakers are sliding, shear failure of the foundation, but rarely overturning (Goda, 1973).

Chapter 2. Wave forces and impacts on a conventional vertical breakwaters.
17
Figure 2.3- Impulsive wave pressure.
Wave overtopping
Wave overtopping is generally considered an important aspect of the functional design, but it is
often overlooked that it may be an important cause of structural damage. The observations reported
so far show that all the structures were heavily overtopped by the wave(s) which provoked the
collapse. A number of suggestions have been advanced to explain the mechanisms which had led
to the collapse of monolithic structures under overtopping conditions (Miche, 1933; Lira, 1935),
but they rather appear of speculative nature. Although the failure mechanisms and the loading
associated with wave overtopping are still not fully understood, it has been shown that when
excessive overtopping occurred breakwaters tilted seaward instead of shoreward; In fact, the
relatively low crested structures allows a large amount of wave energy to be transmitted by
overtopping, thus producing "abnormal forces" which are prejudicial to the stability against
seaward tilt.
2.3.3 Geotechnical and other 'hidden' progressive failures
Sufficient attention has not yet been paid in the codes of practice to failure modes, associated with
instability of the foundation and of the seabed, which very often remains hidden until collapse
occurs. Even the PIANC-Committee of 1976 did 'not feel competent to examine the soil
mechanics' problems involved' (PIANC, 1976): Considerable efforts have since then been devoted
Chapter 2. Wave forces and impacts on a conventional vertical breakwaters.
18
to this issue (De Groot et ea., 1996; PIANC, 2001) and it has been shown that conventional bearing
capacity calculations are not sufficient. Seabed scour is another neglected design issue. The
complexity of the transient and cyclic phenomena involved in the wave-structure-foundation
interaction, as well as the accumulation of irreversible soil deformations, require a deeper insight
into the incremental weakening of the seabed and its application in design, construction, and
maintenance.
2.4 Design of caisson breakwaters
2.4.1 Outline of design procedures and general considerations
The main function of a breakwater is to provide sufficient protection against waves. Wave
transmission or its effect on the functionality (ship motion at berth, etc.) of the sheltered area must
be reduced to an acceptable level, which strongly depends on the purpose of this area, the types of
vessels, mooring conditions, etc. Besides wave transmission, wave reflection and overtopping may
also be of importance. However, before the breakwater fails completely in fulfilling its main
function, a number of other failures, associated with loss of stability of the foundation and/or loss
of structural integrity, have often taken place. Therefore, it is one of the main design tasks to
properly analyze such failure modes. For this purpose, the design wave parameter at the structure,
the design wave loads and the associated responses of the structure and its foundation should be
predicted. An overview of the overall design procedure, which is far from being exhaustive, is
shown in Figure (2.4). The uncertainties associated with the predicted wave heights, forces, etc.
are indicated by a coefficient of variation (CoV), which is defined as the standard deviation divided
by the mean value of the variable considered. The following sections in this chapter focus on wave
loads and stability analysis, preceded by a brief description of other aspects of hydraulic
performance such as wave reflection, wave overtopping and associated wave transmission over
the breakwater.

Chapter 2. Wave forces and impacts on a conventional vertical breakwaters.
19
Figure 2.4- Flow chart of overall design procedure (adopted from Oumeraci et.al 2001)

Chapter 2. Wave forces and impacts on a conventional vertical breakwaters.
20
2.4.2 Hydraulic performance
Wave Transmission and Reflection.
When waves act on vertical breakwaters, some energy of the incident waves is dissipated, and
some of the remaining energy is reflected and generates reflected waves in front of the wall; the
rest of the wave energy is transmitted and yields the waves transmitted behind the breakwater.
Wave reflection sometimes presents a problem because of the additional agitation it may create in
a port basin. The minimization of wave transmission is important in breakwater design because
the principal function of a breakwater is to prevent wave propagation from occurring, thereby
creating a calm water area behind the breakwater. The amount of wave reflection and transmission
is usually determined by the wave reflection (KR) and wave transmission (KT) coefficients, which
are defined as follows: KR = HR/HI, and KT = HT/HI, where HI is the incident wave height, HR is
the reflected wave height, and HT is the transmitted wave height, all of which usually correspond
to the significant wave.
Wave Transmission. Transmitted waves are caused by wave transmission through the structure
and overtopping. Transmission coefficients related to both causes are denoted as KTt and KTo,
respectively, with the total transmission coefficient KT being expressed as:
= ( + ) . (2.1)
Transmitted waves created by overtopping waves have a complicated form with high-frequency
components. They are produced by waves generated at the lee which result from the impact of the
fall of the overtopping mass. Therefore, in general, the wave height and period transmitted are
different from those of incident waves; that is, the wave period of transmitted waves is generally
smaller.
Another phenomenon worthy of note is that transmitted irregular waves change characteristics as
they propagate over a long distance; for example, distributions of wave height and period vary
with the distance away from the breakwater. Wave transmission by vertical wall breakwaters is
mainly by overtopping; therefore, the ratio of a breakwater's crest height Rc to the incident wave
height HI is the principal parameter governing the wave transmission coefficient. Based on regular
wave tests, Goda and Kakizaki (1966) proposed the following equations for determination of the
transmission coefficient for vertical breakwaters.
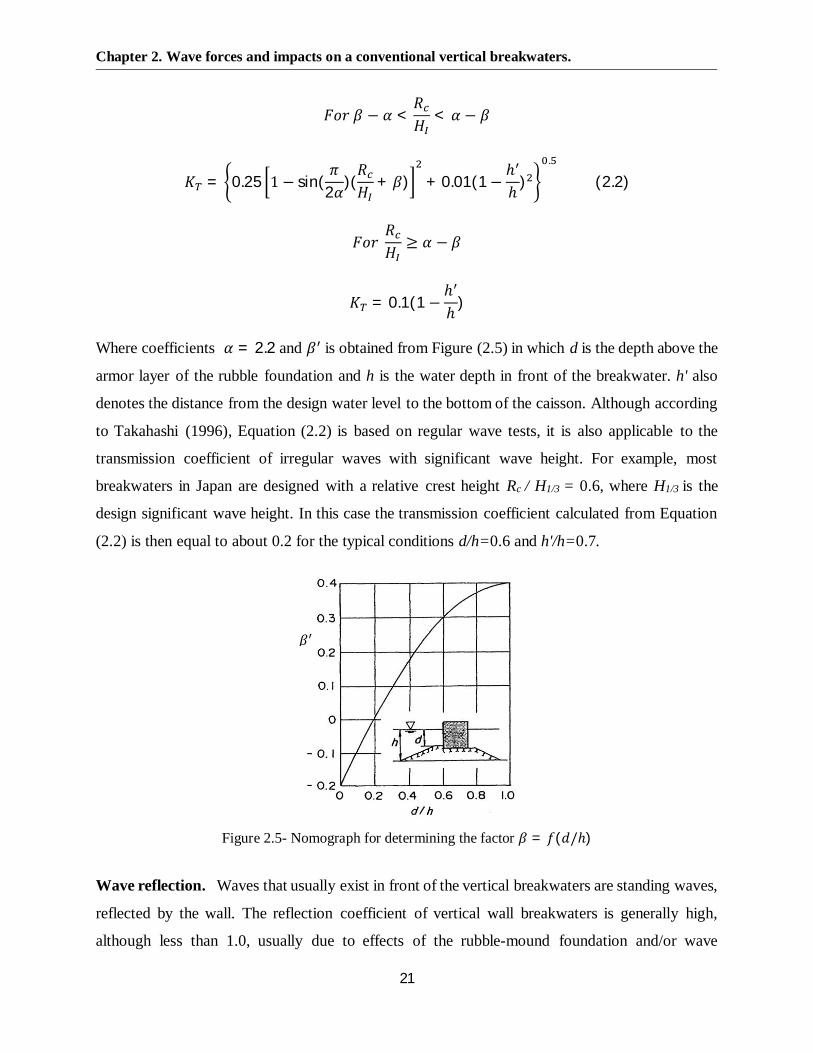
Chapter 2. Wave forces and impacts on a conventional vertical breakwaters.
21
− < < −
= 0.25 1 − sin(2 )( + ) + 0.01(1−ℎℎ )
.
(2.2)
≥ −
= 0.1(1 −ℎℎ )
Where coefficients = 2.2 and is obtained from Figure (2.5) in which d is the depth above the
armor layer of the rubble foundation and h is the water depth in front of the breakwater. h' also
denotes the distance from the design water level to the bottom of the caisson. Although according
to Takahashi (1996), Equation (2.2) is based on regular wave tests, it is also applicable to the
transmission coefficient of irregular waves with significant wave height. For example, most
breakwaters in Japan are designed with a relative crest height Rc / H1/3 = 0.6, where H1/3 is the
design significant wave height. In this case the transmission coefficient calculated from Equation
(2.2) is then equal to about 0.2 for the typical conditions d/h=0.6 and h'/h=0.7.
Figure 2.5- Nomograph for determining the factor = ( /ℎ)
Wave reflection. Waves that usually exist in front of the vertical breakwaters are standing waves,
reflected by the wall. The reflection coefficient of vertical wall breakwaters is generally high,
although less than 1.0, usually due to effects of the rubble-mound foundation and/or wave

Chapter 2. Wave forces and impacts on a conventional vertical breakwaters.
22
overtopping. The wave reflection coefficient, KR, is considerably reduced when breaking waves
act on the breakwaters. Figure (2.6) shows the results from two series of experiments using various
wave conditions which are represented by the incident significant wave height H1/3 and the
wavelength L1/3 corresponding to the significant wave period T1/3 (Tanimoto et al., 1987). In the
first series, the relative thickness of the rubble-mound foundation to the water depth, d/h, is
primarily changed, whereas the relative crest height of the upright sections to the water depth, Rc/h,
is changed in the second series.
Figure 2.6- Reflection coefficients of vertical breakwaters. [From Tanimoto et al. (1987).]
Wave overtopping
Outline of the design problem. The crest level of the breakwater must be high enough to prevent
excessive wave overtopping. Too much overtopping may cause unacceptable wave transmission,
leading to damage to berthed ships, installations, vehicles and pedestrians on and behind the
structure as well as to interruption of cargo-handling operations. Wave overtopping may also
influence breakwater stability in the sense that the wave loading changes as compared with non-
overtopping conditions. In order to apply the principle of overtopping-based design for
determination of the crest elevation more efficiently, it is necessary to have reliable tools to predict
the expected overtopping quantities and to decide on allowable limits for overtopping with regards
to structural and functional integrity. Figure (2.7) shows a picture of Samphire Hoe during a storm

Chapter 2. Wave forces and impacts on a conventional vertical breakwaters.
23
where a wave impacted on the vertical wall and jumped high into the air. Under such conditions,
even very large relative freeboards will get overtopping.
Determination of wave overtopping. The governing parameter is the relative freeboard Rc/ Hs.
Other parameters are the breakwater type, the geometry of the superstructure, the foreshore
topography, the direction of short-crested waves, wind, etc. The degree of wave overtopping may
be measured in two ways:
1. As a mean overtopping discharge q per time unit and per unit length of the breakwater
(L/s/m), which is particularly useful for the design of the drainage system.
2. As an individual overtopping volume V per wave and per unit length of the breakwater
(m3/m), which is required to assess structural damage and impacts on vehicles, pedestrians,
etc.
3.
Figure 2.7- Violent wave overtopping at Samphire Hoe (picture courtesy of Eurotunnel and the WhiteCliffs Countryside Project).
Although the single-wave volume V represents damaging effects of wave overtopping much better,
the available formulae and allowable limits only include the mean discharge q. Due to the
complexity of the processes involved and a large number of parameters, wave overtopping
conditions are best determined by scale-model tests. For vertical breakwaters or seawalls, in the
absence of wave breaking, the influence of the wave period seems very small or nonexistent, and
the easy formulation of Equation (2.3) with simple values for aq and bq has become a trusted design

Chapter 2. Wave forces and impacts on a conventional vertical breakwaters.
24
formula. Early work by Franco et al. (1994) for relatively deep water gave aq = 0.2 and bq = 4.3,
whereas Allsop et al. (1995) gave aq = 0.05 and bq = 2.78 in conditions of shallower water.
= − (2.3)
Where Hm0 is spectral significant wave height and g is gravitational acceleration. The coefficient
aq and exponent bq change depending on structure and wave conditions considered. The exponent
bq takes values of 3.1 for impulsive overtopping at plain vertical walls; 2.7 for broken waves at
plain vertical walls; and 2.9 for composite vertical structures. These exponents are simply the result
of fitting to data; the differences have no basis in any analytical framework or in physical
reasoning. The fact that the exponents are all different makes it difficult to carry out a direct, e.g.,
graphical, comparison between the different but closely related structures and their associated
overtopping responses.
2.5 Wave loading of caissons with plain front walls
2.5.1 Wave load classification
The local wave climate, the foreshore topography as well as the type and geometry of the structure
including the dimensions of its rubble foundation, govern the wave loading of the structure
(caisson and superstructure). The parameter map in Figure (2.8), which was developed for the
European PROVERBS project (Oumeraci et al., 2001), allows the designer to distinguish between:
1. breaking wave impact loads for which both magnitude and variation with time (load-
time history) are required to perform the dynamic analysis of the response of the structure,
and which therefore needs to be handled with special care;
2. 'Pulsating' wave loads which are assumed to be 'quasi-static', so that standard wave load
formulae and quasi-static stability analysis can be applied.
The principle of the parameter map in Figure (2.8) is the use of three non-dimensional input
parameters, each of which allows the designer to take a decision at the corresponding level. At the
first decision level the relative height of the rubble foundation hb* = hb/h (h being the water depth
at the toe of the mound) governs the type of structure from the wave loading point of view:
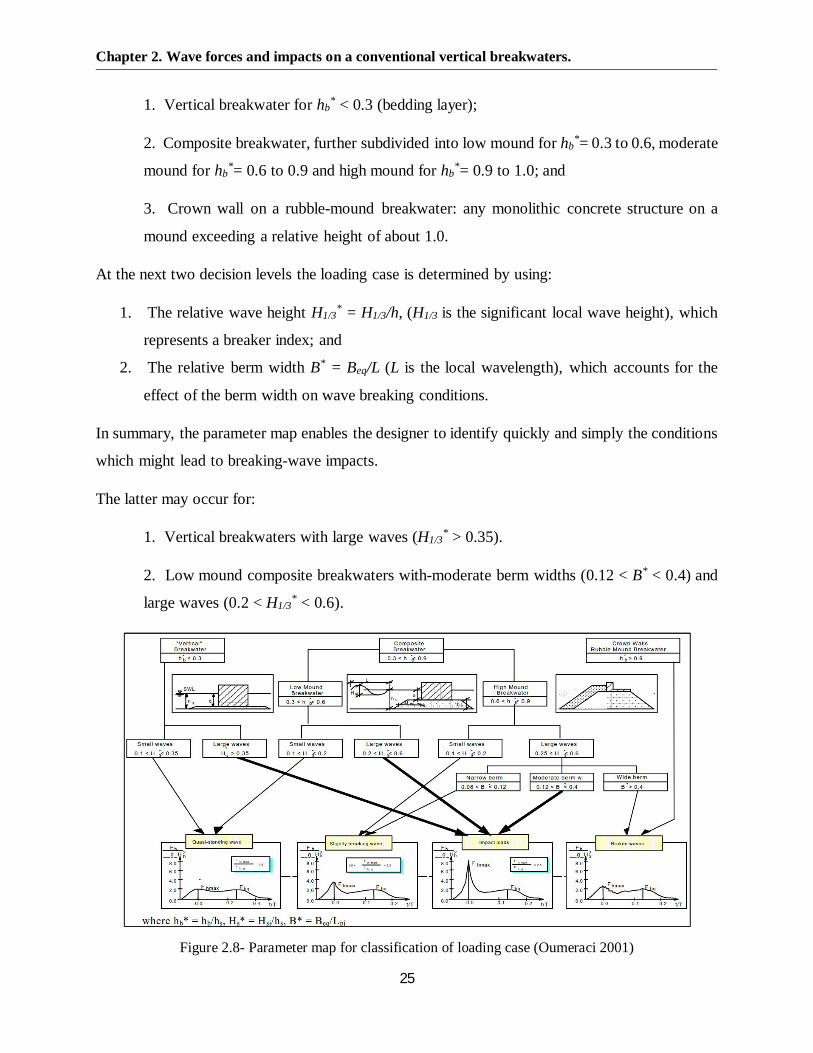
Chapter 2. Wave forces and impacts on a conventional vertical breakwaters.
25
1. Vertical breakwater for hb* < 0.3 (bedding layer);
2. Composite breakwater, further subdivided into low mound for hb*= 0.3 to 0.6, moderate
mound for hb*= 0.6 to 0.9 and high mound for hb
*= 0.9 to 1.0; and
3. Crown wall on a rubble-mound breakwater: any monolithic concrete structure on a
mound exceeding a relative height of about 1.0.
At the next two decision levels the loading case is determined by using:
1. The relative wave height H1/3* = H1/3/h, (H1/3 is the significant local wave height), which
represents a breaker index; and
2. The relative berm width B* = Beq/L (L is the local wavelength), which accounts for the
effect of the berm width on wave breaking conditions.
In summary, the parameter map enables the designer to identify quickly and simply the conditions
which might lead to breaking-wave impacts.
The latter may occur for:
1. Vertical breakwaters with large waves (H1/3* > 0.35).
2. Low mound composite breakwaters with-moderate berm widths (0.12 < B* < 0.4) and
large waves (0.2 < H1/3* < 0.6).
Figure 2.8- Parameter map for classification of loading case (Oumeraci 2001)

Chapter 2. Wave forces and impacts on a conventional vertical breakwaters.
26
2.5.2 Wave Forces on vertical Walls
Nonbreaking wave force on vertical walls
Non-breaking (pulsating) forces are primarily hydrostatic. Nonbreaking waves are usually
expected where the fetch is limited and when the depth of the structure is greater than about 1.5
times the maximum expected wave height. These loads change relatively slowly and vary in the
same period as the waves do. Traditionally, non- breaking loads were used in the design of the
vertical breakwaters by means of a quasi-static problem. The quasi-static wave loads can be
divided in two phases:
1. The wave crest encroaches the structure applying a hydrostatic pressure difference. The
vertical wall causes the wave surface to rise up the wall, increasing the pressure difference
across the wall. The force can be easily determined by using simple methods.
2. The second case is the opposite of above. The wave level decreases (wave trough)
leaving a negative force on the vertical wall. There are few methods to predict wave
loadings under trough phase.
Small-amplitude-wave theory. Non-breaking wave loads on a vertical wall (Fig. 2.9) can be
derived from the linear wave theory and its pressure distribution.
Figure 2.9- Standing wave on a vertical wall
According to the small-amplitude-wave theory with the full reflection of the incoming wave the
maximum pressure is:
=cosh (ℎ + )
cosh( ℎ) − ℎ < < 0
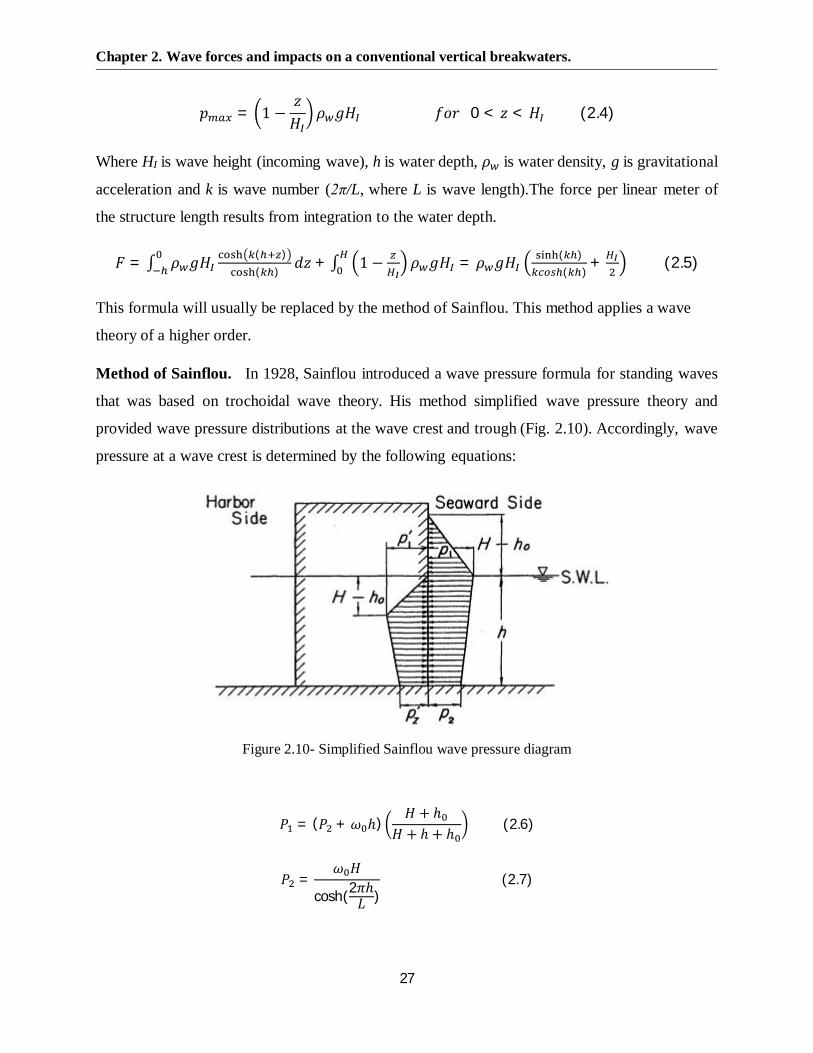
Chapter 2. Wave forces and impacts on a conventional vertical breakwaters.
27
= 1 − 0 < < (2.4)
Where HI is wave height (incoming wave), h is water depth, is water density, g is gravitational
acceleration and k is wave number (2π/L, where L is wave length).The force per linear meter of
the structure length results from integration to the water depth.
= ∫ ( )( )
+ ∫ 1 − = ( )( )
+ (2.5)
This formula will usually be replaced by the method of Sainflou. This method applies a wave
theory of a higher order.
Method of Sainflou. In 1928, Sainflou introduced a wave pressure formula for standing waves
that was based on trochoidal wave theory. His method simplified wave pressure theory and
provided wave pressure distributions at the wave crest and trough (Fig. 2.10). Accordingly, wave
pressure at a wave crest is determined by the following equations:
Figure 2.10- Simplified Sainflou wave pressure diagram
= ( + ℎ)+ ℎ
+ ℎ + ℎ(2.6)
=cosh(2 ℎ)
(2.7)
Chapter 2. Wave forces and impacts on a conventional vertical breakwaters.
28
Whereas the pressure at the wave trough is determined from the following formulation
= ( − ℎ )(2.8)
= =cosh(2 ℎ)
(2.9)
ℎ = coth2 ℎ
(2.10)
In Equation (2.6) through (2.10), H is the height of the original free wave (in water depth h) and
ho, is the height of the clapotis orbit center (mean water level at the wall) above the still water
level (SWL). The symbol also stands for the specific weight of sea water (= ). In general,
the Sainflou formula correctly describes the standing-wave pressure and has been used all over the
world for many years. The advantage of the Sainflou method has been ease of application, since
the resulting pressure distribution may be reasonably approximated by a straight line. Experimental
observations by Rundgren (1958) have indicated that Sainflou's method overestimates the
nonbreaking wave force for steep waves. The higher-order theory by Miche (1944), as modified
by Rundgren (1958), to consider the wave reflection coefficient of the structure, appears to best fit
forces measured experimentally on vertical walls for steep waves, while Sainflou's theory gives
better results for long waves of low steepness.
Breaking Wave Forces on Vertical Walls.
Waves breaking directly against vertical face structures exert high, short-duration dynamic
pressures that act near the region where the wave crests hit the structure. Impact pressures are
generally higher than quasi-static wave loads but are of shorter duration. Work by Bagnold (1939)
laid foundations for much subsequent research on wave impacts on coastal structures. Impact
pressures were observed to vary greatly even for fixed nominal conditions, but the pressure impulse
(defined as the integral of pressure over time) was far more repeatable. Bagnold (1939) found that
impact (impulsive) pressures occur at the instant that the vertical front face of a breaking wave hits
a wall and only when a plunging wave entraps a cushion of air against the wall. Impulsive wave

Chapter 2. Wave forces and impacts on a conventional vertical breakwaters.
29
pressure is one of the most important problems in the design of a vertical breakwater, and its effects
on breakwater performance must, therefore, be evaluated thoroughly.
Minikin (1963) has developed a procedure for calculating breaking wave forces on vertical
breakwaters. According to Minikin, the maximum dynamic pressure from a breaking wave is
assumed to act at the SWL and could be determined by the formula:
= 101ℎ
( + )(2.11)
Where is the maximum dynamic pressure, is Specific weight of water, Hb the breaker
height, LD the wave length in water of depth D, h the depth at the toe of the wall, and D the depth
one wave length in front of the wall. The pressure distribution of dynamic pressure is shown in
Figure (2.11).
Figure 2.11- Minikin wave pressure diagram on vertical wall
The pressure decreases parabolically from Pd at the SWL to zero at a distance of Hb/2 above and
below the SWL. The force represented by the area under the dynamic pressure distribution is
determined from:
= 3 (2.12)
The hydrostatic contribution Rs to the dynamic force Rd must be added to determine the total force
acting on a vertical wall. More recent studies (Allsop et al., 1996c) demonstrated Minikin's
formulas as above to be qualitatively incorrect since Rd in Equation (2.12) decreases with
increasing incident wave length LD, as well as dimensionally inconsistent. Such model is

Chapter 2. Wave forces and impacts on a conventional vertical breakwaters.
30
commonly used in the design practice (especially in the United States of America) and is still
recommended in the last version of the Coastal Engineering Manual (CEM).
Takahashi model. Takahashi et al. (1992, 1994a,b) developed a simplified model of the
impulsive wave pressures as a function of a wave's attacking angle, β, and the wave curvature
angle, (Fig. 2.12). These investigators found that the maximum average wave pressure intensity
( / ) that appears in the transition region ( > β > 0) and its duration time, can be
approximated as follows:
=0.4 ℎ + 0.75
ℎ + (2.13)
= ( 4 ) . (2.14)
km an added mass correction factor (for practical calculations, km is usually assumed equal to
0.83); kl the impulsive height coefficient (kl is the ratio of the wave-front height l to the wave
height H; theoretically, it ranges from 0 to 1, although it is usually used as 0.4 to 0.9); ka, the air
thickness coefficient (ka is related to β and , and its minimum value is approximately on the order
of 0.01 to 0.1); h the water depth; h' the water depth at the bottom of the wall; the specific heat
ratio, = 1.4; P0 the atmospheric pressure.
Figure 2.12- Three basic type of impulsive pressure. (From Takahashi et.al. 1994)
From Equation (2.13) it is obvious that the intensity of the impulsive pressure increases as the
wave-front height increases and the amount of entrapped air decreases. As stated by Takahashi
(1994), despite the fact that the impulsive pressure acts directly on the vertical wall, the total
upright section of the breakwater responds dynamically to this pressure as a part of the elastic
system, which includes the upright section, the rubble mound, and a seafloor soil. This results in a

Chapter 2. Wave forces and impacts on a conventional vertical breakwaters.
31
significantly reduced shear force that may cause the upright section to slide (Hayashi and Imai,
1964; Ito et al., 1966). For more information on the effects of breaking waves on vertical
breakwaters, readers are referred to Oumeraci et al. (1993).
Hiroi formula. Hiroi (1919) developed a wave pressure formula using the analogy of the
hydrodynamic pressure. His formula is based on field measurements obtained by Stevenson-type
pressure gauges (Stevenson, 1886) and is applied to breaking waves in relatively shallow seas. The
pressure distribution is assumed to be uniform along the vertical wall face as is shown in Figure
(2.13). The · wave pressure p at the wave crest is obtained from
= 1.5 (2.15)
Where H is the design wave height. The wave crest elevation is assumed to be at the height∗= 1.25H above the still-water level.
Figure 2.13- Wave pressure diagram in accordance with the Hiroi pressure formula
The Hiroi formula is very simple, yet it reasonably accurately describes the design pressure
developed by breaking waves; it was used for many years in Japan until the development of the
Goda formula. In the Hiroi formula, the design wave is usually assumed to be H1/3. However, the
difference between the maximum wave height and the significant wave height, H1/3, is small in
shallow seas. In practical terms, the water depth was used by Hiroi instead of the wave height
when he designed the breakwater built in Hakodate.
Goda Formula. In 1973, Goda used results of his own theoretical and laboratory studies
published in 1972 to develop a comprehensive formula for calculation of the design wave forces
Chapter 2. Wave forces and impacts on a conventional vertical breakwaters.
32
acting on vertical wall breakwaters. This formula has been modified later to account for the
effect of the oblique waves. It was successfully used to design the vertical breakwaters built in
Japan. The original formula (Goda, 1973b) has many advantageous features, with the main ones
being as follows:
1. It can be used for all wave conditions (i.e., both for standing and breaking waves).
2. The design wave that is included in Goda formula is the maximum wave height; it can be
evaluated by the provided diagrams and/or equations.
3. It is partially based on nonlinear wave theory and can represent wave pressure
characteristics by considering two pressure components: the breaking and slowly varying
pressure components. Hence, it can be extended relatively easily for application to different
types of vertical wall breakwaters.
4. The Goda formula clarifies the concept of the uplift pressure on the wall bottom; in this
formula, the buoyancy of the vertical wall in still water and the uplift pressure due to wave
action are defined separately. The distribution of the uplift pressure has a triangular shape.
Subsequently, the Goda formula was extended to include the following parameters:
1. The incident wave direction (Tanimoto et al., 1976)
2. Modification factors applicable to other types of vertical walls
3. The impulsive pressure coefficient (Takahashi et al., 1994b)
In the extended Goda formula, the wave pressure acting on the vertical wall is assumed to have a
trapezoidal distribution both above and below the still water level, whereas the uplift pressure
acting on the bottom of the upright section is assumed to have a triangular distribution as is shown
in Figure (2.14). The buoyancy is calculated using the displacement volume of the upright section
in still water at the design water level. As indicated in Figure (2.14), h denotes the water depth in
front of the breakwater, d is the depth above the armor layer of the rubble-mound foundation, h' is
the distance from the design water level to the bottom of the upright section, and hc is the elevation
of then breakwater above the design water level. The theoretical elevation at which the wave
pressure could be exerted, ∗ and the representative wave pressure intensities P1, P3, and P4 in a
generalized form are obtained from the following formulations:

Chapter 2. Wave forces and impacts on a conventional vertical breakwaters.
33
Figure 2.14- Wave pressure diagram in accordance with the Goda pressure formula
= (2.15)
= (2.16)
In which
= 0.5(1 + ) (2.16)
= 0.6 + 0.54 ℎ/
sinh(4 ℎ/(2.17)
∗ = { , }(2.18)
= min1 −ℎ
( / )3
,2
(2.19)
= 1−ℎℎ
1 −1
cosh(2 ℎ/ (2.20)
= 1−ℎ∗∗ (2.21)
ℎ∗ = { ∗, ℎ }(2.22)∗ = 0.75(1 + ) (2.23)
= 0.5(1 + ) × ( + ∗ ) (2.24)
Where
= ℎ = ℎ
ℎ ( = )
Rc

Chapter 2. Wave forces and impacts on a conventional vertical breakwaters.
34
ℎ = ℎ ℎ
, = ℎ
ℎ ℎ ℎ , /
, = ℎ ℎ ℎ min{ , } = .
(2.19)
= max{a, b} = .
(2.18)
= (2.25)
= ℎ ≤ 2
2.0 ℎ > 2(2.26)
=cosℎ
ℎ ≤ 0
[( ℎ )( ℎ ) . ] ℎ > 0(2.27)
= 20 ℎ ≤ 015 ℎ > 0 (2.28)
= 4.9 ℎ ≤ 03 ℎ > 0 (2.29)
= 0.93 − 0.12 + 0.36ℎ −ℎ
− 0.6
= 0.36 − 0.12 + 0.93ℎ −ℎ
− 0.6 (2.30)
Takahashi (1994) extended Goda method to include effects of breaking wave impacts. This was
obtained by reanalyzing tests of caissons sliding under wave impacts (regular waves), together
with data on caisson movements at Sakata Port. The modification is applied by changing the
coefficient to be the maximum of or a new impulsive coefficient itself given by coefficients
representing the effect of wave height on the mound, and mound shape. The value of the coefficient
reaches a maximum of 2 at B/L = 0.12, d/h = 0.4, and H/d > 2; when d/h > 0.7, is always

Chapter 2. Wave forces and impacts on a conventional vertical breakwaters.
35
close to zero and is less than . It should be noted the impulsive pressure significantly decreases
when the approach angle of incidence wave, is oblique.
Blackmore and Hewson (1984) carried out full-scale measurements of wave impacts on a seawall
in the South of West England using modern measuring and recording equipment. Comparison of
new data sets with previous experiments and prediction formulae proved that impact pressures in
the field are generally lower than those measured during laboratory tests, mainly due to the high
percentage of air entrained. Based on their observations, Blackmore and Hewson (1984) developed
the following prediction formula for average pressures under broken waves:
= . . . (2.31)
Where the aeration factor λ has a dimension of [s−1] and accounts for the percentage of air
entrainment, T is the wave period and Csw is the shallow water wave celerity. British Standard code
of practice for marine structures (BS 6349) suggests evaluating wave impact pressures on seawalls
by means of Equation (2.31) using λ=0.3 s−1 and λ=0.5 s−1 respectively for rough/rocky foreshores
or regular beaches.
Kirkgoz (1982, 1983, 1990, 1991, 1992, and 1995) performed two-dimensional experiments using
regular waves forced to break in front of a vertical wall by means of an approaching beach of the
variable slope. Kirkgoz distinguished among early breaking, late breaking and perfect breaking
and highlighted the relative importance of deep water wave steepness and beach slope on the
maximum peak pressure and its position up the wall. Impact pressures and forces were found to
vary significantly for small changes in water depth at the wall and to reduce drastically when an
air pocket was entrapped between the wave front and the structure.
Within PROVERBS physical model tests at large- and small scale were run respectively in the
Large Wave Flume (GWK) of Hannover, Germany and in the Deep Wave Flume (DWF) at HR
Wallingford (HRW), Wallingford, UK. Analysis of large-scale tests led to results presented in
Kortenhaus et al. (1994) and Klammer et al. (1996), respectively in terms of horizontal wave
impact and uplift loading. The smaller-scale HR Wallingford tests are described in depth in Allsop
et al. (1996a, b, and c). The analysis of wave pressures and forces suggested the development of a
new prediction method for wave impact forces on vertical breakwaters (Allsop et al., 1996a; Allsop
Chapter 2. Wave forces and impacts on a conventional vertical breakwaters.
36
and Vicinanza, 1996). The method is recommended in Oumeraci et al. (2001) for preliminary
design and the British Standards (BS6349-1, 2000) and is expressed by:
. = 15. . . ℎ . ( / /ℎ) . (2.32)
The advances in knowledge and prediction of wave loadings within PROVERBS led to a new
procedure to assess wave impact loads on vertical breakwaters or seawalls. The new methodology
is the first to quantitatively account for uncertainties and variability in the loading process and
therefore represented a step forward towards the development of a more rational and reliable
design tool. Moving from the identification of the main geometric and wave parameters, the
method proceeds through 12 steps to evaluate wave forces (landward, up-lift and seaward),
together with the corresponding impact rise time and pressure distribution up the wall. The new
design methods are described in details in Allsop et al. (1999) and Oumeraci et al. (2001). In the
methodology, it was shown that the maximum horizontal impact force could be given by,
. = .∗. . . (2.33)
The relative maximum wave force F*himp is assumed to obey a Generalized Extreme Value (GEV)
distribution, given by:
.∗ = . (1 − . %) + (2.34)
Where P% is the probability of non-exceedance of impact forces (suggested value for P is 90%)
and , ξ and are the scale, shape and location parameters of the GEV pdf, given as a function
of the bed slopes.
Recent studies have been made by Cuomo et al., (2010, 2011). Within the VOWS (Violent
Overtopping by Waves at Seawalls) project (Cuomo, 2010), a series of large-scale physical model
tests have been carried out. A new prediction formula was introduced and compared with previous
measurements from physical model tests, giving satisfactory results. Cuomo et al., (2011) then
presented a new approach to the definition of loads for use in performance design of vertical
structures subject to breaking wave impacts.
Chapter 2. Wave forces and impacts on a conventional vertical breakwaters.
37
2.6 Wave impacts theory
2.6.1 Theoretical model studies
This section presents previous theoretical studies of wave impacts on coastal structures. Weggel
and Maxwell (1970) and Partenscky and Tounsi (1989) have modeled the wave impact on vertical
walls by solving the wave equation in a compressible fluid. In this thesis, we assume that the fluid
is incompressible so we take the fluid velocities to be much less than the speed of sound, cs.
However, compressibility is important in wave impacts where the air is trapped in the water.
Cooker and Peregrine (1990) modeled the wave as a rectangular region which is filled by fluid in.
Cooker and Peregrine (1995) use the theory for studies of impact of deep water waves, impact in
a container, the impact of a water sheet on still water and a triangular wave. They concluded that
pressure impulse field is insensitive to variations of the wave’s shape at distances greater than half
the water depth from the impact region. Kirkgöz and Mamak (2004) developed a theoretical
approach for the pressure impulse on a vertical wall using boundary element methods and the
results show good agreement with experimental data. They concluded that if the impact pressure
rise time is known, the pressure impulse model can be used to predict the wave impact pressures
on vertical seawalls.
Okamura (1993) presented theoretical work on wave impacts on an inclined plane wall. He
indicated that the largest pressure impulse on a wall occurred when the wall is near to vertical, in
contrast to the results of Kirkgöz (1991). The application of pressure impulse theory has been used
to show that the impulsive force due to a wave can move a large object near a seawall. Cooker and
Peregrine (1992), considered a hemispherical boulder on the bed, and Cox and Cooker (1999),
considered a spherical boulder. They found that the impulse is directly proportional to the boulder
volume and indicated that the impulse on a long thin body is larger compared to low wide ones
and that such shapes will move the farthest. Another application of pressure impulse theory was
for impact in containers by Topliss, (1994) and impacts under a deck by Wood and Peregrine,
(1996). Wood and Peregrine (1998) studied three-dimensional examples for wave impact on a
vertical seawall. They suggested that the three-dimensional model should be included if waves
have a crest width less than twice the water depth.
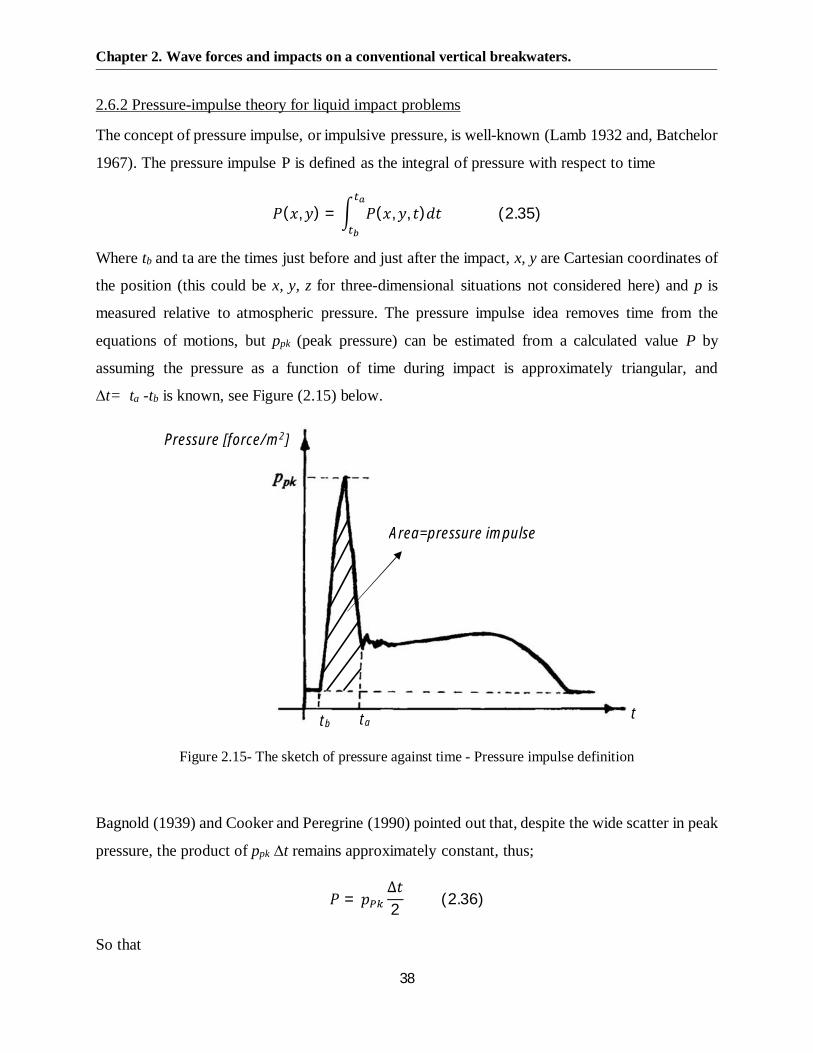
Chapter 2. Wave forces and impacts on a conventional vertical breakwaters.
38
2.6.2 Pressure-impulse theory for liquid impact problems
The concept of pressure impulse, or impulsive pressure, is well-known (Lamb 1932 and, Batchelor
1967). The pressure impulse P is defined as the integral of pressure with respect to time
( , ) = ( , , ) (2.35)
Where tb and ta are the times just before and just after the impact, x, y are Cartesian coordinates of
the position (this could be x, y, z for three-dimensional situations not considered here) and p is
measured relative to atmospheric pressure. The pressure impulse idea removes time from the
equations of motions, but ppk (peak pressure) can be estimated from a calculated value P by
assuming the pressure as a function of time during impact is approximately triangular, and
∆t= ta -tb is known, see Figure (2.15) below.
Figure 2.15- The sketch of pressure against time - Pressure impulse definition
Bagnold (1939) and Cooker and Peregrine (1990) pointed out that, despite the wide scatter in peak
pressure, the product of ppk ∆t remains approximately constant, thus;
=∆2 (2.36)
So that
tb tat
Pressure [force/m2]
Area=pressure impulse
Chapter 2. Wave forces and impacts on a conventional vertical breakwaters.
39
≈2∆ (2.37)
Since ∆t is prone to uncertainty, any estimate of ppk is also uncertain. For extreme impact, ppk may
be very large and ∆t very small, but the product given in Equation (2.36) will remain finite and
approximately constant for wave impacts from similar waves. From comparisons of their result
with some experimental measurements, they justified that this simple theory using simple
boundary conditions gives approximate solutions for various wave shapes.
The Governing Equations
From the mathematical model proposed by Cooker and Peregrine (1990, 1995), the governing
equations for the problem can be stated as below. The change in velocity during the impulsive
event is supposed to take place over such a short time that the nonlinear convective terms in the
equation of motion are negligible compared with the time derivative, giving
= −1∇ (2.38)
Viscosity and surface tension are negligible in all applications we have considered. Although
compressibility may be important for a brief moment, even for impact velocities well below the
speed of sound, it is neglected here. It is easy to see that next to the impact zone there is a small
region where nonlinear terms are not negligible, e.g. see Howison et al.’s (1991) treatment of water
entry; however, the pressure-impulse approach gives a good ‘outer’ approximation. By integrating
Equation (2.38) with respect to time through the impact interval, [tb, ta], and use definition (2.35)
for the pressure impulse P, to arrive at
− = −1∇ (2.39)
Where Ñ .ub, and Ñ .ua, both vanish. Taking the divergence of (2.39), we find that the pressure
impulse satisfies Laplace’s equation
∇ = 0(2.40)
Consideration of the curl of (2.38) and (2.39) shows that the pressure impulse does not change
the vorticity of the flow. The boundary conditions to be applied to Laplace’s equation are readily
found to be as follows.
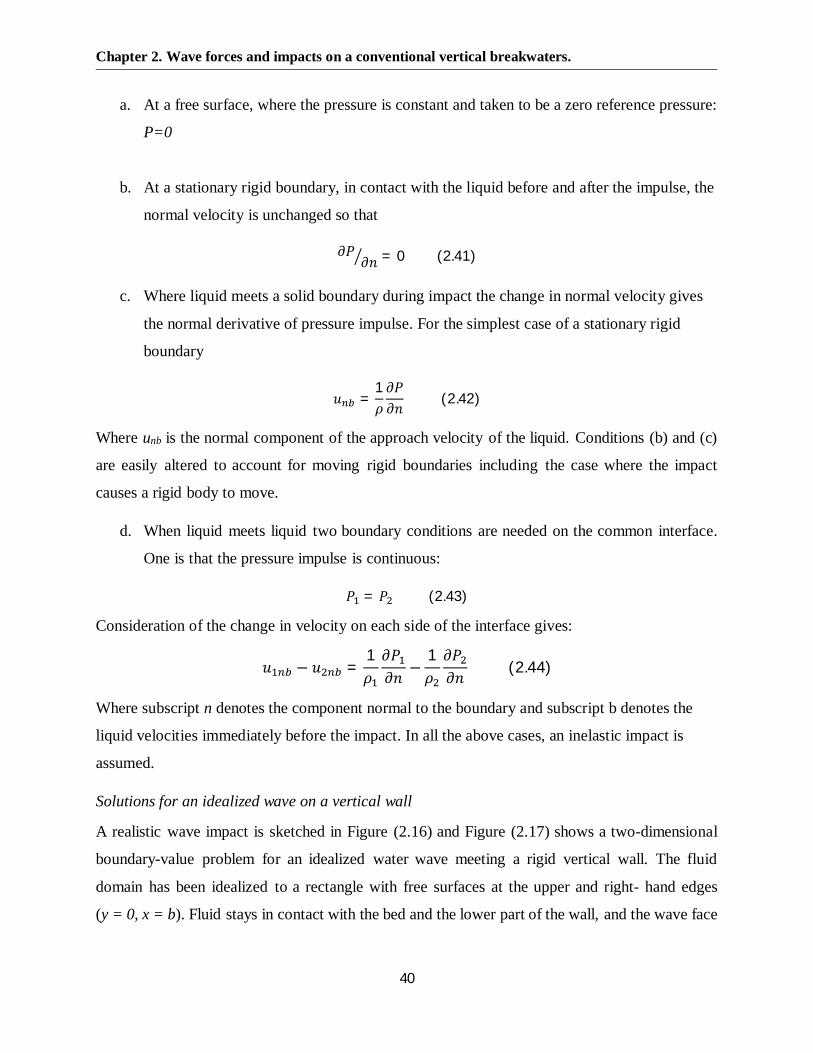
Chapter 2. Wave forces and impacts on a conventional vertical breakwaters.
40
a. At a free surface, where the pressure is constant and taken to be a zero reference pressure:
P=0
b. At a stationary rigid boundary, in contact with the liquid before and after the impulse, the
normal velocity is unchanged so that
= 0(2.41)
c. Where liquid meets a solid boundary during impact the change in normal velocity gives
the normal derivative of pressure impulse. For the simplest case of a stationary rigid
boundary
=1
(2.42)
Where unb is the normal component of the approach velocity of the liquid. Conditions (b) and (c)
are easily altered to account for moving rigid boundaries including the case where the impact
causes a rigid body to move.
d. When liquid meets liquid two boundary conditions are needed on the common interface.
One is that the pressure impulse is continuous:
= (2.43)
Consideration of the change in velocity on each side of the interface gives:
− =1
−1
(2.44)
Where subscript n denotes the component normal to the boundary and subscript b denotes the
liquid velocities immediately before the impact. In all the above cases, an inelastic impact is
assumed.
Solutions for an idealized wave on a vertical wall
A realistic wave impact is sketched in Figure (2.16) and Figure (2.17) shows a two-dimensional
boundary-value problem for an idealized water wave meeting a rigid vertical wall. The fluid
domain has been idealized to a rectangle with free surfaces at the upper and right- hand edges
(y = 0, x = b). Fluid stays in contact with the bed and the lower part of the wall, and the wave face

Chapter 2. Wave forces and impacts on a conventional vertical breakwaters.
41
impacts on the upper part of the wall. The distance from the bed to the wave crest is H, and the
wave strikes a fraction, µ of this height.
Figure 2.16- The sketch of a coastal wave impact.
It is assumed that the normal component of impact velocity is a constant: U0 > 0 in the impact
zone x = 0, - µ H < y < 0, though a general distribution of impact speed unb (y) can be easily
accounted for by the following method.
The boundary conditions are as shown in Figure (2.17). The problem is solved using separation of
variables in Laplace’s equation, and Fourier analysis, giving:
( , ) = sin( / )sinh[ ( − )/ ]
cosh( ( / )(2.45)
For - H < y < 0, and 0 < x < b where = ( − 0.5) and the constants are
= 2− 1
(2.46)
Figure 2.17- The impact of a rectangle of fluid on a vertical wall at x = 0. The impact zone stretches fromthe top free surface, part-way down the wall, occupying a fraction µ of water height, H. The back of thewave at x = b is a free surface with P = 0. Image taken from Cooker & Peregrine (1985)
∇ ( , ) = 0
= 0
= 0
=
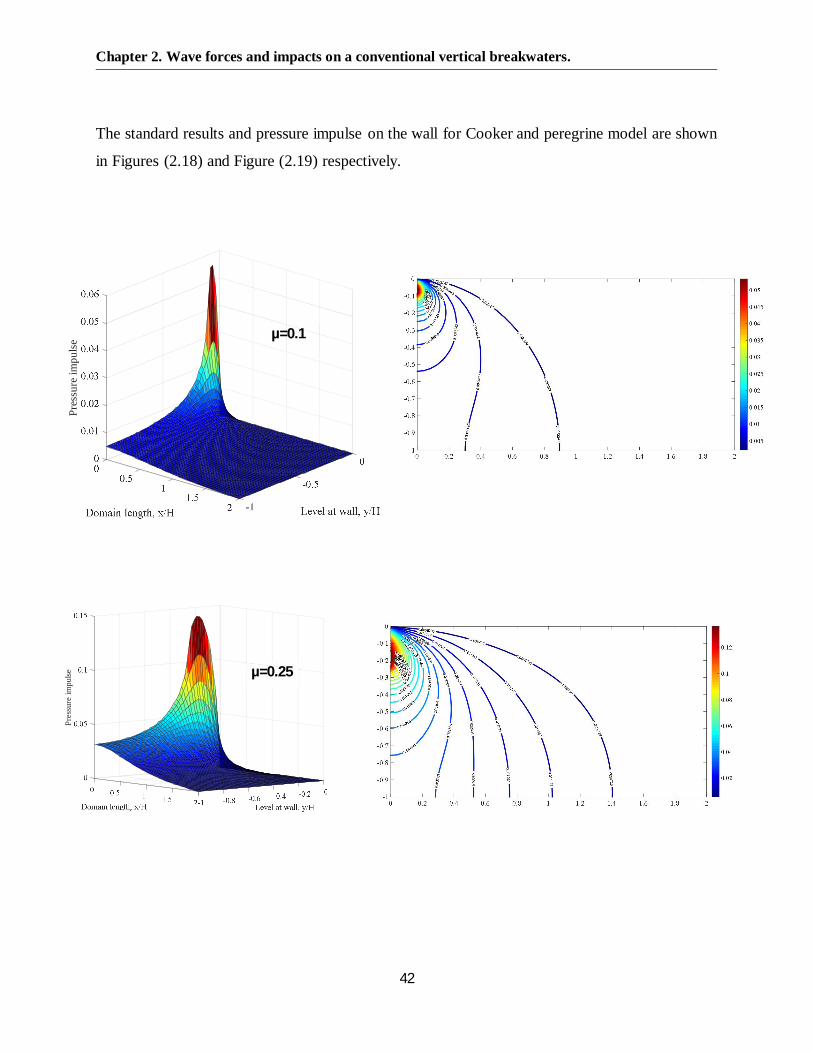
Chapter 2. Wave forces and impacts on a conventional vertical breakwaters.
42
The standard results and pressure impulse on the wall for Cooker and peregrine model are shown
in Figures (2.18) and Figure (2.19) respectively.
Pres
sure
impu
lse µ=0.1
Pres
sure
impu
lse µ=0.25

Chapter 2. Wave forces and impacts on a conventional vertical breakwaters.
43
Figure 2.18- Standard result for non-dimensional pressure impulse Cooker and peregrines model for
varying µ with b=2 and H=1.
Level at wall, y/H
0-0.5
-121.5
Domain length, x/H
10.5
0
0.3
0
0.15
0.2
0.1
0.25
0.05
Pres
sure
impu
lse
µ=0.5
Pres
sure
impu
lse µ=0.75
Pres
sure
impu
lse
µ=1

Chapter 2. Wave forces and impacts on a conventional vertical breakwaters.
44
Peregrine (2003) indicated that the pressures measured from the experiment are much greater than
would be expected. On the other hand, the pressure impulse, which is pressure integrated with
respect to time, shows greater consistency. He also suggested that there are a few important
parameters that influence the impact of a wave at a wall that needs to be considered.
Figure 2.19- The pressure impulse on the wall, = (0, ) for = 0.1, 0.25, 0.5, 0.75 and
1.0. The maximum pressure is 0.742 when = 1 and occurs at = −1
The parameters are the mean water depth at the wall, the geometry of the wall, the shape of the
wave as it meets the wall, and the water depth at the wall. The assumptions that we have made to
model this theory are that the wall is vertical and the seabed is horizontal immediately in front of
the wall. Whilst the impulse on the wall has obvious engineering significance, the impulse on the
seabed is also of interest. It can instantaneously liquefy any sand by driving water into it. This can
lead to destabilization of the foundation. Results for the seabed impulse are given in Figure (2.20).
Next section provides a background on sloping top breakwaters including hydraulic performance
and description of seaward impulse loads on such a breakwaters caused by wave overtopping.
y/H

Chapter 2. Wave forces and impacts on a conventional vertical breakwaters.
45
Figure 2.20- The pressure impulse on the seabed, = ( , −1) for = 0.1, 0.25, 0.5, 0.75 and1.0.
Pres
sure
impu
lse/
U0H

Chapter 3. Hydraulic characteristics of sloping top breakwater
46
CHAPTER 3
HYDRAULIC CHARACTERISTICS OF SLOPING TOP BREAKWATER
3.1 Introduction
In the last few decades, caisson breakwaters have seen a resurgence especially due to the increasing
need for breakwaters in deeper waters which makes caisson breakwaters attractive when compared
with rubble mound breakwaters from a cost, design and constructability perspective. In deep water
locations, the large waves generate tremendous forces acting on a breakwater, and the sloping top-
type breakwater has been found suitable for this application. Sloping-top breakwaters have a
superstructure that is sloped to reduce the wave forces. In addition, the downward force acting on
the slope cancel at least part of the uplift pressure, thereby increasing the breakwater stability. The
sloping-top breakwater has been used for many years, with the oldest structure of this type
constructed at Naples Port, Italy in 1906. Another one was built in the middle of the 1960s at
Hanstholm Harbor, Denmark, where the overturning moment and the total horizontal force acting
on a breakwater were reduced to about one-half the values of the vertical-type breakwater (Juhl,
1994; Ligteringen, 1994).
Figure 3.1- Niigata port (Japan)
Sloping-top caissons have also been constructed in deep water regions in Taiwan, China, and
Libya, where wave conditions are severe (Kuo, 1994; Xie, 1994). In Japan, this caisson type has
been built at Niigata, Miyazaki, and Kochi Ports. Figure (3.1) shows a photograph of one under
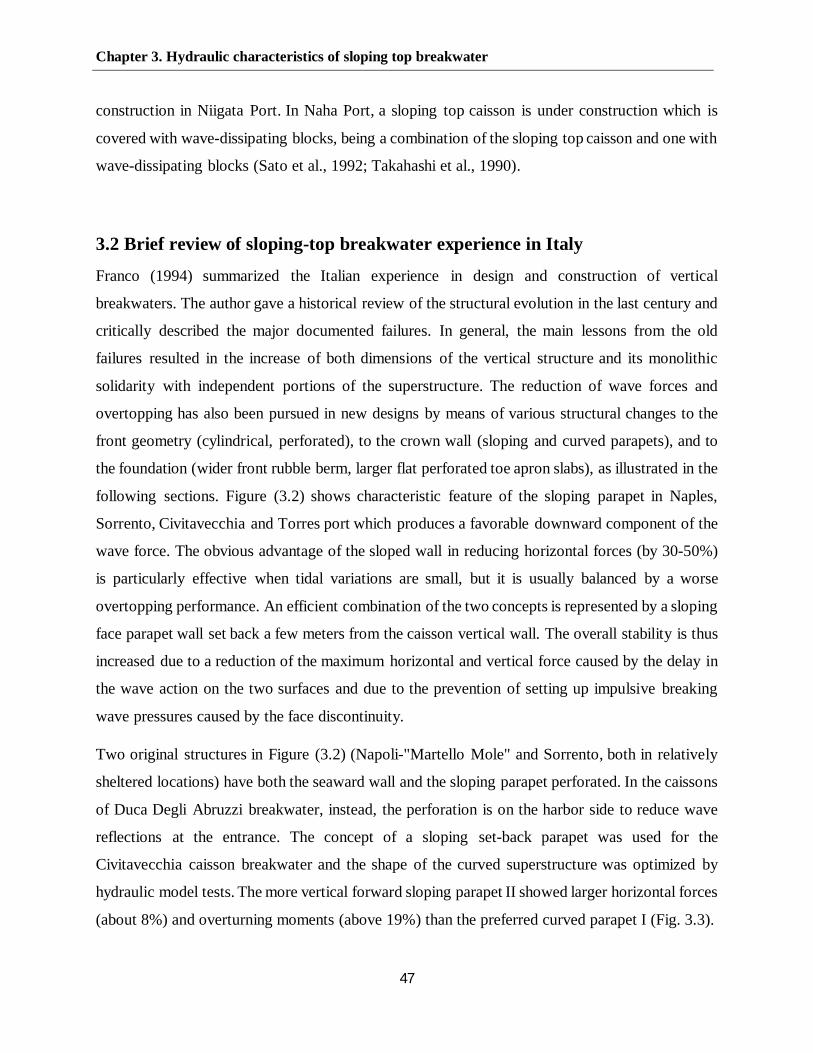
Chapter 3. Hydraulic characteristics of sloping top breakwater
47
construction in Niigata Port. In Naha Port, a sloping top caisson is under construction which is
covered with wave-dissipating blocks, being a combination of the sloping top caisson and one with
wave-dissipating blocks (Sato et al., 1992; Takahashi et al., 1990).
3.2 Brief review of sloping-top breakwater experience in Italy
Franco (1994) summarized the Italian experience in design and construction of vertical
breakwaters. The author gave a historical review of the structural evolution in the last century and
critically described the major documented failures. In general, the main lessons from the old
failures resulted in the increase of both dimensions of the vertical structure and its monolithic
solidarity with independent portions of the superstructure. The reduction of wave forces and
overtopping has also been pursued in new designs by means of various structural changes to the
front geometry (cylindrical, perforated), to the crown wall (sloping and curved parapets), and to
the foundation (wider front rubble berm, larger flat perforated toe apron slabs), as illustrated in the
following sections. Figure (3.2) shows characteristic feature of the sloping parapet in Naples,
Sorrento, Civitavecchia and Torres port which produces a favorable downward component of the
wave force. The obvious advantage of the sloped wall in reducing horizontal forces (by 30-50%)
is particularly effective when tidal variations are small, but it is usually balanced by a worse
overtopping performance. An efficient combination of the two concepts is represented by a sloping
face parapet wall set back a few meters from the caisson vertical wall. The overall stability is thus
increased due to a reduction of the maximum horizontal and vertical force caused by the delay in
the wave action on the two surfaces and due to the prevention of setting up impulsive breaking
wave pressures caused by the face discontinuity.
Two original structures in Figure (3.2) (Napoli-"Martello Mole" and Sorrento, both in relatively
sheltered locations) have both the seaward wall and the sloping parapet perforated. In the caissons
of Duca Degli Abruzzi breakwater, instead, the perforation is on the harbor side to reduce wave
reflections at the entrance. The concept of a sloping set-back parapet was used for the
Civitavecchia caisson breakwater and the shape of the curved superstructure was optimized by
hydraulic model tests. The more vertical forward sloping parapet II showed larger horizontal forces
(about 8%) and overturning moments (above 19%) than the preferred curved parapet I (Fig. 3.3).
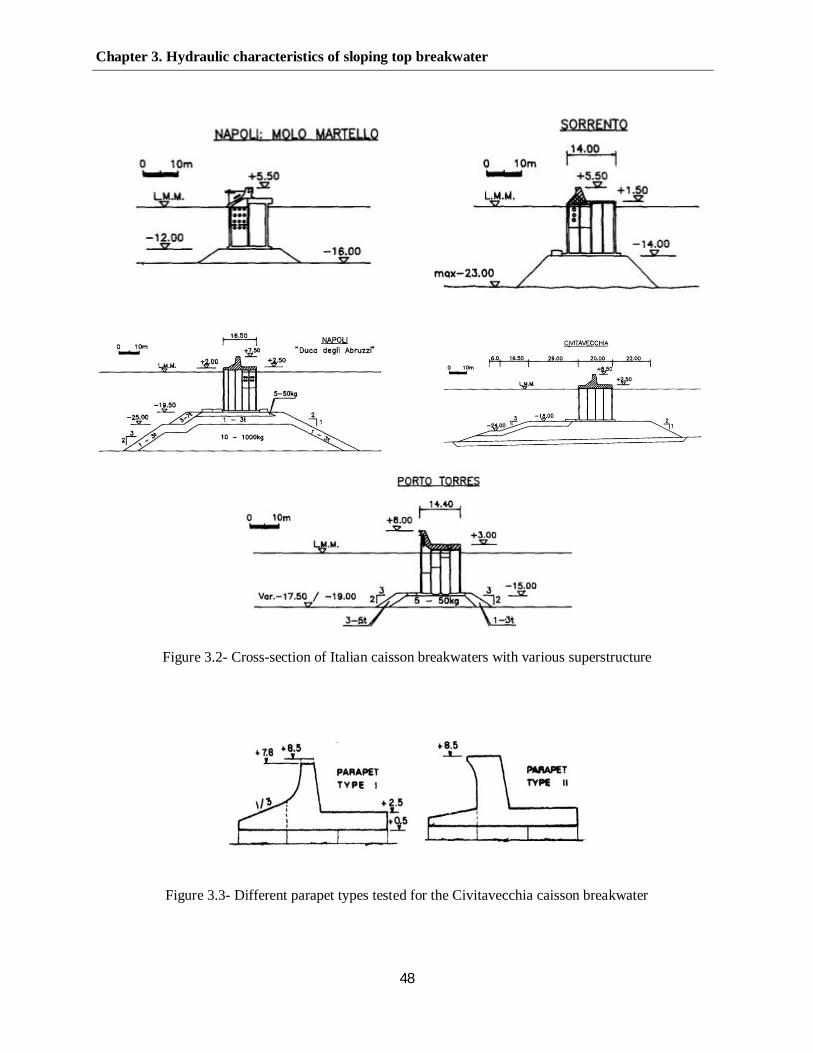
Chapter 3. Hydraulic characteristics of sloping top breakwater
48
Figure 3.2- Cross-section of Italian caisson breakwaters with various superstructure
Figure 3.3- Different parapet types tested for the Civitavecchia caisson breakwater

Chapter 3. Hydraulic characteristics of sloping top breakwater
49
3.3 Hydraulic aspect of sloping top breakwaters
A large amount of work has been done in the past to characterize the hydraulic response of caisson
breakwaters addressing both overtopping and wave forces. These studies have incorporated
deterministic and probabilistic approaches and refinements/corrections/adjustments to empirical
guidance account in order to specifically account for the varying impacts due to different
superstructure parapet geometries (Goda, 1985; Juhl and van der Meer, 1992; Franco et al., 1994;
Takahashi et al., 1994, Oumeraci et al., 2001 (PROVERBS), Eurotop (2007) and others). However,
the somewhat limitless range and choice of superstructure geometries that are available to a
designer, which critically affects the overall hydraulic response of the breakwater, makes it
inevitable that specific guidance for a particular superstructure geometry will always be lacking,
and at the very least, be underscored by a large band of uncertainty. This uncertainty, in turn,
translates to unnecessary conservatism in deterministic guidance. Further, empirical formulae used
to estimate wave overtopping and wave forces on a caisson breakwater typically provide estimates
for maximum wave forces under a quasi-static assumption and do not account for the impulsive
landward and seaward loads due to wave impacts that can exceed hydrostatic forces by an order
of magnitude.
3.3.1 Wave force acting on loping top breakwater
Although demands for building the sloping top caisson have increased in recent years, its design
method is not yet well established. Here, the characteristics of wave forces on a sloping top caisson
are discussed and a new pressure formula is proposed based on the results of a series of laboratory
experiments.
Current design method for a sloping top caisson
The currently used Japanese design method for the sloping top caisson was initially proposed by
Morihira and Kunita (1979), who modified the Goda pressure formula (Goda, 1985) for vertical
breakwaters. Takahashi et al. (1994) also extended the original method by Goda accounting for the
effect of a berm, sloping top, wave breaking and incident wave angle. The current deign method
for designing sloping top breakwaters remain unchanged after Takahashi et al. (1994). Figure (3.4)
shows the design wave pressure distribution in which the fundamental pressure distribution is the
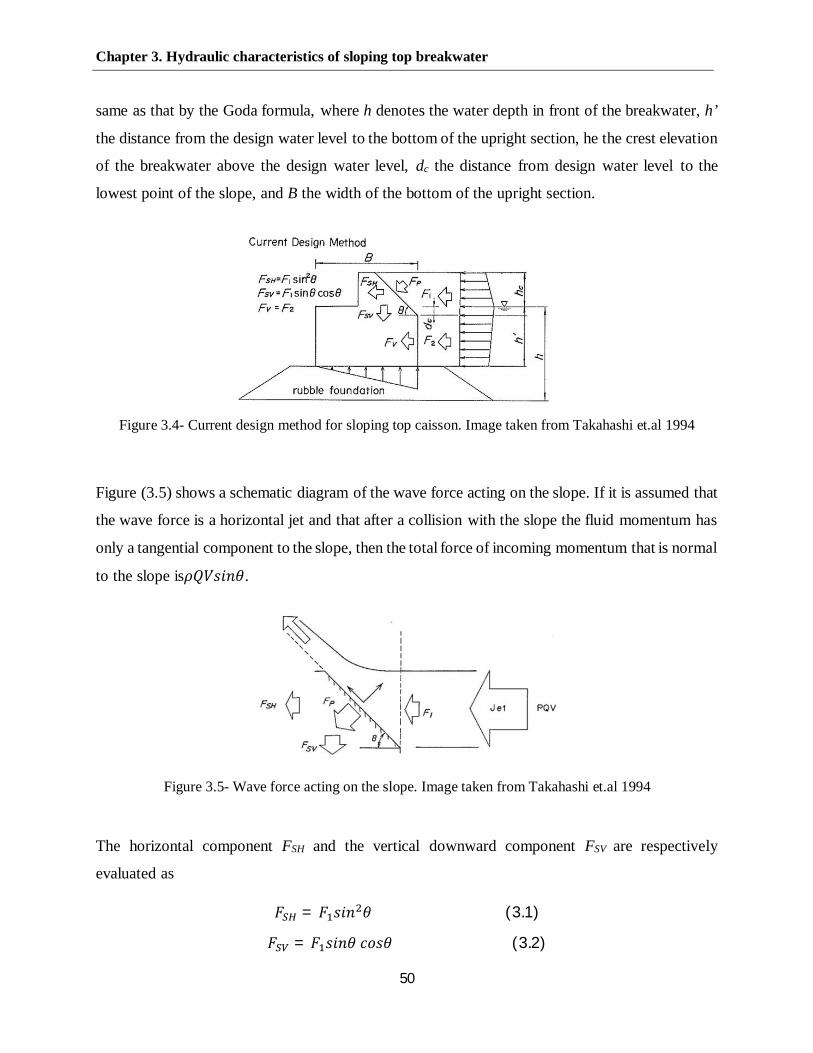
Chapter 3. Hydraulic characteristics of sloping top breakwater
50
same as that by the Goda formula, where h denotes the water depth in front of the breakwater, h’
the distance from the design water level to the bottom of the upright section, he the crest elevation
of the breakwater above the design water level, dc the distance from design water level to the
lowest point of the slope, and B the width of the bottom of the upright section.
Figure 3.4- Current design method for sloping top caisson. Image taken from Takahashi et.al 1994
Figure (3.5) shows a schematic diagram of the wave force acting on the slope. If it is assumed that
the wave force is a horizontal jet and that after a collision with the slope the fluid momentum has
only a tangential component to the slope, then the total force of incoming momentum that is normal
to the slope is .
Figure 3.5- Wave force acting on the slope. Image taken from Takahashi et.al 1994
The horizontal component FSH and the vertical downward component FSV are respectively
evaluated as
= (3.1)
= (3.2)

Chapter 3. Hydraulic characteristics of sloping top breakwater
51
Where F1 is the force integrated over the design pressure distribution for a range corresponding to
the height of the sloping superstructure and θ is defined as the angle between the face of the slope
and a horizontal line. When 0 is 45°, the horizontal wave force FSH on the sloping superstructure
is one half the wave force on an equivalent vertical wall F1. The wave forces on a vertical wall FV
and the design uplift force on a sloping caisson FU can be directly calculated from the Goda
formula, i.e.,
= (3.3)
=12 (3.4)
Where PU is the uplift pressure on the bottom of the caisson's offshore side and F2 is the wave
force on the caisson's upright wall, both of which are calculated using the Goda formula.
Takahashi et al. (1994) performed a number of regular wave experiments on six types of sloping
top caissons shown in Figure (3.6). Type 1 is a standard caisson, having a slope starting from the
still water level (dc = 0), while Type 2 is a semi-sloping top caisson, having a slope starting above
the water level. Types 3-6 are semi-submerged sloping top caissons having an entirely submerged
slope and are newly conceived to emphasize the stability created by the slope. The crest elevation
hc is 32 cm for Types 1-3 and 16 cm for Types 4-6. The lowest point of Type 5's slope is the
deepest, although its hc is the same as that for Type 3. θ is 45° for Types 1-5 and 56° for Type 6.
Figure 3.6- Typical cross sections of sloping top breakwaters used in model tests. Takahashi et al. (1994).

Chapter 3. Hydraulic characteristics of sloping top breakwater
52
Regular waves were applied to the models to take wave force measurements. Six wave heights:
23.8, 33.3, 42.8, 56.9, 61.9 cm and five wave periods: 2.1, 2.6, 2.8, 3.0, 3.5 s were adopted for the
experimental waves. Throughout the experiment, water depth h was 104 cm, and therefore, wave
length L is only dependent on T. The experimental maximum and minimum values for wave
steepness H/L were 0.109 and 0.0227, respectively. Analyzing data by Takahashi et.al (1994)
showed that for wave force on the slope the experimental values decrease as H/h increases, whereas
the calculated ones contrastingly increase. On the other hand results corresponding to horizontal
wave load on the upright section indicate that the experimental values are comparatively less than
the calculated ones, and decrease with increases in H/h, whereas the calculated values contrastingly
increase. In sum, it was concluded that the wave forces on the slope of the sloping top caissons are
larger than those calculated by the current design method, while the current design method
overestimates the wave forces of the upright wall of the sloping top caissons. Hence the authors
established a reasonable design method for the sloping top caisson, they introduced a new
modification coefficient that can express the wave force on the slope, more appropriately, i.e.
= (3.5)
where the difference of measured and calculated FSH; is significantly dependent on H and T, and
the phase difference between the peak of the wave force on the slope and that on the vertical wall
is dependent on wave speed and length. Based on the dependence of on H/L and θ, a design
formulation for is proposed as follows:
= min{max 1.0, −23 + 0.46 + , }(3.6)
In the current design method, the wave force on the vertical wall of the sloping top caisson is the
same as that estimated using the Goda formula for vertical breakwaters. Since this current design
method overestimates the wave force on the upright section, another modification coefficient is
introduced to express this force, being defined as:
= (3.7)
Where
= min{1.0, 1.1,1.1 +11
− 5.0 / }(3.8)

Chapter 3. Hydraulic characteristics of sloping top breakwater
53
As pointed out by Takahashi et.al (1994) through using these modification coefficients
( and ) the new method can reasonably evaluate wave forces on the sloping top caissons,
and can properly express their toughness.
3.3.2 Wave transmission
Figure (3.7) shows tests results which have been carried out to investigate the wave transmission
coefficient, KT, for the six profiles of sloping-top breakwaters shown in Figure (3.6).
Figure 3.7- Transmission coefficient for sloping top breakwaters. [From Takahashi et al. (1994).]
From these experiments, it is obvious that the sloping-top breakwater has a relatively large
transmission coefficient, KT, compared to ordinary vertical wall breakwater, and that KT becomes
larger when either θ (sloping top angle) is smaller and/or the value of dc is negative and larger.
3.3.3 Wave reflection
The wave-reflection coefficients, KR, obtained from the aforementioned model tests as a function
of HI/h (Fig. 3.8) indicate that wave reflection by the sloping top breakwaters is smaller than that
by the conventional vertical wall breakwater. This is basically attributed to wave overtopping and
eddies that are generated at the lower edge of the slope.

Chapter 3. Hydraulic characteristics of sloping top breakwater
54
Figure 3.8- Reflection coefficient for sloping top breakwaters. [From Takahashi et al. (1994).]
3.3.4 Wave overtopping
Wave overtopping is one of the most important hydraulic responses of a breakwater. In case of
sloping top caissons, there is no empirical formula which provides estimates of overtopping for
such breakwaters.
3.4 Seaward wave loadings
Research under the MAST III PROVERBS project (Oumeraci et.al 2001) identified seaward
failure as a potentially significant failure mode of vertical breakwaters. Caisson breakwaters
experience static and dynamic loads on both sides but it is usually the forces generated by wave
action on the seaward side which are critical for stability. As a result, design methods have
developed to provide tools for the prediction of landward loads (e.g. Minikin, 1950; Goda, 1974).
However, there are many examples of breakwater failures which have involved seaward motion
which indicate that consideration should be given to forces generated on the harbor side. The
Chapter 3. Hydraulic characteristics of sloping top breakwater
55
resulting discussion revealed that relatively little was known about such a failure mechanism, but
results from pressure impulse theory indicated a likely cause. Experience with pressure impulse
theory calculations, especially Wood and Peregrine’s 1996 study of wave impact beneath a deck,
had revealed how pressure due to an impact can be enhanced if it is in a relatively confined region.
The impact of overtopping ping water on the water behind a breakwater is one such situation.
During wave impact on a vertical wall, the pressure is noticeably reduced by the presence of air at
the top of the wall. In contrast, impact on the surface of water close to a vertical wall can have its
effect almost doubled because there is no pressure relief at the wall.
3.4.1 Evidence of Seaward Failures
There have been several cases of vertical breakwaters tilting in a seaward direction. Oumeraci
(1994) made a review of breakwater failures and lists the breakwaters of Madras, Valencia,
Catania, Algiers, and Niigata as failing in this way (see Table 1.1). He reports that: “Most of the
damaged structures had a low crest and were hence heavily overtopped. In this respect, a number
of failures also occurred during construction while the superstructure was not completed. As a
result, heavy wave overtopping and breaking on the structure took place which generally leads to
differential settlements, thus resulting in the seaward tilt of the breakwater, irrespective of the type
of structure. Although these failure mechanisms have often been attributed to seabed scour and to
liquefaction the actual reason for this ‘abnormal’ behavior and the ‘abnormal’ forces which
prevailed are still not understood”. Minikin (1950). Provides a description of the seaward collapse
of the Mustapha breakwater in Algeria in 1934. The structure was designed to withstand waves of
5 m height and 80 m wavelength. Within three years of its completion, it was subjected to a severe
storm, the waves of which were estimated to be over 9 m high and 180 m in length. This caused
400 m of the breakwater to collapse in a seaward direction. The waves were so large that the
structure was overtopped by unbroken crests which then plunged into the harbor. Minikin reports
that failure occurred suddenly just after the crest of a wave passed over the parapet with the
structure falling into the following trough. Minikin attributed failure to dynamic effects, the
breakwater rotating on its heel as the wave passed over, then falling back into place and being
carried into the trough by its own momentum whilst being pulled by suction forces. Hattori et al.
(1994) show seaward pressures caused by high-velocity flow up a structure face immediately prior
Chapter 3. Hydraulic characteristics of sloping top breakwater
56
to impact.They also show seaward pressures caused by oscillations in the entrapped air.
In addition, recent marine measurements have shown that water cascading down the face of a near
vertical breakwater can cause short, localized seaward impulses Bullock et al., 1999. These
authors have not suggested that such loads might represent a risk of monolithic seaward failure for
prototype structures, presumably because of their transient and localized nature. However, it has
been noted that they may be a cause of local block displacement in masonry structures (Muller,
1997). In addition, Oumeraci and Kortenhaus (1994) observed that fluctuation in entrapped air
pocket size and the resulting pressure changes might cause dynamic amplification of structural
motion and so cause overall failure. A theoretical model for entrapped air oscillation was
developed by Topliss et al. (1992).
3.4.2 Quasi-static
The horizontal quasi-hydrostatic loads acting on the upright section of a breakwater vary with the
fluctuations of water surface elevation on either side so that the overall force is landward when a
wave crest is at the front face and seaward in the presence of a trough. Three other effects that may
increase quasi-hydrostatic seaward forces are harbor wave action and filling (due to overtopping)
and a reduction in water density on the seaward side due to aeration. A literature search for
references dealing with negative or suction forces confirmed that there is extremely little guidance
on this subject. Two prediction methods were identified: the first is ascribed by Takahashi (1996)
to Sainflou; and the other is by Goda (1967). Both theories were generally based on (relatively)
deep water conditions, and non-breaking or pulsating waves.
Sainflou Prediction Method
The formulae for the pressure under a wave trough, proposed by Sainflou (1928), has been given
in section (2.5.2). From the pressure distribution it is possible to derive the total negative force on
a simple wall given by:
=( − ℎ ) + ( + )(ℎ − + ℎ )
2 (3.9)

Chapter 3. Hydraulic characteristics of sloping top breakwater
57
Goda Prediction Method
In 1966, Goda published (in Japanese) a formula for forces induced on vertical walls by standing
waves. His theory was based on previous formulae introduced by Sainflou (1928) and used a fourth
order approximation of standing waves. In order to prove his theoretical assumptions Goda
completed his own laboratory tests. Both theory and tests considered regular waves. This resulted
in the diagrams shown in Figure (3.9), with which the maximum onshore (or landward) and
offshore (or seaward) forces acting on a vertical wall can be calculated.
Figure 3.9- Design diagram for onshore and offshore wave forces by Goda (1967)
The diagram indicates a particularly important point on which Goda remarks. For values of the
relative depth h/L > 0.25 the diagram suggests higher seaward forces than landward forces for
most wave steepnesses. It implies that for these conditions the negative forces (seaward forces)
govern the primary design response. It is worth noticing that in all calculations of net negative
force described above, it has been assumed that the same static water level acts on both sides of
the breakwater and that there are no additional wave-induced forces acting on the harbor side of
the structure. Any wave action or overtopping impacts within the harbor may act on the rear face
of the caisson to give forces additional to those discussed here.

Chapter 3. Hydraulic characteristics of sloping top breakwater
58
3.4.3 Impulsive wave loads
Goda 1967 showed that the force maxima in the seaward direction become larger than those in the
landward direction when the water depth is a quarter or more of the wavelength. This does not
explain the Mustapha failure since the depth of the water was only approximately one-tenth of the
wave length. In order to explain the failure of the Mustapha breakwater, it is, therefore, necessary
to identify a mechanism capable of generating significant seaward impulsive forces. The seaward
impulsive loads described in the literature are all quite small and accompanied with landward loads
of greater magnitude. Walkden et.al 2001 conducted a physical model study to investigate the
loads generated during the re-entry of an overtopping wave.
Walkden et.al (2001) study
Authors decided to base the design of the physical model on a ‘Hanstholm’ type of breakwater.
This is because the Hanstholm breakwater was designed with a sloping superstructure which
allowed overtopping and reduced landward loads. The model built at a length scale of 1:52.5 (see
Fig. 3.10) and short test runs of focused waves were used to generate a wave 170 mm high with a
period of 1s. This wave was used to provide an example of an overtopping wave with which to
begin the investigation of seaward loads.
Figure 3.10- Experimental model arrangement [Walkden et.al (2001)]
Two processes were identified as causes of high seaward forces, the plunge of the crest into the
harbor and the entrapment of air by the crest behind the caisson. Different stages of a typical
major overtopping event are illustrated in Figure (3.11).
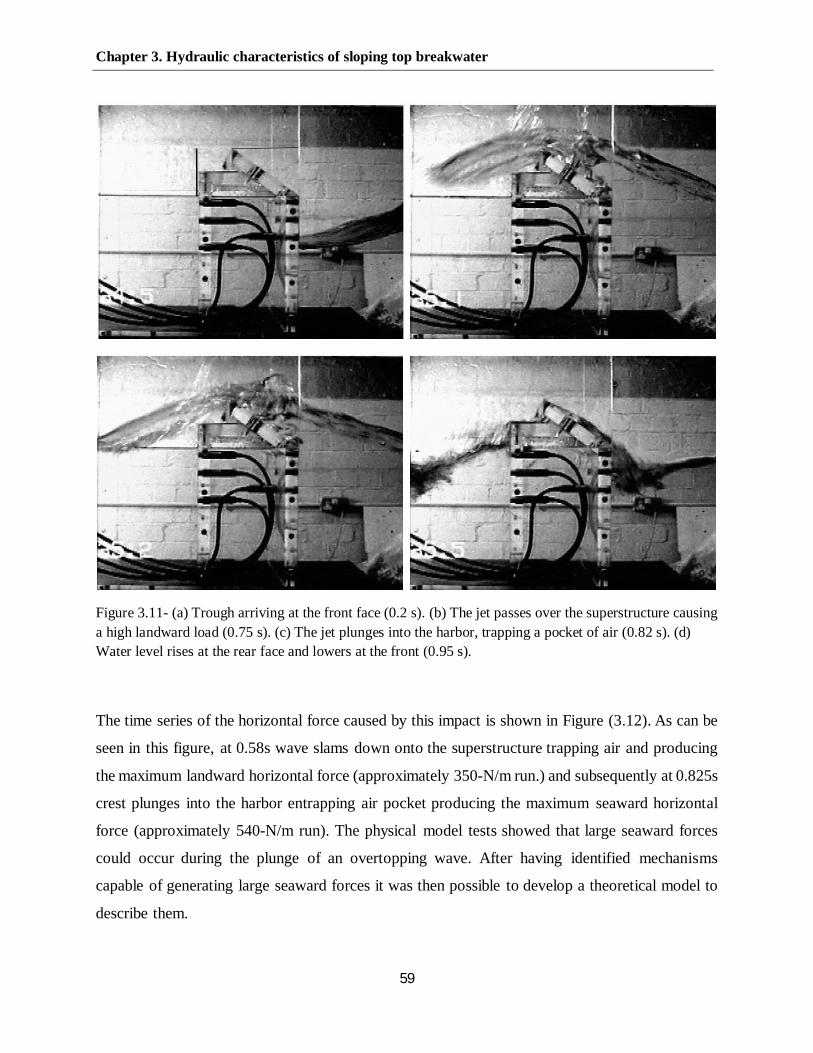
Chapter 3. Hydraulic characteristics of sloping top breakwater
59
Figure 3.11- (a) Trough arriving at the front face (0.2 s). (b) The jet passes over the superstructure causinga high landward load (0.75 s). (c) The jet plunges into the harbor, trapping a pocket of air (0.82 s). (d)Water level rises at the rear face and lowers at the front (0.95 s).
The time series of the horizontal force caused by this impact is shown in Figure (3.12). As can be
seen in this figure, at 0.58s wave slams down onto the superstructure trapping air and producing
the maximum landward horizontal force (approximately 350-N/m run.) and subsequently at 0.825s
crest plunges into the harbor entrapping air pocket producing the maximum seaward horizontal
force (approximately 540-N/m run). The physical model tests showed that large seaward forces
could occur during the plunge of an overtopping wave. After having identified mechanisms
capable of generating large seaward forces it was then possible to develop a theoretical model to
describe them.
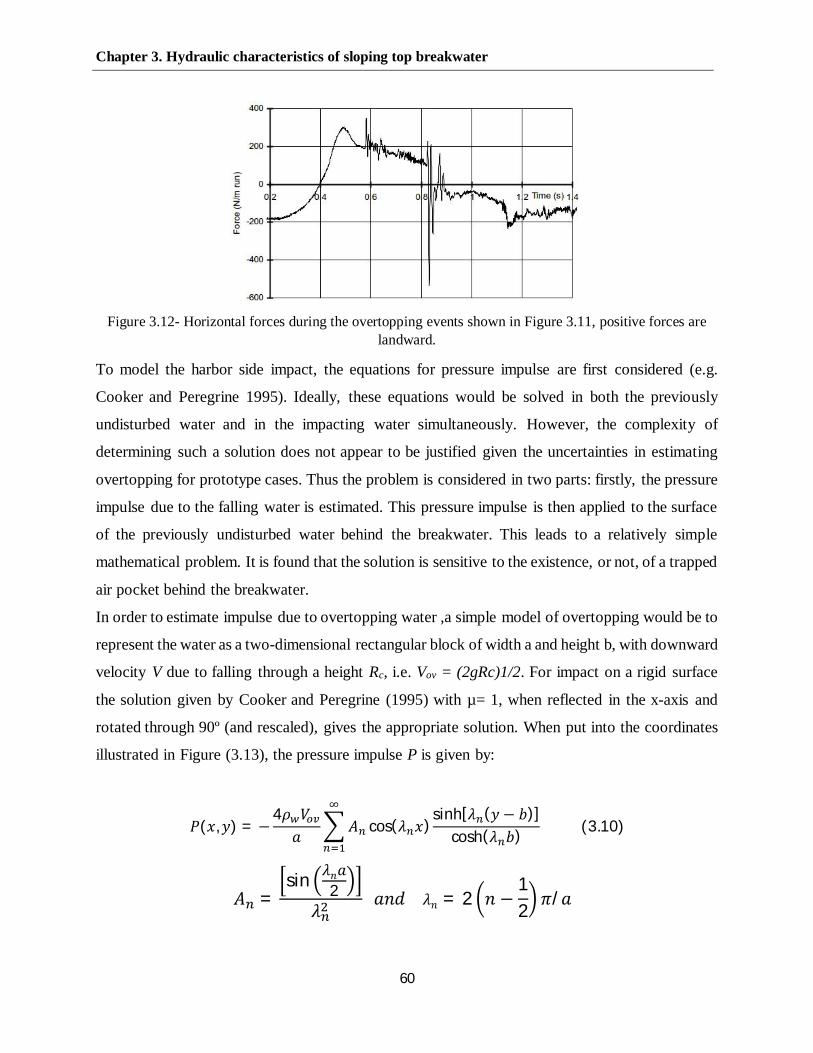
Chapter 3. Hydraulic characteristics of sloping top breakwater
60
Figure 3.12- Horizontal forces during the overtopping events shown in Figure 3.11, positive forces arelandward.
To model the harbor side impact, the equations for pressure impulse are first considered (e.g.
Cooker and Peregrine 1995). Ideally, these equations would be solved in both the previously
undisturbed water and in the impacting water simultaneously. However, the complexity of
determining such a solution does not appear to be justified given the uncertainties in estimating
overtopping for prototype cases. Thus the problem is considered in two parts: firstly, the pressure
impulse due to the falling water is estimated. This pressure impulse is then applied to the surface
of the previously undisturbed water behind the breakwater. This leads to a relatively simple
mathematical problem. It is found that the solution is sensitive to the existence, or not, of a trapped
air pocket behind the breakwater.
In order to estimate impulse due to overtopping water ,a simple model of overtopping would be to
represent the water as a two-dimensional rectangular block of width a and height b, with downward
velocity V due to falling through a height Rc, i.e. Vov = (2gRc)1/2. For impact on a rigid surface
the solution given by Cooker and Peregrine (1995) with µ= 1, when reflected in the x-axis and
rotated through 90º (and rescaled), gives the appropriate solution. When put into the coordinates
illustrated in Figure (3.13), the pressure impulse P is given by:
( , ) = −4
cos( )sinh[ ( − )]
cosh( ) (3.10)
=sin 2 = 2 −
12
/

Chapter 3. Hydraulic characteristics of sloping top breakwater
61
Figure 3.13- Body of water impacting on a still water level and respective boundary value problem.
Model parameters, which are shown in Table (3.1), were estimated from the physical model and
video records of the experiments. Measurements were taken, with a ruler, from appropriate frozen
video images. Figures (3.14) illustrate the 3D and contour plot from Cooker and peregrine model
1995 and Figures (3.15) and (3.16) show non- dimensional pressure impulse acting on still water
level cussed by overtopping jet against its width and depth for wave A.
Figure 3.14- Results for non-dimensional pressure impulse induced by block of water impact-Cooker andperegrine (1995) model.
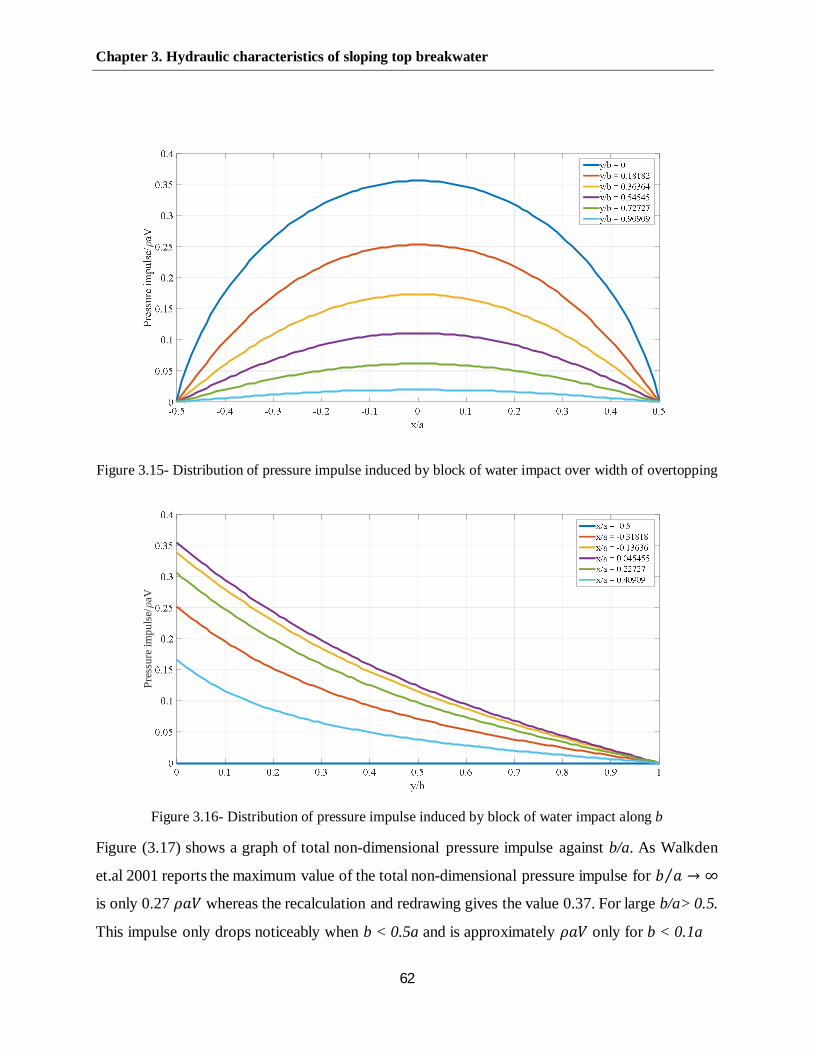
Chapter 3. Hydraulic characteristics of sloping top breakwater
62
Figure 3.15- Distribution of pressure impulse induced by block of water impact over width of overtopping
Figure 3.16- Distribution of pressure impulse induced by block of water impact along b
Figure (3.17) shows a graph of total non-dimensional pressure impulse against b/a. As Walkden
et.al 2001 reports the maximum value of the total non-dimensional pressure impulse for ⁄ → ∞
is only 0.27 whereas the recalculation and redrawing gives the value 0.37. For large b/a> 0.5.
This impulse only drops noticeably when b < 0.5a and is approximately only for b < 0.1a
Pres
sure
impu
lse/
aV

Chapter 3. Hydraulic characteristics of sloping top breakwater
63
Figure 3.17- Total non-dimensional impulse against ⁄ , for impact on a solid body by a rectangularblock of water- Heavy black line: Walkden et.al (2001). Dotted line: After recalculation
For comparison with experiment, an allowance must be made for the fact that this is a liquid-liquid
impact rather than a solid-liquid impact. The result for impact on water in Cooker and Peregrine
(1995, section 3.6), suggests that a multiplication of 0.58 should be applied, this being the ratio of
pressure impulse due to jet impact on a liquid to that due to jet impact on a rigid surface. In order
to evaluate pressure impulse in the water behind the breakwater, a new coordinate system is
introduced which is aligned with the back of the breakwater, as shown in Figure (3.18).
Accordingly, on the still water surface, y=0, the reduced pressure impulse is = 0.16 over
the impact area, extending from = = + .
Table (3.1) - Parameters for the theory from the experimental study. (Walkden et.al 2001)
WAVE Height ofovertopping, Rc (mm)
Air pocketlength, d (mm) a (mm) b (mm) Estimated pressure
impulse (Ns/m2)A 95 84 144 91 32B 95 52 91 57 20C 95 78 84 52 17
Over the area given by 0 < x < d, where there is a trapped air pocket if d > 0, the appropriate
boundary condition is not known. Initially, it was assumed atmospheric pressure, i.e. P = 0. The
latter showed qualitatively different behavior to the experimental points.
Pres
sure
impu
lse/
aV

Chapter 3. Hydraulic characteristics of sloping top breakwater
64
Figure 3.18- Pressure impulse problem behind the breakwater.
Walkden et.al (2001) pointed out that the assumption that the pressures in the air pocket at the top
of the wall are atmospheric is underestimated. They assigned 80% of pressure impulse induced by
overtopping jet to take account the effect pressure of entrapped air between wall the plunging jet.
Hence, the pressure impulse on the wall, taking the effect of an air pocket in the account, was given
as follows:
(0, ) =2 [ ( + ) − 0.2 ]
cosh ℎ cosh ( + ℎ) (3.11)
The Broken and solid lines in Figure (3.19) show the pressure impulse when = 0 and
when = 0.8 for impacts A, B and C respectively.
Figure 3.19- (a, b and c) Pressure impulse on the back of the caisson for waves A, B and C, respectively.Crosses denote values measured with the rear face transducers, the broken lines represent the pressureimpulse on the wall when = 0, and the solid lines the predictions corrected for the presence ofthe air pocket (Eq. 3.10). (Walkden et.al 2001).
Chapter 3. Hydraulic characteristics of sloping top breakwater
65
It is worthy to note that the aforementioned experiments carried out by Walkden (2001) were quit
limited and several other aspects of overtopping processes were not well established. As pointed
out by Walkden, in order to investigate this failure mode further, more consideration is required
of the dynamic behavior of the structure and its response, for which the phase relationships
between the different seaward and landward loads is required. Following sections will provide a
detailed description of a series of numerical experiments in prototype scale conducted to study
hydraulic performance of a sloping top caisson subject to wave overtopping.
Chapter 4. Numerical setup and primary results
66
CHAPTER 4
NUMERICAL SETUP AND PRIMARY RESULTS
4.1 Introduction
Over the past 30 years, numerical modeling techniques have been rapidly developing as
computational power has enhanced to the point where numerical solutions are now possible for
many applications. This development has led to the widespread use of numerical modeling as a
standard design tool in many engineering disciplines. Despite the wide range of numerical
modeling applications, the fundamental principles upon which all numerical models are based is
similar for all models. Problems begin with a set of partial differential equations that describe the
underlying physics of the particular situation. Some type of numerical methods, such as finite
difference analysis or the finite volume method is then used to formulate a set of algebraic
equations that represent the partial differential equations. An approximate solution to those
algebraic equations is then obtained through some form of either an iterative or matrix solution.
This solution is often very computationally intensive, which makes the use of modern
computational power so important to the use of numerical models. In most cases, the numerical
model solutions are verified or calibrated through comparisons to field observations or physical
model experiments before being applied in practice. Even after extensive model verification, sound
engineering judgment is required to ensure the accuracy of any model output. Computational Fluid
Dynamics (CFD) is a branch of numerical modeling that has been developed for solving problems
involving fluid flow. This includes applications involving fluid-solid interaction, such as the flow
of water in a river or over and around hydraulics structures. This study will focus on the use of
CFD to model the interaction wave between wave and sloping-top breakwaters. Since the flow
pattern in front of vertical structures can be very complex due to breaking waves, wave impacts,
wave interaction with complex shapes of the structure, the development of a numerical model
covering all relevant aspects in detail is extremely complex. Several types of numerical models
can, however, contribute to modeling and understanding of relevant processes. In addition to
empirical and mathematical methods, depth-averaged non-linear and weakly non-linear shallow
water wave equations are widely used in coastal and breakwater engineering practice. Other types
Chapter 4. Numerical setup and primary results
67
of numerical models solve the more fundamental Naiver-Stokes equations or make use of the
potential flow theory. Of this two-track approach, one is based on the Naiver-Stokes equations
solved by the so-called Volume-of-Fluid method (VOF). VOF modeling can not only produce
detailed profiles of the wave evolution, but also force-time graphs.
4.2 Numerical model
The CFD model selected for this study is the commercially available software „FLOW-3D‟ (Flow
Science 2009), which simultaneously solves the three dimensional, transient Naiver-Stokes
equations on a structured grid. Flow-3D is a powerful numerical modeling software capable of
solving a wide range of fluid flow problems. The program is based on the fundamental laws of
mass, momentum and energy conservation and applicable to almost any type of flow process. This
model is capable of fluid- boundary tracking by resolving fluid-fluid and fluid-air interfaces. The
model has also been used for various hydraulic and coastal engineering applications, such as flow
and scours around a bridge pier (Richardson and Panchang 1998), flow over a sharp-crested weir,
and the nearshore transformation of waves (Bradford 2000; Chopakatla 2003). The program also
has a number of other features including the ability to construct non-uniform grids, automatic time-
step selection, graphical post-processing, etc. It utilizes a finite difference solution scheme and is
able to calculate solutions using various implicit and explicit solver options. FLOW-3D uses a
simple grid of rectangular elements. Therefore, it has the advantages of easy mesh generation,
regularity for improved numerical accuracy, and minimal memory storage requirement. Geometry
is defined within the grid by computing the fractional face areas and fractional volumes of each
element that are blocked by obstacles. The use of a multiple and nested meshes, and the re-run
capability available in FLOW-3D software are other options that make the numerical model
suitable for hydraulic structure modeling. A good selection of different options across the entire
Flow-3D graphical user interface allows the software to be applicable to such a wide variety of
situations. Flow-3D allows either one or two fluid flow, with or without a free surface, and a
multitude of available physics options to suit the specific application. A large selection of boundary
conditions is also available to properly model each specific application. Another benefit of Flow-
3D is the ability to select from several different implicit and explicit numerical solver options. A
detailed description of FLOW-3D can be found in FLOW-3D User’s Manual V9.4 (Flow Science
Chapter 4. Numerical setup and primary results
68
2009). The program is based on the fundamental laws of mass, momentum and energy
conservation and applicable to almost any type of flow process.
4.2.1 Governing equations
Numerical models of fluid/wave-structure interactions are increasingly becoming a viable tool in
furthering our understanding of the complicated phenomena that govern the hydraulic response of
breakwaters, including effects of permeability (Losada, 2003). These include Lagrangian models
with particle-based approaches such as the Moving Particle Semi-Implicit method and Smooth
Particle Hydrodynamics (SPH) (Dalrymple et al., 2009). It is noted here that new SPH models are
just becoming available that not only model the fluid phase of the interaction but the movements
of the caisson breakwater itself when subject to wave loads (Rogers et al. 2010). For reasons
ranging from computational efficiency to an accurate representation of the physical processes,
Reynold Averaged Navier Stokes-Volume of Fluid (RANS-VOF) models such as those developed
by Lara et al. (2008) and Shi et al. (2004) have become an attractive choice of to model wave
interactions with both solid as well as porous structures.
The RANS-VOF models noted above have been developed by implementing various extensions
to the RIPPLE model (Kothe et al, 1991; originally designed to provide a solution of two-
dimensional versions of the Naiver-Stokes equations in a vertical plane with a free surface.),
making it specifically applicable to the study of wave interactions with coastal structures. The
models solve the two- dimensional vertical (2DV) RANS equations and the k–ɛ equations for the
turbulent kinetic energy (k), and the turbulent dissipation rate (ɛ). Various other turbulence models
have also been successfully implemented. A nonlinear algebraic Reynolds stress model is used to
relate the Reynolds stress tensor and the strain rate of mean flow. The free surface movement is
tracked by the Volume of Fluid (VOF) method. The flow inside the porous media is solved through
the resolution of the Volume-Averaged Reynolds Averaged Navier–Stokes (VARANS) equations,
which are derived by integrating the RANS equations over a control volume.
4.3 Numerical model validation
In 2015, Buccino et al. (15) carried out a number of regular wave experiments at the LinC
laboratory of the Department of Civil, Architectural and Environmental Engineering of the

Chapter 4. Numerical setup and primary results
69
University of Naples “Federico II”, on a small scale (1:66) model of SSG (Seawave Slot-cone
Generators) originally designed as a possible pilot plant to be located at Svåheia, along the West
Norwegian coasts. The flume, 22mlong, 0.5m wide and 0.75m deep, is equipped with a piston-
type wave maker capable of generating both periodic and random wave series. The facility is also
provided with an active absorption system, to dampen any undesired reflection generated by the
structures installed within it. Figures (4.1) and (4.2) respectively show the section of the small
scale of the SSG and the bathymetry and the location of the structure in Buccino et.al (2015)
physical experimental study.
Figure 4.1- Sketch of the SSG model. Dimensions in mm. (Buccino et.al 2015)
Figure 4.2- The foreshore with the location of the SSG. Dimensions in m. (Buccino et.al 2015)

Chapter 4. Numerical setup and primary results
70
The authors provided a detailed description of the nature of loadings acting onto the front face of
the structure and produced a parameterization of the obtained results. The reliability of
Computational Fluid Dynamics (CFD) in reproducing qualitative and quantitative features of
loadings exerted by waves on Seawave Slot-cone Generators (SSG) has been investigated via 17
numerical experiments, conducted with the suite Flow 3D (Buccino et al., 2016). Figure (4.3)
shows the simulated model of the SSG and the bathymetry in the software.
Figure 4.3- The model of the SSG and the bathymetry in Flow 3D. (Buccino et al., 2016)
Figure (4.4) shows a comparison between numerical and physical pressure and horizontal force
chronograms for test 6 in their study. The comparisons show good agreement between numerical
simulation and physical experiment. In particular, the numerical model appears to be faithfully
modeling the interaction between wave and the structure.
Figure 4.4- Numerical vs. physical chronograms of horizontal force (Test 6- Buccino et al., 2016)

Chapter 4. Numerical setup and primary results
71
The numerical suite has been also successfully employed in a number of wave-structure problems,
including both impermeable walls and permeable breakwaters (e.g. Vicinanza et al., 2015, Dentale
et al., 2014a, 2014b).
4.4 Numerical model set-up
The general model set-up for all simulations was quite similar. In each case, the General tab in
Flow 3D was specified with one fluid, incompressible flow, and a free surface or sharp interface
being selected. Also, the fluid properties were specified as those for water at 20 degrees Celsius
for all simulations. Several other model parameters remained generally constant as well and will
be further discussed in the following sections. A full scale sloping top breakwater with a total
height of 21.42m has been simulated, with the sloping part inclined by 30 degrees to the horizontal.
During the experiments, the water depth at the toe of the structure was kept constant at 18.9m; six
wave probes were deployed seaward the caisson to separate incident and reflected, waves via the
weighted least square approach proposed by Zelt and Skjelbreia (1992). A sketch of the
experimental setup is illustrated in Figure (4.5)
Figure 4.5- A sketch of the experimental setup.
4.4.1 Physics and fluids
Although there are many different physics options available, activation of only two selections was
required to obtain accurate simulations of the data that was desired in this study. The gravity option
18.9 m16.03 m
2.52 mH
13.56 m
30⁰

Chapter 4. Numerical setup and primary results
72
was activated with gravitational acceleration in the vertical or z-direction being set to negative
9.806 m/s2. The viscosity and turbulence option was also activated with Newtonian viscosity being
applied to the flow along with the selection of an appropriate turbulence model. It was decided
that the renormalization group (RNG) turbulence model would be used for all simulations. The
decision was made based on comments in Flow-3D user’s manual that the RNG turbulence model
is the most accurate and robust model available in the software. Walkden et.al 2001, pointed out
that the seaward pressure impulse produced at the rear side of the structure caused by overtopping
jet is highly sensitive to the presence of trapped air pocket behind the breakwater. In fact, for these
particular experiments, it appears that the pressure impulse per unit length of the water surface due
to the air pocket could be as much as 80% of the contribution by the plume impact. Hence, in the
present study, the effects of air entrainment due to turbulence or the flow conditions (e.g., an
impinging jet or overtopping) have been taken into account for some tests.
In FLOW-3D, the entrainment of gas can be modeled using the two-fluid model or, in one-fluid
cases, by using the Air entrainment model. The Air entrainment model is activated and estimates
the rate at which gas (represented by the void regions) is entrained into the flow using a balance
of stabilizing forces (gravity and surface tension) and destabilizing forces (turbulence). Although
the primary focus of the model is to compute the air entrainment resulting from turbulent
disturbances at a free surface, the model also contains logic for handling entrainment resulting
from laminar jets impinging on a free surface. Therefore, the model may be used for both laminar
and turbulent cases. In this study, air contribution is considered using two-fluid model. In this case,
the compressible two-fluid model (which has an incompressible liquid and a compressible vapor
which here is air) can have liquid-vapor phase changes occurring at the interface. Nucleation in
pure liquid regions or condensation in pure vapor regions is also allowed. Fluid 1 (water) describes
the liquid state of the fluid and compressible fluid 2 (air) describes the vapor. As with the standard
compressible flow model, the equation of state for the vapor is the ideal gas equation,
= 2. . (4.1)
Where 2 is the gas constant for the vapor, is the pressure is the gas density and
temperature of the vapor gas. The two-fluid phase change model requires a positive value for
Accommodation coefficient. The phase-change rate is directly proportional to the accommodation

Chapter 4. Numerical setup and primary results
73
coefficient. The value of the coefficient is typically in the 0.01 to 0.1 range, and it should not
exceed 1.0, although this is not an absolute limit. Vapor properties are defined as properties of the
compressible fluid 2. The pressure-temperature pair, defined by the Saturation Pressure and
Saturation Temperature, must be a point on the saturation curve. Phase changes are based on the
average fluid properties (density, thermal energy, and liquid fraction) in a control volume. In
particular, the temperatures of the liquid and vapor are assumed to be equal in an element. The
mass transfer rate at the liquid/vapor interface is computed based on the difference between the
local saturation pressure of the liquid and the vapor pressure:
=2 2
( ) − (4.2)
Where
is the pressure of the vapor.
( ) is the saturation pressure at the local temperature.
is the Accommodation coefficient, which is typically set to a value between 0.01 and 0.1.
4.4.2 Meshing
In a CFD numerical model, a mesh is a subdivision of the flow domain into relatively small regions
called cells, in which numerical values such as velocity and pressure are computed. Determining
the appropriate mesh domain along with a suitable mesh cell size is a critical part of any numerical
model simulation. Mesh and cell size can affect both the accuracy of the results and the simulation
time so it is important to minimize a number of cells while including enough resolution to capture
the important features of the geometry as well as sufficient flow detail. An effective way to
determine the critical mesh size is to start with a relatively large mesh and then progressively
reduce the mesh size until the desired output no longer changes significantly with any further
reductions in mesh size. A useful option in Flow-3D that makes this process even more effective
is the restart option. This allows the user to run a simulation and then make a variety of model
changes, including mesh size and configuration, before restarting the simulation using information
from the last time step of the previous simulation. The computational domain extends by 300
meters seaward the breakwater and 200 meters behind and 26 meters in the Z direction. Figure
(4.6) shows that The domain has been divided into three mesh block in X direction (solid red line)

Chapter 4. Numerical setup and primary results
74
and two mesh blocks in Z direction (dashed black line). Single-block meshes may not be efficient
for complex geometries because a mesh consisting of a single block would contain too many cells.
For scenarios of this nature, using multiple mesh blocks to increase the simulation resolution only
in the area of interest and exclude regions where no flow is expected is an effective solution.
Figure (4.7) illustrates meshed simulation domain of the sloping top caisson.
4.4.3 Sensitivity analysis of
In order to select the most appropriate grid dimensions, a sensitivity study has been conducted
(Fig. 4.7). Three rectangular cells with different sizes have been used and namely 0.5m (horizontal)
x 1m (vertical), 0.25m x 0.5m and 0.125m x 0.25m. For each cell geometry, a train of 30 regular
waves with height H=4.4m and period T=8s has been generated and the horizontal force signal
exerted onto the front face of the breakwater has been acquired. The generated waves (which are
similar to those used in the rest of this work) have been previously observed to not break onto the
structure, in order, the sensitivity analyses were not affected by the inherent randomness of
breaking induced wave loadings (Buccino et al., 2015; Peregrine 2003).
Figure 4.6- The view of computational domain in the Flow3D
It is also worth noticing that for each grid, flow 3D selects the most appropriate time step to
guarantee the stability of the solution. As shown in Figure (4.8), the widest grid has been found to
create deep troughs of force that are not observed with the finer cells; on the other hand, results
for 0.25m x 0.5m and 0.125m x 0.25m are very similar to each other.
Mesh block 1,(300m)
X direction
Mesh block 2,(13.56m)
X direction
Mesh block 3,(200m)
X direction
Mesh block 1,(18.9m)
Z direction
Mesh block 2, (7.1m)
Z direction
Z
X

Chapter 4. Numerical setup and primary results
75
Figure 4.7- A close view of detailed meshing- Purple circles stand for Pressure Transducers
Figure 4.8- Force time series for different grid size
Two quantities have been employed as indicators of the convergence of results, namely:
-600
-450
-300
-150
0
150
300
450
30 35 40 45 50 55 60
Fh [kN/m]
t [s]
0.25 x 0.1250.5 x 1.00.5 x 0.25

Chapter 4. Numerical setup and primary results
76
· The standard deviation of the difference between the force signals, divided by the
maximum force measured with the finer grid:
=[ − ]
max( ) (4.3)
· The square correlation between the force signals
=( )
(4.4)
In the above formulae, the subscripts “wide” and “fine” refer to the wider and the finer grid used
in the comparison; the symbols Stdev and E indicate standard deviation and statistical expectation
respectively.
Results of the analysis are summarized in Table (4.1), which confirms a substantial coherence
between the grids 0.5m x 0.25m and 0.25m x 0.125m (R2 exceeds 99% ). Accordingly, the cell
0.5m x 0.25m has been selected for the tests here discussed.
Table 4.1- Values of convergences indicators
wide fine Rs R2
0.5m x1m 0.5m x 0.25m 0.39 0.9610.5m x 0.25m 0.25m x 0.125m 0.045 0.995
4.4.4 Boundary and initial conditions
Setting the appropriate boundary conditions can have a major impact on whether the numerical
model results are reflecting the actual situation one is trying to simulate. As for the extent of the
mesh in the vertical or z-direction, the bottom boundary was set just below the model geometry in
order to capture the channel bed, while the top boundary was set just above the highest water
elevation. The extent of the mesh in the upstream x-direction, at the seaward end, regular waves
are generated by imposing a time-varying fluctuation of the water level, with velocities being
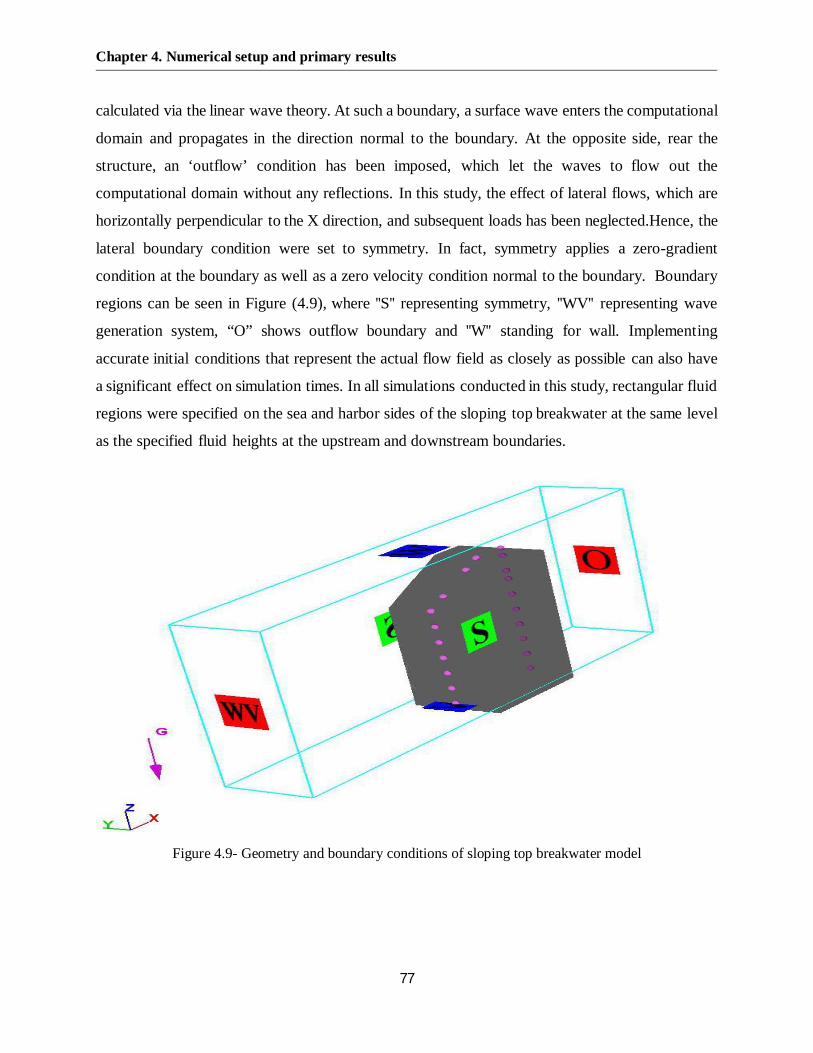
Chapter 4. Numerical setup and primary results
77
calculated via the linear wave theory. At such a boundary, a surface wave enters the computational
domain and propagates in the direction normal to the boundary. At the opposite side, rear the
structure, an ‘outflow’ condition has been imposed, which let the waves to flow out the
computational domain without any reflections. In this study, the effect of lateral flows, which are
horizontally perpendicular to the X direction, and subsequent loads has been neglected.Hence, the
lateral boundary condition were set to symmetry. In fact, symmetry applies a zero-gradient
condition at the boundary as well as a zero velocity condition normal to the boundary. Boundary
regions can be seen in Figure (4.9), where ''S'' representing symmetry, ''WV'' representing wave
generation system, “O” shows outflow boundary and ''W'' standing for wall. Implementing
accurate initial conditions that represent the actual flow field as closely as possible can also have
a significant effect on simulation times. In all simulations conducted in this study, rectangular fluid
regions were specified on the sea and harbor sides of the sloping top breakwater at the same level
as the specified fluid heights at the upstream and downstream boundaries.
Figure 4.9- Geometry and boundary conditions of sloping top breakwater model
Chapter 4. Numerical setup and primary results
78
4.4.5 Numerical simulations options
A variety of options are available in the Numerics tab of the Flow-3D model set-up. These options
present modifications to the way the Reynolds-averaged Navier-Stokes (RANS) equations, which
are the fundamental underlying equations in Flow-3D, are solved. In the majority of simulations
completed, the default selections were used, however, adjustments and comparisons of different
options were completed in some instances. The time step controls were left as default unless the
simulation would crash with the provided error message being that the time step was smaller than
the minimum. In that case, a smaller minimum time step was sometimes attempted to try and obtain
a converging solution. Simulations were run using the generalized minimum residual (GMRES)
pressure solver implicitly, however, for viscous stress explicit solver were set for all simulations.
The difference between an explicit and implicit solution is that an explicit solution is solved
progressively at each computational cell by stepping through time, while the time step is restricted
to meet stability criteria. An implicit solution, however, is solved in each time step using
information from another time step, something that requires more complex iterative or matrix
solutions but that doesn’t impose a time step restriction. In the volume of fluids advection section
of the Numerics tab, most simulations were run with the one-fluid free surface option based on the
specifications made in the global tab. Also, all simulations were run while solving both momentum
and continuity equations and with first order momentum advection selected based on information
found in the Flow-3D user’s manual.
4.5 Hydraulic performance of numerical simulation
4.5.1 Waves and measurements
Eleven sea states have been generated, driven by a very narrow banded spectrum. Accordingly,
the incoming waves had almost the same wave period within each test, whereas the height could
vary. The still water level was fixed at 18.9m for all the tests. Each sea state has been run for
approximately 30 waves. Table 4.2 reports the main wave statistics of each test obtained after
resolution of the incident and reflected waves. Table 4.3 shows some relevant non-dimensional
variables along with the sampling rate (Δt) adopted in all measurements.
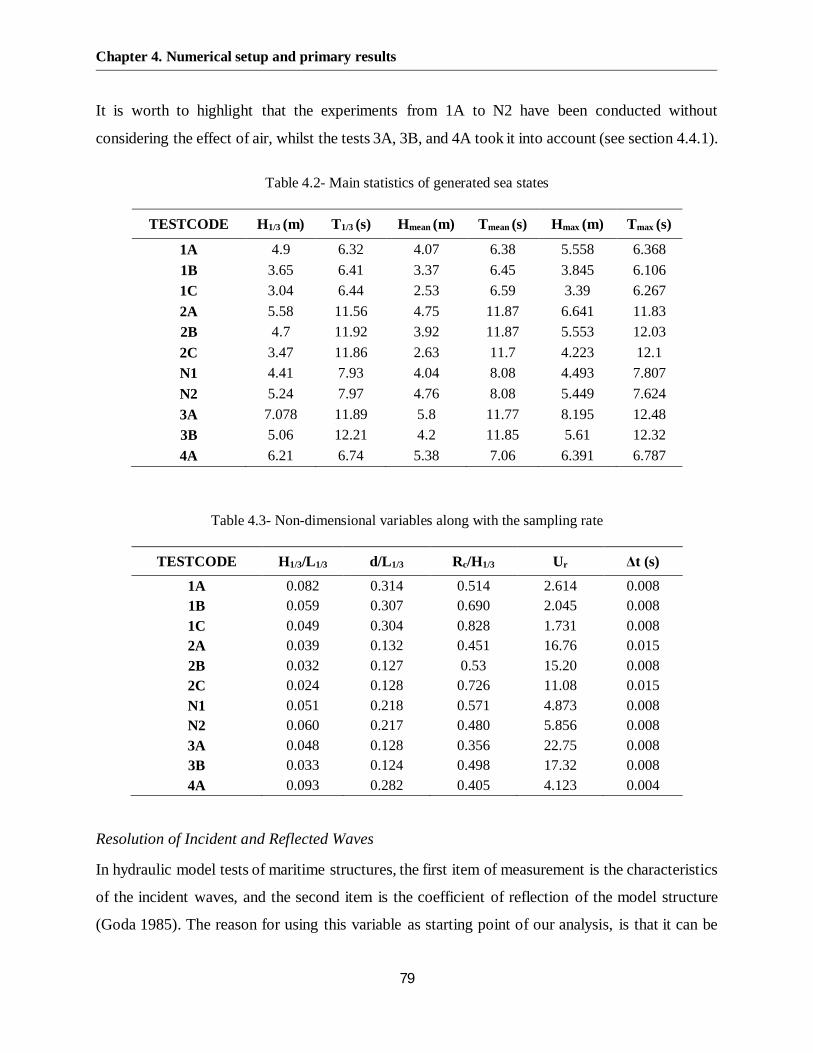
Chapter 4. Numerical setup and primary results
79
It is worth to highlight that the experiments from 1A to N2 have been conducted without
considering the effect of air, whilst the tests 3A, 3B, and 4A took it into account (see section 4.4.1).
Table 4.2- Main statistics of generated sea states
TESTCODE H1/3 (m) T1/3 (s) Hmean (m) Tmean (s) Hmax (m) Tmax (s)
1A 4.9 6.32 4.07 6.38 5.558 6.3681B 3.65 6.41 3.37 6.45 3.845 6.1061C 3.04 6.44 2.53 6.59 3.39 6.2672A 5.58 11.56 4.75 11.87 6.641 11.832B 4.7 11.92 3.92 11.87 5.553 12.032C 3.47 11.86 2.63 11.7 4.223 12.1N1 4.41 7.93 4.04 8.08 4.493 7.807N2 5.24 7.97 4.76 8.08 5.449 7.6243A 7.078 11.89 5.8 11.77 8.195 12.483B 5.06 12.21 4.2 11.85 5.61 12.324A 6.21 6.74 5.38 7.06 6.391 6.787
Table 4.3- Non-dimensional variables along with the sampling rate
TESTCODE H1/3/L1/3 d/L1/3 Rc/H1/3 Ur Δt (s)
1A 0.082 0.314 0.514 2.614 0.0081B 0.059 0.307 0.690 2.045 0.0081C 0.049 0.304 0.828 1.731 0.0082A 0.039 0.132 0.451 16.76 0.0152B 0.032 0.127 0.53 15.20 0.0082C 0.024 0.128 0.726 11.08 0.015N1 0.051 0.218 0.571 4.873 0.008N2 0.060 0.217 0.480 5.856 0.0083A 0.048 0.128 0.356 22.75 0.0083B 0.033 0.124 0.498 17.32 0.0084A 0.093 0.282 0.405 4.123 0.004
Resolution of Incident and Reflected Waves
In hydraulic model tests of maritime structures, the first item of measurement is the characteristics
of the incident waves, and the second item is the coefficient of reflection of the model structure
(Goda 1985). The reason for using this variable as starting point of our analysis, is that it can be

Chapter 4. Numerical setup and primary results
80
considered as a global indicator of the wave–structure interaction characteristics; this in virtue of
its dependence on wave run-up, wave overtopping and dissipation rate. The incoming wave field
at the flat floor seaward the foreshore, have been separated from the reflected by using the
weighted least squared method proposed by Zelt & Skjelbreia (1992). As the method essentially
relies on a linear approach, the original time series have been previously cut in the frequency
domain. Figure (4.10) indicates the incident and reflected waves from 80 to 120 s corresponding
to test 1C. It is clearly seen that both waves are regular and in opposite phase due to reflection
from the caisson. Analysis of frequency spectrum for the incident and reflected waves spectrum
in Figure (4.11) shows that the wave energy is spread in the range of about f = 0.141 ∼ 0.166 Hz,
or equivalently T = 7.06∼ 6 s, while the significant wave period is 6.44 s. The figure also indicates
that the wave energy is concentrated around the frequency fp 0.158 Hz, which is slightly more than
the frequency f = 0.155 Hz corresponding to the significant wave period of test 1C.
Figure 4.10- Incident and reflected waves separated via the Zelt and Skjelbreia (1992) method.Test 1C
Fluctuations of the free surface were acquired in six positions in front of the structure, while a
single probe was used to measure wave transmission (not dealt with here, Fig. 4-12). Along with
the horizontal component of the wave force, time series of pressure have been surveyed in 10
positions in front and 10 positions at the rear of the breakwater. A video of each experiment has
-2.5
-2
-1.5
-1
-0.5
0
0.5
1
1.5
2
2.5
80 85 90 95 100 105 110 115 120
Wat
ersu
rfac
eel
evat
ion
(m)
Time (s)
TEST 1C
Incident waveReflected wave

Chapter 4. Numerical setup and primary results
81
been taken, to study the wave shape at the wall and the fundamentals of the wave structure
interaction.
Figure 4.11- Spectral density of incident and reflected waves. Test 1C
Figure 4.12- Force positions of pressure transducers and wave probes
0
10
20
30
40
50
60
70
0 0.1 0.2 0.3 0.4 0.5
Spec
tral
Dens
ity,S
(f)(c
m2 s
)
Frequency (Hz)
TEST 1C
Incident waveReflected wave

Chapter 4. Numerical setup and primary results
82
4.5.2 Wave reflection coefficient
Although wave reflection problem for vertical and composite breakwaters has been long
investigated, a review of literature confirms that extremely little guidance is available on this
subject for sloping top breakwaters. In fact, there is no empirical or theoretical formula to calculate
reflection coefficient for this type of breakwater. The only study which provides estimates of the
reflection coefficient, for sloping top breakwaters, has been carried out by Takahashi et al. (1994).
The Author has only reported a graphical model to predict the values. A general description of his
work was given in section (3.3.3). Figure (3.8) illustrates the wave-reflection coefficients, KR,
obtained from the aforementioned model tests as a function of HI/h (where h is water depth and HI
is incident wave height) for 6 relative water depth h/L corresponding to each test. In order to
compare the KR values reported by of Takahashi et.al (1994) with CFD measurements, the
numerical tests whose relative water depths are in the same range, should be classified in separate
series. According to the table (4.3), the tests 1A, 1B, 1C and 4A with h/L on average 0.3, tests N1
and N2 with h/L on average 0.218 and tests 2A, 2B, 2C, 3A and 3B with h/L on average 0.218 are
placed in different series. In order to avoid confusing, only the KR values of type (4) of Takahashi’s
experiments are plotted. The latter were conducted in 3 different h/L and namely 0.23, 0.14 and
0.099.
In Figure (4.13) the abscissa is the ratio of incident wave height to depth HI/h. Also shown are the
corresponding experimental and numerical wave reflection coefficient. For all various h/L, the
experimental values decrease as HI/h increase. The same trend is seen for numerical values as well.
The numerical tests possessing h/L= 0.128 (red solid circles) are comparable with the experimental
tests with h/L= 0.14 and 0.099 (green and red squares respectively) and show satisfying agreement.
The reflection coefficients values for tests N1 and N2 (h/L=0.218, green solid circles) can be
roughly compared to the physical test with h/L=0.23 (purple squares). Deviation seems to have
originated from difference of relative water depths. The values corresponding to solid blue circles
(h/L=0.3) are considerably lower than the all experimental measurements. In fact, due to the lack
of laboratory data with the same range in this series, the comparison is not feasible.
Figure (4.14) represents a comparison between reflection coefficient for conventional vertical wall
and values obtained from CDF simulation for present sloping top caisson. Calabrese and Allsop
(1998) gave a simple relationship to estimate KR for vertical structures:

Chapter 4. Numerical setup and primary results
83
Figure 4.13- Comparison between reflection coefficients reported by Takahashi et.al (1994) andnumerical simulation
KR = 0.95 for simple vertical walls and small mounds, high crest
KR = 0.8 + 0.1Rc/ HI for low crest walls (0.5 < Rc/ HI < 1.0)
KR = 0.5 to 0.7 for composite walls, large mounds, and heavy breaking
As indicated in Figure (4.14), wave reflection by the sloping top breakwaters is smaller than that
by the conventional vertical wall breakwater for a same relative water depth. Takahashi et.al (1994)
pointed out that this is basically attributed to wave overtopping and eddies that are generated at
the lower edge of the slope. It is seen that the KR vales for sloping top caisson decrease as h/L1/3
increase (where L1/3 the wave length corresponding to significant wave height). This reduction
could also be recognized from Takahashi et.al (1994) experiments intuitively.
0
0.2
0.4
0.6
0.8
1
0 0.1 0.2 0.3 0.4 0.5
K R
HI/h
1A-1B-1C-4A, h/L=0.3 2A-2B-2C-3A-3B, h/L=0.128N1-N2, h/L=0.218 Takahashi, h/L= 0.23Takahashi, h/L=0.14 Takahashi, h/L= 0.099

Chapter 4. Numerical setup and primary results
84
Figure 4.14- Comparison between reflection coefficients reported by Calabrese and Allsop (1998) andnumerical simulation
Empirical relation for reflection coefficient
As previously discussed, Figure (3.8) is the only available graph to predict reflection coefficient
for sloping top breakwaters. According to the figure, it is not possible to estimate KR values out of
range of h/L=0.099 to 0.23. In order to fill the gap and make a wider range of relative wear depth,
KR values obtained from numerical simulation were combined with laboratory measurements
reported by Takahashi et.al 1994. By taking two extra factors Rc/h and angle of the slope in to
the account, reflection coefficient for a sloping top caisson can be formulated as follows:
K = min1.12−
ℎ⁄ − ℎ − 0.457; ℎ (4.5)
Figure (4.15) shows a very good agreements between total KR values and Equation (4.5).
0
0.2
0.4
0.6
0.8
1
0 0.05 0.1 0.15 0.2 0.25 0.3 0.35
K R
h/L1/3
Numerical-Without air
Numerical-With air
Calabrese and Allsop 1998- Vertical wall

Chapter 4. Numerical setup and primary results
85
Figure 4.15- Wave reflection coefficient for sloping top breakwaters predicted by Equation (4.5)
4.5.3 Wave overtopping
Figure (4.16) shows an instantaneous snapshot of wave overtopping for the model simulations (test
1A) and illustrates the location along the crest where overtopping is calculated. The chorogram of
the overtopping discharge for test 1A and the cumulative overtopping for the two tests 1A and 2A
have been also represented (Figs. 4.17 and 4.18). It is worth pointing out that all details of the
wave structure interaction, were visually inspected by videos.
Figure 4.16- Location and geometrical definitions for calculation of overtopping
y = 0.99xR² = 0.94
0
0.2
0.4
0.6
0.8
1
0 0.2 0.4 0.6 0.8 1
Ref
lect
ion
coef
ficie
nt
Eq. 4.5
Takahashi et.al (1994)Numerical measurements
The location where the overtoppingdischarge is calculated

Chapter 4. Numerical setup and primary results
86
Figure 4.17- chorogram of the overtopping discharge for test 1A
Since there is no empirical formula which provides estimates of overtopping for the sloping top
breakwater, the numerical results are compared to established existing formulas which are
typically applied during the design process for conventional vertical breakwaters.
Figure 4.18- Comparison of cumulative overtopping rate between Test 1A and Test 2A
0
2
4
6
8
10
12
14
16
90 100 110 120 130 140 150 160
q[m3/s/m]
t [s]
TEST 1A
0
10000
20000
30000
40000
50000
60000
70000
80000
50 100 150 200 250
q[m3/s/m]
t [s]
TEST 1A
TEST 2A

Chapter 4. Numerical setup and primary results
87
Figure 4.19- A non-impulsive (pulsating) wave condition at a vertical wall. (EurOtop 2007)
Figure 4.20- An impulsive (breaking) wave condition at a vertical wall. (EurOtop 2007)
For assessment of overtopping at vertical structures the regime of the wave/structure interaction
must be identified first to distinguish whether waves are in the “plunging” or “surging” regime.
On vertical walls “non-impulsive” or “pulsating” conditions occur when waves are relatively small
in relation to the local water depth and of lower wave steepnesses (Fig. 4.19). In contrast,
“impulsive” conditions occur on vertical walls when waves are larger in relation to local water
depths, perhaps shoaling up over the approach bathymetry or structure toe itself (Fig. 4.20). Under
these conditions, some waves will break violently against the wall with (short-duration) forces
reaching 10 – 40 times greater than for non-impulsive conditions.
In order to proceed with assessment of overtopping, it is, therefore, necessary first to determine
that is the dominant overtopping regime (impulsive or non-impulsive) for a given structure and
design sea state. For this purpose, a wave breaking or “impulsiveness” parameter, ℎ∗ is defined
based on depth at the toe of the wall, h and incident wave conditions inshore (EurOtop 2007):
ℎ∗ = 1.35ℎ 2 ℎ
,(4.6)
Non-impulsive (pulsating) conditions dominate at the wall when ℎ∗ > 0.3 , and impulsive
conditions occur whenℎ∗ < 0.2. The transition between conditions for which the overtopping
response is dominated by breaking and non-breaking waves lies over 0.2 < ℎ∗ < 0.3 . In this

Chapter 4. Numerical setup and primary results
88
region, overtopping should be predicted for both non-impulsive and impulsive conditions, and the
larger value assumed. For simple vertical breakwaters and under non-impulsive conditions,
probabilistic design formula (recommended to be used for comparison with measurements) is
given by the following relationship (EurOtop 2007).
= 0.04 −2.6 0.1 < < 3.5(4.6)
Also, the probabilistic design formula (recommended to be used for comparison with
measurements) for impulsive conditions is proposed by Equation (4.7).
ℎ∗ ℎ= 1.5 × 10 ℎ∗
.
0.03 < ℎ∗ < 1.0(4.7)
Table (4.4) reports the impulsiveness parameter for each test implying that all test were run under
non-impulsive condition (ℎ∗ > 0.3). Hence, Equation (4.6) was employed to calculate wave
overtopping according to EurOtop manual. Other overtopping relationships i.e. Franco et.al (1994)
and Allsop et.al (1995) which have been previously introduced in section (2.4.2) are reported in
Table (4.4). The table also represents a non-dimensional factor γ standing for the ratio between
overtopping numerical measurements and existing formulae.
Table 4.4- impulsiveness parameter and predictions of existing overtopping formulae.
TEST# h* qeurotop 2007[m3/s/m]
qfranco et.al 1994[m3/s/m]
qAllsop et.al 1995[m3/s/m]
qmeasured[m3/s/m]
γEurOtop
2007
γfranco et.al
1994
γAllsop et.al
1995
1A 1.577 0.357 0.744 0.407 1.658 4.646 2.227 4.0771B 2.058 0.145 0.224 0.160 1.043 7.187 4.648 6.5101C 2.449 0.077 0.094 0.083 0.450 5.847 4.786 5.4302A 0.414 0.510 1.184 0.588 2.427 4.755 2.049 4.1262B 0.462 0.317 0.636 0.359 1.560 4.926 2.451 4.3402C 0.632 0.123 0.178 0.134 0.761 6.207 4.266 5.659N1 1.113 0.263 0.497 0.296 1.507 5.739 3.032 5.088N2 0.927 0.430 0.950 0.493 2.165 5.030 2.279 4.3883A 0.309 0.935 2.552 1.096 2.836 3.034 1.111 2.5883B 0.409 0.391 0.838 0.446 1.263 3.232 1.507 2.8284A 1.094 0.675 1.693 0.784 2.000 2.963 1.181 2.550

Chapter 4. Numerical setup and primary results
89
It is useful to emphasize that all empirical available formulas were established to estimate wave
overtopping discharge over vertical walls whereas no relationship has been found in the literature
to calculate this value for sloping top breakwaters. In order to compare " " measured to " "
existing the factor for each measurement is plotted as a function of where is angle
of slop and ′ is has been show in Figure (4.21)
Figure 4.21- Dimension of ′ in sloping top caisson
The reason behind choosing length was based on that this length is an intrinsic
characteristic of a typical sloping top breakwater. Various either or ′ gives different type of
structure. Comparisons were made between three well-known relationships for calculating wave
overtopping, namely EurOtop (2007), Allsop et.al 1995 and Franco et.al 1994 and values obtained
through numerical simulation (Fig.4.22). It can be clearly seen that Franco’s formulae gives best
trend with maximum determination coefficient (R2=92%) compared to others relationships. A
linear Equation (4.8) can be easily derived for the sloping top caisson using Franco formula.

Chapter 4. Numerical setup and primary results
90
Figure 4.22- Comparison of numerical model result for mean overtopping discharge with empiricalformulas
= 2.4 − 2.24 0.2 exp −4.3 (4.8)
Through Allsop et.al 1995 and EurOtop 2007 formulae, respectively, 70% and 64% of measured
values of sloping top overtopping discharge are predictable. It is worthy to note that the results
show significant underestimation using all prediction formulae however, they basically have not
been proposed for sloping top breakwaters. Among the existing relationships, Franco et.al 1994
gives least (R2=0.92) and EurOtop 2007 gives most underestimation compared with numerical
measurements. It should be kept in mind that although in sloping top caissons the stability against
sliding and overturning increase due to counteraction of uplift pressure on the bottom by
downward wave force, a high degree of wave overtopping compared with the standard breakwater
of rectangular cross-section can be considered as a downside of this kind of breakwaters.
R² = 0.6462
y = 2.4x - 2.24R² = 0.92
R² = 0.7009
0
1
2
3
4
5
6
7
8
0 1 2 3 4
γ=q m
easu
red/q
exis
ting
form
ulae
l'cosθ/Hs
EuroTop 2007Franco et.al 1994Allsop et.al 1995
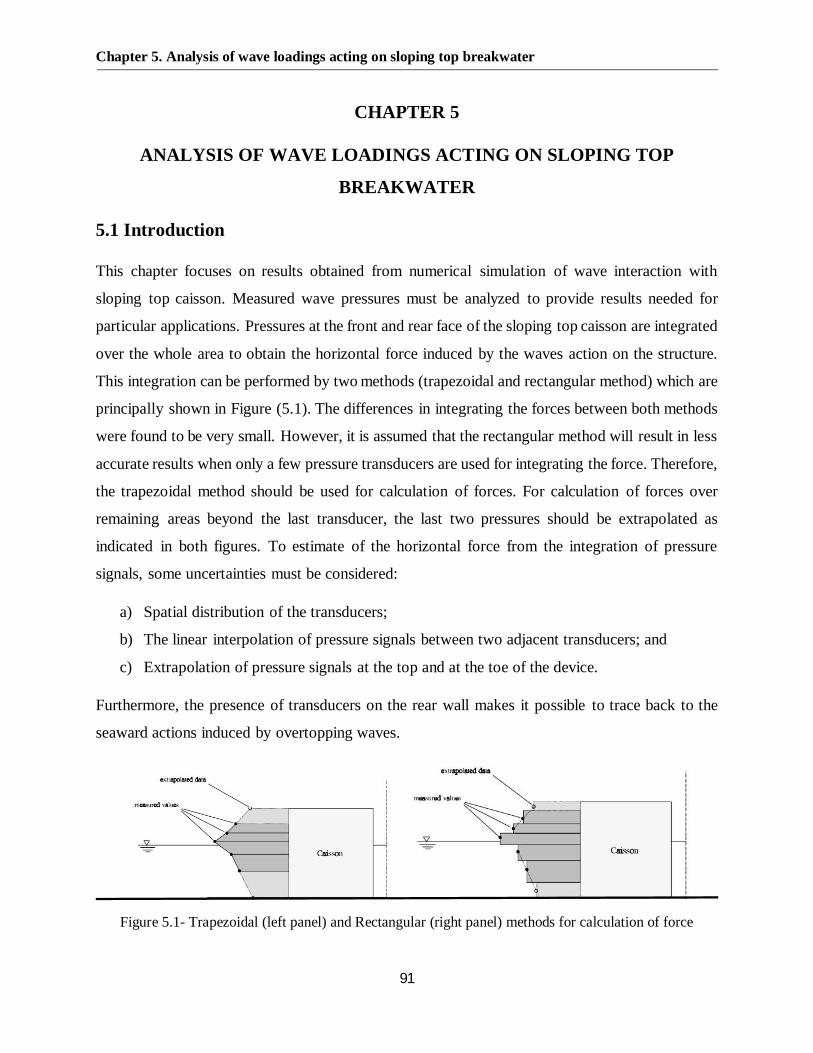
Chapter 5. Analysis of wave loadings acting on sloping top breakwater
91
CHAPTER 5
ANALYSIS OF WAVE LOADINGS ACTING ON SLOPING TOP
BREAKWATER
5.1 Introduction
This chapter focuses on results obtained from numerical simulation of wave interaction with
sloping top caisson. Measured wave pressures must be analyzed to provide results needed for
particular applications. Pressures at the front and rear face of the sloping top caisson are integrated
over the whole area to obtain the horizontal force induced by the waves action on the structure.
This integration can be performed by two methods (trapezoidal and rectangular method) which are
principally shown in Figure (5.1). The differences in integrating the forces between both methods
were found to be very small. However, it is assumed that the rectangular method will result in less
accurate results when only a few pressure transducers are used for integrating the force. Therefore,
the trapezoidal method should be used for calculation of forces. For calculation of forces over
remaining areas beyond the last transducer, the last two pressures should be extrapolated as
indicated in both figures. To estimate of the horizontal force from the integration of pressure
signals, some uncertainties must be considered:
a) Spatial distribution of the transducers;
b) The linear interpolation of pressure signals between two adjacent transducers; and
c) Extrapolation of pressure signals at the top and at the toe of the device.
Furthermore, the presence of transducers on the rear wall makes it possible to trace back to the
seaward actions induced by overtopping waves.
Figure 5.1- Trapezoidal (left panel) and Rectangular (right panel) methods for calculation of force

Chapter 5. Analysis of wave loadings acting on sloping top breakwater
92
Figures (5.2) and (5.3) respectively illustrate horizontal wave force acting on sloping top
breakwaters for short waves namely 1A and 4A and for long waves 2A and 3A.
Figure 5.2- Comparison of horizontal force signal at the wall for the tests 1A and 4A
Figure 5.3- Comparison of horizontal force signal at the wall for the tests 2A and 3A
Tests 1A and 2A were run under the condition in which the effect of the air had been neglected
during numerical setup while the air contribution for tests 4A and 3A was taken into account.
-600
-400
-200
0
200
400
600
40 45 50 55 60
F[K
N/m
]
Time [s]
Horizontal wave force
Test 1A (with air)
Test 4A (without air)
-1500
-1000
-500
0
500
1000
1500
40 45 50 55 60 65 70 75 80
F[K
N/m
]
Time [s]
Horizontal wave force
Test 2A (with air)Test 3A (without air)

Chapter 5. Analysis of wave loadings acting on sloping top breakwater
93
Although the significant wave height in test 4A is greater than that for test 1A, the acted forces on
the structure for both tests have approximately same magnitude. This reduction originates from
the influence of air entrainment damping the magnitude of loadings on the structure. The same
scenario can be explained for longer waves. Furthermore, due to less steepness and consequently
greater reflection coefficient, longer wave show smoother force signal compared the shorter
waves. In the following sections, firstly the main results obtained from wave action on the front
face of the structure are presented. Then, the effects of wave overtopping at the lee side of the
sloping top breakwater are analyzed.
Figure 5.4. Example of the broken event (Test 1A).
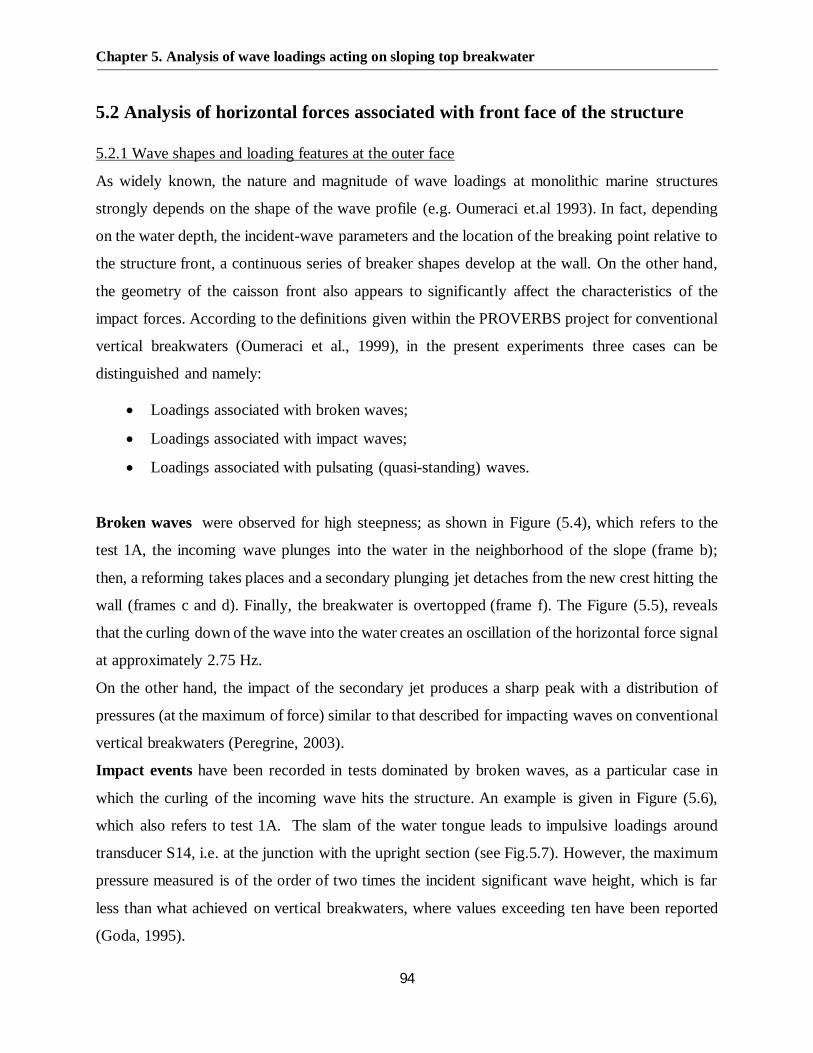
Chapter 5. Analysis of wave loadings acting on sloping top breakwater
94
5.2 Analysis of horizontal forces associated with front face of the structure
5.2.1 Wave shapes and loading features at the outer face
As widely known, the nature and magnitude of wave loadings at monolithic marine structures
strongly depends on the shape of the wave profile (e.g. Oumeraci et.al 1993). In fact, depending
on the water depth, the incident-wave parameters and the location of the breaking point relative to
the structure front, a continuous series of breaker shapes develop at the wall. On the other hand,
the geometry of the caisson front also appears to significantly affect the characteristics of the
impact forces. According to the definitions given within the PROVERBS project for conventional
vertical breakwaters (Oumeraci et al., 1999), in the present experiments three cases can be
distinguished and namely:
· Loadings associated with broken waves;
· Loadings associated with impact waves;
· Loadings associated with pulsating (quasi-standing) waves.
Broken waves were observed for high steepness; as shown in Figure (5.4), which refers to the
test 1A, the incoming wave plunges into the water in the neighborhood of the slope (frame b);
then, a reforming takes places and a secondary plunging jet detaches from the new crest hitting the
wall (frames c and d). Finally, the breakwater is overtopped (frame f). The Figure (5.5), reveals
that the curling down of the wave into the water creates an oscillation of the horizontal force signal
at approximately 2.75 Hz.
On the other hand, the impact of the secondary jet produces a sharp peak with a distribution of
pressures (at the maximum of force) similar to that described for impacting waves on conventional
vertical breakwaters (Peregrine, 2003).
Impact events have been recorded in tests dominated by broken waves, as a particular case in
which the curling of the incoming wave hits the structure. An example is given in Figure (5.6),
which also refers to test 1A. The slam of the water tongue leads to impulsive loadings around
transducer S14, i.e. at the junction with the upright section (see Fig.5.7). However, the maximum
pressure measured is of the order of two times the incident significant wave height, which is far
less than what achieved on vertical breakwaters, where values exceeding ten have been reported
(Goda, 1995).
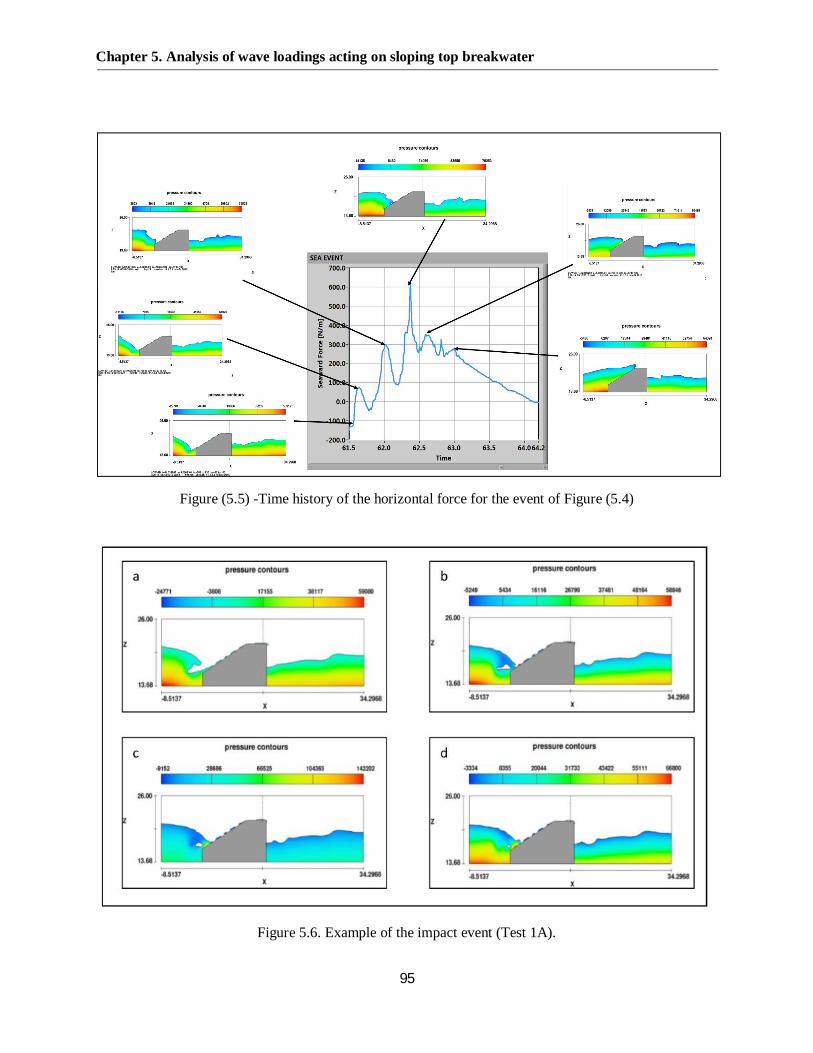
Chapter 5. Analysis of wave loadings acting on sloping top breakwater
95
Figure (5.5) -Time history of the horizontal force for the event of Figure (5.4)
Figure 5.6. Example of the impact event (Test 1A).

Chapter 5. Analysis of wave loadings acting on sloping top breakwater
96
Figure 5.7- Time history of the horizontal force for the event of Figure (5.6)
This is because of multiple reasons. First of all, the wave front has to experience a significant
rotation (curling down) before reaching the structure. Secondly, it backs to the position of the
pressure transducer recording the respective impact. This transducer has not been exactly placed
under the point where wave jet hits the wall and has been located lightly upper. Thirdly, the thin
layer of water on the slope during wave plunging prevents the occurrence of the high impact.
Finally, as pointed out by Oumeraci (1993), the geometry of the caisson front (here sloping top
caisson) also appears to significantly affect the characteristics of the impact forces.
Quasi-standing waves occur with longer periods. An example is given in Figure (5.8), which
refers to the test 3B; the latter includes the effect of air entrainment. The wave overtops the
structure without impact (frame d), although a secondary jet is seen to sometimes form in the wave
trough, slamming the breakwater between the vertical and the sloping part (frames a and b). The
resulting loading case is basically quasi-static (Fig. 5.9).
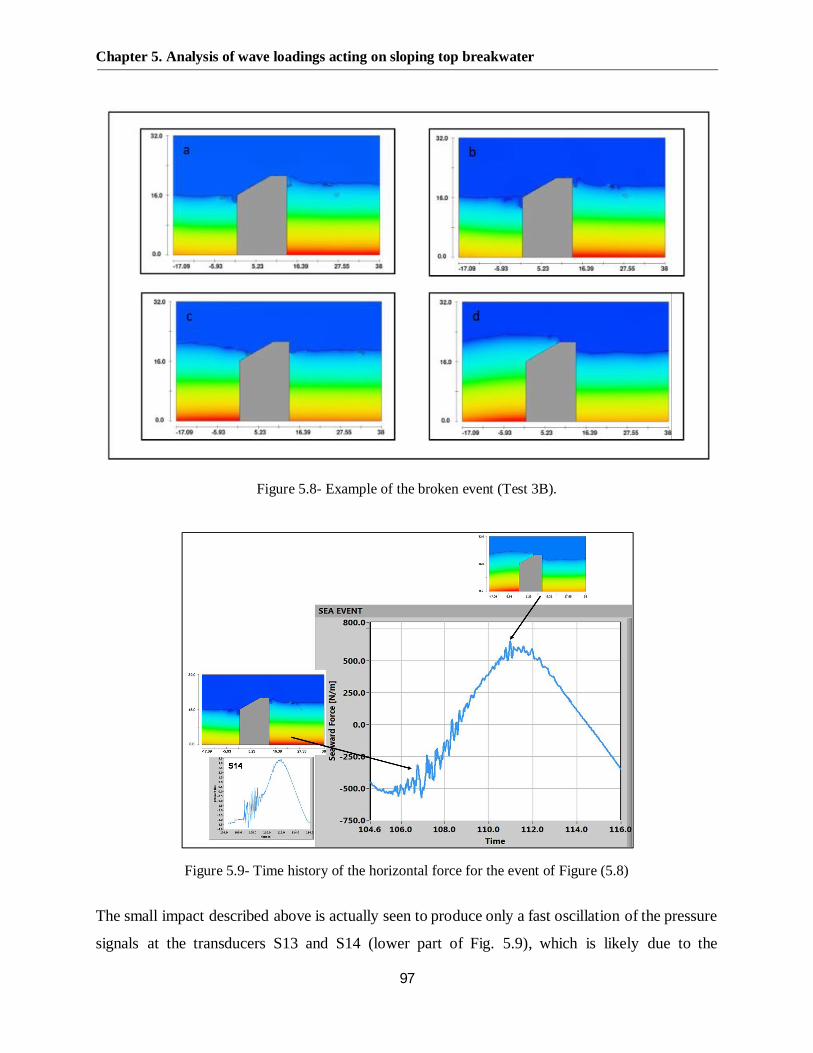
Chapter 5. Analysis of wave loadings acting on sloping top breakwater
97
Figure 5.8- Example of the broken event (Test 3B).
Figure 5.9- Time history of the horizontal force for the event of Figure (5.8)
The small impact described above is actually seen to produce only a fast oscillation of the pressure
signals at the transducers S13 and S14 (lower part of Fig. 5.9), which is likely due to the
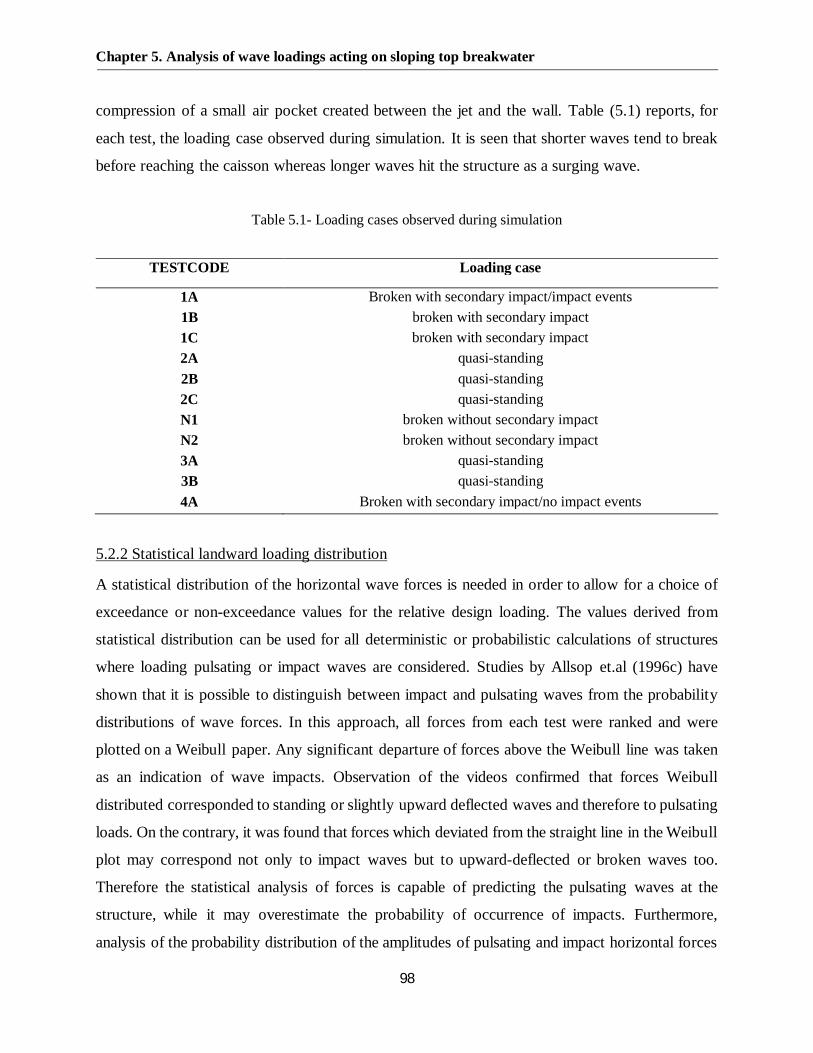
Chapter 5. Analysis of wave loadings acting on sloping top breakwater
98
compression of a small air pocket created between the jet and the wall. Table (5.1) reports, for
each test, the loading case observed during simulation. It is seen that shorter waves tend to break
before reaching the caisson whereas longer waves hit the structure as a surging wave.
Table 5.1- Loading cases observed during simulation
TESTCODE Loading case
1A Broken with secondary impact/impact events1B broken with secondary impact1C broken with secondary impact2A quasi-standing2B quasi-standing2C quasi-standingN1 broken without secondary impactN2 broken without secondary impact3A quasi-standing3B quasi-standing4A Broken with secondary impact/no impact events
5.2.2 Statistical landward loading distribution
A statistical distribution of the horizontal wave forces is needed in order to allow for a choice of
exceedance or non-exceedance values for the relative design loading. The values derived from
statistical distribution can be used for all deterministic or probabilistic calculations of structures
where loading pulsating or impact waves are considered. Studies by Allsop et.al (1996c) have
shown that it is possible to distinguish between impact and pulsating waves from the probability
distributions of wave forces. In this approach, all forces from each test were ranked and were
plotted on a Weibull paper. Any significant departure of forces above the Weibull line was taken
as an indication of wave impacts. Observation of the videos confirmed that forces Weibull
distributed corresponded to standing or slightly upward deflected waves and therefore to pulsating
loads. On the contrary, it was found that forces which deviated from the straight line in the Weibull
plot may correspond not only to impact waves but to upward-deflected or broken waves too.
Therefore the statistical analysis of forces is capable of predicting the pulsating waves at the
structure, while it may overestimate the probability of occurrence of impacts. Furthermore,
analysis of the probability distribution of the amplitudes of pulsating and impact horizontal forces
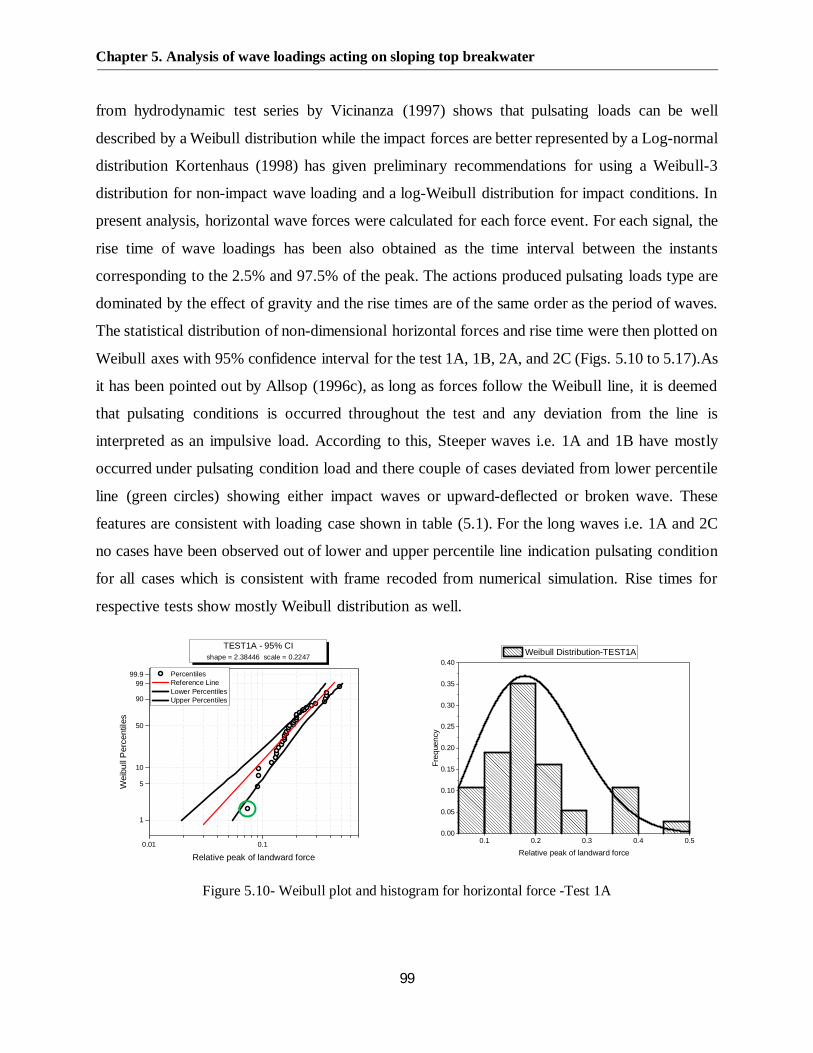
Chapter 5. Analysis of wave loadings acting on sloping top breakwater
99
from hydrodynamic test series by Vicinanza (1997) shows that pulsating loads can be well
described by a Weibull distribution while the impact forces are better represented by a Log-normal
distribution Kortenhaus (1998) has given preliminary recommendations for using a Weibull-3
distribution for non-impact wave loading and a log-Weibull distribution for impact conditions. In
present analysis, horizontal wave forces were calculated for each force event. For each signal, the
rise time of wave loadings has been also obtained as the time interval between the instants
corresponding to the 2.5% and 97.5% of the peak. The actions produced pulsating loads type are
dominated by the effect of gravity and the rise times are of the same order as the period of waves.
The statistical distribution of non-dimensional horizontal forces and rise time were then plotted on
Weibull axes with 95% confidence interval for the test 1A, 1B, 2A, and 2C (Figs. 5.10 to 5.17).As
it has been pointed out by Allsop (1996c), as long as forces follow the Weibull line, it is deemed
that pulsating conditions is occurred throughout the test and any deviation from the line is
interpreted as an impulsive load. According to this, Steeper waves i.e. 1A and 1B have mostly
occurred under pulsating condition load and there couple of cases deviated from lower percentile
line (green circles) showing either impact waves or upward-deflected or broken wave. These
features are consistent with loading case shown in table (5.1). For the long waves i.e. 1A and 2C
no cases have been observed out of lower and upper percentile line indication pulsating condition
for all cases which is consistent with frame recoded from numerical simulation. Rise times for
respective tests show mostly Weibull distribution as well.
Figure 5.10- Weibull plot and histogram for horizontal force -Test 1A
0.01 0.1
1
5
10
50
90
9999.9
TEST1A - 95% CIshape = 2.38446 scale = 0.2247
Wei
bull
Per
cent
iles
Relative peak of landward force
Percentiles Reference Line Lower Percentiles Upper Percentiles
0.1 0.2 0.3 0.4 0.50.00
0.05
0.10
0.15
0.20
0.25
0.30
0.35
0.40
Freq
uenc
y
Relative peak of landward force
Weibull Distribution-TEST1A
Chapter 5. Analysis of wave loadings acting on sloping top breakwater
100
Figure 5.11- Weibull plot and histogram for horizontal force rise time -Test 1A
Figure 5.12- Weibull plot and histogram for horizontal force -Test 1B
Figure 5.13- Weibull plot and histogram for horizontal force rise time -Test 1B
0.01 0.1
1
5
10
50
90
9999.9
TEST1A - 95% CIshape = 1.79347 scale = 0.10185
Wei
bull
Perc
entil
es
tr/T- Landward force
Percentiles Reference Line Lower Percentiles Upper Percentiles
0.00 0.05 0.10 0.15 0.20 0.250.00
0.05
0.10
0.15
0.20
0.25
0.30
0.35
0.40
0.45
Freq
uenc
y
tr/T- Landward force
Weibull Distribution-TEST1A
0.1
1
5
10
50
90
9999.9
TEST1B - 95% CIshape = 3.59797 scale = 0.15528
Wei
bull
Perc
entil
es
Relative peak of landward force
Percentiles Reference Line Lower Percentiles Upper Percentiles
0.06 0.08 0.10 0.12 0.14 0.16 0.18 0.20 0.22 0.24 0.260.00
0.05
0.10
0.15
0.20
0.25
0.30
0.35
0.40
Freq
uenc
y
Relative peak of landward force
Weibull Disribution - TEST 1B
0.01 0.1
1
5
10
50
90
9999.9
TEST1B - 95% CIshape = 3.13596 scale = 0.10864
Wei
bull
Per
cent
iles
tr/T- Landward force
Percentiles Reference Line Lower Percentiles Upper Percentiles
0.00 0.02 0.04 0.06 0.08 0.10 0.12 0.14 0.160.00
0.05
0.10
0.15
0.20
0.25
0.30
0.35
0.40
0.45
0.50
Freq
uenc
y
tr/T- Landward force
Weibull Disribution - TEST1B

Chapter 5. Analysis of wave loadings acting on sloping top breakwater
101
Figure 5.14- Weibull plot and histogram for horizontal force -Test 2A
Figure 5.15- Weibull plot and histogram for horizontal force rise time -Test 2A
Figure 5.16- Weibull plot and histogram for horizontal force -Test 2C
0.1 0.2 0.3 0.4 0.5 0.6
1
5
10
50
90
9999.9
TEST 2A - 95% CIshape = 4.8202 scale = 0.36744
Wei
bull
Per
cent
iles
Relative peak of landward force
Percentiles Reference Line Lower Percentiles Upper Percentiles
0.15 0.20 0.25 0.30 0.35 0.40 0.45 0.500.00
0.06
0.12
0.18
0.24
0.30
Freq
uenc
y
Relative peak of landward force
Weibull Disribution - TEST 2A
0.05 0.1 0.15 0.2 0.25
1
5
10
50
90
9999.9
TEST2A - 95% CIshape = 4.84385 scale = 0.17191
Wei
bull
Per
cent
iles
tr/T- Landward force
Percentiles Reference Line Lower Percentiles Upper Percentiles
0.08 0.10 0.12 0.14 0.16 0.18 0.20 0.22 0.240.00
0.04
0.08
0.12
0.16
0.20
0.24
0.28
0.32
0.36
Freq
uenc
y
tr/T- Landward force
Weibull Distribution - TEST 2A
0.1
1
5
10
50
90
9999.9
TEST2C - 95% CIshape = 3.42579 scale = 0.23932
Wei
bull
Per
cent
iles
Relative peak of landward force
Percentiles Reference Line Lower Percentiles Upper Percentiles
0.05 0.10 0.15 0.20 0.25 0.30 0.35 0.400.00
0.05
0.10
0.15
0.20
0.25
0.30
0.35
0.40
Freq
uenc
y
Relative peak of landward force
Weibull Distribution - TEST 2C
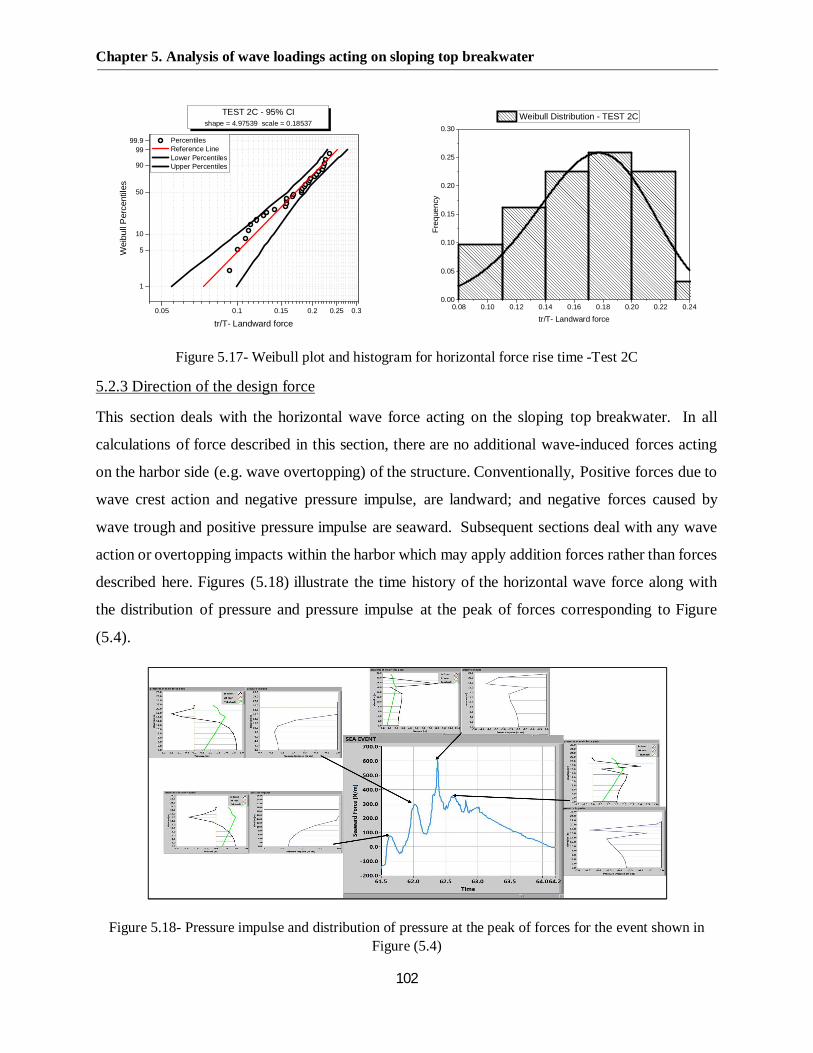
Chapter 5. Analysis of wave loadings acting on sloping top breakwater
102
Figure 5.17- Weibull plot and histogram for horizontal force rise time -Test 2C
5.2.3 Direction of the design force
This section deals with the horizontal wave force acting on the sloping top breakwater. In all
calculations of force described in this section, there are no additional wave-induced forces acting
on the harbor side (e.g. wave overtopping) of the structure. Conventionally, Positive forces due to
wave crest action and negative pressure impulse, are landward; and negative forces caused by
wave trough and positive pressure impulse are seaward. Subsequent sections deal with any wave
action or overtopping impacts within the harbor which may apply addition forces rather than forces
described here. Figures (5.18) illustrate the time history of the horizontal wave force along with
the distribution of pressure and pressure impulse at the peak of forces corresponding to Figure
(5.4).
Figure 5.18- Pressure impulse and distribution of pressure at the peak of forces for the event shown inFigure (5.4)
0.05 0.1 0.15 0.2 0.25 0.3
1
5
10
50
90
9999.9
TEST 2C - 95% CIshape = 4.97539 scale = 0.18537
Wei
bull
Per
cent
iles
tr/T- Landward force
Percentiles Reference Line Lower Percentiles Upper Percentiles
0.08 0.10 0.12 0.14 0.16 0.18 0.20 0.22 0.240.00
0.05
0.10
0.15
0.20
0.25
0.30
Freq
uenc
y
tr/T- Landward force
Weibull Distribution - TEST 2C
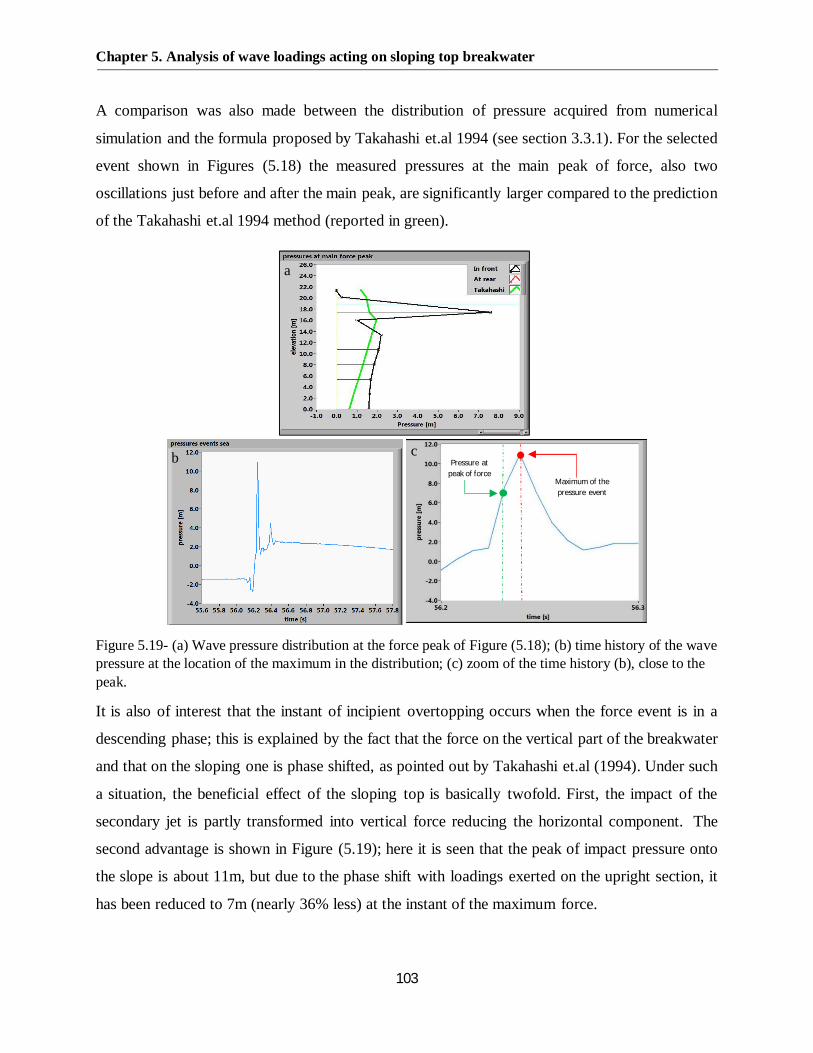
Chapter 5. Analysis of wave loadings acting on sloping top breakwater
103
A comparison was also made between the distribution of pressure acquired from numerical
simulation and the formula proposed by Takahashi et.al 1994 (see section 3.3.1). For the selected
event shown in Figures (5.18) the measured pressures at the main peak of force, also two
oscillations just before and after the main peak, are significantly larger compared to the prediction
of the Takahashi et.al 1994 method (reported in green).
Figure 5.19- (a) Wave pressure distribution at the force peak of Figure (5.18); (b) time history of the wavepressure at the location of the maximum in the distribution; (c) zoom of the time history (b), close to thepeak.
It is also of interest that the instant of incipient overtopping occurs when the force event is in a
descending phase; this is explained by the fact that the force on the vertical part of the breakwater
and that on the sloping one is phase shifted, as pointed out by Takahashi et.al (1994). Under such
a situation, the beneficial effect of the sloping top is basically twofold. First, the impact of the
secondary jet is partly transformed into vertical force reducing the horizontal component. The
second advantage is shown in Figure (5.19); here it is seen that the peak of impact pressure onto
the slope is about 11m, but due to the phase shift with loadings exerted on the upright section, it
has been reduced to 7m (nearly 36% less) at the instant of the maximum force.
Maximum of thepressure event
Pressure atpeak of force
a
b c
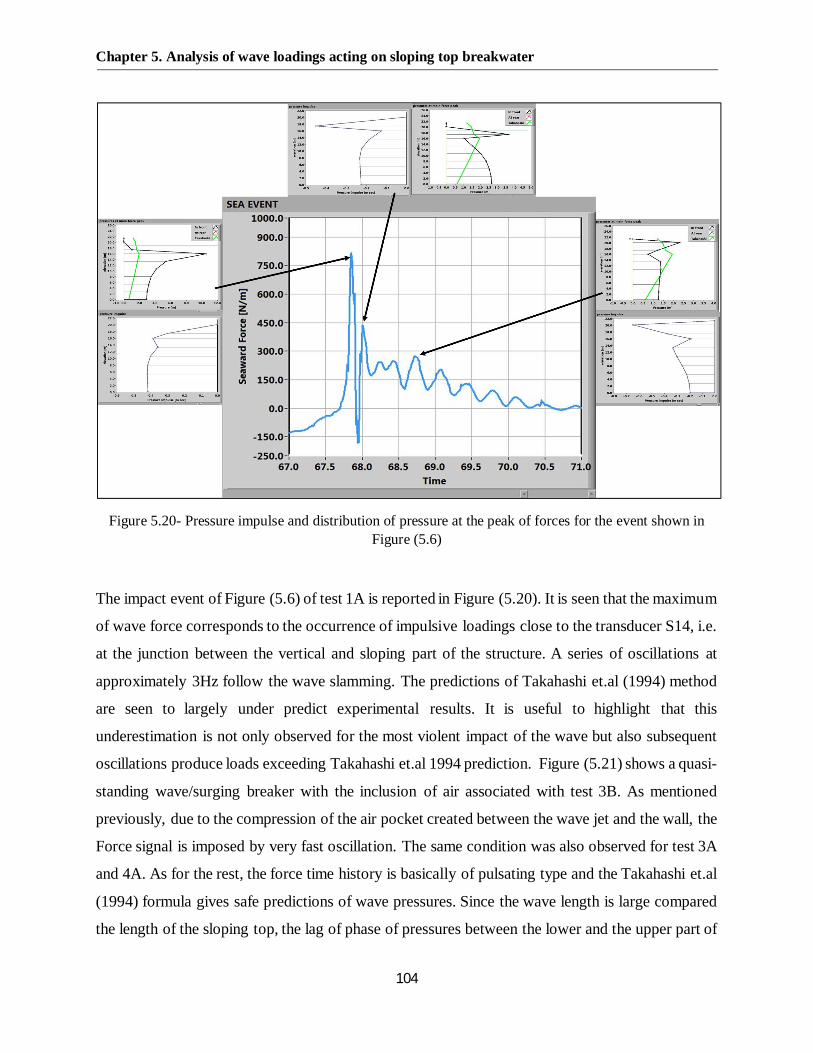
Chapter 5. Analysis of wave loadings acting on sloping top breakwater
104
Figure 5.20- Pressure impulse and distribution of pressure at the peak of forces for the event shown inFigure (5.6)
The impact event of Figure (5.6) of test 1A is reported in Figure (5.20). It is seen that the maximum
of wave force corresponds to the occurrence of impulsive loadings close to the transducer S14, i.e.
at the junction between the vertical and sloping part of the structure. A series of oscillations at
approximately 3Hz follow the wave slamming. The predictions of Takahashi et.al (1994) method
are seen to largely under predict experimental results. It is useful to highlight that this
underestimation is not only observed for the most violent impact of the wave but also subsequent
oscillations produce loads exceeding Takahashi et.al 1994 prediction. Figure (5.21) shows a quasi-
standing wave/surging breaker with the inclusion of air associated with test 3B. As mentioned
previously, due to the compression of the air pocket created between the wave jet and the wall, the
Force signal is imposed by very fast oscillation. The same condition was also observed for test 3A
and 4A. As for the rest, the force time history is basically of pulsating type and the Takahashi et.al
(1994) formula gives safe predictions of wave pressures. Since the wave length is large compared
the length of the sloping top, the lag of phase of pressures between the lower and the upper part of
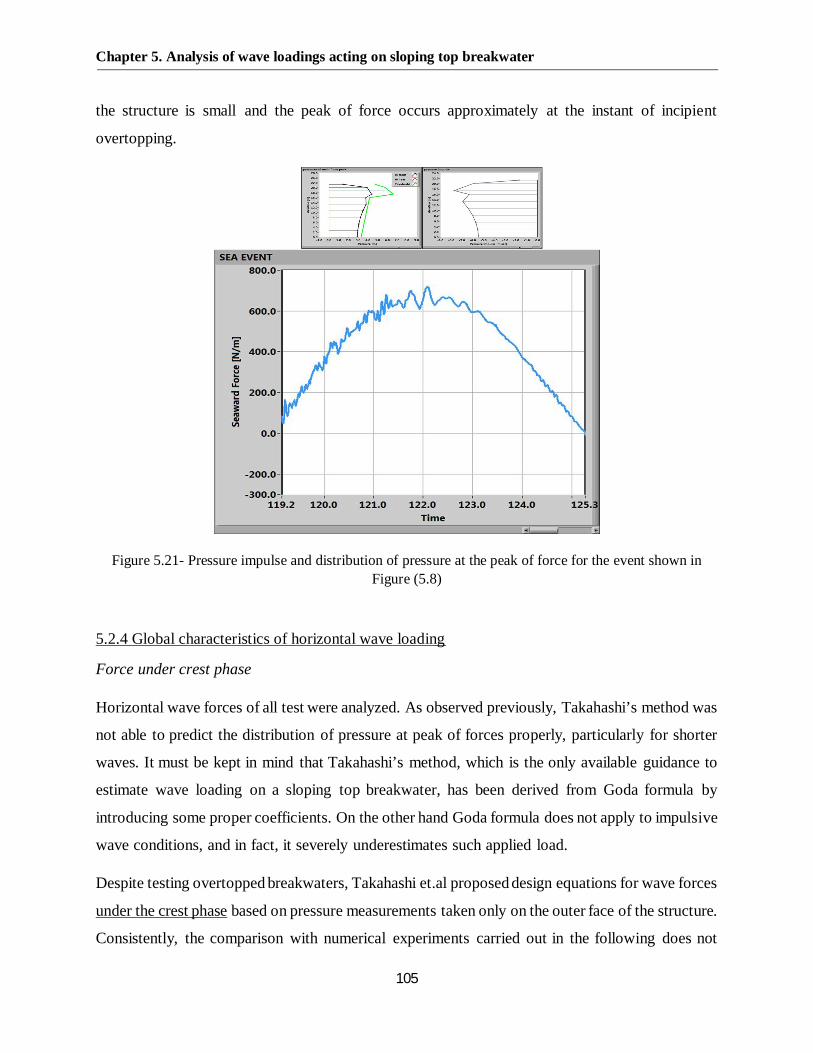
Chapter 5. Analysis of wave loadings acting on sloping top breakwater
105
the structure is small and the peak of force occurs approximately at the instant of incipient
overtopping.
Figure 5.21- Pressure impulse and distribution of pressure at the peak of force for the event shown inFigure (5.8)
5.2.4 Global characteristics of horizontal wave loading
Force under crest phase
Horizontal wave forces of all test were analyzed. As observed previously, Takahashi’s method was
not able to predict the distribution of pressure at peak of forces properly, particularly for shorter
waves. It must be kept in mind that Takahashi’s method, which is the only available guidance to
estimate wave loading on a sloping top breakwater, has been derived from Goda formula by
introducing some proper coefficients. On the other hand Goda formula does not apply to impulsive
wave conditions, and in fact, it severely underestimates such applied load.
Despite testing overtopped breakwaters, Takahashi et.al proposed design equations for wave forces
under the crest phase based on pressure measurements taken only on the outer face of the structure.
Consistently, the comparison with numerical experiments carried out in the following does not

Chapter 5. Analysis of wave loadings acting on sloping top breakwater
106
consider the overtopping generated wave pressures acting on the inner face. In Figure (5.22), the
Takahashi et.al force is calculated with the maximum wave height and the respective period (Hmax
and Tmax) is compared with the maximum measured landward directed load.
Figure 5.22. Maximum recorded wave force vs Takahashi et.al 1994. Only wave loadings on theouter face are considered.
Most of points exceed the line of perfect agreement and 6 of them by a factor larger than 1.5, which
is used in many countries as safety factor to design caisson breakwaters. However, these high force
peaks are mostly generated by breaking events causing impulsive or quasi-impulsive loadings (e.g.
Figs. 5.18 and 5.20). The latter, though, are not really accounted by the Goda model which the
Takahashi method comes from, as it was argued by the author (Goda 1985) that, due to their short
duration, these wave actions may not affect the stability of the structure, but rather the durability
of concrete (see also Peregrine 2003). Hence, it was decided to eliminate local peaks by smoothing
the force signals. The well-known approach introduced by Savitzky and Golay filter with a second
order polynomial and a time window 0.8s width was employed to smooth the signals.
Figures (5.23) Shows the application of filtering for horizontal wave force associated with tests
1A, 1B, 1C and 4A. It is obviously seen that under-predictions for short waves are not only due
to the local peaks caused by wave breaking or slightly breaking; it is seen that even after smoothing
such local spikes the Takahashi formula is exceeded.
0
100
200
300
400
500
600
700
800
900
1000
0 200 400 600 800 1000
Max
imum
land
war
dfo
rce
[KN/
m]
Takahashis force[KN/m]
without air
with air
Perfect agreement
SF=1.5
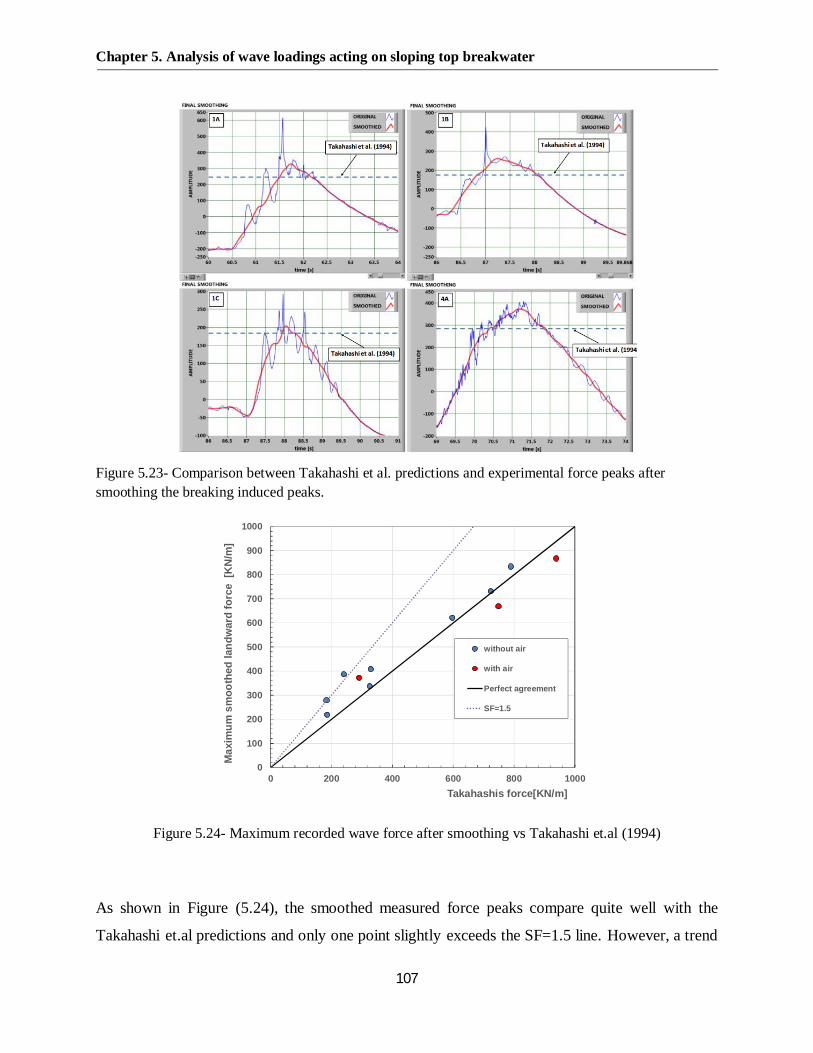
Chapter 5. Analysis of wave loadings acting on sloping top breakwater
107
Figure 5.23- Comparison between Takahashi et al. predictions and experimental force peaks aftersmoothing the breaking induced peaks.
Figure 5.24- Maximum recorded wave force after smoothing vs Takahashi et.al (1994)
As shown in Figure (5.24), the smoothed measured force peaks compare quite well with the
Takahashi et.al predictions and only one point slightly exceeds the SF=1.5 line. However, a trend
0
100
200
300
400
500
600
700
800
900
1000
0 200 400 600 800 1000
Max
imum
smoo
thed
land
war
dfo
rce
[KN
/m]
Takahashis force[KN/m]
without air
with air
Perfect agreement
SF=1.5

Chapter 5. Analysis of wave loadings acting on sloping top breakwater
108
with relative water depth has been detected, with the amount of under-prediction increasing in
deep waters. The following figures reveal the characteristics of horizontal wave loading for both
original and smoothed force signal. It is emphasized that all plotted values in this section report
what pressure transducers have recorded in the front face of the structure during simulation. In this
regard, landward load refers to the response of wave crest which is positive while seaward force
refers to the action of wave trough possessing a negative magnitude. The contribution of wave
transmission effects on the breakwater will be considered in the following sections. Figure (5.25)
displays variation of non-dimensional maximum landward loads, smoothed and non-smoothed, as
a function of steepness. The latter varies over a range from 0.024 to 0.093. There is clear tendency
for smoothed maximum landward load (left panel) to decrease as H1/3/L1/3 increase. It is seen that
spikes removal not only is given rise to reduce the magnitude of loads but also led to give a more
meaningful behavior of landward forces. Additionally, It seems the entrainment of the air bubbles
do not have considerable effects on the trend
Figure 5.25- Non-dimensional maximum landward load vs steepness. (Left panel) Before smoothing.(Right panel) After smoothing
Figure (5.26) shows the ratio between the force predicted by the Takahashi et.al (1994) using the
maximum wave height, and the maximum value of the measured landward peak of force
(minimum safety factor). The formula would seem to underestimate experimental data with
increasing wave steepness. It is observed that all waves without air, have a safety factor less than
unity indicating unsafe condition; whereas among waves with air contribution, two waves
associated with long waves can withstand against waves safely. Although it may be supposed that
0
0.2
0.4
0.6
0.8
1
1.2
1.4
0 0.02 0.04 0.06 0.08 0.1
Max
ladw
ard
load
/(ρgH
1/3h
)
H1/3/L1/3
Without airWith air
0
0.2
0.4
0.6
0.8
1
1.2
0 0.02 0.04 0.06 0.08 0.1
Max
ladw
ard
load
/(ρgH
1/3h
)-Sm
ooth
ed
H1/3/L1/3
Without airWith air
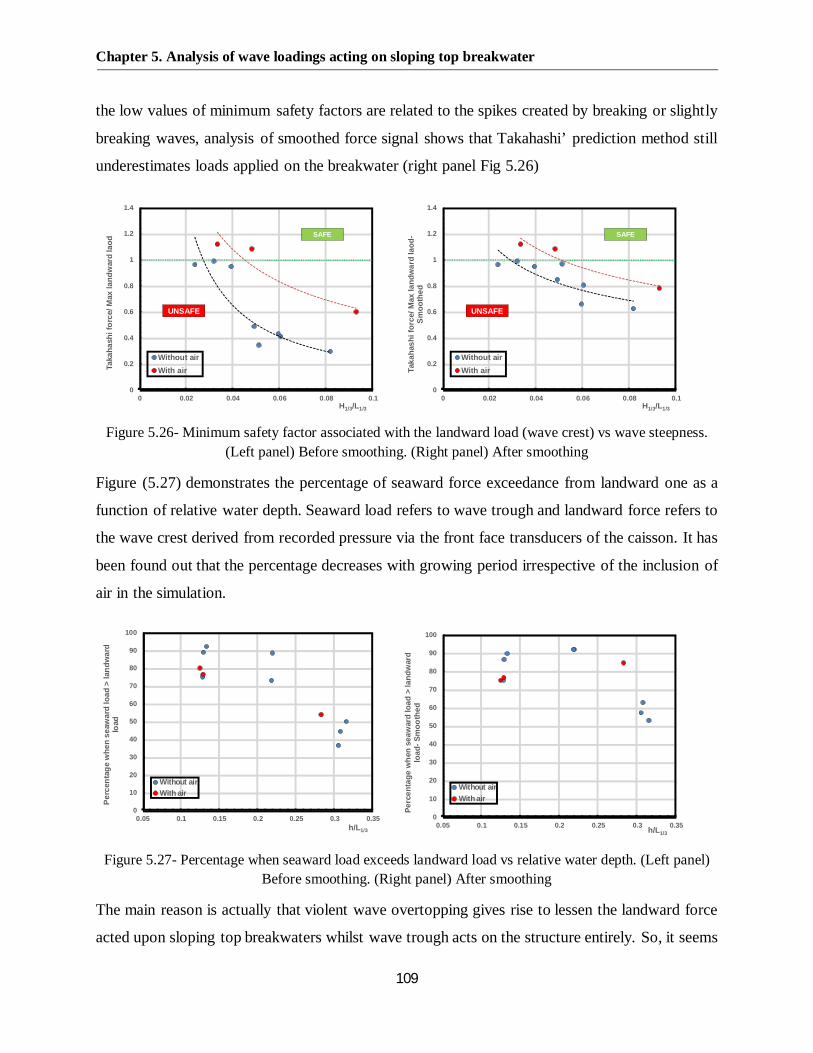
Chapter 5. Analysis of wave loadings acting on sloping top breakwater
109
the low values of minimum safety factors are related to the spikes created by breaking or slightly
breaking waves, analysis of smoothed force signal shows that Takahashi’ prediction method still
underestimates loads applied on the breakwater (right panel Fig 5.26)
Figure 5.26- Minimum safety factor associated with the landward load (wave crest) vs wave steepness.(Left panel) Before smoothing. (Right panel) After smoothing
Figure (5.27) demonstrates the percentage of seaward force exceedance from landward one as a
function of relative water depth. Seaward load refers to wave trough and landward force refers to
the wave crest derived from recorded pressure via the front face transducers of the caisson. It has
been found out that the percentage decreases with growing period irrespective of the inclusion of
air in the simulation.
Figure 5.27- Percentage when seaward load exceeds landward load vs relative water depth. (Left panel)Before smoothing. (Right panel) After smoothing
The main reason is actually that violent wave overtopping gives rise to lessen the landward force
acted upon sloping top breakwaters whilst wave trough acts on the structure entirely. So, it seems
0
0.2
0.4
0.6
0.8
1
1.2
1.4
0 0.02 0.04 0.06 0.08 0.1
Taka
hash
ifor
ce/M
axla
ndw
ard
laod
H1/3/L1/3
Without airWith air
UNSAFE
SAFE
0
0.2
0.4
0.6
0.8
1
1.2
1.4
0 0.02 0.04 0.06 0.08 0.1
Taka
hash
ifor
ce/M
axla
ndw
ard
laod
-Sm
ooth
edH1/3/L1/3
Without airWith air
UNSAFE
SAFE
0
10
20
30
40
50
60
70
80
90
100
0.05 0.1 0.15 0.2 0.25 0.3 0.35
Perc
enta
gew
hen
seaw
ard
load
>la
ndw
ard
load
h/L1/3
Without airWith air
0
10
20
30
40
50
60
70
80
90
100
0.05 0.1 0.15 0.2 0.25 0.3 0.35
Perc
enta
gew
hen
seaw
ard
load
>la
ndw
ard
load
-Sm
ooth
ed
h/L1/3
Without airWith air

Chapter 5. Analysis of wave loadings acting on sloping top breakwater
110
that the design can be dominated by the seaward load. Particularly for short waves, the percentage
increase after smoothing force signal due to the elimination of impulsive waves whereas it has
remained unchanged for long waves. Figures (5.28) and (5.29) indicate the proportion of maximum
landward load to maximum seaward load and equivalent ratio for their averages respectively. As
pointed out by the Goda (1974), for non-overtopped structures, seaward force exceeds landward
force when the ratio of water depth to wave length exceeds approximately 0.25 (See Fig.3.9).
However, numerical results show inverse behavior. As it is observed in the left panel of Figure
(5.28), the landward force of those tests whose relative water depth are less than 0.25 (Group 1)
have less magnitude compared to the seaward loads. This is basically is related to the reduction of
landward load due to overtopping. The Goda (1974) diagram was obtained under the condition
that a vertical breakwater only experiences loads caused by wave crest and trough without
overtopping; whereas the sloping top caisson being analyzed here is heavily overtopped. The left
panel of Figure (5.28) also shows that maximum landward loads exceed maximum seaward loads
when relative water depth exceeds 0.25. It is seen that all tests in Group (2), refer to the Tests 1A,
1B, 1C and 4A which have higher steepness compared to others. From the inspection of videos, it
was found that all these maximum landward loads are generated through breaking or slightly
breaking waves on the sloping part of caisson creating impulsive wave forces. The right panel of
Figure (5.28) shows the same plot when the respective spikes have been removed. As can be seen
in this figure, the test in the Group (1) remains somehow in the same position while all points in
Group (2) drop below the green line. The Same scenario can be explained for the ratio between
average landward load and average seaward load (Fig.5.29).
Figure 5.28- The ratio between maximum landward loads to maximum seaward load. (Left panel) Beforesmoothing. (Right panel) After smoothing
0
0.2
0.4
0.6
0.8
1
1.2
1.4
1.6
1.8
0 0.05 0.1 0.15 0.2 0.25 0.3 0.35
Max
land
war
dlo
ad/m
axse
awar
dlo
ad
h/L1/3
Without airWith air Landward load < Seaward load
Landward load > Seaward load
Goda's criterian
0
0.1
0.2
0.3
0.4
0.5
0.6
0.7
0.8
0.9
1
1.1
0 0.05 0.1 0.15 0.2 0.25 0.3 0.35
Max
land
war
dlo
ad/m
axse
awar
dlo
ad-
Smoo
thed
h/L1/3
Without airWith air
Landward load < Seaward load
(2)
(1)
(2)
(1)

Chapter 5. Analysis of wave loadings acting on sloping top breakwater
111
Figure 5.29- The ratio between average landward loads to average seaward load. (Left panel) Beforesmoothing. (Right panel) After smoothing
Force under trough phase
Significant wave overtopping reduces wave force under crest compared to a non-overtopped
structure. Thus, it is reasonable to wonder if crest loadings (landward directed) may be exceeded
by the trough ones (seaward directed). For present data, it is seen from Figure (5.28 - right panel)
that after smoothing the breaking peaks from the front force signals, trough force overcomes the
crest one in all the tests by a factor ranging from 0.47 to 0.91 (0.76 on average).
Figure 5.30- Non-dimensional maximum seaward load vs steepness. (Left panel) Before smoothing.(Right panel) After smoothing
Figure (5.30) represents variation of non-dimensional maximum seaward load against wave
steepness before and after smoothing for each test. Long waves generate greater seaward load
irrespective to air entrainment. The spikes observed during the wave trough phase do not obviously
0
0.2
0.4
0.6
0.8
1
1.2
1.4
0 0.05 0.1 0.15 0.2 0.25 0.3 0.35
Avg
land
war
dlo
ad/A
vgse
awar
dlo
ad
h/L1/3
Without airWith air Landward load < Seaward load
Landward load > Seaward load
Goda's criterian
0
0.2
0.4
0.6
0.8
1
1.2
0 0.05 0.1 0.15 0.2 0.25 0.3 0.35
Avg
land
war
dlo
ad/A
vgse
awar
dlo
ad-
Smoo
thed
h/L1/3
Without airWith air
Landward load < Seaward load
0
0.2
0.4
0.6
0.8
1
1.2
1.4
0 0.02 0.04 0.06 0.08 0.1
Max
seaw
ard
load
/(ρgH
1/3h
)
H1/3/L1/3
Without airWith air
0
0.2
0.4
0.6
0.8
1
1.2
1.4
0 0.02 0.04 0.06 0.08 0.1
Max
seaw
ard
load
/(ρgH
1/3h
)-Sm
ooth
ed
H1/3/L1/3
Without airWith air

Chapter 5. Analysis of wave loadings acting on sloping top breakwater
112
have a physical meaning, but rather are normally originated from the essence of application of
numerical modeling. The latter, nevertheless, is quite negligible (expect test N1) by comparing the
maximum seaward load before and after smoothing.
Figure 5.31- Maximum trough force vs predictions of Goda graphical model
Figure 5.32- Maximum trough force vs predictions of Sainflou model
Since no suggestions come from the Takahashi et.al work, the maximum measured seaward
directed force onto the outer face of the wall has been compared with the predictions of the Goda
(1985) and Sainflou (1928) methods. In both cases Hmax and Tmax have been employed. From the
0
200
400
600
800
1000
1200
0 200 400 600 800 1000 1200
Max
imum
seaw
ard
forc
e-S
moo
thed
[KN
/m]
Goda force [KN/m]
1A-1B-1C2A-2B-2CN1-N24A-3A-3B (with air)Perfect agreementSF=1.5
0
200
400
600
800
1000
1200
0 200 400 600 800 1000 1200
Max
imum
seaw
ard
forc
e-S
moo
thed
[KN
/m]
Sainflou force [KN/m]
1A-1B-1C2A-2B-2CN1-N24A-3A-3B (with air)Perfect agreementSF=1.5
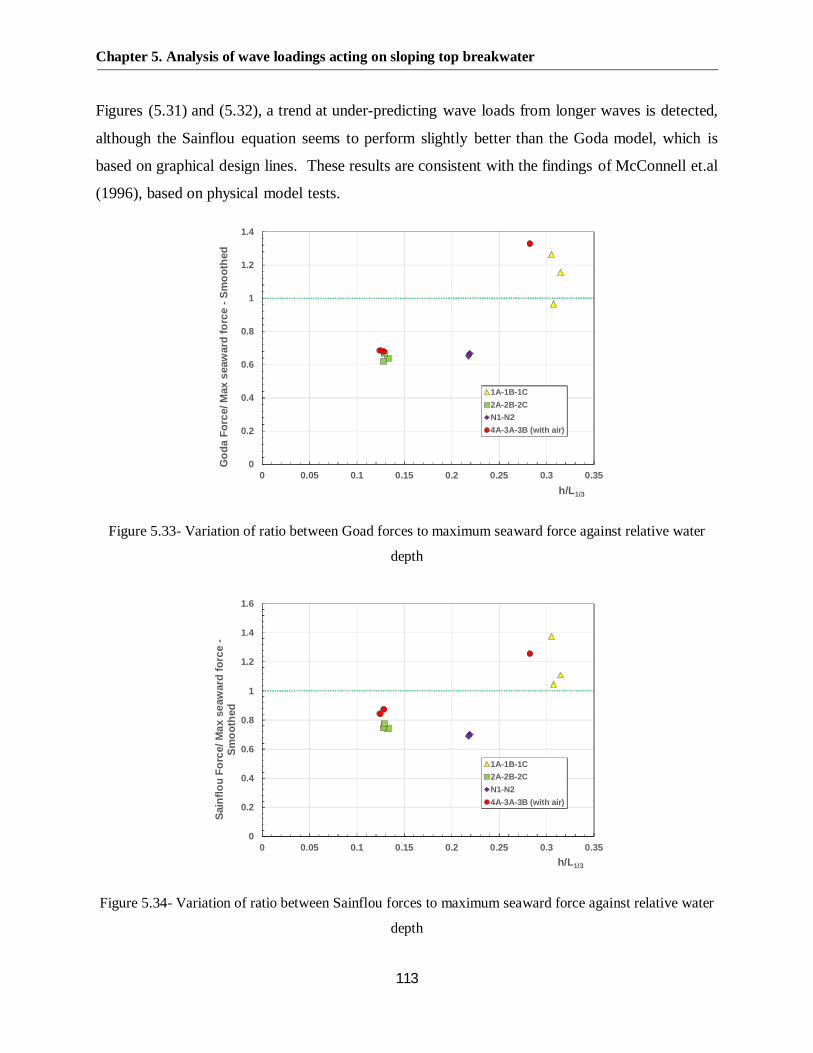
Chapter 5. Analysis of wave loadings acting on sloping top breakwater
113
Figures (5.31) and (5.32), a trend at under-predicting wave loads from longer waves is detected,
although the Sainflou equation seems to perform slightly better than the Goda model, which is
based on graphical design lines. These results are consistent with the findings of McConnell et.al
(1996), based on physical model tests.
Figure 5.33- Variation of ratio between Goad forces to maximum seaward force against relative water
depth
Figure 5.34- Variation of ratio between Sainflou forces to maximum seaward force against relative water
depth
0
0.2
0.4
0.6
0.8
1
1.2
1.4
0 0.05 0.1 0.15 0.2 0.25 0.3 0.35
God
aFo
rce/
Max
seaw
ard
forc
e-S
moo
thed
h/L1/3
1A-1B-1C2A-2B-2CN1-N24A-3A-3B (with air)
0
0.2
0.4
0.6
0.8
1
1.2
1.4
1.6
0 0.05 0.1 0.15 0.2 0.25 0.3 0.35
Sain
flou
Forc
e/M
axse
awar
dfo
rce
-Sm
ooth
ed
h/L1/3
1A-1B-1C2A-2B-2CN1-N24A-3A-3B (with air)

Chapter 5. Analysis of wave loadings acting on sloping top breakwater
114
Figures (5.33) and (5.34) respectively display variation of ratio between Goda and Sainflou loads
to the maximum seaward load as a function of h/L1/3. Both predictions methods under predict the
seaward forces for h/L1/3<0.28. However, Sainflou method gives higher safety factor. The result
is independent of air contribution.
5.3 Effect of the transmitted wave field
The previous section examined horizontal wave loading applied only on the front face of the
structure. In the continuation of the present study, following section discusses the effect of wave
overtopping and forces associated with wave transmission on the modeled sloping top breakwater.
The total load including what the front and rear face pressure transducers have recorded are
analyzed. The latter is called Net Force which is obtained from the algebraic summation of
landward load having positive direction and seaward load having negative direction. It is worthy
to note that any wave interaction on both sides of the caisson consisting of load generated in the
front face, due to wave crest or wave trough, and force produced at the rear side, due to overtopping
and related load, of the structure, can be in landward or seaward direction. Figure (5.35) shows an
example of a selected event from test 1A. Panel “a” represents landward force recorded on the
front face of the structure during the cycle consisting of an impact followed by some oscillations.
For the same cycle, Panel “b”, illustrates the chronogram of seaward load captured via rear side
pressure transducers. Apart from the landward impulsive load that structure experiences during the
cycle, a violent impact occurs due to the plunge of an overtopping wave behind the structure which
is consistent with Walkden et.al (2001) experimental study. Although the seaward force is
negative, here the plot shows only the magnitude of respective loading. Finally, panel “c” indicates
the horizontal resultant of landward and seaward load, NET force.
The time interval shown in all panels reveals that the impulsive seaward load caused by wave
overtopping occurs during wave trough of the incident wave which itself generates pulsating
seaward load as well. In such a situation Net force is superposed by to two different loading in
front and at the rear side of the structure.
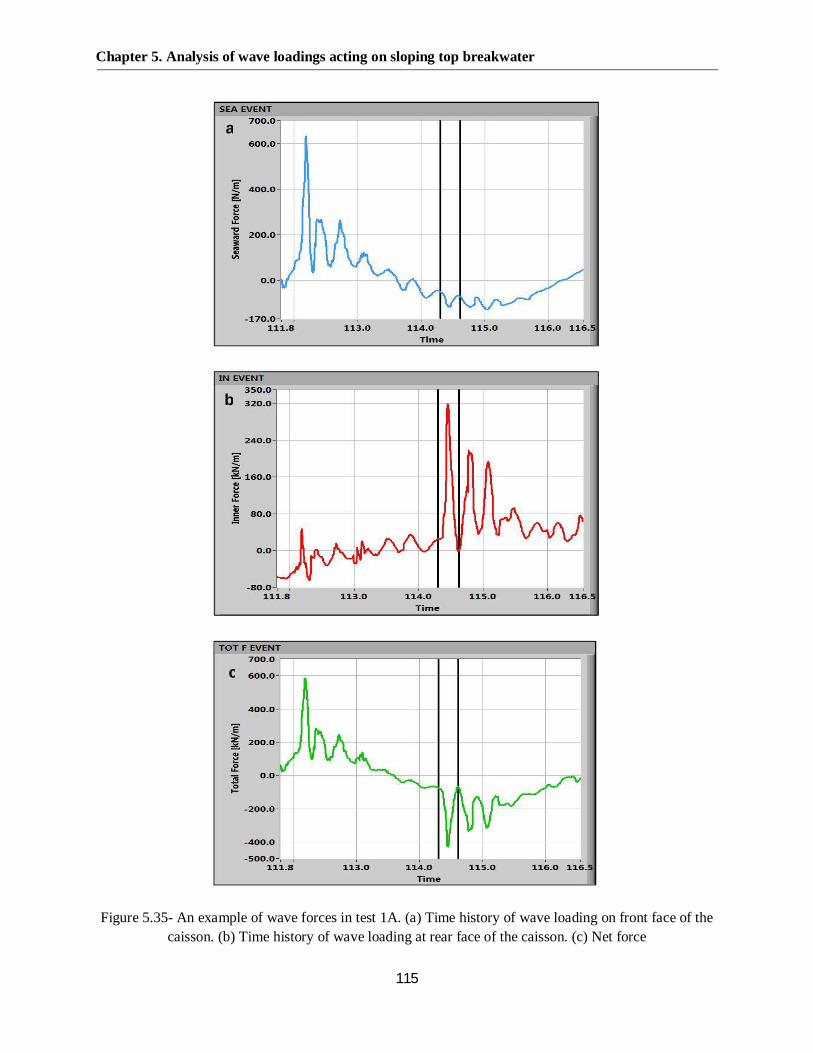
Chapter 5. Analysis of wave loadings acting on sloping top breakwater
115
Figure 5.35- An example of wave forces in test 1A. (a) Time history of wave loading on front face of thecaisson. (b) Time history of wave loading at rear face of the caisson. (c) Net force
a
b
c

Chapter 5. Analysis of wave loadings acting on sloping top breakwater
116
For all tests and per each wave cycle, peaks and valleys associated with net force were obtained.
Figures (5.36) to (5.38) present such plots against cycle number for the tests 1A, 2B, and N2. As
can be seen in the Figure (5.36), 13th cycle in test 1A represent the maximum net force in both
landward and seaward directions which are consistent with positive and negative peaks calculated
in Figure (5.35), panel “c”. In order to make a comparison between net landward and net seaward
forces, in these plots, absolute values of seaward loads are reported.
Figure 5.36- Maximum net landward and net seaward load for each cycle. Test 1A
Figure 5.37- Maximum net landward and net seaward load for each cycle. Test 2B
0
200
400
600
800
1000
1200
1400
1 3 5 7 9 11 13 15 17 19 21 23 25 27 29 31 33
Peak
san
dva
lleys
(KN
/m)
Cycle number
TEST1A - Net force
LandwardSeaward
0
200
400
600
800
1000
1200
1400
1600
1 3 5 7 9 11 13 15 17 19 21 23 25 27
Peak
san
dva
lleys
(KN
/m)
Cycle number
TEST2B - Net force
LandwardSeaward
Maximum net forces in landward andseaward directions. (Fig. 5.35 panel “c”)

Chapter 5. Analysis of wave loadings acting on sloping top breakwater
117
Figure 5.38- Maximum net landward and net seaward load for each cycle. Test N2
Figure 5.39- Safety factor calculated by Net force for each cycle. Test 1A
Figure 5.40- Safety factor calculated by Net force for each cycle. Test 2B
0
200
400
600
800
1000
1200
1400
1600
1 3 5 7 9 11 13 15 17 19 21 23 25
Peak
san
dva
lleys
(KN
/m)
Cycle number
TESTN2 - Net force
LandwardSeaward
0
0.2
0.4
0.6
0.8
1
1.2
1.4
1.6
1.8
2
1 3 5 7 9 11 13 15 17 19 21 23 25 27 29 31 33
Safe
tyfa
ctor
Cycle number
TEST1A - Net force
LandwardSeaward
SAFE
UNSAFE
0
0.5
1
1.5
2
2.5
3
1 3 5 7 9 11 13 15 17 19 21 23 25 27
Safe
tyfa
ctor
Cycle number
TEST2B - Net force
LandwardSeaward
SAFE
UNSAFE
Safety factor associated with maximum net force inlandward and seaward direction. (Fig 5.35 panel “c”)

Chapter 5. Analysis of wave loadings acting on sloping top breakwater
118
Figure 5.41- Safety factor calculated by Net force for each cycle. Test N2
Concerning abovementioned tests, the corresponding safety factor considering both net landward
and net seaward loads are shown in Figures (5.39) to (5.41).Safety factor, as previously described,
is defined as the ratio between the forces predicted by the Takahashi et.al (1994) and maximum
forces per cycle in landward and seaward direction. For the wave loading shown in Figure (5.39)
which represents the 13th cycle of test 1A, the minimum safety factor in landward and seaward
directions are 0.411 and 0.558 respectively. This can be interpreted by two facts. Firstly the
underestimation of Takahashi’s load for both directions and secondly the landward sliding
tendency during the respective wave cycle. It is worth to highlight that the former and the latter
vary cycle by cycle for each test and the design response must be governed by the absolute
minimum safety factor obtained from landward and seaward directions throughout the wave
loading.
Table (5.2) reports, for each test, the major statistical parameters namely maximum, mean,
standard deviation and mode of the non-dimensional maximum pressure at the peak of force. It is
seen, as expected, that air entrainment reduces the pressure magnitude; comparing results for quasi
standing/surging breakers (3A and 3B versus 2A and 2B), a reduction of about 20% has been
detected, whereas in the test 4A the maximum pressure is less than half the value of test 1A. This
basically because in the former the wave heights are larger and tend to break rather far from the
breakwater, preventing the occurrence of impact events like those depicted In Figure (5.6).
0
0.2
0.4
0.6
0.8
1
1.2
1 3 5 7 9 11 13 15 17 19 21 23 25
Safe
tyfa
ctor
Cycle number
TESTN2 - Net force
LandwardSeaward
SAFE
UNSAFE
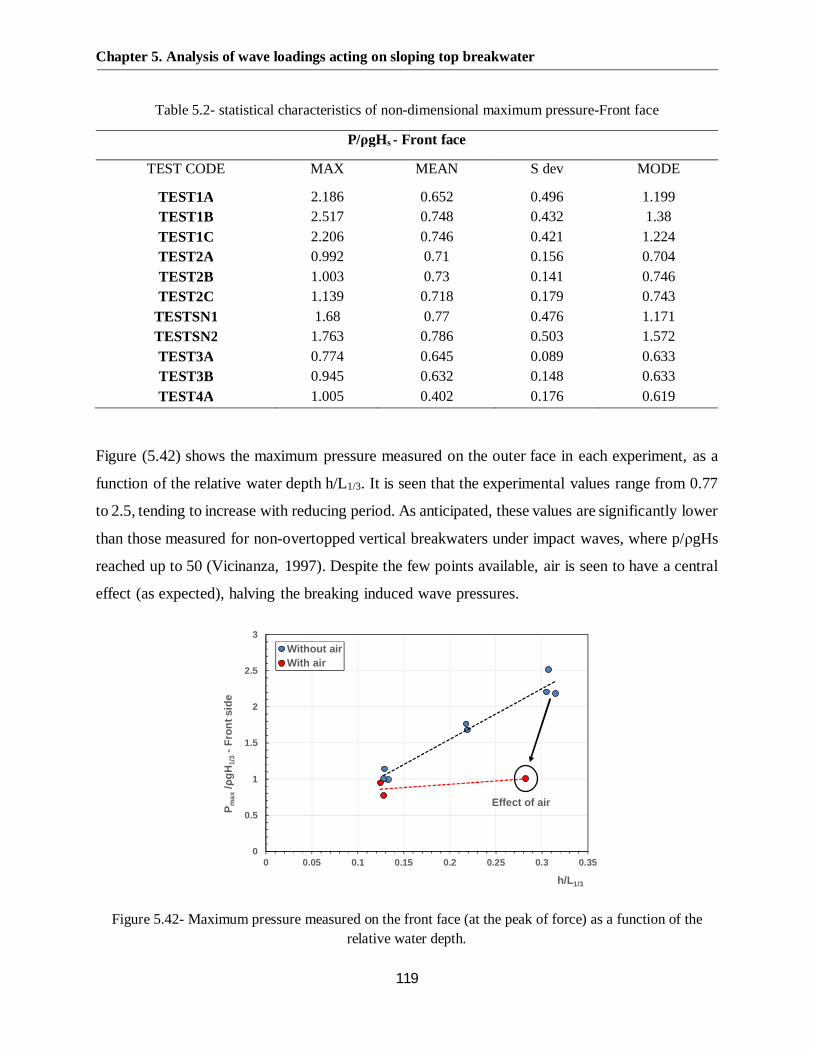
Chapter 5. Analysis of wave loadings acting on sloping top breakwater
119
Table 5.2- statistical characteristics of non-dimensional maximum pressure-Front face
P/ρgHs - Front face
TEST CODE MAX MEAN S dev MODE
TEST1A 2.186 0.652 0.496 1.199TEST1B 2.517 0.748 0.432 1.38TEST1C 2.206 0.746 0.421 1.224TEST2A 0.992 0.71 0.156 0.704TEST2B 1.003 0.73 0.141 0.746TEST2C 1.139 0.718 0.179 0.743
TESTSN1 1.68 0.77 0.476 1.171TESTSN2 1.763 0.786 0.503 1.572TEST3A 0.774 0.645 0.089 0.633TEST3B 0.945 0.632 0.148 0.633TEST4A 1.005 0.402 0.176 0.619
Figure (5.42) shows the maximum pressure measured on the outer face in each experiment, as a
function of the relative water depth h/L1/3. It is seen that the experimental values range from 0.77
to 2.5, tending to increase with reducing period. As anticipated, these values are significantly lower
than those measured for non-overtopped vertical breakwaters under impact waves, where p/ρgHs
reached up to 50 (Vicinanza, 1997). Despite the few points available, air is seen to have a central
effect (as expected), halving the breaking induced wave pressures.
Figure 5.42- Maximum pressure measured on the front face (at the peak of force) as a function of therelative water depth.
0
0.5
1
1.5
2
2.5
3
0 0.05 0.1 0.15 0.2 0.25 0.3 0.35
P max
/ρgH
1/3
-Fro
ntsi
de
h/L1/3
Without airWith air
Effect of air

Chapter 5. Analysis of wave loadings acting on sloping top breakwater
120
Table 5.3- statistical characteristics of non-dimensional maximum pressure-Rear face
P/ρgHs - Rear face
TEST CODE MAX MEAN S dev MODE
TEST1A 1.635 0.285 0.358 0.739TEST1B 1.286 0.428 0.371 0.643TEST1C 0.472 0.165 0.124 0.236TEST2A 1.171 0.149 0.217 0.592TEST2B 1.73 0.22 0.369 0.866TEST2C 0.407 0.068 0.083 0.204
TESTSN1 2.794 0.52 0.767 1.391TESTSN2 1.61 0.316 0.367 0.807TEST3A 1.676 0.619 0.455 0.859TEST3B 1.129 0.489 0.317 0.587TEST4A 1.653 0.34 0.408 0.83
Table (5.3) summarizes the same measurements reported in the table (5.2) but at back face of the
sloping top breakwater. As it will be discussed more in detail in the next section, there are different
mechanisms which are responsible to generate violent impact at back side of the structure.
Furthermore, since the impact mechanism is significantly affected by intrinsic uncertainty in the
water, and even by small disturbances of the free surface (Peregrine, 2003), the resulting loadings
exhibit a large variance particularly for same relative water depth (Fig. 5.43).
Figure 5.43- Maximum pressure measured at the rear face (at the peak of force) as a function of therelative water depth.
1A
1B
1C
2A2B
2C
N1
N23A
3B
4A
0
0.5
1
1.5
2
2.5
3
0 0.05 0.1 0.15 0.2 0.25 0.3 0.35
P max
/ρgH
1/3
-Rea
rsid
e
h/L1/3
Without airWith air

Chapter 5. Analysis of wave loadings acting on sloping top breakwater
121
5.3.1 Global characteristics of net wave loading
Wave overtopping produces two main effects and namely:
· A variation of force peaks compared to those discussed in the previous section (which
accounted front face pressures only);
· The occurrence of impulsive loadings on the rear side of the breakwater.
Despite the above items are deeply interrelated, they will be analyzed separately in the following;
wave force chronograms at the rear wall are firstly smoothed using the same Savitzky and Golay
filter employed for front face loadings. In this way, impulsive peaks are “cutout”. Then, impact
events are studied in detail.
Variation of (smoothed) force peaks
Waves transmitted behind the structure by overtopping have been observed to possess a nearly π
phase lag compared to the incoming waves. Accordingly, both landward and seaward horizontal
force peaks at the front face are amplified in magnitude. Figures (5.44) and (5.45) suggest the
amplification factor to be negligible for the trough loads (1.05 on average in Fig. 5.44), whereas
for the landward directed force it reaches 1.16 (Fig.5. 45). This factor should be incorporated into
the Takahashi et.al equation, to avoid significant under-predictions.
Figure 5.44- Seaward directed (trough) force peak calculated at the front face vs total force peakincluding loadings generated by wave overtopping.
y = 1.05xR² = 0.98
0
200
400
600
800
1000
1200
1400
0 200 400 600 800 1000 1200 1400
Max
imum
seaw
ard
forc
e(N
et)[
KN/m
]
Maximum seaward force (front face) [KN/m]
1A-1B-1C2A-2B-2CN1-N24A-3A-3B (with air)
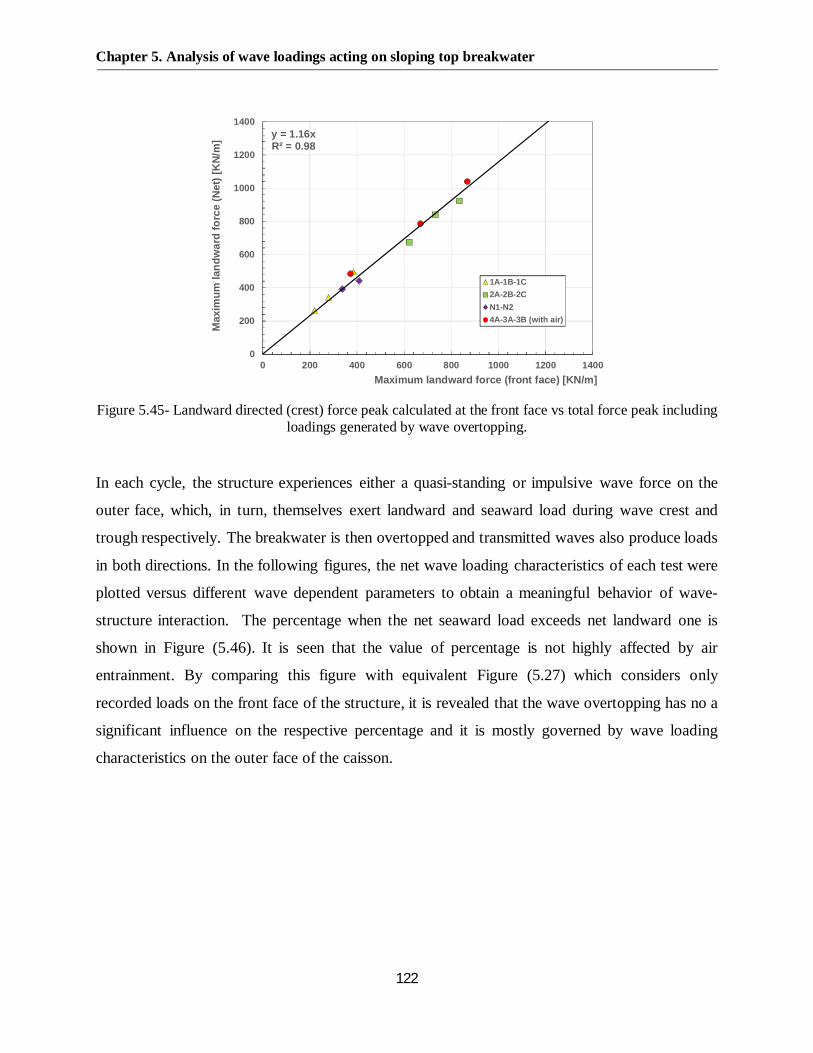
Chapter 5. Analysis of wave loadings acting on sloping top breakwater
122
Figure 5.45- Landward directed (crest) force peak calculated at the front face vs total force peak includingloadings generated by wave overtopping.
In each cycle, the structure experiences either a quasi-standing or impulsive wave force on the
outer face, which, in turn, themselves exert landward and seaward load during wave crest and
trough respectively. The breakwater is then overtopped and transmitted waves also produce loads
in both directions. In the following figures, the net wave loading characteristics of each test were
plotted versus different wave dependent parameters to obtain a meaningful behavior of wave-
structure interaction. The percentage when the net seaward load exceeds net landward one is
shown in Figure (5.46). It is seen that the value of percentage is not highly affected by air
entrainment. By comparing this figure with equivalent Figure (5.27) which considers only
recorded loads on the front face of the structure, it is revealed that the wave overtopping has no a
significant influence on the respective percentage and it is mostly governed by wave loading
characteristics on the outer face of the caisson.
y = 1.16xR² = 0.98
0
200
400
600
800
1000
1200
1400
0 200 400 600 800 1000 1200 1400
Max
imum
land
war
dfo
rce
(Net
)[K
N/m
]
Maximum landward force (front face) [KN/m]
1A-1B-1C2A-2B-2CN1-N24A-3A-3B (with air)

Chapter 5. Analysis of wave loadings acting on sloping top breakwater
123
Figure 5.46- Percentage when Net seaward load exceeds Net landward load vs relative water depth.
Figure (5.47) shows the percentage of the failure due to net landward load. This load is the
combination of wave crest action and any probable landward directed force induced by fluctuation
created through wave transmission.
Figure 5.47- Percentage of the failure due to Net landward load vs wave steepness.
0
20
40
60
80
100
0 0.05 0.1 0.15 0.2 0.25 0.3 0.35
Perc
enta
gew
hen
nets
eaw
ard
laod
>ne
tla
ndw
ard
load
h/L1/3
Without airWith air
0
20
40
60
80
100
0 0.02 0.04 0.06 0.08 0.1
Perc
enta
geof
failu
redu
eto
netl
andw
ard
load
H1/3/L1/3
Without air
With air

Chapter 5. Analysis of wave loadings acting on sloping top breakwater
124
Percentage of the failure caused by net seaward load is plotted as a function of wave steepness in
Figure (5.48). The net seaward load includes wave trough action and seaward directed force
created by wave transmission. It is seen that percentage of the failure increases when steepness
increases but with more gentle slope compared with Figure (5.47). However, for all tests, the
probability of failure due to seaward loads is higher than landward force.
Figure 5.48- Percentage of the failure due to Net seaward load vs wave steepness.
Figure 5.49- Minimum safety factor against Net landward load vs wave steepness. (Left panel) Beforesmoothing. (Right panel) After smoothing
0
20
40
60
80
100
0 0.02 0.04 0.06 0.08 0.1Perc
enta
geof
failu
redu
eto
nets
eaw
ard
load
H1/3/L1/3
Without airWith air
0
0.2
0.4
0.6
0.8
1
1.2
1.4
0 0.02 0.04 0.06 0.08 0.1
Taka
hash
ifor
ce/N
etla
ndw
ard
load
H1/3/L1/3
Without airWith airSAFE
UNSAFE
0
0.2
0.4
0.6
0.8
1
1.2
1.4
0 0.02 0.04 0.06 0.08 0.1
Taka
hash
ifor
ce/N
etla
ndw
ard
load
-Sm
ooth
ed
H1/3/L1/3
Without airWith airSAFE
UNSAFE

Chapter 5. Analysis of wave loadings acting on sloping top breakwater
125
Figure (5.49) shows the variation of minimum safety factor against net landward load versus wave
steepness. A very good decreasing trend is observed while steepness increases. In all tests, the ratio
of Takahashi force to maximum net landward load is less than unity implying unsafe condition.
Compared to the equivalent graph shown in Figure (5.26), all minimum safety factors have
decreased which indicate the contribution of wave transmission in increasing landward loads.
Although the Goda and Sainflou formulae have been basically proposed for a non-overtopped
structure, nevertheless, minimum safety factor against total seaward load has not significantly been
affected by wave transmission. The latter is observed by comparing Figure (5.50) with Figures
(5.33) and (5.34). It must be also kept in mind that the respective seaward loads, either induced by
wave trough or caused by wave overtopping, have been already smoothed. Hence, the minimum
safety factors presented here have been calculated using pulsating loads peaks.
Figure 5.50- Minimum safety factor against Net seaward load vs relative wave depth. (Left panel) Godaseaward load. (Right panel) Sainflou seaward load
Approximate sliding function
One of the most important forcings for the stability of monolithic breakwaters is the sliding
force, S. The latter represents the total shear the structure has to withstand (by its weight) to
prevent sliding on the bottom. S is defined as follows (Fig.5.51):
= + ( − ) (4)
In which:
· is the horizontal force including effects of transmitted waves;
0
0.2
0.4
0.6
0.8
1
1.2
1.4
0 0.05 0.1 0.15 0.2 0.25 0.3 0.35
God
ase
awar
dfo
rce/
Nets
eaw
ard
forc
e-(S
moo
thed
)
h/L1/3
without airwith air
SAFE
UNSAFE
0
0.2
0.4
0.6
0.8
1
1.2
1.4
0 0.05 0.1 0.15 0.2 0.25 0.3 0.35
Sain
flou
seaw
ard
forc
e/N
etse
awar
dfo
rce-
(Sm
ooth
ed)
h/L1/3
without airwith air
SAFE
UNSAFE
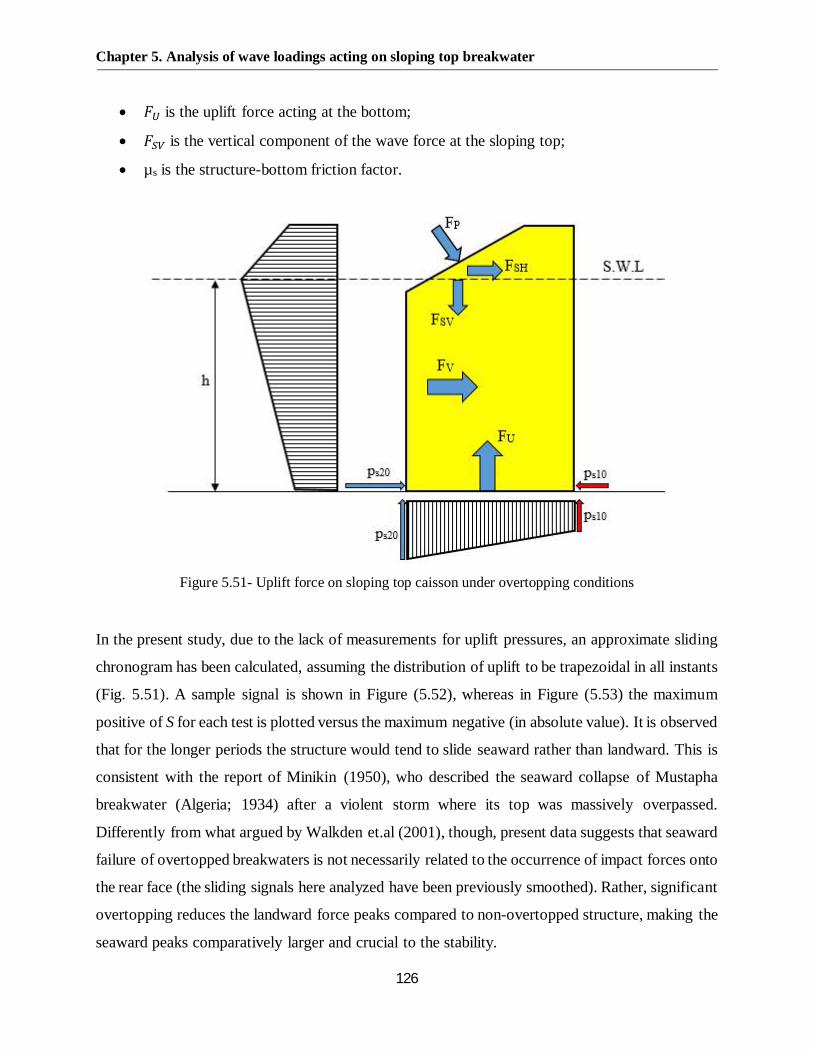
Chapter 5. Analysis of wave loadings acting on sloping top breakwater
126
· is the uplift force acting at the bottom;
· is the vertical component of the wave force at the sloping top;
· µs is the structure-bottom friction factor.
Figure 5.51- Uplift force on sloping top caisson under overtopping conditions
In the present study, due to the lack of measurements for uplift pressures, an approximate sliding
chronogram has been calculated, assuming the distribution of uplift to be trapezoidal in all instants
(Fig. 5.51). A sample signal is shown in Figure (5.52), whereas in Figure (5.53) the maximum
positive of S for each test is plotted versus the maximum negative (in absolute value). It is observed
that for the longer periods the structure would tend to slide seaward rather than landward. This is
consistent with the report of Minikin (1950), who described the seaward collapse of Mustapha
breakwater (Algeria; 1934) after a violent storm where its top was massively overpassed.
Differently from what argued by Walkden et.al (2001), though, present data suggests that seaward
failure of overtopped breakwaters is not necessarily related to the occurrence of impact forces onto
the rear face (the sliding signals here analyzed have been previously smoothed). Rather, significant
overtopping reduces the landward force peaks compared to non-overtopped structure, making the
seaward peaks comparatively larger and crucial to the stability.

Chapter 5. Analysis of wave loadings acting on sloping top breakwater
127
Figure 5.52. Example of sliding force signal (smoothed).Test 2A
Figure 5.53. Maximum landward sliding force vs maximum seaward (Smoothed signals)
The above results also highlight the need of a reliable estimate of wave loadings under trough
phase, which were found to be frequently under-predicted by classical literature methods (Figs.
5.31 and 5.32). Tentative equations are given in the next subsection.
0
200
400
600
800
1000
1200
1400
0 200 400 600 800 1000 1200 1400
Max
imum
Net
seaw
ard
slid
ing
forc
e[K
N/m
]-Sm
ooth
ed
Maximum Net landward sliding force [KN/m]-Smoothed
1A-1B-1C2A-2B-2CN1-N24A-3A-3B (with air)
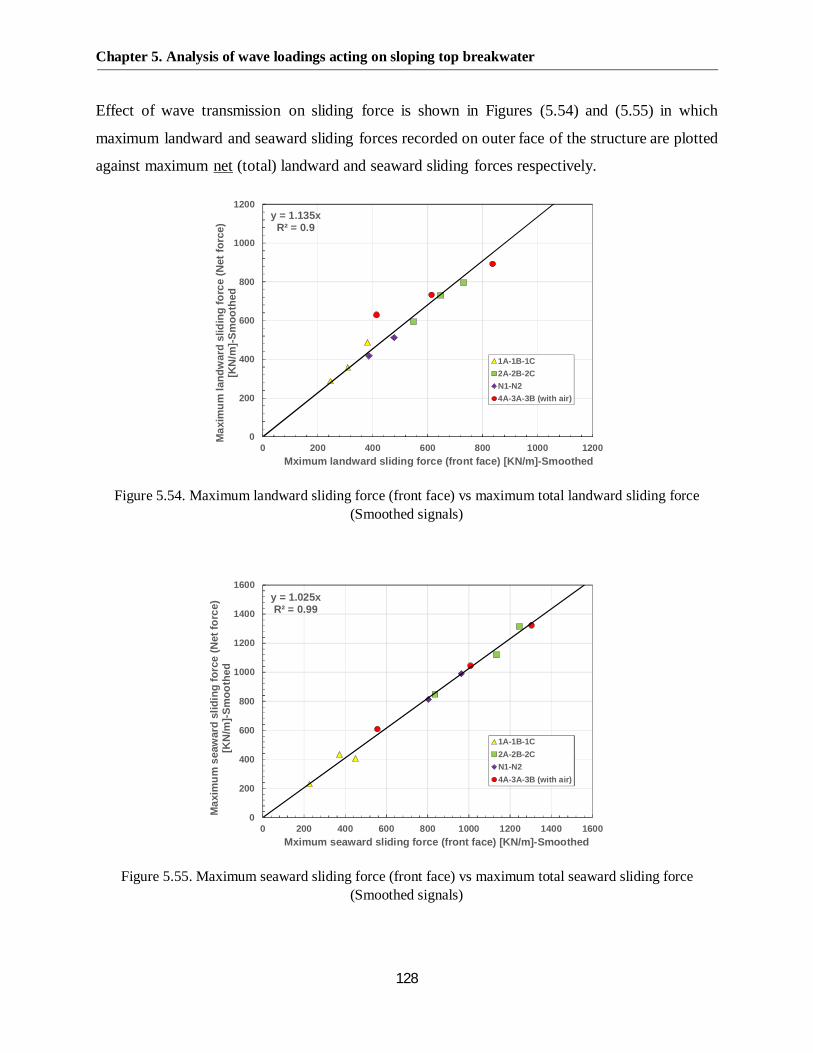
Chapter 5. Analysis of wave loadings acting on sloping top breakwater
128
Effect of wave transmission on sliding force is shown in Figures (5.54) and (5.55) in which
maximum landward and seaward sliding forces recorded on outer face of the structure are plotted
against maximum net (total) landward and seaward sliding forces respectively.
Figure 5.54. Maximum landward sliding force (front face) vs maximum total landward sliding force(Smoothed signals)
Figure 5.55. Maximum seaward sliding force (front face) vs maximum total seaward sliding force(Smoothed signals)
y = 1.135xR² = 0.9
0
200
400
600
800
1000
1200
0 200 400 600 800 1000 1200
Max
imum
land
war
dsl
idin
gfo
rce
(Net
forc
e)[K
N/m
]-Sm
ooth
ed
Mximum landward sliding force (front face) [KN/m]-Smoothed
1A-1B-1C2A-2B-2CN1-N24A-3A-3B (with air)
y = 1.025xR² = 0.99
0
200
400
600
800
1000
1200
1400
1600
0 200 400 600 800 1000 1200 1400 1600
Max
imum
seaw
ard
slid
ing
forc
e(N
etfo
rce)
[KN
/m]-S
moo
thed
Mximum seaward sliding force (front face) [KN/m]-Smoothed
1A-1B-1C2A-2B-2CN1-N24A-3A-3B (with air)

Chapter 5. Analysis of wave loadings acting on sloping top breakwater
129
It is seen that overtopping gives rise to an increase of 13.5 % in landward sliding force and increase
of 2.5% in seaward sliding force. It must be kept in mind that the respective force signals have
been already smoothed and probable impacts loads, in both side of the caisson, have not been
considered.
Variations of ratio between Takahashi and maximum landward/seaward sliding force (safety
factor) against relative water depth are shown in Figures (5.56) and (5.57). An obvious trend is
observed for landward direction whereas the variations in seaward direction is scattered.
Moreover, for all tests, safety factor is less that unity under trough phase. However, the Takahashi
method gives a slightly better prediction only for longer waves under crest phase.
Figure 5.56- Minimum safety factor against landward sliding. Left panel: front face. Right panel: netforce (Smoothed signals)
Figure 5.57- Minimum safety factor against seaward sliding. Left panel: front face. Right panel: net force(Smoothed signals)
y = -2.66x + 1.44R² = 0.91
0
0.2
0.4
0.6
0.8
1
1.2
1.4
0 0.05 0.1 0.15 0.2 0.25 0.3 0.35
Max
Taka
hash
islid
ing
forc
e/M
axla
ndw
ard
slid
ing
forc
e(fr
ontf
ace)
-Sm
ooth
ed
h/L1/3
1A-1B-1C2A-2B-2CN1-N24A-3A-3B (with air)
y = -2.75x + 1.34R² = 0.92
0
0.2
0.4
0.6
0.8
1
1.2
1.4
0 0.05 0.1 0.15 0.2 0.25 0.3 0.35
Max
Taka
hash
islid
ing
forc
e/M
axla
ndw
ard
slid
ing
forc
e(N
etfo
rce)
-Sm
ooth
ed
h/L1/3
1A-1B-1C2A-2B-2CN1-N24A-3A-3B (with air)
0
0.1
0.2
0.3
0.4
0.5
0.6
0.7
0.8
0.9
0 0.05 0.1 0.15 0.2 0.25 0.3 0.35
Max
Taka
hash
islid
ing
forc
e/M
axse
awar
dsl
idin
gfo
rce
(fron
tfac
e)-S
moo
thed
h/L1/3
1A-1B-1C2A-2B-2CN1-N24A-3A-3B (with air)
0
0.1
0.2
0.3
0.4
0.5
0.6
0.7
0.8
0.9
0 0.05 0.1 0.15 0.2 0.25 0.3 0.35
Max
Taka
hash
islid
ing
forc
e/M
axse
awar
dsl
idin
gfo
rce
(Net
forc
e)-S
moo
thed
h/L1/3
1A-1B-1C2A-2B-2CN1-N24A-3A-3B (with air)

Chapter 5. Analysis of wave loadings acting on sloping top breakwater
130
The use of the Linear Thrust Parameter (LTP)
As pointed out by Hughes (2004), wave momentum flux is the property of progressive waves most
closely related to force loads on coastal structures or any other solid object placed in the wave
field. For this reason, wave momentum flux is a compelling wave property for characterizing
waves in the nearshore region, and potentially, for relating waves to the response of coastal
structures due to wave loading or to other coastal processes. A convenient expression for non-
dimensional maximum depth-integrated wave momentum flux is given by the following equation:
ℎ =12 ℎ
ℎ ℎℎ +
18 ℎ × 1 +
2 ℎℎ ℎ (5.1)
By retaining only the first order terms, The Linear Thrust Parameter is defined as:
= ℎtanh( ℎ)
ℎ (5.2)
Which represents the ratio between the maximum value (over a wave period) of the wave
momentum flux and the corresponding hydrostatic still water thrust. In the Equation (5.2) HI is the
incident wave height at the toe of the structure and k represents the wave number 2π/L. It is seen
that LTP coincides with the wave height to depth ratio (H/h) in shallow water.
In analyzing the structural response of a wave energy converter consisting of a set of inclined
concrete plates subject to severe overtopping, Buccino et.al (2015) proposed the following formula
to calculate the horizontal component of wave force under crest phase:
= ∙ ℎℎ (5.3)
In the Equation (5.3), ρ is the water density, g is gravity, h is the water depth at the structure toe
and hc is structure height. Finally, is an empirical coefficient of order of one.
In order to take the effect of overtopping process into the account, the Equation (5.3) is rewritten
as follows:
= ∙ ℎℎ(1 + )
2 (5.4)
In which KR is the reflection coefficient that can be calculated through Equation (4.5)

Chapter 5. Analysis of wave loadings acting on sloping top breakwater
131
It has been found Equation (5.4) to reasonably predict either the maximum landward horizontal
force or the maximum seaward one or the corresponding peaks of the sliding force S (Figs 5.58 to
5.65).
Figure 5.58. Maximum total landward load predicted by Eq.5.4 - (Smoothed signals)
Figure 5.59- Maximum landward load (front face) predicted by Eq.5.4 - (Smoothed signals)
y = 1.11xR² = 0.87
0
200
400
600
800
1000
1200
0 200 400 600 800 1000 1200
Max
land
war
dfo
rce
(Net
forc
e)[K
N/m
]-Sm
ooth
ed
Eq. 5.4
1A-1B-1C2A-2B-2CN1-N24A-3A-3B (with air)
y = 0.9xR² = 0.9
0
200
400
600
800
1000
1200
0 200 400 600 800 1000 1200
Max
land
war
dfo
rce
(fron
tfac
e)[K
N/m
]-Sm
ooth
ed
Eq. 5.4
1A-1B-1C2A-2B-2CN1-N24A-3A-3B (with air)
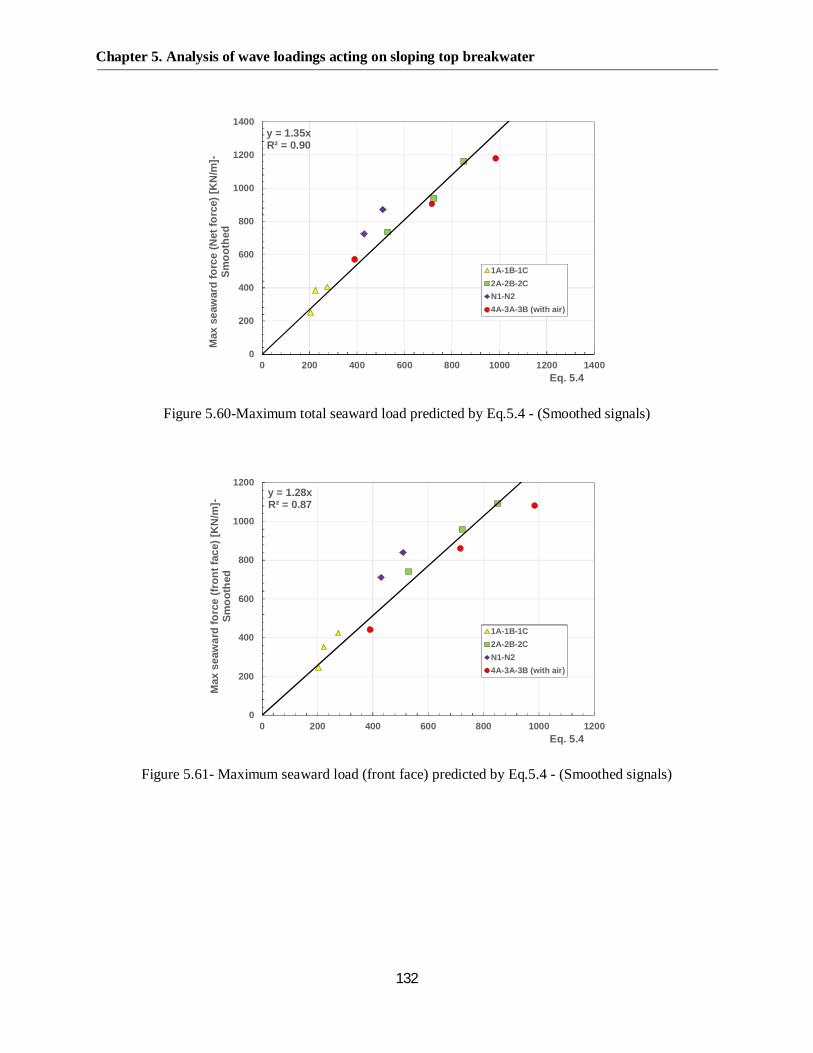
Chapter 5. Analysis of wave loadings acting on sloping top breakwater
132
Figure 5.60-Maximum total seaward load predicted by Eq.5.4 - (Smoothed signals)
Figure 5.61- Maximum seaward load (front face) predicted by Eq.5.4 - (Smoothed signals)
y = 1.35xR² = 0.90
0
200
400
600
800
1000
1200
1400
0 200 400 600 800 1000 1200 1400
Max
seaw
ard
forc
e(N
etfo
rce)
[KN
/m]-
Smoo
thed
Eq. 5.4
1A-1B-1C2A-2B-2CN1-N24A-3A-3B (with air)
y = 1.28xR² = 0.87
0
200
400
600
800
1000
1200
0 200 400 600 800 1000 1200
Max
seaw
ard
forc
e(fr
ontf
ace)
[KN
/m]-
Smoo
thed
Eq. 5.4
1A-1B-1C2A-2B-2CN1-N24A-3A-3B (with air)
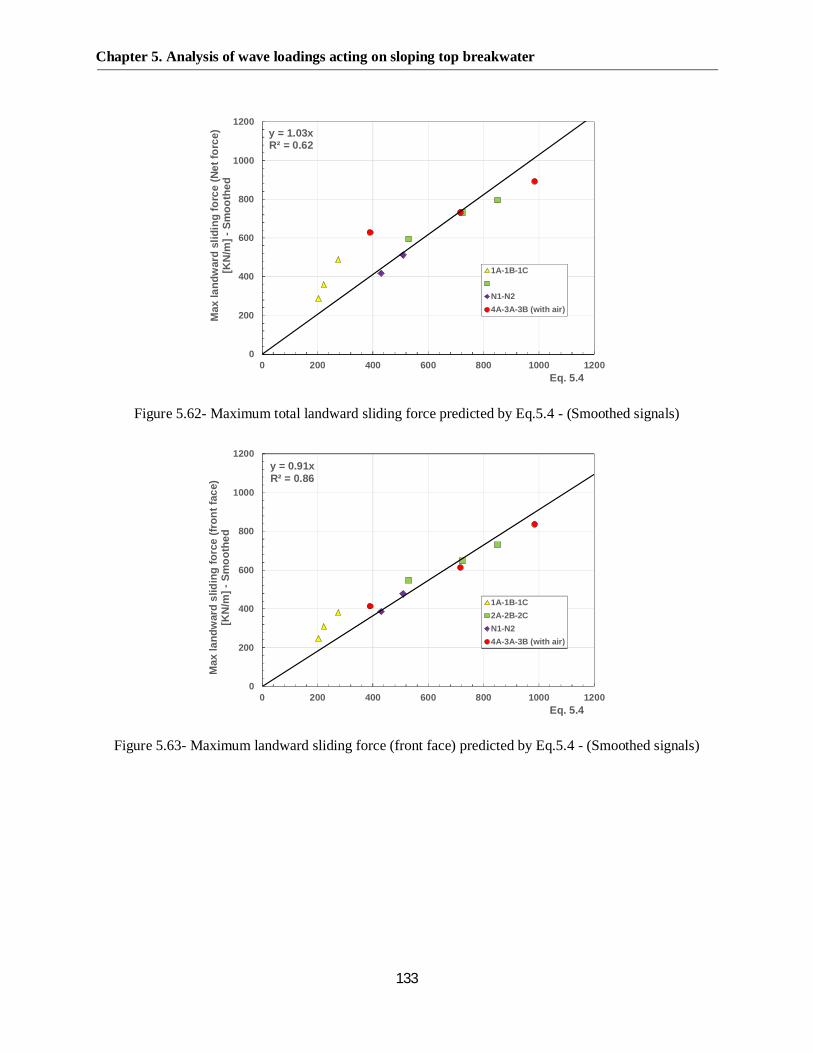
Chapter 5. Analysis of wave loadings acting on sloping top breakwater
133
Figure 5.62- Maximum total landward sliding force predicted by Eq.5.4 - (Smoothed signals)
Figure 5.63- Maximum landward sliding force (front face) predicted by Eq.5.4 - (Smoothed signals)
y = 1.03xR² = 0.62
0
200
400
600
800
1000
1200
0 200 400 600 800 1000 1200
Max
land
war
dsl
idin
gfo
rce
(Net
forc
e)[K
N/m
]-Sm
ooth
ed
Eq. 5.4
1A-1B-1C
N1-N24A-3A-3B (with air)
y = 0.91xR² = 0.86
0
200
400
600
800
1000
1200
0 200 400 600 800 1000 1200
Max
land
war
dsl
idin
gfo
rce
(fron
tfac
e)[K
N/m
]-Sm
ooth
ed
Eq. 5.4
1A-1B-1C2A-2B-2CN1-N24A-3A-3B (with air)

Chapter 5. Analysis of wave loadings acting on sloping top breakwater
134
Figure 5.64- Maximum total seaward sliding force predicted by Eq.5.4 - (Smoothed signals)
Figure 5.65- Maximum seaward sliding force (front face) predicted by Eq.5.4 - (Smoothed signals)
The equations for seaward loads (both horizontal peak and sliding) are of interest, since under
trough phase the force magnitude is expected to depend only slightly on the geometry of the
sloping top breakwater; thus, they could be used to give quick predictions at the preliminary stage
of the design process. On contrary, the equation for crest force must be taken with a certain caution.
y = 1.53xR² = 0.91
0
200
400
600
800
1000
1200
1400
1600
0 200 400 600 800 1000 1200 1400 1600
Max
seaw
ard
slid
ing
forc
e(N
etfo
rce)
[KN
/m]
-Sm
ooth
ed
Eq. 5.4
1A-1B-1C2A-2B-2CN1-N24A-3A-3B (with air)
y = 1.49xR² = 0.91
0
200
400
600
800
1000
1200
1400
1600
0 200 400 600 800 1000 1200 1400 1600
Max
seaw
ard
slid
ing
forc
e(fr
ontf
ace)
[KN
/m]
-Sm
ooth
ed
Eq. 5.4
1A-1B-1C2A-2B-2CN1-N24A-3A-3B (with air)

Chapter 5. Analysis of wave loadings acting on sloping top breakwater
135
One of the most interesting features of the horizontal force signals is shown in Table (5.4), where
it is seen that the average impulse per cycle is negative for all tests; this suggests a certain trend of
the structure to slide seaward rather than landward. The observed behavior is clearly related to the
occurrence of wave overtopping, which from the one side reduces magnitude and duration of the
landward force, and from the other side increases the seaward loadings due to the action of
transmitted waves.
Table 5.4- Average impulse by Net force
TEST CODE Average impulse by net force (KN.s/m)TEST1A -320.06TEST1B -272.55TEST1C -128.243TEST2A -1646.24TEST2B -868.031TEST2C -674.187
TESTSN1 -327.002TESTSN2 -516.216TEST3A -772.043TEST3B -275.131TEST4A -167.27
Figure 5.66- Variation of average net impulse per cycle as a function of Eq.5.4
y = 0.107x1.38
R² = 0.88
y = 0.015x1.54
R² = 0.86
0
200
400
600
800
1000
1200
1400
1600
1800
0 200 400 600 800 1000 1200
Aver
age
impu
lse
perc
ycle
[KN
.s/m
]Ab
solu
teva
lues
Eq. 5.4
1A-1B-1C2A-2B-2CN1-N24A-3A-3B (with air)

Chapter 5. Analysis of wave loadings acting on sloping top breakwater
136
Equation (5.4) also was found as an appropriate criterion to evaluate average impulse per cycle
calculated trough net force (Fig. 5.66). Test 2A has the greatest and test 1C has the smallest
average impulse. This implies highest and lowest asymmetrical wave loading on the structure
respectively. It is in compliance with the mean wave overtopping discharge for each test as well.
It is seen that average impulse increases as LTP increases. This trend is observed for both wave
without and with air entrainment, however, waves with air contribution have less asymmetrical
behavior for the same LTP value.
5.4 Analysis of horizontal forces associated with rear face of the structure
This section presents a detailed description of seaward impulse loads on the sloping top
breakwater caused by wave overtopping. Attention is focused on mechanisms that may
cause such loads, and consideration given to implications for the design of sloping top
breakwaters. Although some reports of the seaward failure of prototype structures,
apparently resulting from overtopping, have been also found, a review of the literature
shows that there have been extremely limited studies dealing with this problem.
As described by Walkden et al. (2001), heavy overtopping of a breakwater with a low crest can
lead to a significant impact of water from the wave onto water behind the breakwater. Thus,
although this is not a direct impact on the breakwater, it is much more confined. Authors measured
pressures on the landward side of a model caisson breakwater during wave overtopping events.
They also found transient pressure pulses acting on the back wall of the caisson which were
probably generated by the impact of the overtopping water mass on the calm water behind the
breakwater. The falling water was shown to have trapped a large air pocket just above the water
closest to the breakwater. Initially, the theoretical pressure impulse model was evaluated with the
pressure in the air pocket equal to atmospheric pressure. However, experimental pressure
measurements close to the free surface indicated a much higher impulse. Satisfying agreement
between theory and experiment was obtained when the pressure impulse at the air pocket water
interface was set equal to 80% of that attributed to the falling water. Figure (5.67) shows a
schematic a seawards directed impact caused by excessive wave overtopping, which result in
caisson's tilt seaward.

Chapter 5. Analysis of wave loadings acting on sloping top breakwater
137
Figure 5.67- Failure due to excessive overtopping via seaward tilt
5.4.1 Breaker-Type classification
Measurements of impact pressures and forces together with simultaneous video records of the
wave motion at the back side of the caisson revealed some significant aspects of wave loading
caused by the transmitted wave. Besides pulsating load created by wave transmission at the rear
side of the structure, Impulsive pressures generation associated with various wave loading
mechanisms were discovered.
Figure 5.68- Breaker classification (Oumeraci et.al.1993).
(a) (b)
(c) (d)

Chapter 5. Analysis of wave loadings acting on sloping top breakwater
138
Before describing such interesting observations, it is worth to review the pressures distributions
associated with impacts categorized in terms of breaker conditions. Oumeraci et al. (1993) made
systematic analyses of the impact pressure histories, together with the corresponding high-speed
video pictures of breaking wave shapes in front of a vertical breakwater. As a result, the wave
impact pressure characteristics are divided into the four principal categories in relation to the
following breaker shapes (Fig.5.68); turbulent bore, well-developed plunging breakers, plunging
breakers and upward deflected breakers (similar to flip-through) .
Loading Case 1: Turbulent Bore
An example of a force time history of turbulent bore breaker type is shown in Figure (5.69 a). In
this type, the wave breaks before reaching the structure. Typically, this loading case not only
exhibits much smaller impact pressures but also the lowest total forces when compared to the other
loading cases. This is obvious since the waves break far away from the wall and most energy is
dissipated before reaching the wall.
Loading Case 2: Well-Developed Plunging Breaker with Large Air pocket
The most striking feature, in this case, is the occurrence of two distinct pressure distributions: the
first one develops at higher elevations and exhibits very high impact pressures with shorter
durations and smaller impact areas, whereas the second one, which develops immediately under
the first impact zone, acts on a larger area and depicts smaller impact pressures with longer
durations. These different distributions correspond to the hammer shock that is induced by the
impinging breaker tongue and to the compression shock as a result of the compressed large air
pocket, respectively (Lundgren 1969). These clearly appear in the force traces as two distinct peaks
(Fig 5.69b).
Loading Case 3: Plunging Breaker with Small Air pocket
The force history is generally characterized by a very sharp single peak followed by a longer-
lasting quasi-static force (Fig. 5.69c) superimposed by oscillations with much higher frequencies
and smaller amplitudes when compared to those observed in loading case 2 i.e. Well-Developed
Plunging Breaker. The characteristics of these force oscillations indicate the nature and the size of
the entrapped air. The higher the frequency of these oscillations, the smaller the air cushion.

Chapter 5. Analysis of wave loadings acting on sloping top breakwater
139
Loading Case 4: Upward Deflected (flip-through) Breaker
The characteristics of the pressure distributions are almost the same as for loading case 3, with the
exception that loading case 4 does not display any sharp force peak and any high impact pressure.
These relatively low loads result from the incomplete breaking, due to the presence of the wall.
Actually, breaker type represents a transition between loading case 3 and a standing wave loading
situation. This transition is also indicated by the occurrence of two asymmetric humps in the force
history (Fig. 5.69 d). It is known that with increasing wave steepness, the pressures under standing
waves begin to display symmetric double humps, due to the higher harmonics of the standing
waves (Miche 1944; Bouyssou and Doublet 1957; Chabert D'Hieres 1960; Goda 1967). The fact
that the double humps become asymmetric and that the first hump becomes larger than the second
one indicates that a transition from a standing-wave situation to breaking waves is taking place.
Figure 5.69- Temporal and Spatial Pressure Distribution for Breaker Types in Fig. 5.68(Oumeraci et.al.1993).
5.4.2 Identification of Impulsive seaward loads mechanism
This section addresses some of the most significant aspects of wave overtopping. The main
characteristics of horizontal wave loading that occur during and particularly just after the plunge
of the wave into the harbor are presented. The combined analysis of video camera recordings and
pressure records made it possible to identify the main mechanism producing impulsive pressure at
the wall. Analyzing around 300 video frames of overtopping process at back side of the breakwater
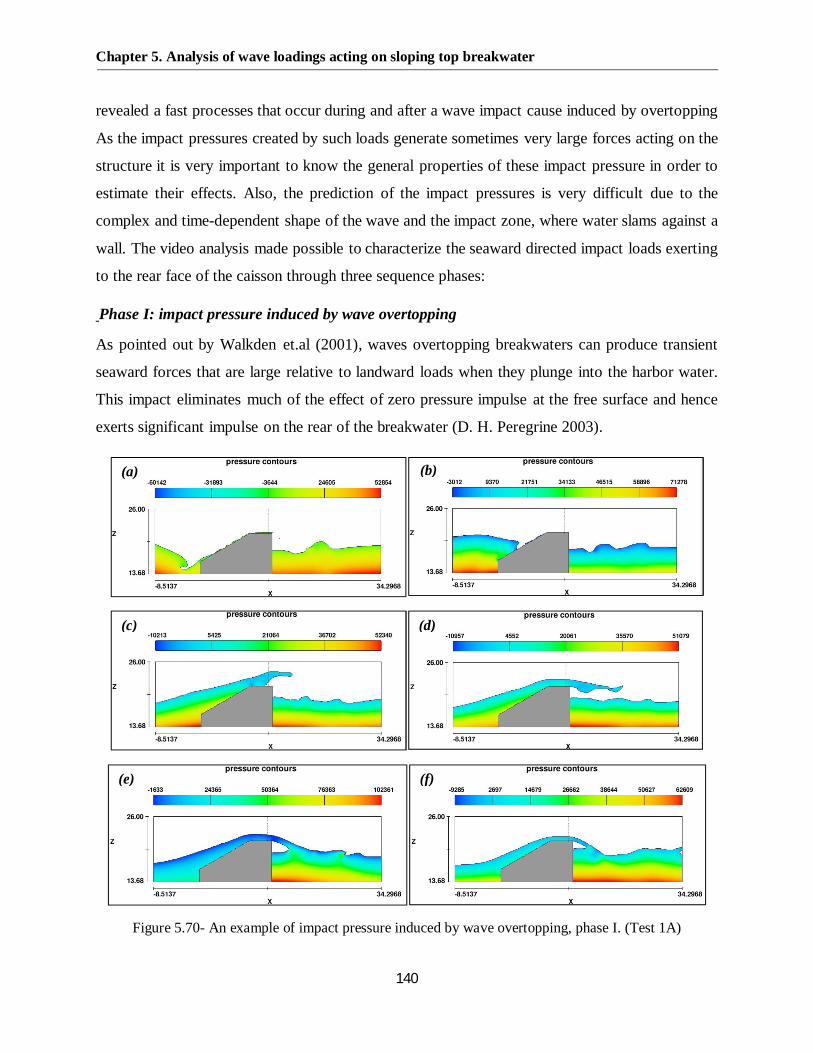
Chapter 5. Analysis of wave loadings acting on sloping top breakwater
140
revealed a fast processes that occur during and after a wave impact cause induced by overtopping
As the impact pressures created by such loads generate sometimes very large forces acting on the
structure it is very important to know the general properties of these impact pressure in order to
estimate their effects. Also, the prediction of the impact pressures is very difficult due to the
complex and time-dependent shape of the wave and the impact zone, where water slams against a
wall. The video analysis made possible to characterize the seaward directed impact loads exerting
to the rear face of the caisson through three sequence phases:
Phase I: impact pressure induced by wave overtopping
As pointed out by Walkden et.al (2001), waves overtopping breakwaters can produce transient
seaward forces that are large relative to landward loads when they plunge into the harbor water.
This impact eliminates much of the effect of zero pressure impulse at the free surface and hence
exerts significant impulse on the rear of the breakwater (D. H. Peregrine 2003).
Figure 5.70- An example of impact pressure induced by wave overtopping, phase I. (Test 1A)
(a) (b)
(c) (d)
(e) (f)

Chapter 5. Analysis of wave loadings acting on sloping top breakwater
141
An example of a sequence of video frames grabbed from numerical simulation of test 1A during
wave overtopping is shown in Figure (5.70). The latter doesn’t include the effect of air entrainment.
The first photograph (frame a) shows the jet of the wave curling over the free surface and hitting
the wall as a broken wave. The latter begins to pass over the superstructure (frame c) and the crest
plunges and collapse into the harbor producing a significant seaward horizontal force (frame d and
e). Finlay Increase in water level at the rear face whilst water drains seaward off the superstructure
and away from the caisson causing a seaward force is shown (frame f).
Phase II: impact pressure induced by upward deflected (flip-through) breaker
Overtopping impact onto still water level triggers a wave toward the wall and slams to the back
face of the structure as an upward deflected breaker.
Figure 5.71- An example of impact pressure induced by upward deflected, phase II. (Test 1A)
S2
S2
(a) (b)
(c) (d)
(e) (f)
Chapter 5. Analysis of wave loadings acting on sloping top breakwater
142
The remarkable feature of a flip-through condition, compared with other breaker types, is that a
high-speed vertical jet and very violent pressures occur without any actual impact on the wall but
with a smooth irrotational flow. Figure (5.71) which is referred to the test 1A, presents such a
loading in sequence stages. Frame (b) shows the plunging plume of overtopping waves into the
harbor basin creating impulsive load. As seen in frames (c), (d) and (e) the wave front does not
become vertical and an upward moving jet is formed at contracting region of the wave surface.
The upward velocity of the wave surface is accelerated rapidly around the contracting region and
becomes larger than the forward velocity of the wave surface. Frame (f) shows the impact instant,
indicted in the frame (e), from a closer view. The maximum pressure induced by upward deflected
breaks was recorded by pressure transducer S2, which is the same order of magnitude of the
incident significant wave height.
Phase III: impact pressure induced by successive plunging waves
Figure (5.72) illustrates the development of a plunging jet at the rear of the breakwater for test 3A.
The latter takes into account the effect of air. During the plunge of overtopping jet, a momentum
flux associated with falling plume is transferred into the still water creating high turbulent
condition (frame b). In most of the cases, and under such a situation, two of three seaward directed
waves are successively formed. Initial waves break onto water (frame d) whereas last produced
wave is sometimes well-developed while it has reached to wall is and is able to apply a violent
impact to the wall as a plunging jet (frame f). However, in some cases waves lose their energy
during consecutive breaking and are not capable to exert significant impact. As it is seen in frame
f, at the instant of impact, a large amount of air will be trapped between the wave and the wall.
The pressure signal associated with transducer S3 where the plunging breaker collides with the
wall has been also presented.
The maximum pressure measured is 1.2 times the incident significant wave height, which is far
less than what achieved on vertical breakwaters, where values exceeding ten have been reported
(Goda, 1995). In the following sections, a detailed description of wave loading features
corresponding to each phase are presented.
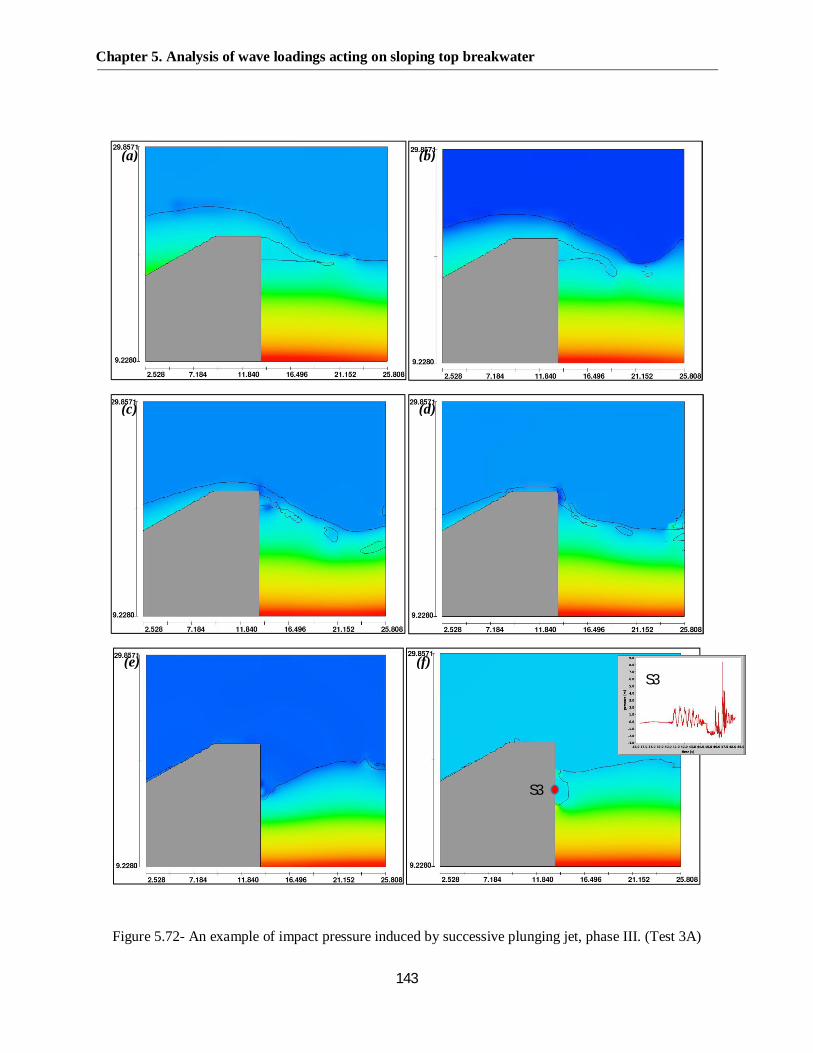
Chapter 5. Analysis of wave loadings acting on sloping top breakwater
143
Figure 5.72- An example of impact pressure induced by successive plunging jet, phase III. (Test 3A)
S3
S3
(a) (b)
(c) (d)
(e) (f)

Chapter 5. Analysis of wave loadings acting on sloping top breakwater
144
5.4.3 Impact pressure induced by wave overtopping and upward deflected
Figure (5.73) illustrates shows the time histories of the horizontal wave force exerted on rear (panel
a) and front face (panel b) and resultant net force (panel c) during the overtopping of Figure (5.70)
The selected interval time shows an intensive seaward directed impact at the instant of collision of
overtopping jet to water surface. While the back wall of the structure experiences such a loading,
the front face signal located a short distance below the mean wave level, applies a slight pulsating
load in seaward direction. So, the structure is imposed by a high impulsive and a low non-impulsive
load simultaneously characterized by net force (Fig 5.73 c).
Figure 5.73- Time history of force during event shown in Fig. 5.70
Figure (5.74) presents the time history of the wave impact along with captured frames
corresponding to peaks pointed by arrows. The violent impact of the overtopping jet onto the water
behind the structure generates large accelerations and inertia forces that are compensated by a
system of impulsive pressures at the wall. The impact, which leads to maximum pressures of the
(a) (b)
(c)
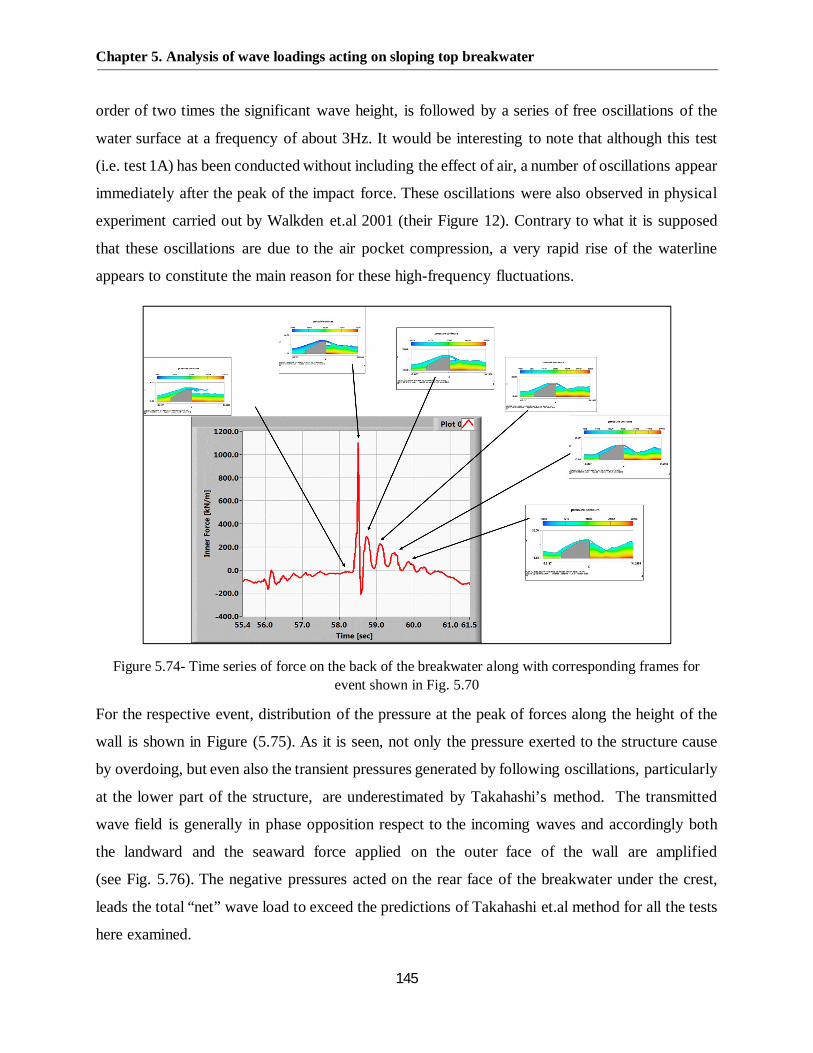
Chapter 5. Analysis of wave loadings acting on sloping top breakwater
145
order of two times the significant wave height, is followed by a series of free oscillations of the
water surface at a frequency of about 3Hz. It would be interesting to note that although this test
(i.e. test 1A) has been conducted without including the effect of air, a number of oscillations appear
immediately after the peak of the impact force. These oscillations were also observed in physical
experiment carried out by Walkden et.al 2001 (their Figure 12). Contrary to what it is supposed
that these oscillations are due to the air pocket compression, a very rapid rise of the waterline
appears to constitute the main reason for these high-frequency fluctuations.
Figure 5.74- Time series of force on the back of the breakwater along with corresponding frames forevent shown in Fig. 5.70
For the respective event, distribution of the pressure at the peak of forces along the height of the
wall is shown in Figure (5.75). As it is seen, not only the pressure exerted to the structure cause
by overdoing, but even also the transient pressures generated by following oscillations, particularly
at the lower part of the structure, are underestimated by Takahashi’s method. The transmitted
wave field is generally in phase opposition respect to the incoming waves and accordingly both
the landward and the seaward force applied on the outer face of the wall are amplified
(see Fig. 5.76). The negative pressures acted on the rear face of the breakwater under the crest,
leads the total “net” wave load to exceed the predictions of Takahashi et.al method for all the tests
here examined.

Chapter 5. Analysis of wave loadings acting on sloping top breakwater
146
Figure 5.75- Time series of force on the back of the breakwater along with distribution of pressures forevent shown in Fig. 5.70
Figure 5.76- Seaward directed loads induced by front wave trough and rear impulsive load
It is useful to highlight that in some cases the impulsive peak of maximum force induced by flip
through was the prominent feature of wave loading time history. Figure (5.77) illustrates two
consecutive moments, captured form test 1A, in which the maximum upward deflected force

Chapter 5. Analysis of wave loadings acting on sloping top breakwater
147
exerted on the wall in 25 % greater than the force generated by wave overtopping. It is seen that
the maximum seaward net force occurs when the rear force signal peaks. In addition, the finding
of Hull and Müller (2002) for which the impact point for a flip-through event occurs above SWL
is verified.
Figure 5.77- Time series of force on the back of the breakwater along with corresponding frames,pressure distribution and pressure impulse at the peak of force for event shown in Fig. 5.71
Another example of impulsive loading induced by overtopping jet is shown in Figure (5.78) this
event occurred during simulation of test 4A which does include air entrainment. Because of the
presence of the air bubbles, the signal is highly oscillatory compared to the tests which don’t

Chapter 5. Analysis of wave loadings acting on sloping top breakwater
148
consider this effect. It is seen that same as test 1A, the main impact is followed by high-frequency
fluctuations due to fast-rising of water level just after hitting overtopping jet to the free surface.
Hence, as it was already mentioned, the respective oscillations probably cannot be interpreted due
to compression of air entrapment.
Figure 5.78- Time series of force on the back of the breakwater along with corresponding frames –Test 4A
Pressure distributions at the time of force peaks associated with main impact and following
oscillations are indicated in Figure (5.79) For all impacts, the maximum pressure at peak of forces
were observed below the still water level (recorded by transducer S3). While the most violent
impact, induced by overtopping jet occurs, the suction force caused by wave trough is exerted on
the front face of the structure. Hence, although seaward directed impacts are becoming less
intensive after main impulsive force, on the other hand, the seaward thrust due to wave trough
grows. Under such a situation, simultaneously, structure experiences two seaward directed loads
which their sum exceeds Takahashi et.al (1994) prediction.

Chapter 5. Analysis of wave loadings acting on sloping top breakwater
149
Figure 5.79- Time series of force on the back of the breakwater along with distribution of pressures –Test 4A
Comparison with Walkden et.al 2001
In section (3.4.3) the experimental study conducted by Walkden et.al (2001) was reviewed. The
authors derived a theoretical relationship to calculate pressure impulse on the back face of the
caisson due to the impact of the overtopping plume on the still water. The theory was based on
solving a boundary value problem whit some assumption to take the effect of the air into account.
In this section, results obtained from numerical simulation are compared to the prediction method
given in Equation (3.11) In order to calculate the pressure impulse on the wall, dimensions
indicated in Figure (5.80) were measured for all test even by the event. Table (5.5) shows the
maximum, minimum and average of respective parameters for all tests. The average values of each
parameter (i.e. aavg, bavg and davg) were plotted against wave reflection coefficient as shown in
Figures (5.81) to (5.83). A very good agreement was observed for the length of air pocket as a
function of KR however, for aavg and bavg a satisfying prediction were obtained.

Chapter 5. Analysis of wave loadings acting on sloping top breakwater
150
Figure 5.80- Overtopping parameters used for theoretical model
Table 5.5- Max, min and average of overtopping parameters shown in Fig.5.80
TESTCODE
a (m) b (m) d (m)MAX MIN AVG MAX MIN AVG MAX MIN AVG
TEST1A 4.97 1.89 2.65 2.33 0.82 1.51 4.02 1.38 2.79TEST1B 2.70 1.31 1.77 1.78 0.98 1.27 3.59 1.22 2.30TEST1C 2.08 0.80 1.37 1.38 0.71 1.05 3.12 1.33 2.10TEST2A 4.32 1.38 2.47 3.74 0.98 1.81 4.29 1.69 3.11TEST2B 2.64 1.68 2.08 2.15 1.04 1.47 4.08 2.32 3.19TEST2C 2.32 1.30 1.72 1.56 0.83 1.19 3.69 2.06 2.83
TESTSN1 2.90 1.76 2.29 2.54 1.14 1.64 3.51 1.05 2.44TESTSN2 3.03 1.75 2.48 3.19 1.44 1.88 3.59 1.28 2.54TEST3A 3.04 1.00 1.74 3.98 0.91 2.27 5.92 0.74 3.50TEST3B 1.89 0.60 1.17 2.93 0.69 1.12 6.26 0.99 4.19TEST4A 3.08 1.09 2.04 3.79 1.14 1.98 5.64 0.10 2.76
a
b
d

Chapter 5. Analysis of wave loadings acting on sloping top breakwater
151
Figure 5.81- Variation of aavg/Lp vs wave reflection coefficient
Figure 5.82- Variation of bavg/Lp vs wave reflection coefficient
Figure 5.83- Variation of davg/Lp vs wave reflection coefficient
y = -0.012ln(x) + 0.01R² = 0.7448
0
0.005
0.01
0.015
0.02
0.025
0.03
0.035
0.04
0.045
0.05
0 0.2 0.4 0.6 0.8
a avg
/Lp
Kr
y = -0.008ln(x) + 0.0091R² = 0.7347
0
0.005
0.01
0.015
0.02
0.025
0.03
0.035
0 0.2 0.4 0.6 0.8
b avg
/Lp
Kr
y = -0.011ln(x) + 0.0189R² = 0.9691
0
0.005
0.01
0.015
0.02
0.025
0.03
0.035
0.04
0.045
0.05
0 0.2 0.4 0.6 0.8
d avg
/Lp
Kr

Chapter 5. Analysis of wave loadings acting on sloping top breakwater
152
The resulting values of pressure impulse (integrated pressures through an impact with respect to
time) from each ten pressure transducers at the rear face of the model are shown in the Figures
(5.84) to (5.94). The corresponding pressure impulse on the wall predicted by Equation (3.11) is
also shown in these figures with a solid line. For each test, the values of maximum, minimum and
average of the root-mean-square error (RMSE) were also determined to estimate the difference
between measured and predicted values (Table 5.6). Corresponding overtopping parameters for
maximum and minimum RMSE also give the table.
Table 5.6- RMSE between measured pressure impulse and theoretical model along with correspondingovertopping parameters
TESTCODE
RMSE (Ns/m2)ρg MAX RMSE MIN RMSEMAX MIN AVG a (m) b (m) d (m) a (m) b (m) d (m)
TEST1A 0.24 0.03 0.13 3.27 1.89 2.14 1.89 1.38 2.51TEST1B 0.17 0.04 0.09 1.61 1.28 2.70 2.09 1.34 1.36TEST1C 0.25 0.05 0.12 1.50 1.17 2.04 1.58 1.33 2.83TEST2A 0.32 0.01 0.06 1.82 1.45 1.69 2.29 1.38 3.00TEST2B 0.12 0.01 0.04 1.76 1.91 2.40 2.16 1.60 3.12TEST2C 0.11 0.01 0.05 1.79 1.19 2.72 2.19 1.56 3.69
TESTSN1 0.19 0.01 0.07 1.93 1.14 1.05 2.28 1.75 3.51TESTSN2 0.31 0.01 0.08 2.63 1.44 1.76 1.99 1.52 3.35TEST3A 0.53 0.01 0.15 1.62 3.98 2.00 1.00 0.91 4.40TEST3B 0.07 0.00 0.03 0.99 1.14 3.68 0.70 1.14 3.38TEST4A 0.24 0.02 0.11 3.08 3.46 0.81 2.23 1.33 3.60
It is observed that the prediction method is not reliable and has high underestimation in many
cases. It is interesting to note that, as reported by Walkden et.al (2001), for their particular
experiments, pressure impulse per unit length of the water surface due to the air pocket could be
as much as 80% of the contribution by the plume impact. Nevertheless, although in the test 1A to
N2 the effect of the air has been neglected, pressure impulse near the still water level does not tend
to zero and even increase till water surface. The latter shows that such a high-pressure impulse
occurring in the air pocket might not have a physical aspect. This uncertainty is also supported by
observing high-frequency oscillations followed by main force impact during the test without air
contributions.

Chapter 5. Analysis of wave loadings acting on sloping top breakwater
153
Figure 5.84- Pressure impulse on the back of the caisson for Test 1A. Left panel: Max RMSE. Rightpanel: Min RMSE
Figure 5.85- Pressure impulse on the back of the caisson for Test 1B. Left panel: Max RMSE. Rightpanel: Min RMSE
Figure 5.86- Pressure impulse on the back of the caisson for Test 1C. Left panel: Max RMSE. Rightpanel: Min RMSE
0
5
10
15
20
25
0 0.1 0.2 0.3 0.4 0.5 0.6
Elev
atio
n[m
]
P [N.s/m2]ρg
TEST 1A (Max RMSE)- Without air
Walkden et.al 2001Measured values
0
5
10
15
20
25
0 0.05 0.1 0.15 0.2
Elev
atio
n[m
]
P [N.s/m2]ρg
TEST 1A (Min RMSE)- Without air
Walkden et.al 2001Measured values
0
5
10
15
20
25
0 0.1 0.2 0.3 0.4 0.5 0.6
Elev
atio
n[m
]
P [N.s/m2]ρg
TEST 1B (Max RMSE)- Without air
Walkden et.al 2001Measured values
0
5
10
15
20
25
0 0.05 0.1 0.15 0.2 0.25 0.3
Elev
atio
n[m
]
P [N.s/m2]ρg
TEST 1B (Min RMSE)- Without air
Walkden et.al 2001Measured values
0
5
10
15
20
25
0 0.1 0.2 0.3 0.4 0.5 0.6
Elev
atio
n[m
]
P [N.s/m2]ρg
TEST 1C (Max RMSE)- Without air
Walkden et.al 2001Measured values
0
5
10
15
20
25
0 0.05 0.1 0.15 0.2 0.25 0.3
Elev
atio
n[m
]
P [N.s/m2]ρg
TEST 1C (Min RMSE)- Without air
Walkden et.al 2001Measured values
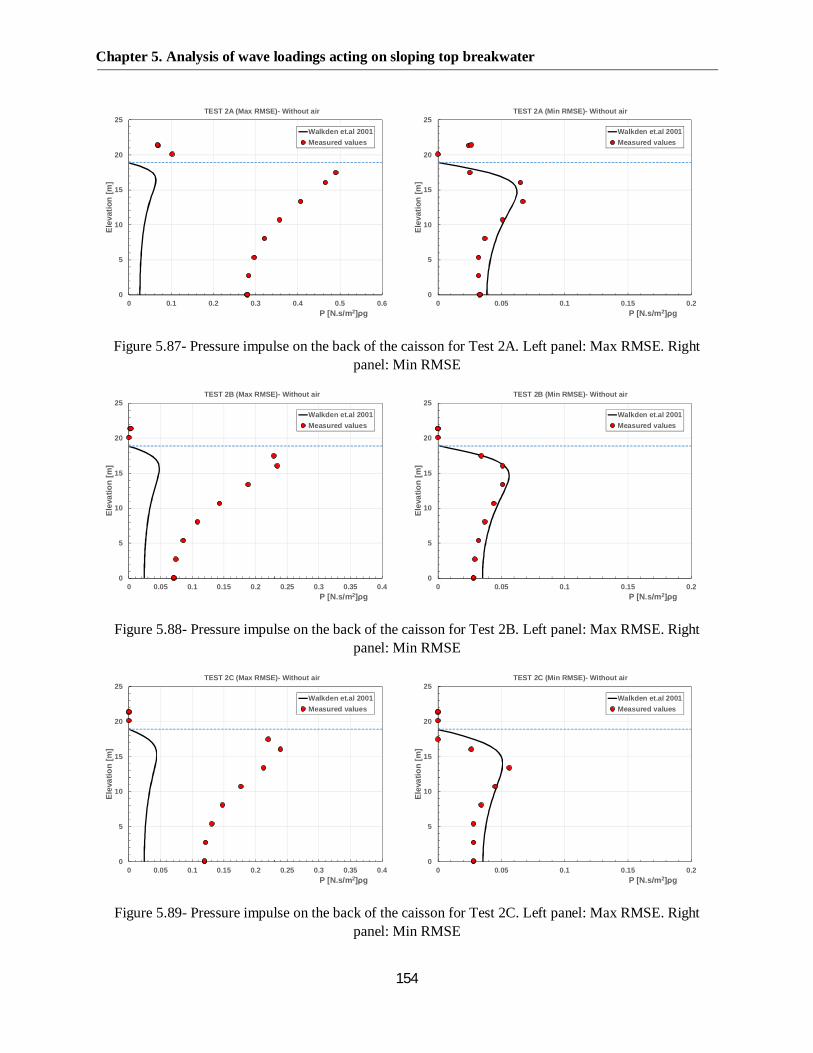
Chapter 5. Analysis of wave loadings acting on sloping top breakwater
154
Figure 5.87- Pressure impulse on the back of the caisson for Test 2A. Left panel: Max RMSE. Rightpanel: Min RMSE
Figure 5.88- Pressure impulse on the back of the caisson for Test 2B. Left panel: Max RMSE. Rightpanel: Min RMSE
Figure 5.89- Pressure impulse on the back of the caisson for Test 2C. Left panel: Max RMSE. Rightpanel: Min RMSE
0
5
10
15
20
25
0 0.1 0.2 0.3 0.4 0.5 0.6
Elev
atio
n[m
]
P [N.s/m2]ρg
TEST 2A (Max RMSE)- Without air
Walkden et.al 2001Measured values
0
5
10
15
20
25
0 0.05 0.1 0.15 0.2
Elev
atio
n[m
]
P [N.s/m2]ρg
TEST 2A (Min RMSE)- Without air
Walkden et.al 2001Measured values
0
5
10
15
20
25
0 0.05 0.1 0.15 0.2 0.25 0.3 0.35 0.4
Elev
atio
n[m
]
P [N.s/m2]ρg
TEST 2B (Max RMSE)- Without air
Walkden et.al 2001Measured values
0
5
10
15
20
25
0 0.05 0.1 0.15 0.2
Elev
atio
n[m
]
P [N.s/m2]ρg
TEST 2B (Min RMSE)- Without air
Walkden et.al 2001Measured values
0
5
10
15
20
25
0 0.05 0.1 0.15 0.2 0.25 0.3 0.35 0.4
Elev
atio
n[m
]
P [N.s/m2]ρg
TEST 2C (Max RMSE)- Without air
Walkden et.al 2001Measured values
0
5
10
15
20
25
0 0.05 0.1 0.15 0.2
Elev
atio
n[m
]
P [N.s/m2]ρg
TEST 2C (Min RMSE)- Without air
Walkden et.al 2001Measured values
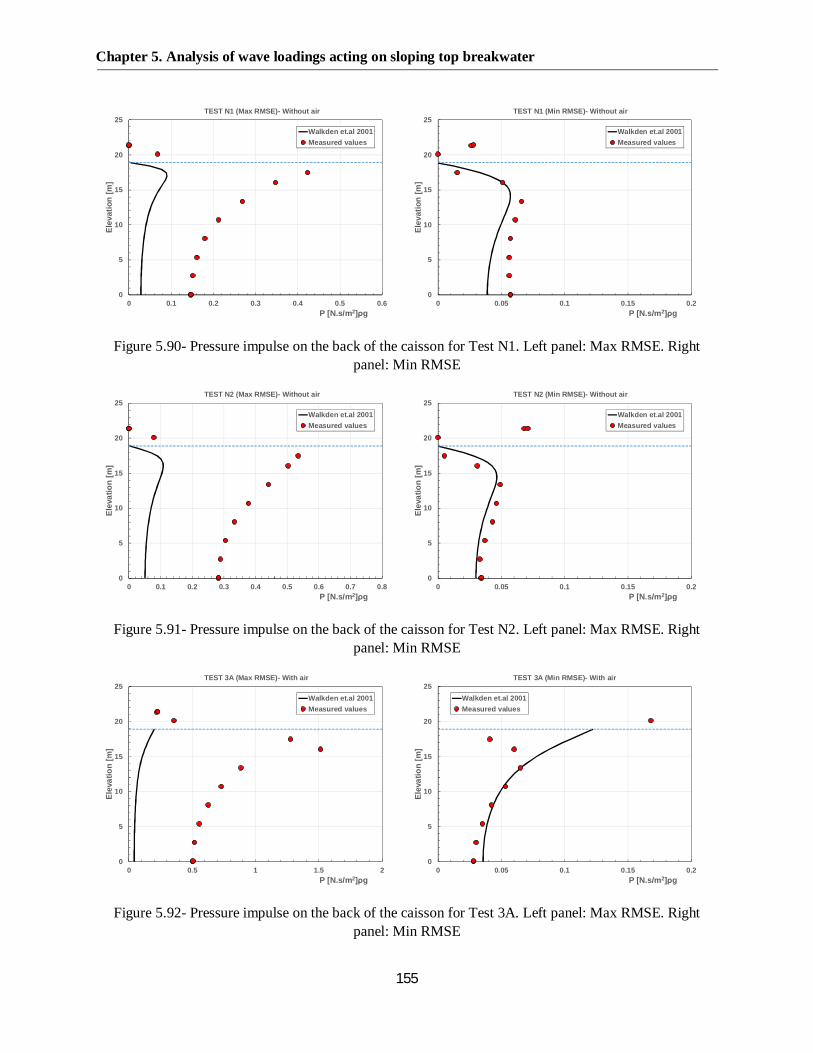
Chapter 5. Analysis of wave loadings acting on sloping top breakwater
155
Figure 5.90- Pressure impulse on the back of the caisson for Test N1. Left panel: Max RMSE. Rightpanel: Min RMSE
Figure 5.91- Pressure impulse on the back of the caisson for Test N2. Left panel: Max RMSE. Rightpanel: Min RMSE
Figure 5.92- Pressure impulse on the back of the caisson for Test 3A. Left panel: Max RMSE. Rightpanel: Min RMSE
0
5
10
15
20
25
0 0.1 0.2 0.3 0.4 0.5 0.6
Elev
atio
n[m
]
P [N.s/m2]ρg
TEST N1 (Max RMSE)- Without air
Walkden et.al 2001Measured values
0
5
10
15
20
25
0 0.05 0.1 0.15 0.2
Elev
atio
n[m
]
P [N.s/m2]ρg
TEST N1 (Min RMSE)- Without air
Walkden et.al 2001Measured values
0
5
10
15
20
25
0 0.1 0.2 0.3 0.4 0.5 0.6 0.7 0.8
Elev
atio
n[m
]
P [N.s/m2]ρg
TEST N2 (Max RMSE)- Without air
Walkden et.al 2001Measured values
0
5
10
15
20
25
0 0.05 0.1 0.15 0.2
Elev
atio
n[m
]
P [N.s/m2]ρg
TEST N2 (Min RMSE)- Without air
Walkden et.al 2001Measured values
0
5
10
15
20
25
0 0.5 1 1.5 2
Elev
atio
n[m
]
P [N.s/m2]ρg
TEST 3A (Max RMSE)- With air
Walkden et.al 2001Measured values
0
5
10
15
20
25
0 0.05 0.1 0.15 0.2
Elev
atio
n[m
]
P [N.s/m2]ρg
TEST 3A (Min RMSE)- With air
Walkden et.al 2001Measured values

Chapter 5. Analysis of wave loadings acting on sloping top breakwater
156
Figure 5.93- Pressure impulse on the back of the caisson for Test 3B. Left panel: Max RMSE. Rightpanel: Min RMSE
Figure 5.94- Pressure impulse on the back of the caisson for Test 4A. Left panel: Max RMSE. Rightpanel: Min RMSE
5.4.4 Impact pressure induced by generated plunging wave
The development of the plunging breaker as the third phase of wave loading was observed for all
tests. However, for shorter waves, created plunging waves were mostly broken on still water level
whereas longer waves directly collided on the wall in most of the time. Figure (5.95) shows the
chronogram of wave force signal (Test 2A) along with the development plunging waves
corresponding to each peak pointed by arrows. The distribution of pressure and pressure impulse
for associated with the main impact are also presented. Expectedly, the distribution of pressure at
peak of the force is consistent with conventional vertical breakwater. The maximum impulsive
pressure, recorded by pressure transducer S3, is only 1.16 times greater than significant incident
0
5
10
15
20
25
0 0.05 0.1 0.15 0.2 0.25 0.3
Elev
atio
n[m
]
P [N.s/m2]ρg
TEST 3B (Max RMSE)- With air
Walkden et.al 2001Measured values
0
5
10
15
20
25
0 0.05 0.1 0.15 0.2
Elev
atio
n[m
]
P [N.s/m2]ρg
TEST 3B (Min RMSE)- With air
Walkden et.al 2001Measured values
0
5
10
15
20
25
0 0.1 0.2 0.3 0.4 0.5 0.6 0.7 0.8
Elev
atio
n[m
]
P [N.s/m2]ρg
TEST 4A (Max RMSE)- With air
Walkden et.al 2001Measured values
0
5
10
15
20
25
0 0.05 0.1 0.15 0.2 0.25 0.3 0.35 0.4
Elev
atio
n[m
]
P [N.s/m2]ρg
TEST 4A (Min RMSE)- With air
Walkden et.al 2001Measured values
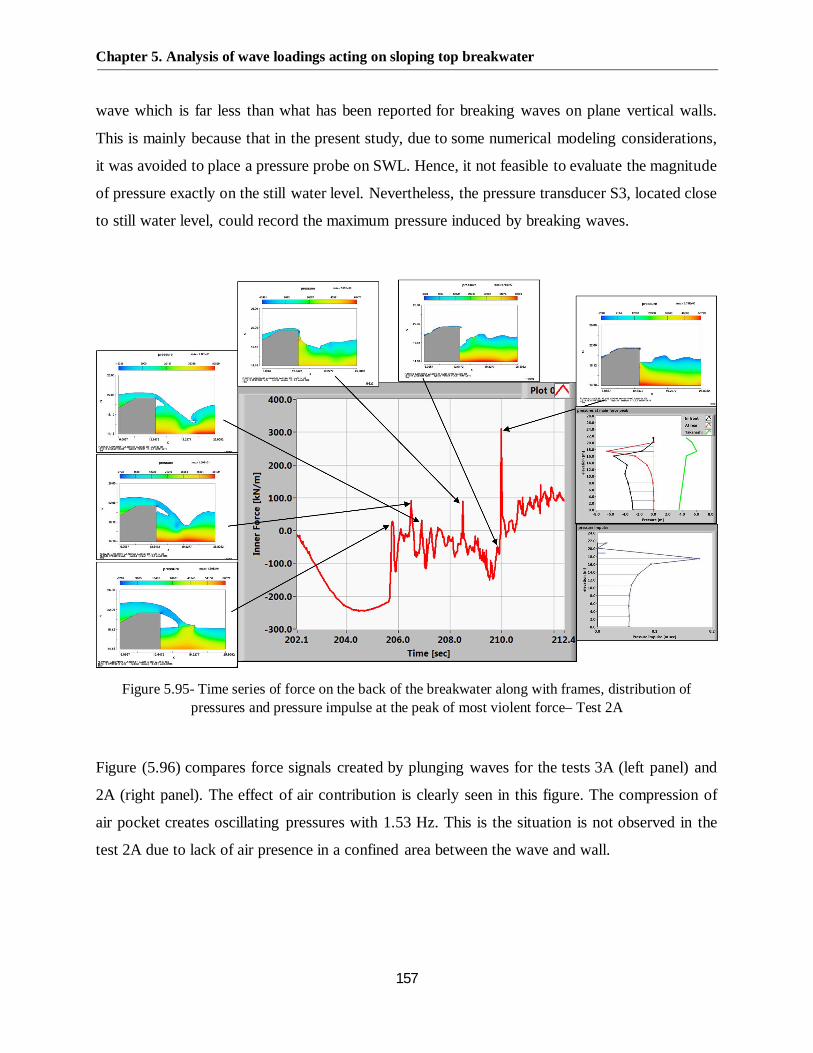
Chapter 5. Analysis of wave loadings acting on sloping top breakwater
157
wave which is far less than what has been reported for breaking waves on plane vertical walls.
This is mainly because that in the present study, due to some numerical modeling considerations,
it was avoided to place a pressure probe on SWL. Hence, it not feasible to evaluate the magnitude
of pressure exactly on the still water level. Nevertheless, the pressure transducer S3, located close
to still water level, could record the maximum pressure induced by breaking waves.
Figure 5.95- Time series of force on the back of the breakwater along with frames, distribution ofpressures and pressure impulse at the peak of most violent force– Test 2A
Figure (5.96) compares force signals created by plunging waves for the tests 3A (left panel) and
2A (right panel). The effect of air contribution is clearly seen in this figure. The compression of
air pocket creates oscillating pressures with 1.53 Hz. This is the situation is not observed in the
test 2A due to lack of air presence in a confined area between the wave and wall.
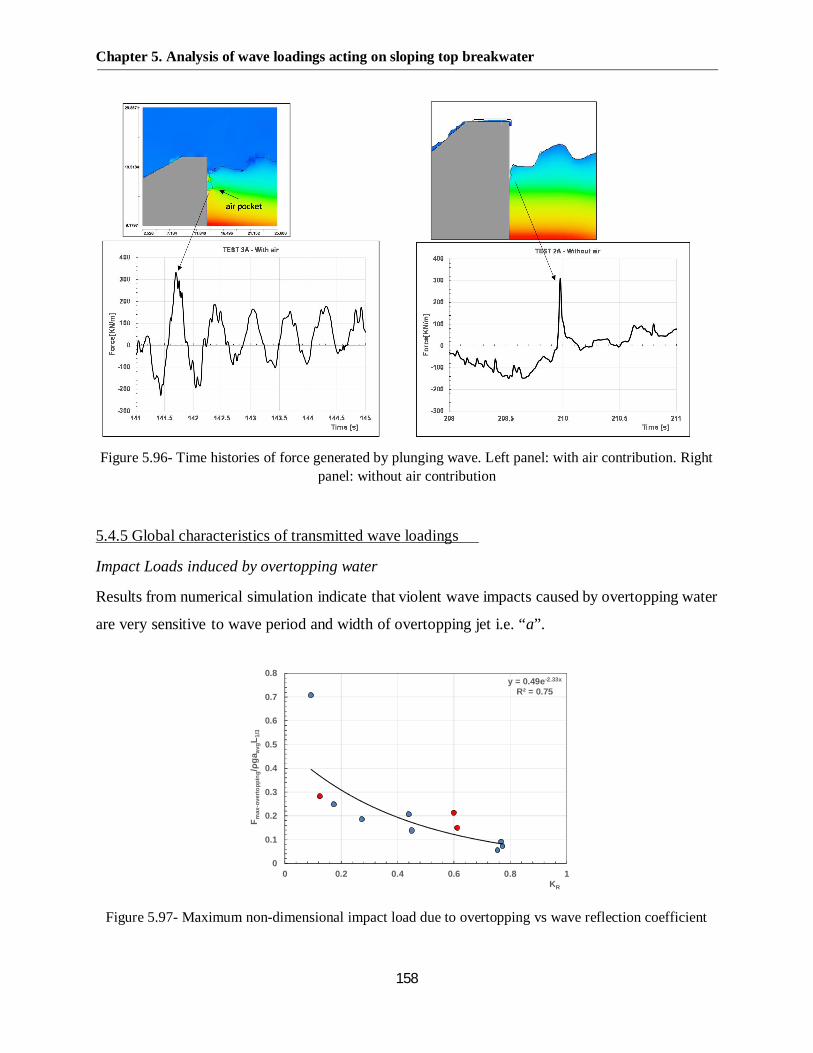
Chapter 5. Analysis of wave loadings acting on sloping top breakwater
158
Figure 5.96- Time histories of force generated by plunging wave. Left panel: with air contribution. Rightpanel: without air contribution
5.4.5 Global characteristics of transmitted wave loadings
Impact Loads induced by overtopping water
Results from numerical simulation indicate that violent wave impacts caused by overtopping water
are very sensitive to wave period and width of overtopping jet i.e. “a”.
Figure 5.97- Maximum non-dimensional impact load due to overtopping vs wave reflection coefficient
y = 0.49e-2.33x
R² = 0.75
0
0.1
0.2
0.3
0.4
0.5
0.6
0.7
0.8
0 0.2 0.4 0.6 0.8 1
F max
-ove
rtop
ping
/ρga
avgL
1/3
KR

Chapter 5. Analysis of wave loadings acting on sloping top breakwater
159
Hence, the peak of forces created on the back of the caisson was non-dimensionalized by average
of the width of overtopping jet “aavg” and L1/3 which is corresponding to significant wave length.
Figures (5.97) and (5.98) respectively represent the non-dimensional maximum and average force
induced by overtopping jet as a function of wave reflection coefficient. It is seen that load exerted
due to overtopping plume is decrease when wave reflection increase. Apart from one out layer
point in Figure (5.97), a very good exponential trend is observed for both maximum and average
load. Another interesting feature is examination of minimum safety factor against seaward load
under such a wave loading. Figure (5.99) shows minimum safety factor decreases considerably by
increasing wave steepness. It can be seen that only the tests 1A, 1B, 1C and 4A possessing smallest
values of steepness, are placed in unsafe condition.
Figure 5.98- Average non-dimensional impact load due to overtopping vs wave reflection coefficient
Figure 5.99- Minimum safety factor against impact load due to overtopping vs wave steepness
y = 0.2e-2.09x
R² = 0.87
0
0.04
0.08
0.12
0.16
0.2
0 0.2 0.4 0.6 0.8 1
F avg
-ove
rtop
ping
/ρga
avgL
1/3
KR
y = 0.004x-1.9
R² = 0.8
0
1
2
3
4
5
6
0 0.02 0.04 0.06 0.08 0.1
Taka
hash
ifor
ce/O
vert
oppi
ngpl
ume
load
H1/3/L1/3
SAFE
UNSAFE

Chapter 5. Analysis of wave loadings acting on sloping top breakwater
160
Impact Loads induced by upward deflected breaker
In order to estimate impact load due to the upward deflected breaker, several geometry parameters
of overtopping were evaluated. It was found that intensity of forces created by rising in water level
on the back of caisson, is highly correlated with the overflow depth (db) indicated in Figure (5.100).
The values of maximum, minimum and average of overflow depth (db) for each test is tabulated in
Table (5.7).
Figure 5.100- The instant when overflow depth has been measured
Table 5.7- Max, min and average of overflow depth indicated in Fig 5.100
TEST CODEdb (m)
MAX MIN AVGTEST1A 1.5086 0.5657 1.039243TEST1B 1.171 0.4461 0.73267TEST1C 0.7083 0.25 0.429579TEST2A 3.2665 0.6399 1.851103TEST2B 2.5521 0.638 1.499400TEST2C 1.6582 0.4643 0.880916
TESTSN1 1.5758 0.7003 1.152642TESTSN2 2.0737 0.957 1.511887TEST3A 2.9747 0.873 2.233227TEST3B 1.9845 0.5457 1.137793TEST4A 1.7067 0.8534 1.24684
db
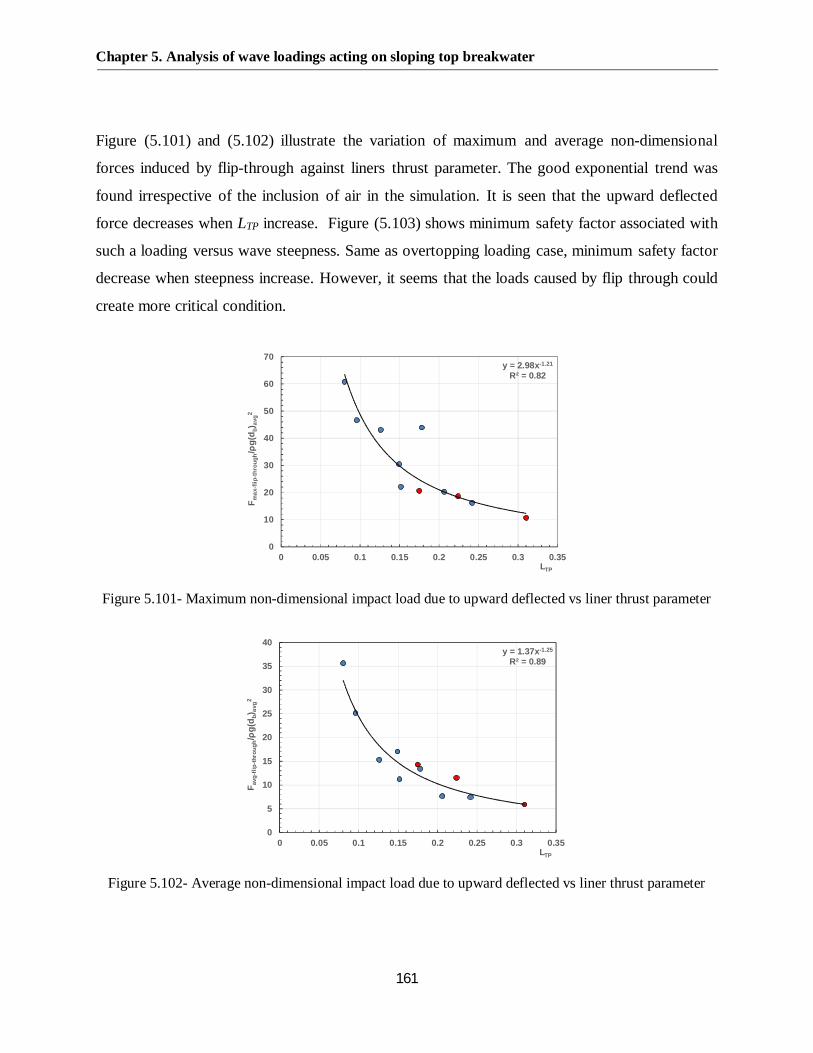
Chapter 5. Analysis of wave loadings acting on sloping top breakwater
161
Figure (5.101) and (5.102) illustrate the variation of maximum and average non-dimensional
forces induced by flip-through against liners thrust parameter. The good exponential trend was
found irrespective of the inclusion of air in the simulation. It is seen that the upward deflected
force decreases when LTP increase. Figure (5.103) shows minimum safety factor associated with
such a loading versus wave steepness. Same as overtopping loading case, minimum safety factor
decrease when steepness increase. However, it seems that the loads caused by flip through could
create more critical condition.
Figure 5.101- Maximum non-dimensional impact load due to upward deflected vs liner thrust parameter
Figure 5.102- Average non-dimensional impact load due to upward deflected vs liner thrust parameter
y = 2.98x-1.21
R² = 0.82
0
10
20
30
40
50
60
70
0 0.05 0.1 0.15 0.2 0.25 0.3 0.35
F max
-flip
-thro
ugh/ρ
g(d b
) avg
2
LTP
y = 1.37x-1.25
R² = 0.89
0
5
10
15
20
25
30
35
40
0 0.05 0.1 0.15 0.2 0.25 0.3 0.35
F avg
-flip
-thro
ugh/ρ
g(d b
) avg
2
LTP

Chapter 5. Analysis of wave loadings acting on sloping top breakwater
162
Figure 5.103- Minimum safety factor against impact load due to upward deflected vs wave steepness
Impact Loads induced by successive plunging jet
Plunging waves, on the back of the caisson, are formed due to the fully disturbed situation created
by transferring momentum flux of overtopping jet to the water surface. In most of the cases first
plunging jet breaks onto the water and second plunging wave is reformed and hits to the wall.
Under such a situation, it will be very difficult to predict the magnitude of force produced by this
type of wave loading. However, as shown in Figure (5.104) and (5.105) the maximum and average
of non-dimensional impact load are fairly well described by relative freeboard. As it is seen, the
presence of the air doesn’t exert an influence on the obtained trend. The ratio between the force
predicted by the Takahashi et.al (1994 and the maximum value of impact load due breaking wave
is shown in Figure (5.106). The points below unity are in unsafe condition. Compared to other
wave loading mechanism which was previously described, Forces produced under this phase are
less critical from an engineering point of view.
0
0.5
1
1.5
2
2.5
3
3.5
4
0.000 0.020 0.040 0.060 0.080 0.100
Taka
hash
ifor
ce/F
lip-th
roug
hlo
ad
H1/3/L1/3
SAFE
UNSAFE

Chapter 5. Analysis of wave loadings acting on sloping top breakwater
163
Figure 5.104- Maximum non-dimensional impact load due to plunging wave vs relative freeboard
Figure 5.105- Average non-dimensional impact load due to plunging wave vs relative freeboard
Figure 5.106- Minimum safety factor against impact load due to plunging wave vs wave steepness
0
0.05
0.1
0.15
0.2
0.25
0 0.2 0.4 0.6 0.8 1
F max
-plu
ngin
g/ρ
gh2
Rc/H1/3
0
0.01
0.02
0.03
0.04
0.05
0.06
0.07
0.08
0.09
0 0.2 0.4 0.6 0.8 1
F avg
-plu
ngin
g/ρ
gh2
Rc/H1/3
0
0.5
1
1.5
2
2.5
3
3.5
0 0.02 0.04 0.06 0.08 0.1
Taka
hash
ifor
ce/P
lung
ing
wav
efo
rce
H1/3/L1/3
SAFE
UNSAFE
Chapter 6. Conclusion
164
CHPTER 6
CONCLUSION
In this thesis the structural response of an overtopped sloping top caisson breakwater has been
studied through 11 numerical CFD experiments conducted with Flow-3D. Eight of these tests have
been performed neglecting the presence of air, whereas in three of them it has been accounted for.
The RNG turbulent model used for this thesis has been already satisfactorily validated against
laboratory measurements obtained from a small scale model of SSG (Seawave
Slotcone Generators) originally designed as a possible pilot plant.
The main conclusions of the analysis can be summarized as follows:
6.1 Analyze of the pressures on the front face of the structure
· The superstructure geometry of the tested breakwater critically affect its hydraulic
response and its desired performance, both from a functional and stability/safety points of
view, due to the dominant role played by wave overtopping and hydrodynamic wave
forces.
· Pressure measurements, using trapezoidal method, were integrated over the whole area of
the structure to obtain were wave force.
· Three wave loadings cases associated with broken, impulsive and quasi-static waves were
distinguished.
· The analyses of wave loading acing only on the outer face of the structure (i.e. without
considering the effects of transmitted waves) revealed that wave overtopping give rise to a
reduction of wave force under the crest phase compared to vertical breakwaters. However,
wave load under trough phase remain unaffected and applies large pulsating seaward load.
Both (smoothed) landward and seaward loads in this phase decrees as wave steepness
increase. As a result, the main hydrodynamic loadings are directed seaward rather than
landward.
· The method of Takahashi et al. (1994) for the prediction of the maximum force under the
crest and trough phases seem to under predict experimental data, especially for steep

Chapter 6. Conclusion
165
waves. The respective underestimation was considerably larger in seaward direction
(trough phase) compared to the landward one (crest phase).
· The methods of Goda (1985) and Sainflou (1928) for estimating seaward loads under
trough phase of a non-overtopped structures were compared to the numerical
measurements. Results showed under prediction for both methods however, Sainflou
(1928) formula gave better agreement.
· Analysis of the sliding force calculated through loads on the outer face of the structure
reveal that the both landward and seaward sliding forces decrease as relative water depth
increases. The values of safety factors (Takahashi sliding force/measured sliding force) for
landward load is larger than seaward one implying that the structure tends to slides
seaward.
6.2 Effects of transmitted wave field
· The analysis showed that the transmitted waves field act to increase both the landward and
the seaward forces and that the conventional design methods may be not adequate to
guarantee an appropriate degree of safety to the structure. It is worthy to note that this
amplification in landward direction is greater than seaward-directed loads.
· The wave overtopping causes a reduction of wave force under the crest phase (compared
to a non-overtopped structure) and generates supplementary actions on the rear wall via
transmission. As a result, the main hydrodynamic loadings are directed seaward rather than
landward.
· The maximum pressures measured whether in front or at rear of the structure are of the
order of 2 times the incident significant wave height; as expected, the presence of air reduce
the magnitude of loadings, halving the pressures induced by breaking waves.
· Analysis of net sliding force (i.e. taking the effect transmitted waves into the account)
showed that for the longer periods the structure would tend to slide seaward rather than
landward. This is consistent with the report of Minikin (1950), who described the seaward
collapse of Mustapha breakwater (Algeria; 1934) after a violent storm where its top was
massively overpassed.
· A predictive formula was given for either the maximum landward horizontal force or the
maximum seaward one or the corresponding peaks of the sliding force S. Also, an empirical

Chapter 6. Conclusion
166
formula to estimate wave reflection coefficient was derived using combination of
Takahashi (1994) and numerical simulation data.
6.3 Analyze of the pressures on the rear face of the structure
· The present study confirmed the previous finding by Walkden et al. (2001), which noticed
the existence of strong impulsive loadings on the inner face of the wall, due to violent
overtopping events. However, the method proposed by the authors to predict the pressure
impulse associated with such events has been found to under predict experimental data,
regardless of the presence of air in the simulation.
· Three consecutive impulsive seaward load mechanisms were identified:
1. Pressure impulse generated by the re-entry of the overtopping plume (consistent with
Walkden observation);
2. Impulsive load caused by upward deflected; and
3. Impact force due to successive plunging breaker.
· The method of Takahashi et al. (1994) expectedly showed a significant under estimation
for each aforementioned loading mechanisms.
· The average of wave overtopping parameters namely its width, its height and length of air
pocket were properly estimated using wave reflection coefficient.
· Analysis of wave forces pressures showed that the air entrainments played a prominent role
in estimation of pressure impulse, but in global characteristics of wave loading the effect
of the air was mostly negligible.
List of References
167
List of References
Allsop N.W.H. (1995) "Vertical walls and breakwaters: optimization to improve vessel safety and wave
disturbance by reducing wave reflections” Chapter 10 in Wave Forces on Inclined and Vertical
Wall Structures, pp 232-258, ed. Kobayashi N. & Demirbilek 2., ASCE, New York.
Allsop N.W.H., McBride M.W., & di Leo M. (1995b) “Wave reflections from vertical walls and low
reflection alterative”. Paper 4.7 in Final Report of MCS Project, publn University of Hannover.
Allsop N.W.H., MG Briggs, T Denziloe, & AE Skinner (1991) "Alderney breakwater: the quest for a
‘final' solution' Conference on Coastal Structures and Breakwaters, Institution of Civil Engineers,
London.
Allsop, N. W. H., Besley, P., and Madurini, L. (1995). “Overtopping performance of vertical walls and
composite breakwaters, seawalls and low reflection alternatives.” Final Rep. of Monolithic Coastal
Structures Project, Univ. of Hannover, Hannover, Germany.
Allsop, N.W.H, Bray, R.N. (1994) “Vertical breakwaters in the United Kingdom: historical and recent
experience”. In Wave barriers in Deepwaters, Port and Harbor Research Institute.
Allsop, N.W.H., Kortenhaus, A., Oumeraci, H., McConnell, K., 1999. New design methods for wave
loading on vertical breakwaters under pulsating and impact conditions. Proc. Coastal Structures
'99, Santander, Spain. Balkema Rotterdam, pp. 595–602.
Allsop, N.W.H., McKenna, J.E., Vicinanza, D., Whittaker, T.J.T., 1996a. New design formulae for wave
loadings on vertical breakwaters and seawalls. Proc 25th Int. Conf. Coastal Engineering. ASCE,
New York, pp. 2508–2521.
Allsop, N.W.H., Vicinanza, D., 1996. Wave impact loadings on vertical breakwaters: development of
new prediction formulae. Proc. 11th Int. Harbour Congress, Antewerp, Belgium.
Allsop, N.W.H., Vicinanza, D., Calabrese, M., Centurioni, L., 1996b. Breaking wave impact loads on
vertical faces. Proc. 6th International Offshore and Polar Engineering Conference (ISOPE 96), vol.
3, pp. 185–191.

List of References
168
Allsop, N.W.H., Vicinanza, D., McKenna, J.E., 1996c. “Wave forces on vertical and composite
breakwaters”. Strategic Research Report SR 443. HR Wallingford, Wallingford, pp. 1–94. March
1996.
Bagnold, R.A. (1939) "Interim report on wave-pressure research". J.Inst. of Civil Engineers (1938-39),
12, p201-226.
Batchelor,G. K. 1973 An Introduction to Fluid Dynamics. Cambridge University Press.
Blackmore, P.A., Hewson, P.J., 1984. “Experiments on full-scale wave impact pressures”. Coastal Eng.
8, 331–346.
Bouyssou, R., and Doublet, L. (1957). "Quelques particularit6s sur les variations de pression dans le
clapotis." La HouiUe Blanche, No. Special A, 316-324.
Bradford, S. F. (2000). “Numerical simulation of surf zone dynamics.” J. Waterw., Port, Coastal, Ocean
Eng., 126(1), 1–13.
Bray RN & Tatham PFB (1992)” Old waterfront walls: management, maintenance and rehabilitation”,
CIRIA /E & FN Spon, London.
breakwater," Rept. Port and Harbor Res. Inst., Vol. 12, No. 3, pp. 31-70, (in Japanese) or Proc.
Buccino, M., Dentale, F., Salerno, D., Contestabile, P., Calabrese, M., 2016. the use of CFD in the
analysis of wave loadings acting on seawave slot-cone generators. Sustainability, 2016, 8, 1255.
Buccino, M.; Vicinanza, D.; Salerno, D.; Banfi, D.; Calabrese, M. Nature and magnitude of wave
loadings at Seawave Slot-cone Generators. Ocean Eng. 2015, 95, 34–58.
Bullock, G.N., Crawford, A.R., Hewson, P.J., Bird, P., 1999. Characteristics of wave impacts on a steep
fronted breakwater. Proc. Coastal Structures ’99. Santander, Spain. pp. 455–463.
Calabrese, M.; Allsop, N.W.H. (1998): Effects of obliquity on wave loads on vertical walls. Proceedings
International Conference Coastal Engineering (ICCE), ASCE, Copenhagen, Denmark, no. 26, 2
pp.
Chabert D'Hieres, G. (1960). "Etude du clapotis." La HouiIle Blanche, Grenoble, France, 15(2), 153-
163 (in French).
List of References
169
Chopakatla, S. C. (2003). “A CFD model for wave transformations and breaking in the surf zone.” MS
Thesis, Ohio State University, Columbus, Ohio.
Cooker, M. J. & Peregrine, D.H. 1995 “Pressure-impulse theory for liquid impact problems”. J. Fluid
Mech. 297, 193-214.
Cooker, M.J. and Peregrine, D.H. (1992). Wave impact pressure and its effect upon bodies lying on the
sea bed. Coastal Engineering. 18: 205-229.
Cox, S.J and Cooker, M.J. (1999). The motion of a rigid body impelled by sea-wave impact. Applied
Ocean Research. 21:113-125.
Cuomo G., W. Allsop, T. Bruce, J. Pearson (2010) Breaking wave loads at vertical seawalls and
breakwaters, Coast. Eng., 57 (4) pp. 424–439.
Cuomo, G., Piscopia, R. and Allsop, W. (2011). Evaluation of wave impact loads on caisson breakwaters
based on joint probability of impact maxima and rise times. Coastal Eng. 58: 9-27.
Dalrymple, R.A., M. Gómez-Gesteira, B.D. Rogers, A. Panizzo, S. Zou, A.J.C. Crespo, G. Cuomo, and
M. Narayanaswamy. (2009), Smoothed Particle Hydrodynamics for Water Waves, in Advances in
Numerical Simulation of Nonlinear Waves, Q.Ma, ed., World Scientific Press, ISBN 981-283-
649-7.
De Groot, M.Q. et al. (1996) “Foundation Design of Caisson Breakwaters”, Vols 1 and 2, Publication
No. 198, Oslo: Norwegian Geotechnical Institute.
Dentale, F., Donnarumma, G., Pugliese Carratelli, E., 2014a. Simulation of flow within armour blocks
in a breakwater. J. Coast. Res. 2014, 30, 528–536.
Dentale, F., Donnarumma, G., Pugliese Carratelli, E., 2014b. Numerical wave interaction with Tetrapods
breakwater. J. Naval Arch. Ocean Eng. 2014, 6, 800–812.
EurOtop (2007) Wave overtopping of sea defenses and related structures: assessment manual, Die Kuste,
Archive for research and technology of the North Sea and Baltic coast.
Flow Science, Inc. (2009). FLOW-3D user’s manual, 9.4 edition, Flow Science, Inc., Santa Fe, N.M.
Franco L & Verdesi G (1993) "Ancient Mediterranean harbours: a heritage to preserve" Med-Coast
Conference, Antalya, Turkey

List of References
170
Franco, L., 1994. “Vertical breakwaters: the Italian experience”, special issue on vertical breakwaters.
Coastal Eng. 22 (1–2), 31–55
Funakoshi H., Ohno M. & Tsuda S. (1994) 'survey of long-term deformation of composite breakwaters
along the Japan Sea' Proceedings of Workshop on Wave Barriers in Deep Waters, pp239-266, Port
and Harbor Research Institute, Yokosuka, Japan.
Goda Y., Takagi H., “A reliability design method of caisson breakwaters with optimal wave heights”,
Coastal Eng. Journal 42, No.4, 2000.
Goda, Y (1973b) "A new method of wave pressure calculation for the design of composite
Goda, Y. (1985) Random seas and design of maritime structures. University of Tokyo. ISBN
981023256X, 433p.
Goda, Y. and KAKIZAKI, S., 1966. "Study of Finite Amplitude Standing Waves and their Pressures
upon a Vertical Wall." Rept. Port and Harbor Research Institute, Vol. 5, No. 10, 57 p. (in
Japanese); also Coastal Engineering in Japan, Vol. 10, 1967, pp. 1-11.
Goda, Y. And Kaklzaki, S. (1966) "Study on finite amplitude standing waves and their pressures upon
a vertical wall," Rept. Port and Harbor Res. Inst., VoL 5, No. 10, 57 p. (in Japanese) or Coastal
Engg. in Japan, VoL 10, 1967, pp. 1-11.
Goda, Y., 1973. “A new method of wave pressure calculation for the design of composite breakwater”.
Rep. Port Harbor Res. Inst., 12(3): 31-70 (in Japanese). 14th Conf. Coastal Eng., 1974, ASCE,
Copenhagen, pp. 1702-1720.
Goda, Y., 1974. New wave pressure formulae for composite breakwater. Proc. of 14th Int. Conf. Coastal
Eng., Copenhagen, Denmark. ASCE, New York, pp. 1702–1720.
Hattori, M., Arami, A., and Yui, T. (1994). “Wave impact pressure on vertical walls under breaking
waves of various types.” Coastal Engineering, 22, 79–114.
Hayashi, T. and T. Imai, 1964. Breaking wave pressure and sliding of caisson, Proc. Japanese
Conference on Coastal Engineering, Vol. 11 (in Japanese).
Hiroi I. 1919, “The force and power of waves”, The Engineer, August.
List of References
171
Howison, S. D., Ockendon, J. R. & Wilson, S. K. 1991 A note on incompressible water entry problems
at small dead-rise angles. J. Fluid Mech. 222, 215-230.
Hughes, S.A. (2004) Wave momentum flux parameter: A descriptor for nearshore waves. Coast. Eng.,
51, 1067–1084.
Hull, P., Müller, G., 2002. An investigation of breaker heights, shapes and pressures. Ocean Eng. 29,
59–79.
International Organization for Standardization, “Actions from waves and currents on coastal structures”,
ISO 21650 (2007).
Ito, Y., M. Fujishima, and T. Kitatani, 1966. “On the stability of breakwaters”, Rep. Port Harbor Res.
Inst., Vol. 5, No. 14 (in Japanese); also, 1971, Coast. Eng. Jpn. Vol. 14.
Juhl, J. and Van der Meer, J. W. (1992) Quasi-static wave forces on vertical structures, reanalysis of data
at Danish Hydraulic Institute and Delft Hydraulics Report. Prepared for MAST G6-S Coastal
Structures.
Juhl, J., 1994. Danish experience and recent research on vertical breakwaters. Proc. Conf. On Wave
Barriers in DeepWaters. Yokosuka. pp. 154–171.
Kirkgöz, M. S. and Mamak, M. (2004). Impulse modelling of wave impact pressures on vertical wall.
Ocean Engineering. 31: 343-352.
Kirkgoz, M.S., 1982. Shock pressure of breaking waves on vertical walls. Journal of Waterway, Port,
Coastal and Ocean Division, vol. 108, WW1. ASCE, New York, pp. 81–95.
Kirkgoz, M.S., 1983. Secondary pressures of waves breaking on seawall. J. Waterw. Port Coast. Ocean
Eng. 109, 487–490.
Kirkgoz, M.S., 1990. An experimental investigation of a vertical wall response to a breaking wave
impact. Ocean Eng. 17 (4), 379–391.
Kirkgoz, M.S., 1991. Impact of breaking waves on vertical and sloping walls. Ocean Eng. 18, 45–59.
Kirkgoz, M.S., 1992. Influence of water depth on the breaking wave impact on vertical and sloping
walls. Coast. Eng. 18, 297–314.
List of References
172
Kirkgoz, M.S., 1995.Breakingwaveimpactonvertical andslopingstructures.OceanEng.22, 35–48.
Klammer, P., Kortenhaus, A., Oumeraci, H., 1996. Wave impact loading of vertical face structures for
dynamic stability analysis—prediction formulae. Proc. 25th Int. Conf. Coastal Eng., Orlando,
Florida, USA. ASCE, New York, pp. 2534–2547.
Kortenhaus, A. (1998): On statistics of relative horizontal forces induced by impact and non-impact
waves. Proceedings of PROVERBS Workhop, Naples, Italy, 24-28 February 1998.
Kortenhaus, A., Oumeraci, H., Kohlhase, S., Klammer, P., 1994. Wave induced up-lift loading of caisson
breakwaters. Proc. 24th Int. Conf. Coastal Eng., Kobe, Japan. ASCE, New York, pp. 1298–1311.
Kothe, D. B., Mjolsness, R. C. and Torrey, M. D., (1991), RIPPLE: A computer program for
incompressible flows with free surfaces, Report LA-12007, Los Alamos National Laboratory
Kuo, C. T., 1994. "Recent Researches and Experiences on Composite Breakwaters in Taiwan." Proc.
Intl. Workshop on Wave Barriers in Deepwaters. PHRI, Yokosuka, Japan, pp. 217-238.
Lamb, H. 1932 Hydrodynamics, 6th Edn. Cambridge University Press.
Lamberti, A. And Franco, 1. (1994) "Italian experience on upright breakwaters," Proc. Intl. Conf. on
Wave Barriers in Deepwaters, PHRI, pp. 25-73.
Lara, J., Losada, I., and Guanche, R. (2008) Wave interaction with low-mound breakwaters using a
RANS model. Ocean Engineering, 35, 1388–1400.
Larras, J. (1961) "Cours d'Hydrauiique Maritime et de Travaux Maritimes," Dunod, Paris, pp. 244-245.
244-245.
Ligteringen, H., 1994. "Other European Experience on Deepwater Breakwaters." Proc. of Intl. Workshop
on Wave Barriers in Deepwaters, PHRI, Yokosuka, Japan, pp. 199-216.
Lira, J. 1935. “Bauweise senkrechter Dfimme:. In: XVlth PIANC Congress, Brussels, S. 2 Q. 2, Paper
No. 67.
Losada, I.J., (2003) Advances in modeling the effects of permeable and reflective structures on waves
and nearshore flows. In: Chris Lakhan, V. (Ed.), Advances in Coastal Modeling. Elsevier
Oceanography Series, vol. 67.

List of References
173
Lundgren, H., 1969. Wave shock forces: an analysis of deformations and forces in the wave and in the
foundation. Proc. Symp. on Research in Wave Action. Delft Hydraulics Lab, Delft, The
Netherlands, pp. 1–20.
McBride M.W., & Watson G.M. (1995) "Vertical walls and low reflection alternatives: results of 3-d
physical model tests" Repot lT 425, HR Wallingford, Wallingford.
McBride M.W., Allsop N.W.H., Besley P., Golombo D. & MaduriniL. (1995a)”Vertical walls and low
reflection alternatives: results of wave flume tests on reflections and overtopping" Report lT 417,
HR Wallingford, Wallingford.
McBride M.W., Smallman J.V. & Allsop N.W.H. (1996) "Guidelines for the hydraulic design of harbor
entrances" Report SR 430, HR Wallingford, Wallingford
Miche R., 1944. ”Mouvements ondulatoires des mers en profondeur constante ou décroissante”, Annales
des Ponts et Chaussées,
Miche, M.R., 1933, “Les digues maritimes du type vertical:. Sci. Ind., (January): 23-27.
Minikin, R.R., 1963. “Winds, Waves and Maritime Structures”, second ed. Griffin, London.
Moriidra, H. And KUNITA, O., 1979. "Model Experiments on Hydraulic Characteristics of Sloped Wall
Breakwater." Proc. Japanese Conference on Coastal Engineering, Vol. 26, 295-298.
Muller, G., 1997. Propagation of wave impact pressures into water filled cracks. Institute of Civil
Engineers, Water and Maritime 124 (2), 79–85.
Okamura, M. (1993). Impulsive pressure due to wave impact on an inclined plane wall. Fluid Dynamics
Research. 12: 215-228.
Oumeraci H. (1994c) "Review and analysis of vertical breakwater failures - lessons learned” Coastal
Engineering, Special issue on Vertical Breakwaters, Vol22, pp3-30, Elsevier Science BV,
Amsterdam
Oumeraci H., Klammer P. & Kortenhaus A. (1994a) “impact loading and dynamic response of vertical
breakwaters: review of experimental results" Proceedings of Workshop on Wave Barriers in Deep
Waters, pp347-361, Port and Harbor Research Institute, Yokosuka, Japan.

List of References
174
Oumeraci, H. (2000) “The sustainability challenge in coastal engineering”, Keynote Address in IAHR
Proceedings of the 9th International Conference on Hydrodynamics, Yokohama.
Oumeraci, H. et al. (2001) Probabilistic Design Tools for Vertical Breakwaters, Balkema.
Oumeraci, H., Kortenhaus, A., 1994. Analysis of the dynamic response of caisson breakwaters. Coastal
Engineering 22, 159–183.
Oumeraci, H., Partenscky, H.W., Tautenhein, E. and Nickels, H., 1991. Large-scale model investigation:
a contribution to the revival of vertical breakwaters. In: Proc. ICE Conference on Coastal
Structures and Breakwaters, London. Thomas Telford, London, pp. 207-220.
Partenscky, H. W. & Tounsi, K. 1989 “Theoretical analysis of shock pressures caused by waves breaking
at vertical structures”. Proc. XXIZZ Congr. IAHR, Ottawa (ed. J. Ploeg), vol. C-113118.,
PIANC (1976) “Final Report of the International Commission for the Study of Waves”, Supp. to PIANC
Bulletin 25:111.
PIANC (2001) “Breakwaters with Vertical and Inclined Concrete Walls”, PTC II WG 28, Final Report.
Richardson, J. E., and Panchang, V. G. (1998). "Three-Dimensional Simulation of Scour- Inducing Flow
at Bridge Piers." J. Hydraul. Eng., 124(5), 530-540.
Rogers, B., Dalrymple, R. A., and Stansby P. K. (2010) Simulation of caisson breakwater movement
using SPH, Journal of Hydraulic Research. Vol. 48. pp 135-141.
Routh EMG (1912) 'Tangier: England's lost Atlantic outpost, 1661-1684' (Chapter 17: The Mole and
Harbor), John Murray, Albemarle St, London.
Rundgren, L., 1958. Water wave forces. In: Transaction of the Royal Institute of Technology, Bulletin
No. 54. Royal Institute of Technology, Stockholm.
Sato, T., Yamagata, N., Furukawa, M., Takahasm, S., and Hosoyamada, T., 1992. "Hydraulic
Characteristics of the Sloping Top Caisson Covered with Wave Dissipating Blocks." Proc.
Japanese Conference on Coastal Engineering, Vol. 39, 556-560 (in Japanese).
Shi, F., Zhao, Q., Kirby, J. T., Lee, D. S., and Seo, S. N. (2004) Modeling wave interactions with complex
coastal structures using an enhanced VOF model. In Proc. 29th Int. Conf. Coastal Engrng., Lisbon,
September, pages 581–593.

List of References
175
Stevenson,T. 1886 Design and Construction of Harbors, 3rd Edn. Black.
Takahashi S. (1996) “Design of Vertical Breakwaters”, Reference Doc. No. 34, Yokusuka: Port and
Harbor Research Institute.
Takahashi S., Shimosako K., Kimura K., Suzuki K., “Typical failures of composite breakwaters in
Japan”, Proc. of 27th Int. Conf. Coastal Eng. ASCE, 2000.
Takahashi, S. And Simosako, K, 1990. "Reduction of Wave Force on a Long Caisson on Vertical
Breakwater and Its Stability." Technical Note of Port and Harbor Research Institute, No. 685 (in
Japanese).
Takahashi, S., et al., 1994a. Dynamic response and sliding of breakwater caisson against impulsive
breaking wave forces, Proc. International Workshop on Wave Barriers in Deepwaters, Port and
Harbor Research Institute, Yokosuka, Japan.
Takahashi, S., Hosoyamada, S., Yamamoto, S., 1994. Hydrodynamic characteristics of sloping top
caissons. Proceedings of International Conference on Hydro-Technical Engineering for Port and
Harbor Construction, Port and Harbor Research Institute, Japan, vol 1, pp. 733–746.
Takahashi, S., K. Tanimoto, and K. Shimosako, 1992. Experimental study of impulsive pressures on
composite breakwaters, Rep Port Harbor Res. Inst., Vol. 31, No. 5.
Takahashi, S., K. Tanimoto, and K. Shimosako, 1994b. A proposal of impulsive pressure coefficient
for design of composite breakwaters, Proc. International Conference on Hydro-technical
Engineering for Port and Harbor Construction, Port and Harbor Research Institute, Yokosuka,
Japan.
Takahashi, S., Tanimoto, K. and Shimosako, K., 1992. Experimental study of impulsive pressure on
composite breakwaters. Report of the Port and Harbor Research Institute (PHRI) Vol. 31, No. 5
(Dec.), Tokyo.
Tanimoto K. & Takahashi S. (1994a) “Japanese experiences on composite breakwaters" Proceedings of
Workshop on Wave Barriers in Deep Waters, pp1-24, Port and Harbor Research Institute,
Yokosuka, Japan.
List of References
176
Tanimoto K. & Takahashi S. (1994b) "Design and construction of caisson breakwaters- the Japanese
experience" Coastal Engineering, Special issue on Vertical Breakwaters, Yol22, and pp57-78,
Elsevier Science BV, Amsterdam.
Tanimoto, K, Moto, K, Ishizuka, S., And Goda, Y. (1976) "An investigation on design wave force
formulae of composite- type breakwaters," Proc. 23rd Japanese Conf. Coastal Engg., pp.11-16, (in
Japanese).
Tanimoto, K, Takahashi, S., And Kimura, K (1987) "Structures and Hydraulic Characteristics of
Breakwaters-The state of the Art of Breakwater Design in Japan," Rept. Port and Harbor Res. Inst.,
Vol. 26, No. 5, pp. 11-15.
Tanimoto, K. and Goda, Y., 1991. Historical development of breakwater structures in the world. In:
Proc. Conf. on Coastal Structures and Breakwaters, Inst. Civ. Eng., London, pp. 193-206. Xie,
Topliss, M., Cooker, M., Peregrine, D.H., 1992. Pressure oscilla- tions during wave impact on vertical
walls. Proc. 23rd Int. Conf. on Coastal Engineering. ASCE, pp. 1639–1650.
Topliss, M.E. (1994). Water wave impact on structures. PhD Thesis University of Bristol.
Tsinker, G.P. “Handbook of Port and Harbor Engineering”, Chapman &Hall, 1997, 1054p.
Vicinanza, D (1997): Probabilistic analysis of horizontal wave forces on composite and vertical
breakwaters. Annex 1C, Proceedings 1st Overall Project Workshop, MAST III, PROVERBS-
Project: Probabilistic Design Tools for Vertical Breakwaters. Las Palmas, Gran Canaria, 20 pp.
Vicinanza, D., Dentale, F., Salerno, D., Buccino, M., 2015. Structural response of Seawave Slot-Cone
Generator (SSG) from Random Wave CFD simulations. Proceedings of the International Offshore
and Polar Engineering Conference (ISOPE 2015). 2015-January, pp. 985-991.
Weggel,J.R & Maxwell,W.H.C. (1970) Numerical Model for wave pressure distributions. J. Waterways,
Harbors & Coastal Engineering Div, Proc. ASCE 96 pp 623-642.
Wood, D.J. & Peregrine, D.H. (1998). Two and three-dimensional pressure-impulse models of wave
impact on structures. Coastal Engineering.1502-1515.
Wood, D.J. and Peregrine, D.H. (1996). Wave impact beneath a horizontal surface. Intl. Conf. on Coastal
Eng. 3:2573-2583.

List of References
177
Xie, S. L., 1994. "Recent Research and Experience on Vertical and Composite Breakwaters in China."
Proc. Intl. Conf. on Wave Barriers in Deepwaters, PHRI, Yokosuka, Japan, pp. 129-153.
Zelt, J.A., Skjelbreia, J.E, 1992. Estimating incident and reflected wave field using an arbitrary number
of wave gauges. In Proceedings of the International Conference on Coastal Engineering, Venice,
Italy, 4–9 October 1992; pp. 777–789.