MÜLLER-BBM · E. Transfer Path Analysis As wind turbines are rather complex and huge structures,...
5
MÜLLER-BBM VibroAkustik Systeme WHERE IS THE NOISE COMING FROM? Efficient vibroacoustic measurements on wind turbines 1. INTRODUCTION In the transition from nuclear to regenerative energy sources, wind energy is frequently considered as a key factor. As turbines require wind to operate, environmental conditions have a direct effect on the turbines’ functionality. Possible inland locations are limited and often situated near a populated area. This can cause residential disturbance due to the noise of the turbines. The emitted noise has to be kept as low as possible and is governed by various standards, such as the IEC61400-11 [1] in Europe. These standards usually stipulate the measurement method, applied sensors, sensor positions, and the analysis required. Currently the focus is on sound power, 3 rd octaves and tonalities calculated at different wind bins. Various environmental conditions, topography and setup challenges add to the complexity of the measurement task. Especially when large distances need to be covered, the measurement setup can be costly and time-consuming. A fixed setup is not recommended due to environmental conditions, such as wind direction, wind speed and gondola position. All analyses require a certain amount of data for each wind bin and each possible operational mode. This leads to a flexible and efficient system enabling quick setup changes and smart data management. While standard measurement provides valuable information about the wind turbine status, it does not provide any information on where the noise is coming from and how it is distributed through the turbine structure. Therefore it seems reasonable to add more measurement positions with a wide range of different transducers and additional analyses. In order to acquire further sensor signals, the measurement setup has to be flexible enough to address the specific measurement task while at the same time considering the large structure and environmental conditions. Hence, a wireless solution is needed for the acquisition of the noise, vibration and rotational data. This data can be used for a wide range of analyses. These include simple correlations and comparisons of individual measurements and signals or for the analysis of individual components. Individual disturbing components are located using a microphone array and applying beamforming algorithms. The entire structure or the individual components can be analyzed further through structural analyses based on frequencies or eigenfrequencies (e.g. impact or shaker based measurements besides classic operational measurements). Captured results UNDERSTAND. INTERPRET. DESIGN. are visualized using Operational Deflection Shape analysis (ODS). For more detailed analyses, Transfer Path Analysis is suggested. Transfer Path Analysis ranks the contributions of different sources in the case individual response positions are investigated. Dr.-Ing. Dejan Arsić
Transcript of MÜLLER-BBM · E. Transfer Path Analysis As wind turbines are rather complex and huge structures,...

MÜLLER-BBM VibroAkustik Systeme
W H E R E I S T H E N O I S E C O M I N G F R O M ?
Efficient vibroacoustic measurements
on wind turbines
1. INTRODUCTION
In the transition from nuclear to regenerative energy sources, wind energy
is frequently considered as a key factor. As turbines require wind to operate,
environmental conditions have a direct effect on the turbines’ functionality. Possible
inland locations are limited and often situated near a populated area. This can
cause residential disturbance due to the noise of the turbines. The emitted noise
has to be kept as low as possible and is governed by various standards, such as
the IEC61400-11 [1] in Europe. These standards usually stipulate the measurement
method, applied sensors, sensor positions, and the analysis required. Currently
the focus is on sound power, 3rd octaves and tonalities calculated at different wind
bins. Various environmental conditions, topography and setup challenges add to the
complexity of the measurement task. Especially when large distances need to be
covered, the measurement setup can be costly and time-consuming. A fixed setup
is not recommended due to environmental conditions, such as wind direction, wind
speed and gondola position. All analyses require a certain amount of data for each
wind bin and each possible operational mode. This leads to a flexible and efficient
system enabling quick setup changes and smart data management.
While standard measurement provides valuable information about the wind
turbine status, it does not provide any information on where the noise is
coming from and how it is distributed through the turbine structure. Therefore
it seems reasonable to add more measurement positions with a wide range
of different transducers and additional analyses. In order to acquire further
sensor signals, the measurement setup has to be flexible enough to address
the specific measurement task while at the same time considering the large
structure and environmental conditions. Hence, a wireless solution is needed
for the acquisition of the noise, vibration and rotational data. This data can
be used for a wide range of analyses. These include simple correlations and
comparisons of individual measurements and signals or for the analysis of
individual components. Individual disturbing components are located using a
microphone array and applying beamforming algorithms. The entire structure or
the individual components can be analyzed further through structural analyses
based on frequencies or eigenfrequencies (e.g. impact or shaker based
measurements besides classic operational measurements). Captured results
U N D E R S T A N D . I N T E R P R E T . D E S I G N .
are visualized using Operational Deflection Shape analysis (ODS). For more
detailed analyses, Transfer Path Analysis is suggested. Transfer Path Analysis
ranks the contributions of different sources in the case individual response
positions are investigated.
Dr.-Ing. Dejan Arsić
B. Required Analysis
Prior to analysis in PAK software, the normalized wind speed is calculated by
applying a regression curve with coefficients derived from the power curves. The
normalized speed is based on the power produced. This is valid up to 95% of the
maximum power. Larger values are calculated using the measured wind speed and
the factor ĸ reflecting the ratio between the measured and calculated wind speed.
The acquired sound pressure and the normalized wind speed are subsequently
averaged with an averaging time of 60 s. The sound pressure level is classified into
so-called wind bins, where the wind speed is divided into bins with 1 m/s width and
centered at integer values, according to the synchronously measured/calculated
wind speed. Regression curves are calculated for the operating and background
noise. The level of the recorded noise Ls+n is subsequently corrected by the level of
the background noise Ln at the same microphone position with
This results in the operating noise Ls for differences larger than 6 dB between
operating and background noise. The correction is otherwise performed by
subtracting 1.3 dB. The result is illustrated in Figure 2. The corrected sound
pressure level is used to calculate the emitted sound power Lw with
Figure 2: Regression curves and resulting sound pressure levels for operating
noise, background noise and the corrected sound pressure level depending on the
current wind speed
Only selected data has been applied to calculate the regression curves and will
be used for further analyses. It is now possible to calculate the 3rd octaves and
the tonality as both the sound pressure and the wind speed are already classified
into wind bins. A correction of the background noise is performed to eliminate
frequencies from other sources at selected time stamps where the averaged wind
speed is close to the wind bin center. This is in contrast to DIN 45681 [3]. In both
cases multiple operating noises are used and corrected by the assigned background
noise. The sound power is calculated based on the corrected 3rd octaves. Exemplary
analyses are illustrated in Figure 3.
In order to achieve reliable results, the analyses should not only be performed at time
stamps with averaged wind speeds near the wind speed center. On the one hand
extreme values are frequently represented by outliers which would alter the resulting
sound power. On the other hand the difference between operating and background
noise should be at least 6 dB in order to limit the influence of the background noise.
2. STANDARD MEASUREMENTS
ACCORDING TO IEC64100
The IEC61400 [1], [2], especially the current 3rd edition, requires a specific
measurement setup for the applied sensors, sensor positions, and dedicated
analysis. As the analysis usually requires the operating noise to be measured, a
correction of the according background noise at the same microphone position
must be made. In this way, the operating noise is acquired and separated from the
background environmental noise.
A. Measurement Setup and Method
The measurement setup is illustrated in Figure 1. The microphone and anemometer
positions depend on both the hub height H and the diameter of the rotor D. The
optimum distance between tower and microphone is given by
where the microphone is positioned at a 15% corridor behind the gondola. In cases
where the wind direction or the gondola position changes, the microphone then has
to be rearranged to acquire a new background noise. The anemometer is located at
a distance in between 2D and 4D within the corridor
in a height of apx. z=10 m if possible and zref=10 m. Furthermore, data monitored
by the wind turbine itself, e.g. weather data at hub height, rotational speed, pitch,
gondola position and produced electrical power have to be taken into account.
Figure 1: Top view of the standard measurement setup in accordance to IEC64100.
Possible locations for microphone and anemometer are indicated in blue
Even though it seems obvious to record the noise while the turbine is operating
(ON – operation noise), an additional background noise (BG), recorded at the
same position while the turbine is switched off, is required in order to eliminate
environmental influences such as turbines located nearby, streets, wind, rivers, etc.
These influences have not to be taken into account within the analysis sequence.
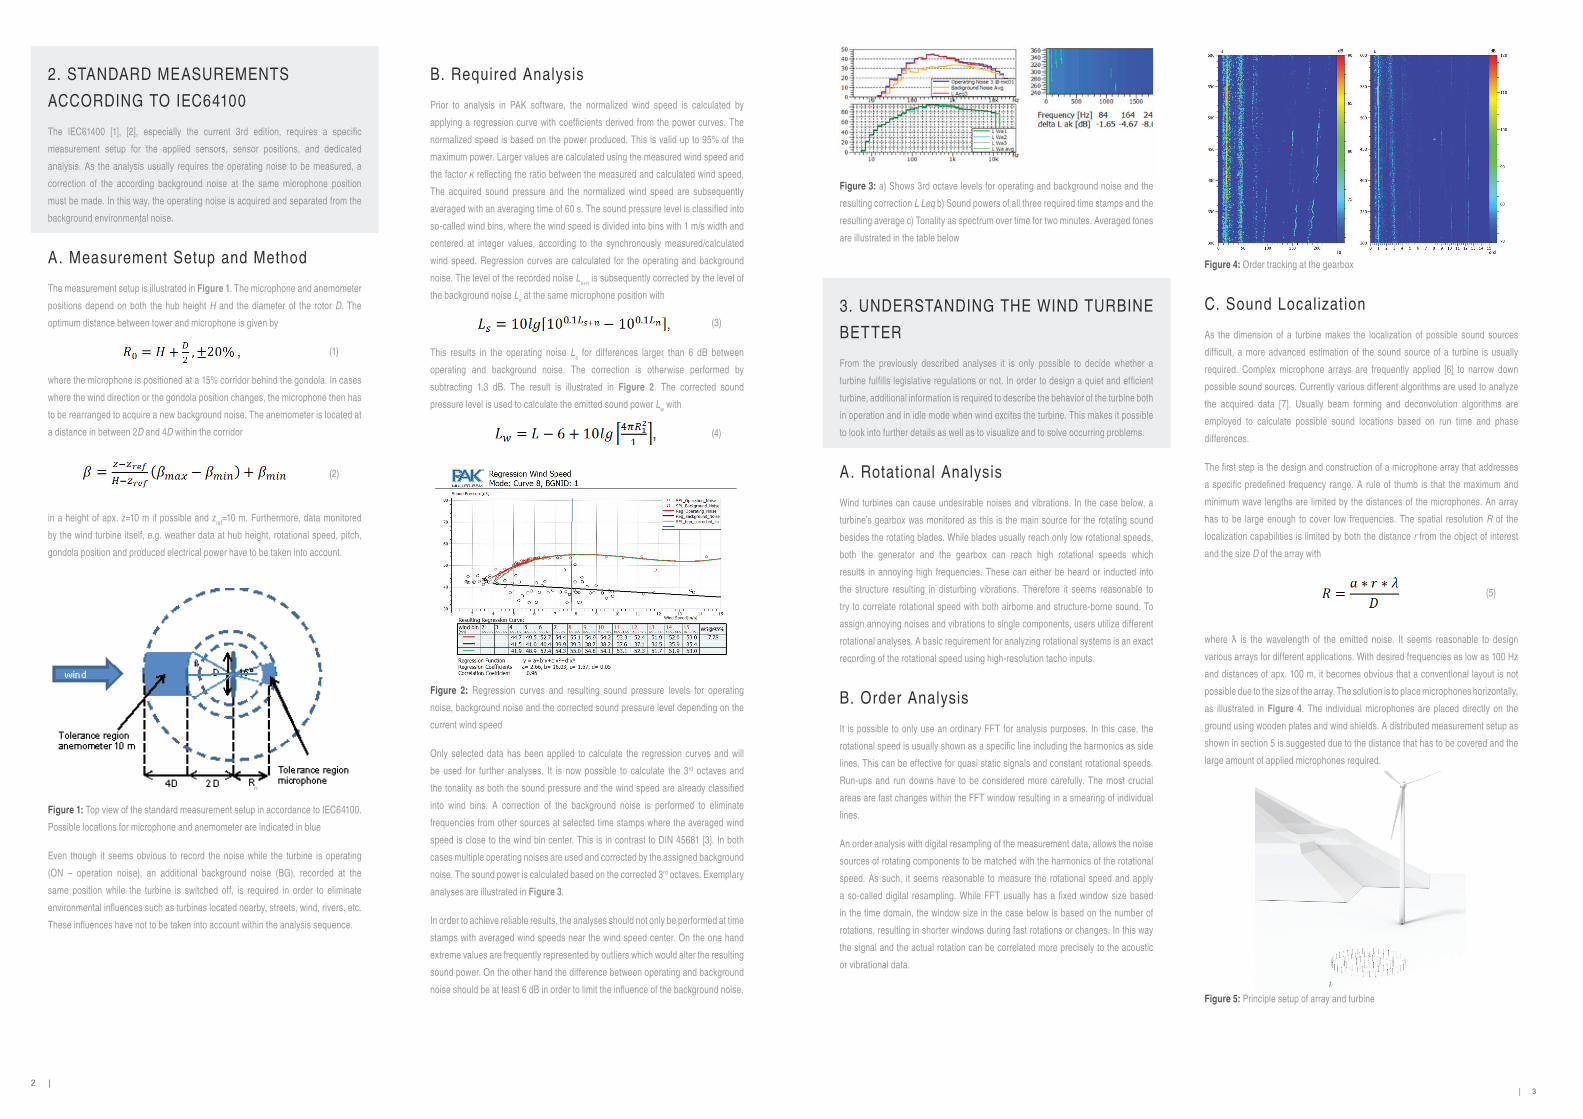
Figure 3: a) Shows 3rd octave levels for operating and background noise and the
resulting correction L Leq b) Sound powers of all three required time stamps and the
resulting average c) Tonality as spectrum over time for two minutes. Averaged tones
are illustrated in the table below
3. UNDERSTANDING THE WIND TURBINE
BETTER
From the previously described analyses it is only possible to decide whether a
turbine fulfills legislative regulations or not. In order to design a quiet and efficient
turbine, additional information is required to describe the behavior of the turbine both
in operation and in idle mode when wind excites the turbine. This makes it possible
to look into further details as well as to visualize and to solve occurring problems.
A. Rotational Analysis
Wind turbines can cause undesirable noises and vibrations. In the case below, a
turbine’s gearbox was monitored as this is the main source for the rotating sound
besides the rotating blades. While blades usually reach only low rotational speeds,
both the generator and the gearbox can reach high rotational speeds which
results in annoying high frequencies. These can either be heard or inducted into
the structure resulting in disturbing vibrations. Therefore it seems reasonable to
try to correlate rotational speed with both airborne and structure-borne sound. To
assign annoying noises and vibrations to single components, users utilize different
rotational analyses. A basic requirement for analyzing rotational systems is an exact
recording of the rotational speed using high-resolution tacho inputs.
B. Order Analysis
It is possible to only use an ordinary FFT for analysis purposes. In this case, the
rotational speed is usually shown as a specific line including the harmonics as side
lines. This can be effective for quasi static signals and constant rotational speeds.
Run-ups and run downs have to be considered more carefully. The most crucial
areas are fast changes within the FFT window resulting in a smearing of individual
lines.
An order analysis with digital resampling of the measurement data, allows the noise
sources of rotating components to be matched with the harmonics of the rotational
speed. As such, it seems reasonable to measure the rotational speed and apply
a so-called digital resampling. While FFT usually has a fixed window size based
in the time domain, the window size in the case below is based on the number of
rotations, resulting in shorter windows during fast rotations or changes. In this way
the signal and the actual rotation can be correlated more precisely to the acoustic
or vibrational data.
Figure 4: Order tracking at the gearbox
C. Sound Localization
As the dimension of a turbine makes the localization of possible sound sources
difficult, a more advanced estimation of the sound source of a turbine is usually
required. Complex microphone arrays are frequently applied [6] to narrow down
possible sound sources. Currently various different algorithms are used to analyze
the acquired data [7]. Usually beam forming and deconvolution algorithms are
employed to calculate possible sound locations based on run time and phase
differences.
The first step is the design and construction of a microphone array that addresses
a specific predefined frequency range. A rule of thumb is that the maximum and
minimum wave lengths are limited by the distances of the microphones. An array
has to be large enough to cover low frequencies. The spatial resolution R of the
localization capabilities is limited by both the distance r from the object of interest
and the size D of the array with
where ƛ is the wavelength of the emitted noise. It seems reasonable to design
various arrays for different applications. With desired frequencies as low as 100 Hz
and distances of apx. 100 m, it becomes obvious that a conventional layout is not
possible due to the size of the array. The solution is to place microphones horizontally,
as illustrated in Figure 4. The individual microphones are placed directly on the
ground using wooden plates and wind shields. A distributed measurement setup as
shown in section 5 is suggested due to the distance that has to be covered and the
large amount of applied microphones required.
(1)
(2)
(3)
(4)
| 3 2 |
(5)
Figure 5: Principle setup of array and turbine

Figure 6: A localized sound emitted by the generator of a wind turbine
D. Structural Analysis
Wind turbines are not only affected by static forces but also by dynamic excitations.
These excitations are usually caused by both wind and rotating parts (e.g. gearbox)
whereas imbalances could be the source of excitation. Each structure has its own
specific vibrational characteristics, where especially the so-called eigenfrequencies
have to be considered as standing waveforms. The following modal parameters
describe the structure:
• Eigenfrequency
• Eigenwaveform
• Eigendamping.
The parameters are calculated with a matrix of transfer functions where both Impact
Measurements [8] and Shaker Measurements can be performed to calculate the
transfer functions. A special case occurs when the excitation frequency equals the
eigenfrequency of a part or the structure. Depending on the damping of the structure,
high amplitudes can be reached. Potential damage can occur from resonance.
Two approaches to optimizing the structure are available:
• Reducing the dynamic excitation, which is not always possible due to
external limitations; and
• Changing the eigenfrequencies so that they do not match the excitation
frequencies.
The simplest task is usually Impact Measurement. Here, an impact hammer is used
to excite the structure while multiple accelerometers acquire data at the response
position. In this way, the transfer function between the excitation (force) and the
response positions can be calculated, see Figure 7, and then used for modal
analysis. The dynamic stiffness of a structure is determined when the excitation and
response position are equal.
Shaker Measurement calculates transfer functions between the force measured at
the shaker and the acceleration measured at the response position. Different to
impact measurement, excitations can be performed over a longer period of time.
Even highly damped structures can be excited by a high signal-to-noise ratio at
high frequencies. This results in a high frequency resolution. Therefore more precise
results within the Modal Analysis can be achieved.
4. CHALLENGES DURING THE
MEASUREMENT
Although the measurement task described in IEC61400 seems simple, it requires a
complex setup and an experienced measurement team. If not, it is almost impossible
to collect enough meaningful data in a short amount of time.
A. Collecting a suf ficient amount of data in
a shor t amount of t ime
The IEC 61400 describes the measurement procedure for one specified power curve
from one microphone position. Multiple power curves and microphone positions are
omitted. Both factors are obstacles to a fast, reliable and easy data acquisition. For
each wind bin (in the case below the bins 2-15), at least three averaged points are
required to fulfill the demands of the regulation. In order to receive meaningful results,
especially when calculating regression curves and determining the subsequent
sound power, the acquisition of more data is required. The common approach to
collect both sufficient and meaningful data for a single power curve is to acquire
data over a long period of time. The PAK system provides a more flexible approach.
As an engineer cannot influence wind speed and hence the current emitted power,
it is important to monitor the amount of collected data for each bin and operating
mode online, instead of in the subsequent post-processing. It is recommended that
the elements within each wind bin during the measurement are counted. As soon
as a bin is considered full (more than ten elements per wind bin are suggested)
and the wind speed as currently constant, another power curve for the wind turbine
can be set. The PAK system automatically adjusts the data management to the
selected power curve. The same procedure is performed when the microphone
position needs to be adjusted. This procedure uses only one background noise for
each microphone position and all modes that speed up data acquisition. As soon as
the wind speed changes, the power curves can be once more adjusted, and data
collected for other bins.
B. Challenges of the measurement setup
While systems with high channel counts are frequently employed on standard test
benches, measurements on wind turbines face engineers with additional challenges.
These are usually related to the distances which have to be covered during sensor
placement.
Technical Issues Cabling is a critical technical issue as the distance between
sensor and measurement frontend has to be kept as short as possible. In order to
achieve high signal quality and a high signal-to-noise ratio (SNR), cables must be of
a high quality. It is laborious to apply sensors at distant positions and connect these
with a centralized frontend. Thereby the signal quality has to be taken into account.
Many sensors can have a maximum cable length. Although ICP® sensors and
microphones can be driven with long cables; others, e.g. charge and strain gauges,
have shorter ranges. Regardless, the average length is less than an average wind
turbine with its hub height of approximately 100 m and an average blade with 73 m
length. A suitable solution for each applied sensor must be found.
It is also often not possible to apply cables, e.g. between hub and nacelle, due to its
moving parts in-between and OEMs usually do not install a loop through for a wide
range of signals.
The PAK system can be used to conduct the measurement in various modes at
different excitation and response positions, while calculating transfer functions at
the same time.
By acquiring operational data or data excited with an impact hammer or shaker at
different sensor positions, makes it possible to determine the vibrational pattern of a
structure using Operational Deflection Shape Analysis (ODS). The vibration pattern
is then shown as an animated geometry illustrated in Figure 8 a). In the presented
case below, two different options are available. On the one hand it is possible to
animate the time domain where all available frequencies are included. On the other
hand it is possible to analyze the vibration pattern for a specific frequency or order.
In this approach the desired frequency line is specified in an APS as illustrated
in Figure 8 b). A highly precise order tracking or digital resampling should be
performed in order to avoid smeared orders extracted from the FFT spectrum.
Figure 8: a) Exemplary ODS with Campbell colors indicating the amplitude
b) Exemplary APS for the selection of frequencies to be animated
E. Transfer Path Analysis
As wind turbines are rather complex and huge structures, it is quite difficult to find
specific sources and transfer paths of both airborne and structure-borne noises
observed at a predefined receiver location. Hence, Transfer Path Analysis (TPA)
[9] is applied. This analysis method traces vibration or noise through a set of known
transfer pathways to the receiver. It aims to provide further insight into the structure
and identifies components that need to be altered in order to solve a concern.
It is possible to set the receiver location to the microphone position specified in
IEC64100. In this way, possible sources and paths from the wind turbine to the
observation point are determined.
TPA describes the system by
where X represents both the airborne and structure-borne source signals,
Y represents air-borne response signals and H is the transfer matrix, describing
the paths through the structure to the receiver. The matrix dimensions are thereby
given by the number of source signals, acquired throughout the testing process. As
a result it is now possible to rank the contribution of different sources along different
paths. In this way, it is possible to determine the influence of a source position for
each individual receiver position. As illustrated in Figure 9, each individual source
signal contributes to the overall signal, illustrated for 2 gearbox positions as well as
the generator. It is possible to use the acquired data and simulate modifications at
source positions and the transfer paths. This results in a Response Modification
Analysis (RMA) where the effects of changing or altering components (e.g. a
different stiffness) or the elimination of resonances can be evaluated.
In order to describe the entire structure efficiently, a vast number of different source
positions must be captured and refined through the actual analysis. Data acquisition
systems must be able to handle large amounts of data.
The TPA itself can be applied during the design process for acoustic optimization
and helps to match overall acoustic targets to the various individual components.
TPA is frequently used for troubleshooting, when problems are discovered late in
the development process or when components are changed, e.g. the gearbox. Using
this method, it is possible to detect the positions where changes can be performed
effectively.
Figure 9: Exemplary contributions of the generator and gearbox to the overall
observed signal.
4 | | 5
Figure 7: Exemplary transfer functions of an impact measurement (6)

5. DISTRIBUTED DATA ACQUISITION - THE
TAILOR-MADE TECHNICAL SOLUTION
Limitations for data acquisition in complex environments, such as on wind turbines,
require a specialized system in order to acquire data from distributed positions
close to the relevant points of interest. Such a system not only has to overcome the
difficulties presented but must also acquire correct data at a reasonable effort and
cost. A few possible solutions, based on the works of Arsić et al [4] are presented
as follows.
5.1 Common Approaches
Within the last few years various approaches for distributed data acquisition have
been implemented and applied to a wide range of applications. Figure 11 illustrates
possible setups with varying scope and level of performance.
The most common setup is shown in Figure 11 a). Here, the analog signals from
a wide range of sensors are collected and digitalized by one central PAK MKII
frontend. Data is then transferred to a workstation or laptop via LAN or WLAN and
is stored at a maximum rate of 40 MB/s, corresponding to 48 channels sampled
at 204.8 kHz in 24-bit mode. The main advantage of a direct link to a PC is the
ability to monitor the measurement and in this case the wind turbine online. Users
can conduct analyses, such as spectra, psychoacoustics and order tracking online,
allowing for immediate conclusions and troubleshooting. As the length of cables,
especially for sensors, is crucial, a first step for reliable, distributed data acquisition
is achieved by using multiple PAK MKII frontends. This is illustrated in Figure 11 b).
All frontends are placed close to the required sensor positions, while keeping the
cable lengths short. The distance between frontends is limited by the network
connection used for the data transfer. Covering distances of up to 1 km by fiber-optic
cables has been proven under operating conditions. This increases the channel
count without the need to upgrade to more powerful controllers. Data digitalized by
each frontend is transferred to a central PC at a maximum transfer rate of 40 MB/s.
While a wide range of analyses is not dependent on phase-synchronization (e.g.
alignment of averaged values or the overall level), especially transfer functions can
only be determined correctly when data is aligned even in phase information. A
centralized clock distributed over fiber-optics synchronizes PAK MKII frontends with
a phase error of 0.2%, at a frequency of 10 kHz. This setup is highlighted in red
in Figure 11 b) below. With a growing amount of sensors and the need for higher
sampling rates, the current maximum data rate of 40 MB/s limits few measurement
tasks. The approach illustrated in Figure 11 c) is applied for high channel counts
and large amounts of data. Each PAK MKII frontend can contain an optional internal
SSD for Local Storage. A selected amount of channels can be transferred to a PC for
monitoring and analysis purposes. Each individual frontend is able to store 40 MB/s
on the internal hard drive, allowing more than enough channels with sampling rates
of up to 204.8 kHz to be stored and synchronized. Due to the system’s stability and
the limited amount of data that has to be transferred to the PC, a direct link using
WLAN is also possible. Once the measurement campaign is complete, the data
stored on the single frontends is transferred to a PC via the network and merged into
one large dataset. In this way, users can work with a single dataset with no further
effort on data management required.
Figure 11: Overview of different approaches for distributed data acquisition a) A
centralized frontend and immediate data transfer to a PC b) Multiple synchronized
frontends and centralized data storage on a PC c) A cluster of synchronized frontends
with local storage and a monitoring system d) A cluster of frontends within a Server-
Client setup, allowing data distribution to selected clients without interference to the
current measurement campaign.
5.2 A Server-Client based topology
To analyze the details of a wind turbine, not only a large amount of sensors is
required but also a long period of data acquisition is needed. All possible wind speed
and power curves have to be captured. The recommended setup is described in
Figure 11 c). Here the PAK system enables users to monitor and record data from
distributed measurement points over a long period of time. Additionally, data must
often be accessed for other purposes, e.g. when providing data to other departments
such as aerodynamics; when acquiring data only at predefined events or even when
the measurement setup must be changed without interrupting the monitoring or
recording of data. Server-Client technology enables the fast and reliable access of
selected data. This is illustrated in Figure 11 d). A central server manages the data
acquired by the individual frontends. The server’s main tasks include monitoring the
measurement, managing changes in the measurement setup and distributing data to
attached clients. Each client can be connected during any time period; either at the
measurement start or even during the measurement. In doing so, clients can record
and analyze the entire data set or only selected channels of interest. The server can
fulfill or deny the clients’ requests and provide only a specified data selection. This
is important, as not all users should access all relevant operational data of the wind
turbine. A consultant for blade design for example does not necessarily need the
currently emitted electrical power and the current rotational speed of the gearbox.
Hence, data access is limited to predefined user groups.
Figure 12: An exemplary wireless distributed data acquisition system for wind
turbines
5.3 A Wireless Solution
The previously described approaches for data acquisition require at least one
cable to each frontend. These are usually Ethernet cables for transferring data
and fiber-optics for phase-synchronization. In some situations however an entirely
wireless solution is preferred. Such a wireless solution is illustrated in Figure 12. All
PAK MKII frontends are placed directly at the points of interest, while keeping the
sensor cables as short as possible. Local storage enables users to set up a WLAN
network, as the amount of data transferred is negligible. Only control commands,
such as start/stop or automated range detection, are transmitted. Should some
channels need to be monitored; only the selected channels are transferred without
interfering with the measurement. Even in the case that the wireless network fails,
the measurement will continue and full data integrity preserved. GPS is used for
synchronization. Consequently wiring is limited to an absolute minimum.
5.4. A standalone solution
All solutions require qualified operators, capable of monitoring the system and
confirming signal integrity. PAK provides powerful tools for online analysis that are
not needed for every task. Additionally, the required windows based PC or laptop
is not suitable for every environment. An easy to configure and easy to handle
standalone solution is required and found in PAK capture suite. The PAK MKII
frontend is now equipped with additional intelligence. After installing the sensors and
switching the frontend on, it is already in live mode, waiting for a trigger condition to
record data. A possible solution is to use an iOS® or Android™ based smart device
to start and stop the recording. The connection for this is established via WLAN
or any other IP based connection. Users are able to configure the measurement,
control the current levels and view completed measurements. In this way, it is
possible to equip the public with smart devices and let them record disturbing noises
with no additional training required. Residents have not only the possibility to record
disturbing noises, themselves, they also feel that their voice has been heard and that
they are included into the process.
This standalone approach introduces other possible applications. Wind turbines
can now be easily monitored over a long period of time, as the only requirement
is a stable, standalone data acquisition system. Users are now able to access their
measurement at any time to see what has happened and is currently happening.
Over time, all environmental conditions can be captured and easily analyzed.
Figure 13: Exemplary setup of PAK capture suite with an iPhone as monitoring and
configuration device
Practical Issues Cable setup is time consuming. The standard setup requires more
time than the actual measurement when all sensors are attached to a centralized
frontend and all cables have to be laid neatly.
Environmental Challenges As wind turbines are usually located in or around
public regions; environmental conditions must be taken into account. These are
primary influenced by the surrounding topology, illustrated in Figure 10. Here
trees, rivers, streets, buildings or even animals present obstacles. All these factors
compound the need for direct cabling with a centralized data acquisition system. As
wind turbines are usually built in farms, where noise emitted by neighboring plants
influences the acoustical analysis. Other objects may also disturb the measurement.
Possible sensor positions must also take wind speed and direction into account. The
IEC61400 requires the recording of a so-called background noise at each microphone
position. This will be used to correct the recorded operating noise according to the
corresponding wind speed. For this to take place, the measurement setup must be
flexible enough to cover all possible combinations of power curves, wind directions
and wind speed. As such, both the hardware setup and the management of data
must be user-friendly, with very little effort required to change the relevant settings.
ANALOG S IGNAL
ANALOG S IGNAL
F IBRE OPTICS
ANALOG S IGNAL
ANALOG S IGNAL
LAN/WLAN
LAN
LAN/WLAN
LAN/WLAN
DIGITAL S IGNAL
MAX 40MB/s
48 CHANNELS, 204kHz , 24 B IT
MONITORING OF INDIV IDUAL
128 GB SSD
DIGITAL S IGNAL
MAX 40MB/s
48 CHANNELS, 204kHz , 24 B IT
ANALOG S IGNAL WLAN
ANALOG S IGNAL WLAN
| 7 6 |
Figure 10: Possible environmental challenges can be animals, streets, trees or
other background noises such as cars or other wind turbines nearby

6. CONCLUSION
An overview on current state of the art data acquisition for acoustic analysis of
wind turbines has been provided. While the setup required by the IEC61400 is only
used to evaluate a wind turbine in terms of electrical power, wind speed and sound
pressure at predefined positions, an extended setup addressing a wide range of
additional sensors is required. This collected data can be subsequently used within
the R&D process in order to determine the reasons of possible disturbing sounds
or high sound power levels. This is usually performed by considering rotational
speed, acceleration and sound pressure. As the distances between desired sensor
positions are large and cabling complex, a distributed data acquisition system is
recommended. PAK MKII frontends can be placed close to the sensor, guaranteeing
a high quality signal and reliable internal storage. If required, phase-synchronization
is achieved with only one additional fiber-optic cable.
Further development and research continues with the aim of simplifying the
measurement setup and enhancing measurements. An entirely wireless solution,
where even phase-synchronization is granted, must be found. Therefore
synchronization, even over large distances, has to be established. Such
synchronization can be performed over GPS, which is highly precise, and can be
used to trigger at the exactly same time stamps while providing low phase error.
Current setups are fast and flexible but require experienced users, as various
error sources must be monitored. Designed as “One man Operating System”, one
operator can setup and monitor the measurement. This operator is equipped to
observe and detect unusual events that require the measurement to be triggered.
As the monitoring of a measurement is especially exhausting and experts are
expensive, a remote solution is required. An alternative is to empower the population
in the vicinity to trigger the measurement should unusual events occur.
© 2014. Müller-BBM VibroAkustik Systeme GmbH. PAK, edp Müller-BBM and VAS Graphics2Go are registered trademarks of Müller-BBM VibroAkustik Systeme GmbH. All other names marked with ™ or ® are trademarks or registered trademarks of other manufacturers in their respective countries. Information listed in this brochure is subject to change without notice due to product development. We accept no responsibility for the accuracy of the information provided. UC-WEM1402.
G e rm a ny | B e lg ium | N e t h e r l a n d s | U K | C h in a | Fr a n c e | S c a n d in av i a | S ou t h Af r i c a | S ou t h Ko r e a | U SA | Au s t r a l i a | I n d i a | I t a ly | J a p a n
HeadquartersGermany: Müller-BBM VibroAkustik Systeme GmbHRobert-Koch-Straße 13, 82152 Planegg, GermanyTel. +49-89-85602-400 • Fax +49-89-85602-444E-Mail: [email protected]
REFERENCES
1. “Wind Turbines – Part 11: Acoustic noise measurement techniques” IEC 61400-11
Ed.2 (International Electrotechnical Commission, Netherlands, 2007-03).
2. D. Arsić, J. Huff, J. Putner “Efficient Evaluation of Wind Turbine Noise”. Proc.
Noise-Con 2013, Denver, Colorado, USA, 2013
3. “Acoustics - Determination of tonal components of noise and determination of a
tone adjustment for the assessment of noise immissions” DIN 45681: 3 (Deutsches
Institut für Normung, Beuth Verlag, Germany, 2005)
4. D. Arsić, J. Huff “Highly Distributed Data Acquisiton on Wind Turbines with PAK”
Proc. Windturbinenoise 2013, Denver, Colorado, USA, 2013
5. P. Zeller “Handbuch Fahrzeugakustik: Grundlagen, Auslegung, Berechnung,
Versuch“, Vieweg + Teubner Verlag, ISBN 9783834806512, 2009
6. R. Ramachandran and R. Dougherty “Wind Turbine Field Measurements With
Compact Microphone Array Using Advanced Beamforming Methods”, Proc. 18th
AIAA/CEAS Aeroacoustics Conference (33rd AIAA Aeroacoustics Conference),
Colorado Springs, USA, 2012
7. S. Oerlemans, P. Sijtsma, B. Mendez Lopez “Location and quantification of noise
sources on a wind turbine”, Journal of Sound and Vibration 299(4-5), 2007
8. M. Lohrmann and T. Hohenberger. “Operational transfer path analysis: comparison
with conventional methods.” Journal of the Acoustical Society of America 123.5
(2008): 3534.
9. J. Putner, H. Fastl, M. Lohrmann, A.Kaltenhauser and F. Ullrich ”Operational
transfer path analysis predicting contributions to the vehicle interior noise for
different excitations from the same sound source” Proc. internoise 2012 (New York
City, USA, 2012)