Module 77: IInformation GGathering, Part 33: CCompiling ...nonprofitinclusiveness.org/files/Module...
30
Module 7: Information Gathering, Part 3: Compiling Results Step One: Creating Your Inclusiveness Committee Step Two: Training and Consultants Step Three: Definitions and Case Statement Step Four: Gathering and Analyzing Information Step Five: Creating Your Inclusiveness Blueprint Step Six: Implementation Information Gathering, Part 3: Compiling Results
Transcript of Module 77: IInformation GGathering, Part 33: CCompiling ...nonprofitinclusiveness.org/files/Module...

MMoodduullee 77:: IInnffoorrmmaattiioonn GGaatthheerriinngg,, PPaarrtt 33:: CCoommppiilliinngg RReessuullttss
Step One: Creating Your Inclusiveness Committee
Step Two: Training and Consultants
Step Three: Definitions and Case Statement
Step Four: Gathering andAnalyzingInformation
Step Five: Creating YourInclusivenessBlueprint
Step Six: Implementation
Information G
athering,Part 3: Com
pilingResults
Step One: Creating Your Inclusiveness Committee
Step Two: Training and Consultants
Step Three: Definitions and Case Statement
Step Four: Gathering andAnalyzingInformation
Step Five: Creating YourInclusivenessBlueprint
Step Six: Implementation
Crea
ting
a S
truc
ture
for
Your
Init
iati
ve:
MMoodduullee 77:: IInnffoorrmmaattiioonn GGaatthheerriinngg,, PPaarrtt 33:: CCoommppiilliinngg RReessuullttss
Overview of ContentIn this module, you will be provided with a method for compiling the information
you collected in Modules 5 and 6. You will also:
• Decide who will be responsible for compiling the available facts (gathered inModule 5) and the stakeholder perspectives (gathered in Module 6).
• Compare pertinent community information with field data and organizationaldata.
• Create spreadsheets, to tabulate available facts and stakeholder perspectives, thatwill be used as you create the inclusiveness blueprint.
Note that this module is specifically about compiling information as compared toanalyzing information. In Module 8: Creating the Framework for the Blueprint, you will do apreliminary analysis of the data and determine which categories (e.g., Mission,Personnel, Programs) to prioritize. In Modules 9-16, you will do a deeper analysis of thedata and develop an action plan to achieve the changes you identify are needed.
Who to Involve
The majority of the work in this module requires the attention of one or two peoplerather than the entire Inclusiveness Committee. After being selected, that person(s) willcomplete the exercises and report back to the Inclusiveness Committee with theircompilations.
Exercises to Complete
The chair of the Inclusiveness Committee and the executive director complete thefollowing exercise:
• Exercise 7-A: Identify Who Will Be Responsible for Compiling Data
The person(s) selected to compile the data review the following content:
• Tips for Compiling the Data on Stakeholder Perspectives
• Sample 7-D: Sample Survey of Stakeholder Perspectives
• Sample 7-E: Sample Stakeholder Perspectives: Likert Scale Responses (Quantitative)
• Sample 7-F: Sample Stakeholder Perspectives: Narrative Responses (Qualitative)
• Tips for Compiling Focus Group Responses
The person(s) selected to compile the data completes the following exercises:
• Exercise 7-B: Available Facts: Making Numerical Comparisons (Quantitative)
• Exercise 7-C: Available Facts: Compiling Other Information (Qualitative)
• Exercise 7-G: Stakeholder Perspectives: Compiling Likert Scale Responses (Quantitative)
• Exercise 7-H: Stakeholder Perspectives: Compiling Narrative Responses (Qualitative)
• Exercise 7-I: Stakeholder Perspectives: Compiling Focus Group Responses (Qualitative)
• End-of-Module Checklist
Then, hold meeting(s) to review the compilations of the data as developed by thedata compiler(s).

61Inclusiveness at WorkModule 7
MMoodduullee 77:: IInnffoorrmmaattiioonn GGaatthheerriinngg,, PPaarrtt 33:: CCoommppiilliinngg RReessuullttss
Selecting Someone to Compile the Information Depending on the depth of your information-gathering process,
compiling the information you collected may be simple or morecomplex.
If you have resources, you may wish to save time by hiring someoneto compile the information. If you don’t have resources to hire someone,identify someone in your organization who has comfort and ability withbasic spreadsheet usage to help with this part of the inclusivenessinitiative. Or, you may want to use a volunteer such as a graduatestudent who is interested in the subject of inclusiveness. In order tosplit up the workload, you may select one individual to compile theexisting data and another to work with stakeholder perceptions.
Spreadsheets are useful for sorting information by position withinthe organization, by demographic characteristics, or by any otherattribute you may have asked of your stakeholders. If you askedquestions using the Likert see Module 6, pg 55 (numerical rating scale),spreadsheets can make it easy to compute the average score, or mean,of the answers to a given question. While this process doesn’t requirecomplex statistical analysis, it does require taking the time to tally upthe answers and the ability to do basic math.
Complete Exercise 7-A: Identify Who Will Be Responsible for Compiling Data.
Compiling Available InformationComplete Exercises 7-B: Available Facts: Making Numerical Comparisons(Quantitative) and 7-C: Available Facts: Compiling Other Information(Qualitative).
Tips for Compiling the Data on Stakeholder PerspectivesThe information you gather from stakeholders will be useful only
when you put it into a format that allows you to analyze it. Looking atthe information as a whole will allow you to see trends for allstakeholder groups and compare perspectives of different groups. Forexample, you may learn that there are significant discrepancies betweenthe perceptions of stakeholder groups, such as the board of directorsand the staff.

Here are some other tips that you may find useful when compiling theinformation you have gathered:
• Use different spreadsheets for quantitative information and qualitativeinformation.
• Assign a number to each person who responded to a survey orinterview and associate all answers from that respondent with theirassigned number. Also be sure to record the assigned number on theindividual surveys or the interview write-up form so that you can goback to the answers from a particular respondent if you need anyclarifying information later.
• For individual respondents, be sure to include personal information oneach, such as what group(s) they belong to (e.g., former boardmember, donor, etc.) and anything else you may have decided tocollect on respondents (e.g., their race or ethnicity). Do not includenames. Use consistent language for personal information. Forexample, do not say “donor” for one respondent and “contributor” foranother respondent.
• Use the same format or the same questions for surveys and interviewsif you collected similar information from different groups, such asvolunteers and staff.
Review Exercise 7-D: Sample Survey of Stakeholder Perspectives (This information-gathering tool includes a short selection of questions. For more questions, refer toModule 6, Exercise 6-B: Reviewing Information-Gathering Topics.)
Review Exercises 7-E: Sample Stakeholder Perspectives: Likert Scale Responses(Quantitative) and 7-F: Sample Stakeholder Perspectives: Narrative Responses(Qualitative).
Complete Exercises 7-G: Stakeholder Perspectives: Compiling Likert Scale Responses(Quantitative) and 7-H: Stakeholder Perspectives: Compiling Narrative Responses(Qualitative).
Tips for Compiling Focus Group Responses If you completed focus groups as part of your data gathering, it is
important that you prepare a summary shortly after each focus group hasbeen completed.
In general, there are three basic ways to look at the responses thatcome from focus groups:
1. Themes: The most important outcome from a focus group iscapturing the themes that arise from the group regarding the issuesabout which you are most concerned. Typically, the moderator will beresponsible for capturing the themes and for writing a summary ofthe pertinent themes after the focus group is over.
Inclusiveness at WorkModule 7
62

2. Verbatim Responses: A transcript of a focus group can provide youwith a clear sense of the tone of the group, the dynamics within thegroup, and most importantly, the word-for-word responses fromparticipants. Sometimes there are things that individuals might say ina focus group that are of particular relevance but might not get pickedup in someone else’s interpretation of key themes. Creatingtranscripts requires audio-taping a focus group, and then havingsomeone type the responses from the audio-tape. This can be costlyand time-consuming, so if your budget is limited, this might not befeasible.
3. Insightful Comments/Suggestions: In most focus groups, there are afew very illuminating comments made by participants that aren’tnecessarily shared by the whole group but that are insightfulnonetheless. Sometimes the comments come in the form ofconstructive criticism, particularly astute analysis or observation, or arecommendation about how an organization’s work can be improved.Whoever is responsible for creating a report at the completion of thefocus group should pay close attention to these valuable commentsand be sure they get recorded.
When summarizing the results from a focus group, break down theresponses into categories (e.g., Mission and Organizational Values, Board ofDirectors, Personnel, Programs, etc.). Keeping data in categories will helpyou easily review the necessary information when it comes time to createthe inclusiveness blueprint.
Complete Exercise 7-I: Stakeholder Perspectives: Compiling Focus Group Responses.
Analyzing Information In Modules 9-16 you will complete exercises to identify trends and
important points from the data within each prioritized category. Here aresome of the things you will be looking for as you analyze the data:
• Overall: Are there clear themes that came from a majority of yourstakeholders regarding the organization’s strengths and challenges inregards to inclusiveness?
• Inconsistencies in Existing Data: Are there inconsistencies between thecommunity, field, and organizational data? For example, do you findthat the community data show that 45 percent of your service area iscomprised of people of color, yet your client base is only 25 percentpeople of color?
• Inconsistencies in Stakeholder Perspectives: Are there inconsistenciesbetween stakeholder groups? For example, do you find that yourBoard of Directors believes that the organization is effectively serving
63Inclusiveness at WorkModule 7
communities of color, but your client base tells you somethingdifferent? Do you find that people of color and white people affiliatedwith the organization have widely divergent opinions about theorganization’s services?
• Strongly Held Beliefs of Stakeholders: Are there any stories or stronglyheld beliefs about the organization that are preventing the organizationfrom moving forward on inclusiveness matters? For example, do somepeople in your organization believe that the mission of yourorganization is irrelevant to communities of color?
As is true with any planning process, analyzing the results from yourinformation-gathering work will require some interpretation of the data,especially in regards to the stakeholder perspectives. The InclusivenessCommittee may be overwhelmed by the amount of potentially valuableinformation it receives. In this case, it is important for the committee to lookat two important variables:
• Information must be interesting and important: Is the information simplyinteresting, or is it really important to the work that we do? Forexample, you might find that there is a perception that yourorganization does not adequately serve rural communities; however, ifyour catchment area does not include rural communities, then this maynot be an important issue to focus on right away. (For more descriptionon determining whether or not information is interesting andimportant, refer to Module 5, the section on Developing a Scope andStrategy.)
• There must be an acceptable threshold for defining themes: Can youestablish a threshold for the minimum number of people who need toshare a perspective for an issue to be deemed a relevant “theme”? Forexample, is it important if only two stakeholders articulate a particularproblem, if those two people represent ten percent of the people whowere interviewed? Your Inclusiveness Committee should discuss thisissue ahead of time and get a general sense of a threshold that isacceptable to most members of the committee.
Track your progress in completing Module 7 on the End-of-Module Checklist,located after the exercises.
Inclusiveness at WorkModule 7
64

Members of the Inclusiveness Committeecompile information and present theresults.
Joe asked Eleanor and Trevor to comeinto his office a couple of weeks before thenext Inclusiveness Committee meeting. “I’dlike to ask you two if you’d work together tocompile the information we’ve collected,”said Joe. “I’ve read the next chapter, andwe’re a little ahead of the game, sincepeople have been reporting back on theirfindings as we go along. But it would bevery useful to bring everything together. AndI think you two would make a great team.Trevor, could you compile the availablefacts? And Eleanor, could you compile thestakeholder perceptions?”
“Sure, Joe,” said Eleanor. “Of course,”said Trevor.
“Take your time,” he said. “We’re doingthe staff inclusiveness training with Ed nextmonth on communicating across cultures,and I don’t expect we’ll get the committeetogether until after that session.”
Trevor and Eleanor sat down with theworkbook and the reports that they’dreceived from the other staff members overthe last three months. Using theworksheets, they compiled the data into fourcategories: Available facts quantitative andqualitative, and Stakeholder Perceptions,quantitative and qualitative. Instead offollowing Joe’s suggestion, Trevor compiledthe quantitative data and Eleanor thequalitative for both areas. Afterwards theyworked together to identify any trends they’dseen.
Trevor noted that while the staff wasfairly diverse, the Board was not at alldiverse. Eleanor reported that several Boardmembers had themselves brought up thisissue, and that interviews with othercommunity health clinics had revealed thatCHC was one of the only remainingcommunity clinics in a city of their size anddemographics that had an all-white Board.
“Gee,” said Trevor. “I’d hate to bring thisup to Mrs. Dreyfuss.”
By comparing the focus group data fromthe patient group with quantitativeinformation on patient visits, they identifiedthat patients vastly preferred receiving carefrom a professional who spoke their ownlanguage, yet only 15 percent of visits wereconducted in the patient’s native language.“Luisa will be interested in this,” saidEleanor, “but she won’t be surprised. This iswhat she’s been telling us for years. Frankly,I thought she was projecting her ownconcerns. That’s obviously not the case.”
The findings that proved most interestingto Eleanor related to CHC’s donors. Sheand her assistant had reviewed the guestlists for the fundraising events in the last twoyears, and they found that only 5 to 8percent of the people who came to theirevents represented any type of diversity. Yetthe donations that came in through theircontribution boxes in the clinics representeda fairly diverse group. “This shows thatpeople from all communities would supportus,” said Trevor.
“It does,” said Eleanor. “I’ve always hada picture of our potential donors as wealthy,social, and I’ll admit it - white. I’ve got tochange my thinking.”
A Story of Transformation
65Inclusiveness at WorkModule 7
Module 7: Information Gathering Part 3, Compiling Results

At the next Inclusiveness Committeemeeting, the first topic was the“communicating across cultures” session.Committee members were enthusiastic,especially Luisa.
“This was the best one yet,” she said. “Ilearned so much about what peopleassume based on non-verbalcommunication. I never thought about that!That Ed is very good, Joe.”
“What do the rest of you think of Edand our “valuing differences” trainings?”Joe asked.
People shared quick, positivecomments. Only Marcie was quiet.
“Marcie,” Joe said. “What do youthink?”
“Oh, Ed’s doing a great job for wherewe are. It’s just slower than I would like,”she said. “But we’re moving, and that’ssomething.”
“Okay, great. Speaking of movingahead, Trevor and Eleanor will nowpresent their compilation of the results ofour information gathering. I’ve seen apreview, and I think you’ll find theinformation to be very interesting.”
A Story of Transformation
Inclusiveness at WorkModule 7
66

Inclusiveness at Work: How to Build Inclusive Nonprofit Organizations
EXERCISE 7-A
Identify Who Will Be Responsible for Compiling Data Identify Who Will Be Responsible for Compiling Data Identify Who Will Be Responsible for Compiling Data Identify Who Will Be Responsible for Compiling Data
Write the name of the person or persons who will be responsible for compiling the existing data below: Write the name of the person or persons who will be responsible for compiling the stakeholder perspectives data below: Date Exercise Completed __________

Inclusiveness at Work: How to Build Inclusive Nonprofit Organizations

Inclusiveness at Work: How to Build Inclusive Nonprofit Organizations
EXERCISE 7-B
Available Facts: Making Numerical ComparisonsAvailable Facts: Making Numerical ComparisonsAvailable Facts: Making Numerical ComparisonsAvailable Facts: Making Numerical Comparisons
This exercise allows you to compare whether your organization�s demographics are similar to or different from the community�s and the field�s. Instructions: Refer to � Exercise 5-B: Selecting Facts to Collect About Your Community, � Exercise 5-D: Selecting Facts to Collect About Your Field, and � Exercise 5-E: Selecting Facts to Collect About Your Organization for the data topics to
include in your comparison. Create a spreadsheet as follows: � In one column record all of the community information that you collected, (e.g.,
race/ethnicity, class, language capacity, etc.). � In another column, record any parallel information about your field (e.g., demographical
information on typical users of an organization similar to yours). � In another column, record any parallel information about your organization (e.g.,
demographical information on your board of directors, staff, etc.)
Community Field Organization EXAMPLE language capacity
non-English speaking
25%
40%
15%
English only
50%
30%
70%
Bilingual/multilingual
25%
30%
25%
Date Exercise Completed __________

Inclusiveness at Work: How to Build Inclusive Nonprofit Organizations

Inclusiveness at Work: How to Build Inclusive Nonprofit Organizations
EXERCISE 7-C
Available Facts: Compiling Other InformationAvailable Facts: Compiling Other InformationAvailable Facts: Compiling Other InformationAvailable Facts: Compiling Other Information
This exercise allows you to compare non-numerical data between your organization and your community and field. Instructions: Refer to � Exercise 5-B: Selecting Facts to Collect About Your Community, � Exercise 5-D: Selecting Facts to Collect About Your Field, and � Exercise 5-E: Selecting Facts to Collect About Your Organization for the data topics to
include in your comparison. Create a spreadsheet or word processing document as follows: � Put all of the non-statistical available facts that you gathered (e.g., personnel policies,
etc.) into one document using either a spreadsheet or a word processing program. This will ensure that when you analyze the data you will have all the information you need for each category.
� Be sure to separate the data into categories. For example, create a heading that says �Mission� and put all of the information related to mission under that heading. Create headings for �Board of Directors,� �Personnel,� and so on, and place the information pertinent to each category under the appropriate heading.
� See example.
continued

Inclusiveness at Work: How to Build Inclusive Nonprofit Organizations
EXERCISE 7-C: Available Facts: Compiling Other Information continued
Topic Facts About Community
Facts About Field Facts About Organization
EXAMPLE Programs
Another local arts organization also believes that its programs are under-utilized by individuals of color. Several artists of color in our community have recently received prominent national awards and press.
The national council for our field reports that the majority of organizations have looked to reach out to communities of color. Partnering with arts organizations based in communities of color and re-working advertising strategies have been successful methods for some organizations.
We do not currently have any programs featuring the work of artists of color.
Date Exercise Completed __________

Inclusiveness at Work: How to Build Inclusive Nonprofit Organizations
SAMPLE 7-D
Sample Survey of Stakeholder PerspectivesSample Survey of Stakeholder PerspectivesSample Survey of Stakeholder PerspectivesSample Survey of Stakeholder Perspectives
The following is a sample of an inclusiveness survey. Then, after the sample survey, you will find an example of how the results from this particular survey might be compiled. Thank you for agreeing to complete this short survey on the inclusiveness practices of ______________________ (name of organization). We seek to become more inclusive of communities of color. Your participation in this survey will influence our efforts. Your responses will be confidential. When you have finished the survey, please return it to: contact person, name of organization, address Your position with ____________________ (name the organization). (Check the term that best describes your primary role with the organization.): Staff Board Donor Former Board Member Former Staff Member Volunteer Client Community Partner (working closely with the organization) Community Leader Community Member Your Race/Ethnicity ____ African American ____ Asian/Pacific Islander ____ Latino/Chicano/Hispanic ____ Middle Eastern ____ Mixed Racial/Ethnic Background ____ South Asian ____ White/Caucasian ____ Other ______________
continued

Inclusiveness at Work: How to Build Inclusive Nonprofit Organizations
SAMPLE 7-D: Sample Survey of Stakeholder Perspectives continued
Please answer the questions below using the following scale and/or with a written answer: 1 = not at all 2 = a little bit 3 = somewhat 4 = quite a lot 5 = a great deal dk = don�t know For the purposes of this survey, inclusiveness is defined as� Organizational Mission The mission of _____________________________ (name of organization) is... (Fill this in ahead of time so that respondents can reflect on the actual mission.) 1. Does the mission of _____________________________ impact communities of color? 1 2 3 4 5 dk 2. Do you feel that communities of color generally respond positively to ________________________�s mission? 1 2 3 4 5 dk 3. Are the values related to inclusiveness that are espoused by _____________________________ consistent with the values that it practices? 1 2 3 4 5 dk 4. Do you have any suggestions about how _____________________________�s mission statement could be changed to expand inclusiveness? 5. Please provide further comments related to mission-related issues here:
continued

Inclusiveness at Work: How to Build Inclusive Nonprofit Organizations
SAMPLE 7-D: Sample Survey of Stakeholder Perspectives continued
Board of Directors 1. Do you feel people of color generally feel comfortable serving as members of the board of directors of _____________________________? 1 2 3 4 5 dk 2. Do people of color and white people generally serve as directors for the same amount of time? 1 2 3 4 5 dk 3. Does the board of directors of ______________________________ consider issues relating to race and ethnicity when it sets policies and makes decisions for the organization? 1 2 3 4 5 dk 4. What could the board of directors of _____________________________ do differently to become more inclusive, if anything? 5. What could the board of directors of _____________________________ do differently to address the needs of communities of color, if anything? Please provide further explanation on any governance-related issues here:
continued

Inclusiveness at Work: How to Build Inclusive Nonprofit Organizations
SAMPLE 7-D: Sample Survey of Stakeholder Perspectives continued
Personnel 1. Are people of color and white people with similar professional backgrounds and skills recruited and promoted equally at _____________________________? 1 2 3 4 5 dk 2. Has _____________________________been able to effectively retain people of color? 1 2 3 4 5 dk 3. Are staff at certain levels of the organization more likely to be people of color than at other levels? 1 2 3 4 5 dk 4. What factors have influenced retention among people of color at _____________________________? 5. What could _____________________________ do, if anything, to recruit and retain staff members of color at all levels? 6. Please provide further explanation on any personnel-related issues here:
continued
Inclusiveness at Work: How to Build Inclusive Nonprofit Organizations
SAMPLE 7-D: Sample Survey of Stakeholder Perspectives continued
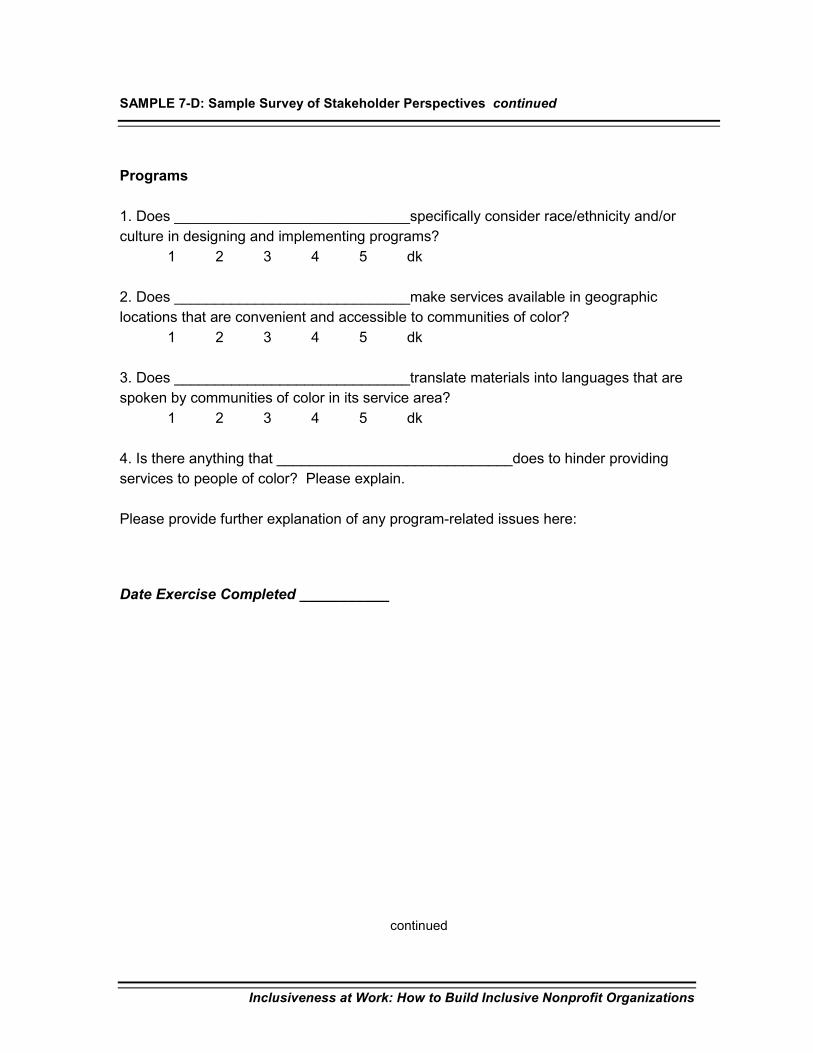
Programs 1. Does _____________________________specifically consider race/ethnicity and/or culture in designing and implementing programs? 1 2 3 4 5 dk 2. Does _____________________________make services available in geographic locations that are convenient and accessible to communities of color? 1 2 3 4 5 dk 3. Does _____________________________translate materials into languages that are spoken by communities of color in its service area? 1 2 3 4 5 dk 4. Is there anything that _____________________________does to hinder providing services to people of color? Please explain. Please provide further explanation of any program-related issues here: Date Exercise Completed ___________
continued

Inclusiveness at Work: How to Build Inclusive Nonprofit Organizations
SAMPLE 7-E
Stakeholder Perspectives Likert Scale Responses (Quantitative)Stakeholder Perspectives Likert Scale Responses (Quantitative)Stakeholder Perspectives Likert Scale Responses (Quantitative)Stakeholder Perspectives Likert Scale Responses (Quantitative)
Respondent ID #
Raci
al/E
thni
c B
ackg
roun
d *
Stak
ehol
der G
roup
(s)
Mis
sion
Missi
on Q
uest
ion
1M
issi
on Q
uest
ion
2
Missi
on Q
uest
ion
3G
over
nanc
e
Boa
rd o
f Dir.
Que
stio
n 1
Boa
rd o
f Dir.
Que
stio
n 2
Boa
rd o
f Dir.
Que
stio
n 3
Pers
onne
l
Per
sonn
el Q
uest
ion
1Per
sonn
el Q
uest
ion
2
Prog
ram
s
Pro
gram
s Q
uest
ion
1
Pro
gram
s Q
uest
ion
2Pro
gram
s Q
uest
ion
3
1 W S 4 2 2 3 5 1 4 5 2 1 12 SA FS 3 2 5 4 4 4 2 2 4 3 33 L/C/H B 4 4 4 3 3 2 2 3 5 4 44 W B 5 5 4 5 4 4 dk dk 3 4 45 W S dk 3 3 3 dk dk 4 3 2 2 26 AA FB 4 5 4 dk dk dk dk dk 3 2 1
Total Score 20 21 22 18 16 11 12 13 19 16 15
Total # of responses 5 6 6 5 4 4 4 4 6 6 6
Average score 4.0 3.5 3.7 3.6 4.0 2.8 3.0 3.3 3.2 2.7 2.5
*Racial/Ethnic Background CodeAA = African American S = StaffAPI = Asian/Pacific Islander B = BoardL/C/H = Latino/Chicano/Hispanic C = ClientME = Middle Eastern FS = Former Staff MX = Mixed Racial/Ethnic Background FB = Former Board NA = Native American/American Indian dk = don't knowSA = South Asian W = White/Caucasian Scale of 1 - 5, with 1 being the lowestO = Other

Inclusiveness at Work: How to Build Inclusive Nonprofit Organizations
SAMPLE 7-F
Sample Stakeholder Perspectives Narrative Responses (Qualitative)Sample Stakeholder Perspectives Narrative Responses (Qualitative)Sample Stakeholder Perspectives Narrative Responses (Qualitative)Sample Stakeholder Perspectives Narrative Responses (Qualitative)
Question NumberRespondent ID #
Respondent's Stakeholder Group
Racial/ Ethnic Background Comments from Respondents
Mission Q1 2 FS SA Communities of color are in great need of XYZ's work.Mission Q4 5 S W It should explicitly state that serving diverse communities is a priority. Mission Q4 4 B W It is great the way that it is; it's generic and it speaks to everyone's needs.
Mission Q5 6 FS AAThere's a myth at XYZ organization that they are already serving the needs of communities of color adequately, which isn't true.
Governance Q3 1 S WThe board tries to address issues of race but without more diversity it's very hard.
Governance Q3 3 B L/C/HThe Board did a good job when it created a policy regarding bilingual language capacity - now it needs to be implemented.
Governance Q5 6 FB W Become more diverse; develop advisory committees with p.o.c.
Personnel Q1 1 S W We try to recruit people of color but they don't seem to want to work for us
Personnel Q1 3 B L/C/HPeople of color won't be interested in XYZ organization until its programs are more responsive to communities of color.
Personnel Q3 6 FB AAThe ED has only limited knowledge about communities of color so she doesn't recruit effectively.
Personnel Q3 6 FS AA
There's a lot of good effort made to recruit people of color but the organization is based in a mostly white community so people of color are not as interested in working there.
Programs Q3 2 FS SAGood work translating into Spanish; could improve with more Vietnamese translations.
Programs Q4 4 B W The staff are diverse.
Programs Q4 1 S WThe executive director has prevented staff from developing new outreach programs that would help us learn more about communities of color.
Programs Q5 2 FS Y
There's a lack of basic knowledge about communities of color,E1 especially immigrant communities. For example, there are concerns among immigrants around utilizing law enforcement due to fears of deportation that staff don't seem to get.

Inclusiveness at Work: How to Build Inclusive Nonprofit Organizations
Inclusiveness at Work: How to Build Inclusive Nonprofit Organizations
EXERCISE 7-G
Stakeholder Perspectives: Compiling Likert Scale Responses Stakeholder Perspectives: Compiling Likert Scale Responses Stakeholder Perspectives: Compiling Likert Scale Responses Stakeholder Perspectives: Compiling Likert Scale Responses
(Quantitative)(Quantitative)(Quantitative)(Quantitative)
Instructions: Using the spreadsheet provided as a model (Exercise 7-E: Sample Stakeholder Perspectives Likert Scale Responses), create a document with all of the numeric answers provided by your stakeholders. To the extent possible, be sure to keep the data segmented by category. This will be useful when you analyze the data in each of the subsequent modules. Date Exercise Completed __________

Inclusiveness at Work: How to Build Inclusive Nonprofit Organizations

Inclusiveness at Work: How to Build Inclusive Nonprofit Organizations
EXERCISE 7-H
Stakeholder Perspectives: Compiling Narrative Responses Stakeholder Perspectives: Compiling Narrative Responses Stakeholder Perspectives: Compiling Narrative Responses Stakeholder Perspectives: Compiling Narrative Responses
(Qualitative)(Qualitative)(Qualitative)(Qualitative)
Instructions: Using the example provided as a model (Exercise 7-F: Sample Stakeholder Perspectives Narrative Responses), create a spreadsheet with the verbal or written responses to survey and interview questions for all non-numeric questions. To the extent possible, be sure to keep the data segmented by category. This will be useful when you analyze the data in each of the subsequent modules. Date Exercise Completed ___________

Inclusiveness at Work: How to Build Inclusive Nonprofit Organizations

Inclusiveness at Work: How to Build Inclusive Nonprofit Organizations
EXERCISE 7-I
Stakeholder Perspectives Compiling Focus Group ResponsesStakeholder Perspectives Compiling Focus Group ResponsesStakeholder Perspectives Compiling Focus Group ResponsesStakeholder Perspectives Compiling Focus Group Responses
Instructions: Write a report on each focus group. Summarize the findings by category (e.g., Mission, Board of Directors, Personnel). This will be useful when you analyze the data in each of the subsequent modules. Include one or more of the following elements: � Themes � Verbatim transcripts � Insightful comments and suggestions

Inclusiveness at Work: How to Build Inclusive Nonprofit Organizations

Inclusiveness at Work: How to Build Inclusive Nonprofit Organizations
END-OF-MODULE CHECKLIST
Module 7Module 7Module 7Module 7
Action Item Date Completed
Notes
Select person(s) to compile data.
Compile available facts (quantitative).
Compile available facts (qualitative).
Compile stakeholder perspectives (Likert scale responses; quantitative).
Compile stakeholder perspectives (narrative responses; qualitative).
Compile stakeholder perspectives (focus group responses; qualitative).
Share data compilations with Inclusiveness Committee.

Inclusiveness at Work: How to Build Inclusive Nonprofit Organizations
END-OF-MODULE CHECKLIST: Module 7 continued
Recognize your progress to date and communicate it to appropriate stakeholders.