Module 7 Converting between PDEs and … · 4 Q3D training module 7 Calculation Options Prepared by...
37
1 Q3D training module 7 Calculation Options Prepared by the Q3D Implementation Working Group for example only; not an official policy/guidance © ICH 2015 1 Module 7 Converting between PDEs and Concentration Limits ICH Q3D Elemental Impurities International Council for Harmonisation of Technical Requirements for Pharmaceuticals for Human Use Disclaimer: This presentation includes the authors’ views on Elemental Impurities theory and practice. The presentation does not represent official guidance or policy of authorities or industry.
-
Upload
truongnhan -
Category
Documents
-
view
219 -
download
0
Transcript of Module 7 Converting between PDEs and … · 4 Q3D training module 7 Calculation Options Prepared by...

1
Q3D training module 7 Calculation Options
Prepared by the Q3D Implementation Working Group for example only; not an official policy/guidance © ICH 2015 1
Module 7
Converting between PDEs and Concentration Limits
ICH Q3D Elemental Impurities
International Council for Harmonisation of Technical Requirements for Pharmaceuticals for Human Use
Disclaimer:This presentation includes the authors’ views on Elemental Impurities theory and practice. The presentation does not represent official guidance or policy of authorities or industry.

2
Q3D training module 7 Calculation Options
Prepared by the Q3D Implementation Working Group for example only; not an official policy/guidance © ICH 2015 2
Legal NoticeThis presentation is protected by copyright and may be used, reproduced, incorporated into other works, adapted, modified, translated or distributed under a public license provided that ICH's copyright in the presentation is acknowledged at all times. In case of any adaption, modification or translation of the presentation, reasonable steps must be taken to clearly label, demarcate or otherwise identify that changes were made to or based on the original presentation. Any impression that the adaption, modification or translation of the original presentation is endorsed or sponsored by the ICH must be avoided.
The presentation is provided "as is" without warranty of any kind. In no event shall the ICH or the authors of the original presentation be liable for any claim, damages or other liability arising from the use of the presentation.
The above-mentioned permissions do not apply to content supplied by third parties. Therefore, for documents where the copyright vests in a third party, permission for reproduction must be obtained from this copyright holder.

3
Q3D training module 7 Calculation Options
Prepared by the Q3D Implementation Working Group for example only; not an official policy/guidance © ICH 2015 3
• PDEs provide safety based limits to patient exposure.
• Q3D Section 7 provides some options for converting PDEs to concentration limits.
• Concentrations derived from PDEs may be used during the risk assessment to evaluate the significance of predicted levels of elemental impurities.
• Concentrations derived from PDEs may be used to convey the suitability of controls on elemental impurities.
General Principles (1)

4
Q3D training module 7 Calculation Options
Prepared by the Q3D Implementation Working Group for example only; not an official policy/guidance © ICH 2015 4
• “The applicant may select any of these options as long as the resulting permitted concentrations assure that the drug product does not exceed the PDEs.”
• Permitted concentrations may be used:
o As a risk assessment tool to compare observed or predicted 183
General Principles (2)

5
Q3D training module 7 Calculation Options
Prepared by the Q3D Implementation Working Group for example only; not an official policy/guidance © ICH 2015 5
• Sources to be considered when applying optionso Components of the drug product
- Drug substances & excipients
o Container/Closure systems (CCS)
o Manufacturing Equipment - When it is determined that CCS or manufacturing equipment do not
contribute to the elemental impurity level in the drug product, they are not included in the option calculations.
- When CCS or manufacturing equipment contribute to the elemental impurity levels in the drug product, the estimated daily intake from these sources may be subtracted from the PDE before calculation of the allowed concentrations in excipients and drug substances.
General Principles (3)

6
Q3D training module 7 Calculation Options
Prepared by the Q3D Implementation Working Group for example only; not an official policy/guidance © ICH 2015 6
Examples• Q3D Appendix 4 Example: solid oral product
• Parenteral product
• Inhalation product
• These examples are intended to illustrate the principles described in Section 7 of Q3D.

7
Q3D training module 7 Calculation Options
Prepared by the Q3D Implementation Working Group for example only; not an official policy/guidance © ICH 2015 7
• Maximum daily intake of drug product: 2.5 grams
• 9 components: 1 drug substance, 8 excipients
o See table on next slide for product formulation
• Drug substance: Pd and Ni catalysts
• Risk Assessment: Pb, As, Cd, Hg and V are potentially present in the drug product
Q3D Appendix 4 Example: Solid Oral Dosage Form

8
Q3D training module 7 Calculation Options
Prepared by the Q3D Implementation Working Group for example only; not an official policy/guidance © ICH 2015 8
Q3D Appendix 4 Example: Solid Oral Dosage Form
Component Daily Intake, gDrug Substance 0.200
Microcrystalline cellulose (MCC) 1.100Lactose 0.450
Ca Phosphate 0.350Crospovidone 0.265Mg Stearate 0.035
Hydroxypropylmethyl cellulose (HPMC) 0.060Titanium Dioxide 0.025
Iron Oxide 0.015Drug Product 2.500
Drug Product Formulation

9
Q3D training module 7 Calculation Options
Prepared by the Q3D Implementation Working Group for example only; not an official policy/guidance © ICH 2015 9
• Compute maximum concentration limits common to all components using a maximum daily drug product dose of 10 grams.
o Q3D table A.2.2 provides these concentrations.
• Use the Table A.2.2 concentrations and the actual mass of components to compute the maximum daily intake of elemental impurities in the drug product.
Q3D Appendix 4 Example: Option 1

10
Q3D training module 7 Calculation Options
Prepared by the Q3D Implementation Working Group for example only; not an official policy/guidance © ICH 2015 10
Option 1 Concentrations and Daily Intakes
Component Table A.2.2 Permitted Concentration (µg/g)Pb As Cd Hg Pd V Ni
Drug Substance 0.5 1.5 0.5 3 10 10 20MCC 0.5 1.5 0.5 3 10 10 20Lactose 0.5 1.5 0.5 3 10 10 20Ca Phosphate 0.5 1.5 0.5 3 10 10 20Crospovidone 0.5 1.5 0.5 3 10 10 20Mg Stearate 0.5 1.5 0.5 3 10 10 20HPMC 0.5 1.5 0.5 3 10 10 20TiO2 0.5 1.5 0.5 3 10 10 20Iron Oxide 0.5 1.5 0.5 3 10 10 20
Max. Daily Intake (µg/day) 1.25 3.75 1.25 7.5 25 25 50PDE (µg/day) 5 15 5 30 100 100 200

11
Q3D training module 7 Calculation Options
Prepared by the Q3D Implementation Working Group for example only; not an official policy/guidance © ICH 2015 11
• Compute maximum concentration limits common to all components using the maximum daily dose of the drug product.
• The Appendix 4 example considers a drug product with 2.5 gram maximum daily dose.
• PDEs from Table A.2.1 are divided by 2.5 grams to compute the maximum permissible concentration of elemental impurities in the components.
Q3D Appendix 4 Example: Option 2a

12
Q3D training module 7 Calculation Options
Prepared by the Q3D Implementation Working Group for example only; not an official policy/guidance © ICH 2015 12
Option 2a Concentrations and Daily Intakes
Component Maximum Permitted Concentration (µg/g)
Pb As Cd Hg Pd V Ni
Drug Substance 2 6 2 12 40 40 80MCC 2 6 2 12 40 40 80Lactose 2 6 2 12 40 40 80Ca Phosphate 2 6 2 12 40 40 80Crospovidone 2 6 2 12 40 40 80Mg Stearate 2 6 2 12 40 40 80HPMC 2 6 2 12 40 40 80TiO2 2 6 2 12 40 40 80Iron Oxide 2 6 2 12 40 40 80
Max. Daily Intake (µg/day) 5 15 5 30 100 100 200
PDE (µg/day) 5 15 5 30 100 100 200

13
Q3D training module 7 Calculation Options
Prepared by the Q3D Implementation Working Group for example only; not an official policy/guidance © ICH 2015 13
• The applicant proposes permissible concentrations in each component of the drug product based on prior knowledge of expected concentrations of elemental impurities in the components.
• Expected concentrations derived from:
o Published literature
o Elemental impurity limits in compendial grade materials when available
o Vendor-supplied information
o Data or information generated by the applicant
Q3D Appendix 4 Example: Option 2b

14
Q3D training module 7 Calculation Options
Prepared by the Q3D Implementation Working Group for example only; not an official policy/guidance © ICH 2015 14
Option 2b Appendix 4 Example Concentrations1
Component Concentration (µg/g)
Pb As Cd Hg Pd V Ni
Drug Substance <LoQ 0.5 <LoQ <LoQ 20 <LoQ 50MCC 0.1 0.1 0.1 0.1 * <LoQ <LoQLactose 0.1 0.1 0.1 0.1 * <LoQ <LoQCa Phosphate 1 1 1 1 * 10 5Crospovidone 0.1 0.1 0.1 0.1 * <LoQ <LoQMg Stearate 0.5 0.5 0.5 0.5 * <LoQ 0.5HPMC 0.1 0.1 0.1 0.1 * <LoQ <LoQTiO2 20 1 1 1 * 1 <LoQIron Oxide 10 10 10 10 * 2000 50
1. Example data in this table may be derived from the sources described on the previous slide.*The risk assessment determined that Pd was not a potential elemental impurity; a quantitative result was not obtained.

15
Q3D training module 7 Calculation Options
Prepared by the Q3D Implementation Working Group for example only; not an official policy/guidance © ICH 2015 15
Option 2b Appendix 4 ExampleEstimated total daily intake
Pb As Cd Hg Pd V Ni
Component
Max. Daily Intake (g)
(MDI)1. C2. MDI*C3. C MDI*C C MDI*C C MDI*C C2 MDI*C C MDI*C C MDI*C
Drug Substance 0.2 0.0 0 0.5 0.1 0.0 0 0.0 0 20 4 0 0 50 10
MCC 1.1 0.1 0.11 0.1 0.11 0.1 0.11 0.1 0.11 0 0 0 0 0.0 0
Lactose 0.45 0.1 0.045 0.1 0.045 0.1 0.045 0.1 0.045 0 0 0 0 0.0 0
Ca Phosphate 0.35 1.0 0.35 1.0 0.35 1.0 0.35 1.0 0.35 0 0 10 3.5 5.0 1.75
Crospovidone 0.265 0.1 0.027 0.1 0.027 0.1 0.027 0.1 0.027 0 0 0 0 0.0 0
Mg Stearate 0.035 0.5 0.018 0.5 0.018 0.5 0.018 0.5 0.018 0 0 0 0 0.5 0.018
HPMC 0.06 0.1 0.006 0.1 0.006 0.1 0.006 0.1 0.006 0 0 0 0 0.0 0
Titanium Dioxide 0.025 20 0.5 1.0 0.025 1.0 0.025 1.0 0.025 0 0 1 0.025 0.0 0
Iron Oxide 0.015 10 0.15 10 0.15 10 0.15 10 0.15 0 0 2000 30 50 0.75
TOTAL INTAKE4
(mg/day)1.21 0.83 0.73 0.73 4 33.53 12.52
PDE (mg/day) 5 15 5 30 100 100 200
1. Intake of component (MDI) in grams2. Concentration of elemental impurity (C) in micrograms per gram. 3. EI intake from component (MDI*C) in micrograms.4. Total Intake of EI in the drug product is the sum of EI intake from components.

16
Q3D training module 7 Calculation Options
Prepared by the Q3D Implementation Working Group for example only; not an official policy/guidance © ICH 2015 16
Potential Concentrations in ComponentsComponent Potential Concentration** (µg/g)
Pb As Cd Hg Pd V Ni
Drug Substance <LoQ 5 <LoQ <LoQ 500 <LoQ 750
MCC 0.5 5 1 5 * <LoQ <LoQ
Lactose 0.5 5 1 5 * <LoQ <LoQ
Ca Phosphate 5 5 5 35 * 70 80
Crospovidone 0.5 5 1 5 * <LoQ <LoQ
Mg Stearate 5 10 5 125 * <LoQ 100
HPMC 2.5 5 1 5 * <LoQ <LoQ
TiO2 50 40 10 35 * 20 <LoQ
Iron Oxide 50 100 50 200 * 5000 1200
Daily Intake (µg/day) 5.0 15.0 4.8 29.9 100 100 199.5
PDE (µg/day) 5 15 5 30 100 100 200
** Maximum permitted concentrations are proposed by the applicant based on expected concentrations. Other sets of concentrations may also be proposed.* The risk assessment determined that Pd was not a potential elemental impurity; a quantitative result was not obtained

17
Q3D training module 7 Calculation Options
Prepared by the Q3D Implementation Working Group for example only; not an official policy/guidance © ICH 2015 17
• Option 3 determines the permissible concentrations of elemental impurities in the finished drug product.
o Based on the mass of the maximum daily dose
Q3D Appendix 4 Example: Option 3

18
Q3D training module 7 Calculation Options
Prepared by the Q3D Implementation Working Group for example only; not an official policy/guidance © ICH 2015 18
Option 3 Concentrations
Maximum Permitted Concentration (µg/g)
Daily Intake (g) Pb As Cd Hg Pd V Ni
Drug Product 2.5 2 6 2 12 40 40 80
Maximum Daily Intake (µg/day)
5 15 5 30 100 100 200
PDE (µg/day) 5 15 5 30 100 100 200

19
Q3D training module 7 Calculation Options
Prepared by the Q3D Implementation Working Group for example only; not an official policy/guidance © ICH 2015 19
Outcome of Options
• Examples above illustrate the use of the calculation options during the risk assessment.
• Option calculations may be used as a basis for setting specifications, when appropriate
• For an element that may exceed the control threshold:
o Tables in Option 2b may provide information on primary source of elemental impurity in the drug product
20
Q3D training module 7 Calculation Options
Prepared by the Q3D Implementation Working Group for example only; not an official policy/guidance © ICH 2015 20
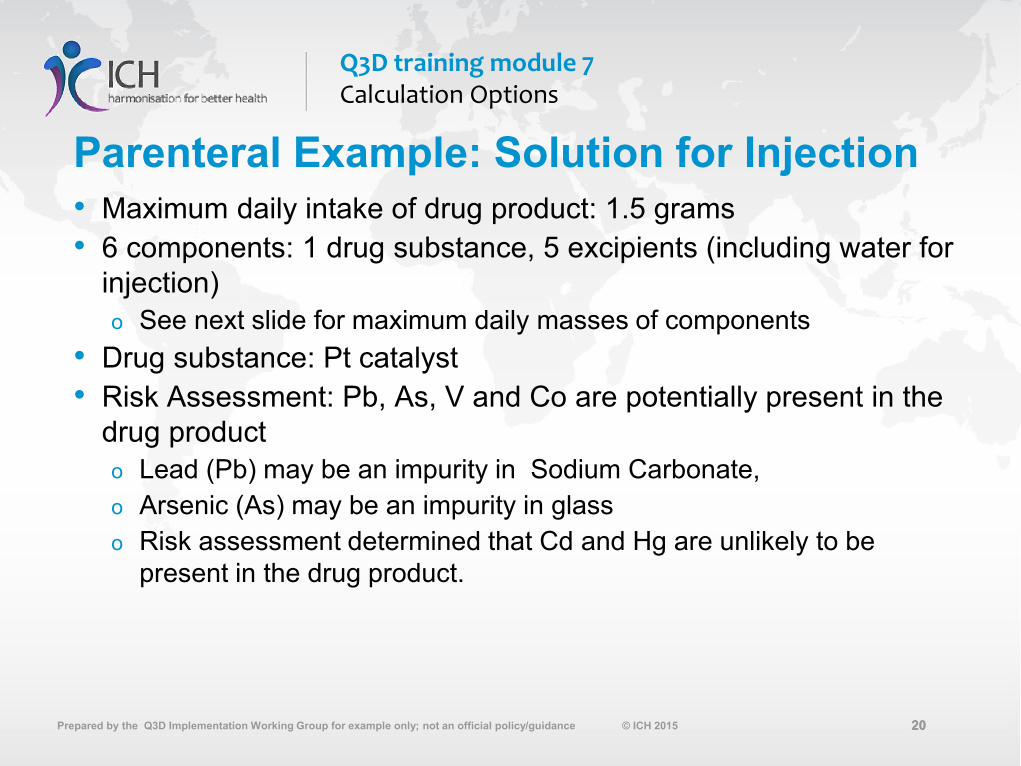
• Maximum daily intake of drug product: 1.5 grams
• 6 components: 1 drug substance, 5 excipients (including water for injection)
o See next slide for maximum daily masses of components
• Drug substance: Pt catalyst
• Risk Assessment: Pb, As, V and Co are potentially present in the drug product
o Lead (Pb) may be an impurity in Sodium Carbonate,
o Arsenic (As) may be an impurity in glass
o Risk assessment determined that Cd and Hg are unlikely to be present in the drug product.
Parenteral Example: Solution for Injection

21
Q3D training module 7 Calculation Options
Prepared by the Q3D Implementation Working Group for example only; not an official policy/guidance © ICH 2015 21
Parenteral Example: Solution for Injection
Component Daily Intake, gDrug Substance 0.01
Mannitol 0.18Polysorbate 80 0.01
Sodium Carbonate 0.1Ethanol 0.2
Water for injection 1Drug Product 1.50
Drug Product Formulation
Sodium carbonate is a potential source of Pb in the drug product.The Container is type I compendial glass, a potential source of As.

22
Q3D training module 7 Calculation Options
Prepared by the Q3D Implementation Working Group for example only; not an official policy/guidance © ICH 2015 22
Solution for Injection: Consideration of As in Glass
• Estimated maximum contribution of arsenic in glass to drug product: 1 microgram.
• Established parenteral PDE for As: 15 micrograms/day
• Permitted daily exposure from drug substance and excipients: 15 -1 = 14 micrograms/day
Example for illustrative purposes only.

23
Q3D training module 7 Calculation Options
Prepared by the Q3D Implementation Working Group for example only; not an official policy/guidance © ICH 2015 23
Parenteral Example: Option 1 Concentrations and Daily Intakes
Component Maximum Permitted Concentration (µg/g)
Pb As Cd Hg Pt V Co
Drug Substance 0.5 1.5 0.2 0.3 1.0 1.0 0.5Mannitol 0.5 1.5 0.2 0.3 1.0 1.0 0.5
Polysorbate 80 0.5 1.5 0.2 0.3 1.0 1.0 0.5Sodium Carbonate 0.5 1.5 0.2 0.3 1.0 1.0 0.5
Ethanol 0.5 1.5 0.2 0.3 1.0 1.0 0.5Water for injection 0.5 1.5 0.2 0.3 1.0 1.0 0.5
Max. Daily Intake (µg/day) 0.8 2.3 0.3 0.5 1.5 1.5 0.8PDE (µg/day) 5 141 2 3 10 10 5
1. The permitted daily exposure has been adjusted to subtract the contribution from container/closure system.
24
Q3D training module 7 Calculation Options
Prepared by the Q3D Implementation Working Group for example only; not an official policy/guidance © ICH 2015 24
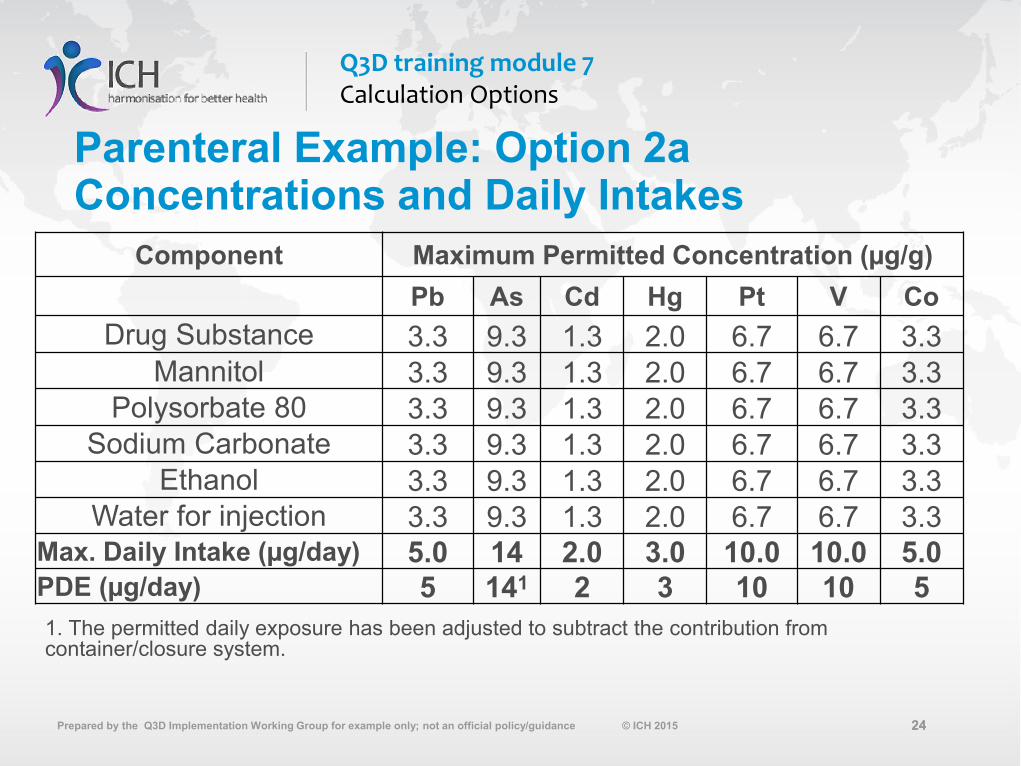
Parenteral Example: Option 2a Concentrations and Daily Intakes
Component Maximum Permitted Concentration (µg/g)
Pb As Cd Hg Pt V Co
Drug Substance 3.3 9.3 1.3 2.0 6.7 6.7 3.3Mannitol 3.3 9.3 1.3 2.0 6.7 6.7 3.3
Polysorbate 80 3.3 9.3 1.3 2.0 6.7 6.7 3.3Sodium Carbonate 3.3 9.3 1.3 2.0 6.7 6.7 3.3
Ethanol 3.3 9.3 1.3 2.0 6.7 6.7 3.3Water for injection 3.3 9.3 1.3 2.0 6.7 6.7 3.3
Max. Daily Intake (µg/day) 5.0 14 2.0 3.0 10.0 10.0 5.0PDE (µg/day) 5 141 2 3 10 10 5
1. The permitted daily exposure has been adjusted to subtract the contribution from container/closure system.

25
Q3D training module 7 Calculation Options
Prepared by the Q3D Implementation Working Group for example only; not an official policy/guidance © ICH 2015 25
Parenteral Example: Option 2b Expected Concentrations
Component Observed Concentration (µg/g)
Pb As Cd Hg Pt V Co
Drug Substance <LOQ <LOQ <LOQ <LOQ 1 1 0.5
Mannitol <LOQ <LOQ <LOQ <LOQ * <LOQ <LOQ
Polysorbate 80 <LOQ <LOQ <LOQ <LOQ * <LOQ <LOQ
Sodium Carbonate 2 1 0.2 <LOQ * 0.1 0.1
Ethanol <LOQ <LOQ <LOQ <LOQ * <LOQ <LOQ
Water for injection 0.003 0.001 <LOQ <LOQ * <LOQ 0.001
* The risk assessment determined that Pd was not a potential elemental impurity; a quantitative result was not obtained

26
Q3D training module 7 Calculation Options
Prepared by the Q3D Implementation Working Group for example only; not an official policy/guidance © ICH 2015 26
Parenteral Example: Option 2b Exposures from Expected Concentrations
Pb As Cd Hg Pt V Co
Component MDI1 C2 MDI*C3 C MDI*C C MDI*C C MDI*C C MDI*C C MDI*C C MDI*C
Drug Substance 0.01 0 0 0 0 0 0 0 0 1 0.01 1 0.01 0.5 0.005
Mannitol 0.18 0 0 0 0 0 0 0 0 0 0 0 0 0 0
Polysorbate 80 0.01 0 0 0 0 0 0 0 0 0 0 0 0 0 0
Sodium Carbonate 0.10 2 0.2 1 0.1 0.2 0.02 0 0 0 0 0.1 0.01 0.1 0.01
Ethanol 0.20 0 0 0 0 0 0 0 0 0 0 0 0 0 0
Water for Injection 1.00 0.003 ` 0.001 0.001 0 0 0 0 0 0 0 0 1 1
TOTAL INTAKE4
(mg/day)1.50 0.20 0.10 0.02 0.00 0.01 0.02 1.02
PDE(mg/day) 5 145 2 3 10 10 5
1. Maximum Daily Intake of component (MDI) in grams2. Concentration of elemental impurity (C) in micrograms per gram. 3. EI intake from component (MDI*C) in micrograms.4. Total Intake of EI in the drug product is the sum of EI intake from components.5. Use adjusted PDE for arsenic that accounts for contribution from container.

27
Q3D training module 7 Calculation Options
Prepared by the Q3D Implementation Working Group for example only; not an official policy/guidance © ICH 2015 27
Parenteral Example: Option 2b Proposed Concentrations
Component Potential Concentration (µg/g)**
Pb As Cd Hg Pt V Co
Drug Substance 0.01 <LOQ <LOQ <LOQ 5 5 5
Mannitol 0.01 <LOQ <LOQ <LOQ * <LOQ <LOQ
Polysorbate 80 0.01 <LOQ <LOQ <LOQ * <LOQ <LOQ
Sodium Carbonate 10 5 1 <LOQ * 1 1
Ethanol 0.01 <LOQ <LOQ <LOQ * <LOQ <LOQ
Water for injection 0.03 0.01 <LOQ <LOQ * <LOQ 0.01
Max. Daily Intake (µg/day) 1.03 0.51 0.1 0 0.05 0.15 0.16
PDE (µg/day) 5 14 2 3 10 10 5
** Maximum permitted concentrations are proposed by the applicant based on expected concentrations. Other sets of concentrations may also be proposed.* The risk assessment determined that Pt was not a potential elemental impurity; a quantitative result was not obtained.
28
Q3D training module 7 Calculation Options
Prepared by the Q3D Implementation Working Group for example only; not an official policy/guidance © ICH 2015 28
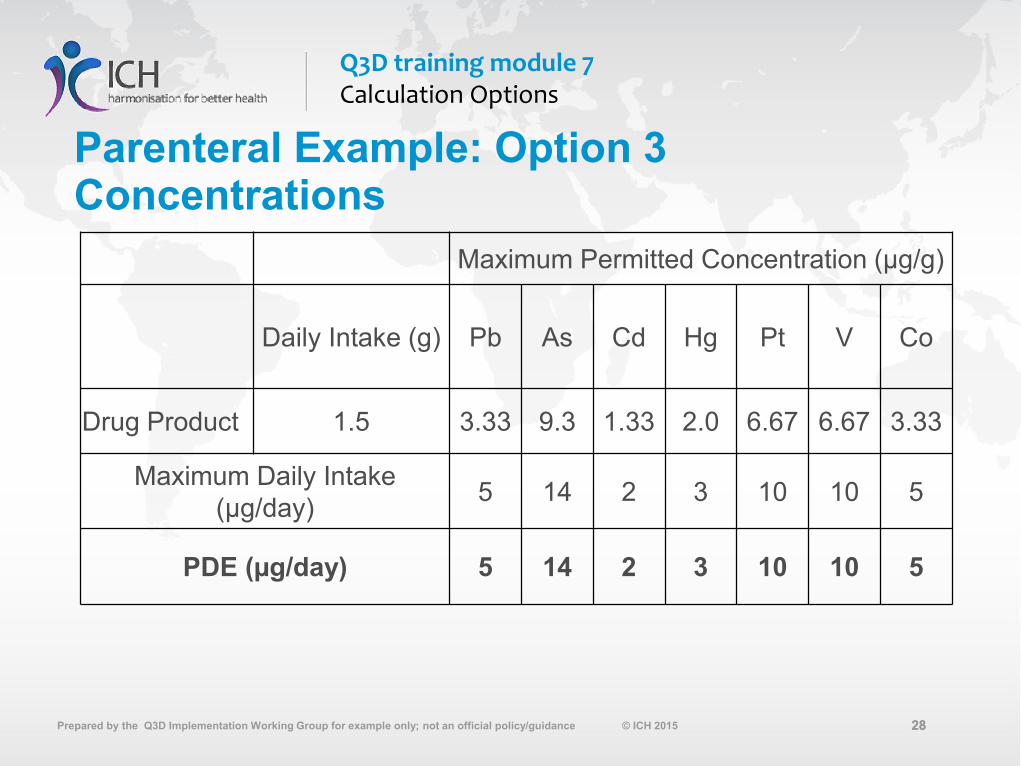
Parenteral Example: Option 3 Concentrations
Maximum Permitted Concentration (µg/g)
Daily Intake (g) Pb As Cd Hg Pt V Co
Drug Product 1.5 3.33 9.3 1.33 2.0 6.67 6.67 3.33
Maximum Daily Intake (µg/day)
5 14 2 3 10 10 5
PDE (µg/day) 5 14 2 3 10 10 5

29
Q3D training module 7 Calculation Options
Prepared by the Q3D Implementation Working Group for example only; not an official policy/guidance © ICH 2015 29
• Maximum daily intake drug product: 0.1733 grams
• 4 components: 1 drug substance, 3 excipients (including water for injection)
o See following slide for maximum daily mass of components
• Risk Assessment
o Co, V and Cu are potentially contributed from container/closure system
o Drug product synthesis uses Cd.
Inhalation Example

30
Q3D training module 7 Calculation Options
Prepared by the Q3D Implementation Working Group for example only; not an official policy/guidance © ICH 2015 30
Inhalation Example
Component Daily Intake, gDrug Substance 0.0003
Polysorbate 0.1100NaCl 0.0030
Water for injection 0.0600Drug Product 0.1733
Drug Product Formulation

31
Q3D training module 7 Calculation Options
Prepared by the Q3D Implementation Working Group for example only; not an official policy/guidance © ICH 2015 31
Consideration of elemental impurities contributed from container/closure
• Maximum expected contributions from container/closure system
o Co: 0.5 micrograms
o V: 0.25 micrograms
o Cu: 1 microgram
o Adjusted PDEs- Co = 3 – 0.5 = 2.5
- V = 1 – 0.25 = 0.75
- Cu = 30 – 1 = 29
Example for Illustrative purposes only.
32
Q3D training module 7 Calculation Options
Prepared by the Q3D Implementation Working Group for example only; not an official policy/guidance © ICH 2015 32
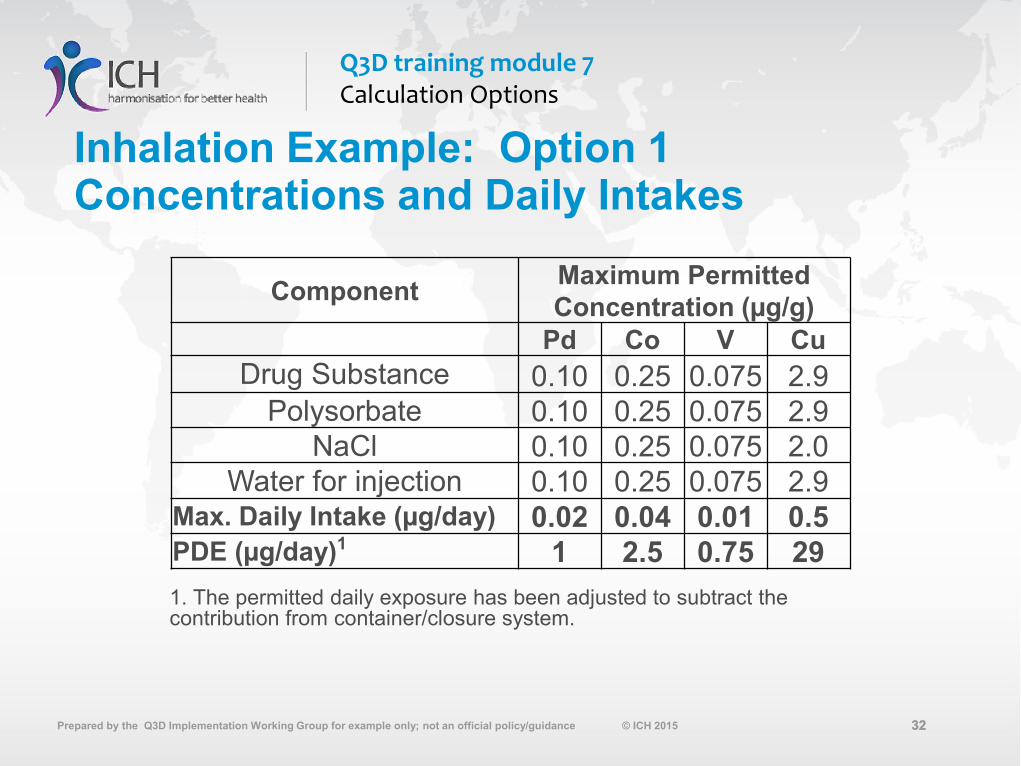
Inhalation Example: Option 1 Concentrations and Daily Intakes
ComponentMaximum Permitted Concentration (µg/g)
Pd Co V Cu
Drug Substance 0.10 0.25 0.075 2.9Polysorbate 0.10 0.25 0.075 2.9
NaCl 0.10 0.25 0.075 2.0Water for injection 0.10 0.25 0.075 2.9
Max. Daily Intake (µg/day) 0.02 0.04 0.01 0.5PDE (µg/day)1 1 2.5 0.75 29
1. The permitted daily exposure has been adjusted to subtract the contribution from container/closure system.

33
Q3D training module 7 Calculation Options
Prepared by the Q3D Implementation Working Group for example only; not an official policy/guidance © ICH 2015 33
Inhalation Example: Option 2a Concentrations and Daily Intakes
ComponentMaximum Permitted Concentration (µg/g)
Pd Co V Cu
Drug Substance 5.8 14.42 4.32 167.3Polysorbate 5.8 14.42 4.32 167.3
NaCl 5.8 14.42 4.32 167.3Water for injection 5.8 14.42 4.32 167.3
Max. Daily Intake (µg/day) 1 2.5 0.75 29PDE (µg/day)1 1 2.5 0.75 29
1. Use the adjusted permitted daily exposure that accounts for contribution from container/closure system
34
Q3D training module 7 Calculation Options
Prepared by the Q3D Implementation Working Group for example only; not an official policy/guidance © ICH 2015 34
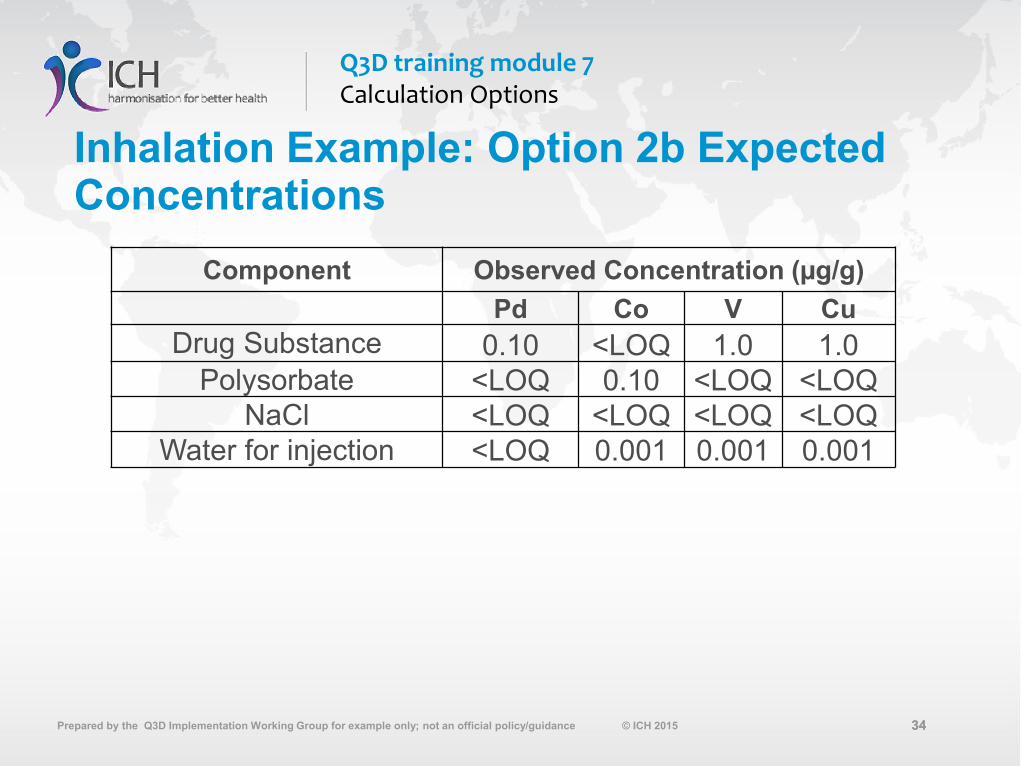
Inhalation Example: Option 2b Expected Concentrations
Component Observed Concentration (µg/g)
Pd Co V Cu
Drug Substance 0.10 <LOQ 1.0 1.0Polysorbate <LOQ 0.10 <LOQ <LOQ
NaCl <LOQ <LOQ <LOQ <LOQWater for injection <LOQ 0.001 0.001 0.001

35
Q3D training module 7 Calculation Options
Prepared by the Q3D Implementation Working Group for example only; not an official policy/guidance © ICH 2015 35
Inhalation Example: Option 2b Exposures from Expected Concentrations
Pd Co V Cu
ComponentMax. Daily
Intake (MDI)1 C2 MDI*C3 C MDI*C C MDI*C C MDI*C
Drug Substance 0.0003 0 0 0 0 1 0.0003 1 0.0003
Polysorbate 0.11 0.1 0.011 0.1 0.011 0 0 0 0
NaCl 0.003 0 0 0 0 0 0 0 0
Water for Injection 0.06 0.001 6E-05 0.001 6E-05 0.001 6E-05 0.001 6E-05
TOTAL INTAKE (mg/day)4 0.1733 0.01 0.01 0.00 0.00
PDE (mg/day)5 1 2.5 0.75 29 1 2.5 0.75 29
1. Maximum Daily Intake of component (MDI) in grams2. Concentration of elemental impurity (C) in micrograms per gram. 3. EI intake from component (MDI*C) in micrograms.4. Total Intake of EI in the drug product is the sum of EI intake from components.5. Use adjusted PDE for arsenic that accounts for contribution from container.

36
Q3D training module 7 Calculation Options
Prepared by the Q3D Implementation Working Group for example only; not an official policy/guidance © ICH 2015 36
Inhalation Example: Option 2b Proposed Concentrations
Component Potential Concentrations (µg/g)
Pd Co V Cu
Drug Substance 0 0 10 10Polysorbate 1.0 1.0 0 0
NaCl 0 0 0 0Water for injection 0.01 0.01 0.01 0.01
Max. Daily Intake (µg/day) 0.11 0.11 0.004 0.004PDE (µg/day)1 1 2.5 0.75 29
1. Use adjusted PDE for arsenic that accounts for contribution from container.

37
Q3D training module 7 Calculation Options
Prepared by the Q3D Implementation Working Group for example only; not an official policy/guidance © ICH 2015 37
Inhalation Example: Option 3 Concentrations
Maximum Permitted Concentration (µg/g)
Daily Intake (g) Pd Co V Cu
Drug Product 0.1733 5.8 14.42 4.32 167.3
PDE (µg/day) 1 2.5 0.75 29