Module 21 Operational Budgeting and Profit Planning.
23
Module 21 Operational Budgeting and Profit Planning
-
Upload
austen-holland -
Category
Documents
-
view
226 -
download
2
Transcript of Module 21 Operational Budgeting and Profit Planning.

Module 21
Operational Budgeting and Profit Planning

Budget
Financial plan for an organization Operating plans: sales, purchasing,
production, selling, general, and administrative expenses
Cash inflows/outflows Ends with complete financial reports:
income statement & balance sheet, cash flow statement, stockholders equity.

Typical Process for a Merchandiser
Selling Expense Budget
Pro Forma StatementsIncome Statement & Balance Sheet
Sales Budget
Purchases Budget
Special Budgets
General and Administrative
Expense Budget
Cash Budget

Sales Budget Sales plan is the starting point for
the budgeting process Includes a forecast of sales revenue Normally includes a forecast of unit
sales The best available information is
used to forecast sales: Market conditions in sales territories by
period Merchandise lines available Promotion and advertising plans Expected pricing policies (markups)
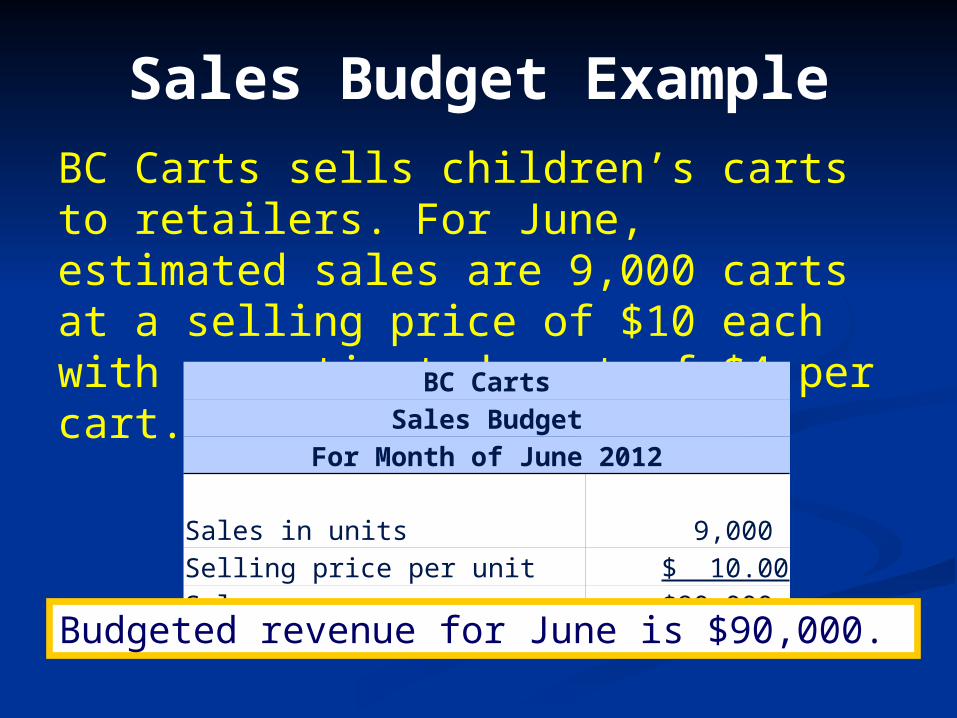
Sales Budget ExampleBC Carts sells children’s carts to retailers. For June, estimated sales are 9,000 carts at a selling price of $10 each with an estimated cost of $4 per cart. BC Carts
Sales BudgetFor Month of June 2012
Sales in units 9,000 Selling price per unit $ 10.00Sales revenue $90,000
Budgeted revenue for June is $90,000.
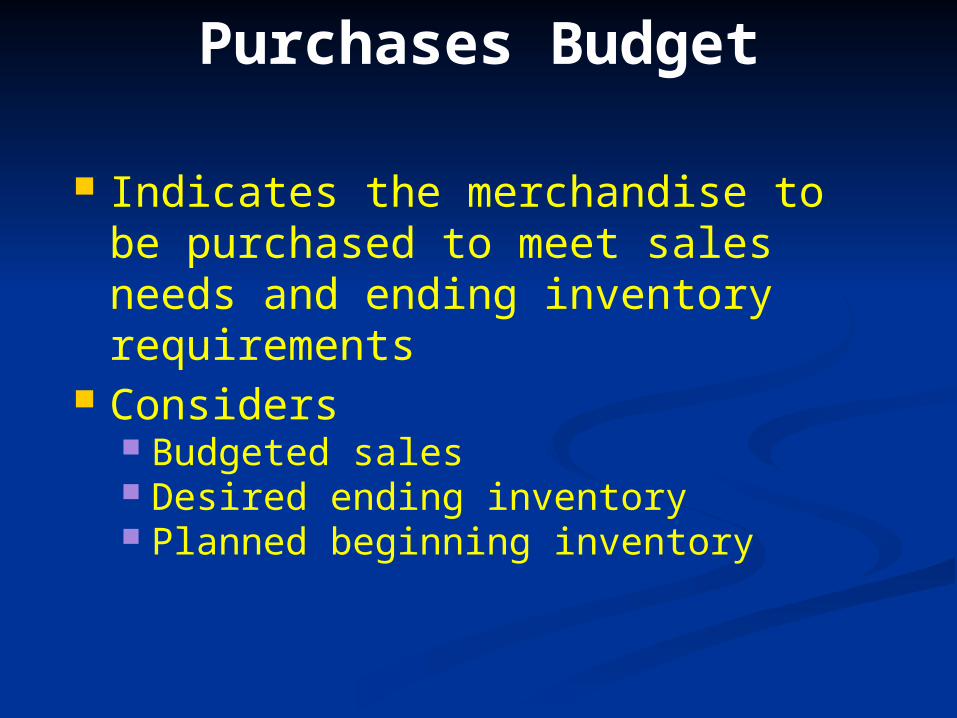
Purchases Budget
Indicates the merchandise to be purchased to meet sales needs and ending inventory requirements
Considers Budgeted sales Desired ending inventory Planned beginning inventory

Purchases Budget Example
BC Carts desires to have 20% of the carts needed for the next month’s sales in stock at the end of each month. At the beginning of June, 1,800 carts are on hand. Each cart costs $4. Sales are planned to increase 10% per month. BC Carts
Purchases BudgetFor Month of June 2012
Units Dollars
Sales needs 9,000. $36,000.Desired ending inventory 1,980. 7,920.Total 10,980. 43,920. Less beginning inventory (1,800) (7,200)Purchases 9,180. $36,720.
Number of units times the cost per
unit of $4
Sales for July: 9,000 + (9,000 × 0.10) = 9,900 cartsEnding inventory = 9,900 × 0.20 = 1,980 carts

Selling Expense
Presents the expenses the organization plans to incur in connection with sales and distribution
Costs are broken into variable and fixed costs
Variable selling costs Developed as a percent of sales or an
amount per unit sold Fixed selling costs
Often based on an estimate obtained from the sales manager

Selling Expense Budget Example
BC CartsSelling Expense BudgetFor Month of June 2012
Budgeted sales $90,000Variable selling expenses Commissions (4%) $3,600 Miscellaneous (1.5%) 1,350 Total variable expenses 4,950Fixed selling expenses Depreciation 3,500 Advertising 2,000 Miscellaneous 1,200 Total fixed expenses 6,700 Total selling expenses $11,650
BC Carts estimates commissions at 4%
of sales and miscellaneous
variable costs at 1.5%. Estimated
fixed selling costs are $3,500 for
depreciation, $2,000 for advertising, and
$1,200 for miscellaneous costs.
BC Carts estimates commissions at 4%
of sales and miscellaneous
variable costs at 1.5%. Estimated
fixed selling costs are $3,500 for
depreciation, $2,000 for advertising, and
$1,200 for miscellaneous costs.
Commissions: $90,000 × 0.04 = $3,600 Miscellaneous: $90,000 × 0.015 = $1,350

General and Administrative Expense Budget
Presents the expenses planned in connection with the general administration of the organization
Example expenses: Compensation Insurance Depreciation Utilities Miscellaneous

General and Administrative Expense
Budget ExampleBC Carts estimates the following monthly general and administrative costs: $5,000 for salaries, $800 for insurance, $1,100 for depreciation, $600 for utilities, and $900 for miscellaneous.
BC CartsGeneral and Administrative Expense Budget
For Month of June 2012Salaries $5,000Insurance 800Depreciation 1,100Utilities 600Miscellaneous 900Total general and administrative expenses $8,400

Cash Budget Summarizes all cash receipts and
disbursements expected to occur during the budget period
Because of issues related to the timing of sales and collections on account Collections on sales do not equal sales
revenue Because of issues related to the
timing of payments for purchases and other expense items Disbursements do not equal expenses

Cash Receipts Budget Example
BC Carts budgeted its June sales at $90,000. It estimates that 40% of sales are cash and 60% are on credit. 30% of credit sales are collected in the month of sale and 70% are collected in the following month. Beginning cash balance is $15,000 and sales during May were $86,000.
30% Collected current month30% Collected current month
70% Collected following month70% Collected following month
$86,000 × 0.60 × 0.70 = $36,120
Collections on sales
Cash sales $36,000
Credit sales
Current month (30% of credit sales) 16,200
Prior month (70% of credit sales) 36,120
Total $88,320
40% Cash Sales40% Cash Sales
CASH RECEIPTS BUDGET FOR JUNE, 2012CASH RECEIPTS BUDGET FOR JUNE, 2012
$90,000 × 0.60 × 0.30 = $16,200
$90,000 × 0.40$90,000 × 0.40
SalesSales60% Credit Sales60% Credit Sales

Cash Disbursements Budget Example
BC Carts estimates that 25% of its current month inventory purchases will be paid during the month incurred and 75% are paid in the following month. During May, purchases were $32,000. Budgeted purchases for June are $36,720 (from the purchases budget.)
Continued
CASH DISBURSEMENTS BUDGET FOR JUNE, 2012CASH DISBURSEMENTS BUDGET FOR JUNE, 2012
Disbursements
Purchases
Current month (25% of purchases) $ 9,180
Prior month (75% of purchases) 24,000
Total $33,180
Inventory purchases section of the cash disbursements section of the cash budget:
Inventory purchases section of the cash disbursements section of the cash budget:
$36,720 × 0.25 = $9,180$36,720 × 0.25 = $9,180
$32,000 × 0.75 = $24,000$32,000 × 0.75 = $24,000
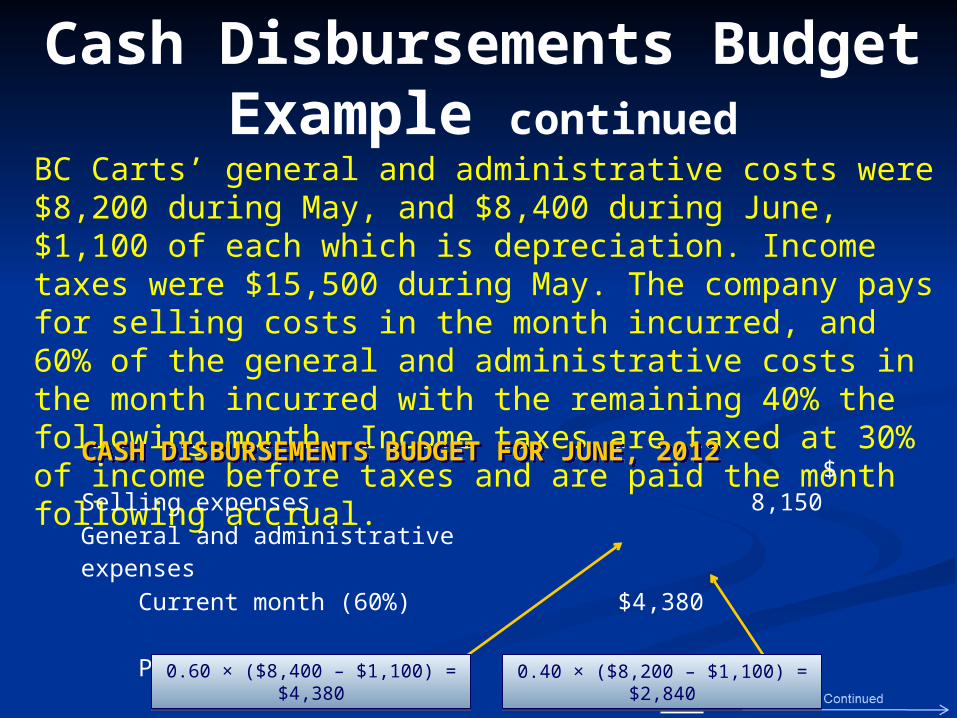
Cash Disbursements Budget Example continued
BC Carts’ general and administrative costs were $8,200 during May, and $8,400 during June, $1,100 of each which is depreciation. Income taxes were $15,500 during May. The company pays for selling costs in the month incurred, and 60% of the general and administrative costs in the month incurred with the remaining 40% the following month. Income taxes are taxed at 30% of income before taxes and are paid the month following accrual. Selling expenses $ 8,150
General and administrative expenses Current month (60%) $4,380 Prior month (40%) 2,840 Income taxes 15,500 General and administrative expenses 22,720
CASH DISBURSEMENTS BUDGET FOR JUNE, 2012CASH DISBURSEMENTS BUDGET FOR JUNE, 2012
0.40 × ($8,200 – $1,100) = $2,8400.40 × ($8,200 – $1,100) = $2,8400.60 × ($8,400 – $1,100) = $4,3800.60 × ($8,400 – $1,100) = $4,380

Financing Section of Cash Budget
BC Carts’ repays $5,000 of the principal on its bank loan on June 30 and December 31, and any accrued interest.
Short-term financing Loan repayments $5,000 Interest 750
Net cash used for financing $5,750
CASH DISBURSEMENTS BUDGET FOR JUNE, 2012CASH DISBURSEMENTS BUDGET FOR JUNE, 2012
$25,000 × 0.06 × 1/2 $25,000 × 0.06 × 1/2

Budgeted Financial Statements
Pro forma income statement and balance sheet that reflect the “as-if” effects of the budgeted activities on the actual financial position of organization
Reflect the results if all budgetary projections are correct
If income not good enough for top management, then start process again

Production Budget
Additional steps are required to develop master budgets for manufacturing organizations Due to conversion of raw materials into
finished goods Must determine production volume
To support sales To meet finished goods inventory
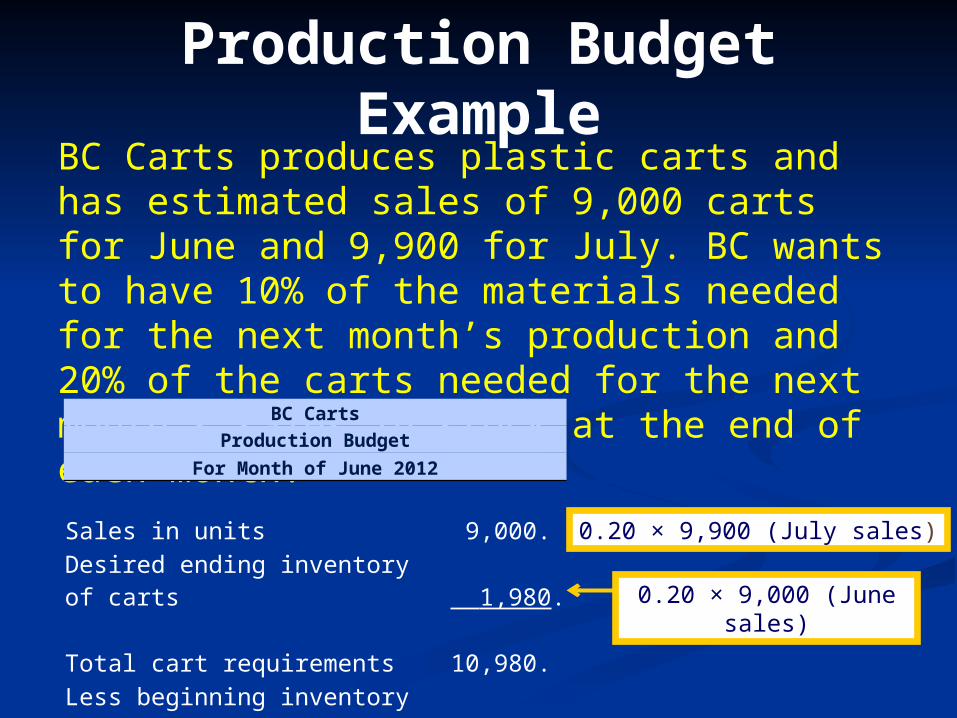
Production Budget Example
BC Carts produces plastic carts and has estimated sales of 9,000 carts for June and 9,900 for July. BC wants to have 10% of the materials needed for the next month’s production and 20% of the carts needed for the next month’s sales in stock at the end of each month. BC Carts
Production Budget
For Month of June 2012
Sales in units 9,000. Desired ending inventory of carts 1,980. Total cart requirements 10,980. Less beginning inventory of carts (1,800)Budgeted production 9,180.
0.20 × 9,000 (June sales)
0.20 × 9,900 (July sales)

Purchases Budget Example
Assume BC Carts plans to produce 10,098 carts in July. It wants to have 10% of the materials needed for the next month’s production in stock at the end of each month. Each cart requires 6 pounds of plastic resin and two wheels. At June 1, BC had 5,508 pounds of resin and 1,836 wheels on hand. Wheels cost $0.30 each and resin costs $0.21 per pound. BC Carts
Purchases Budget
For Month of June 2012
Resin: Pounds of resin needs (6 lbs. x 9,180 carts) 55,080. Desired ending resin inventory 6,059. Total resin requirements in pounds 61,139. Less beginning resin inventory (5,508)Resin purchases in pounds 55,631.
Continued
6 × 10,098 × 0.10
given
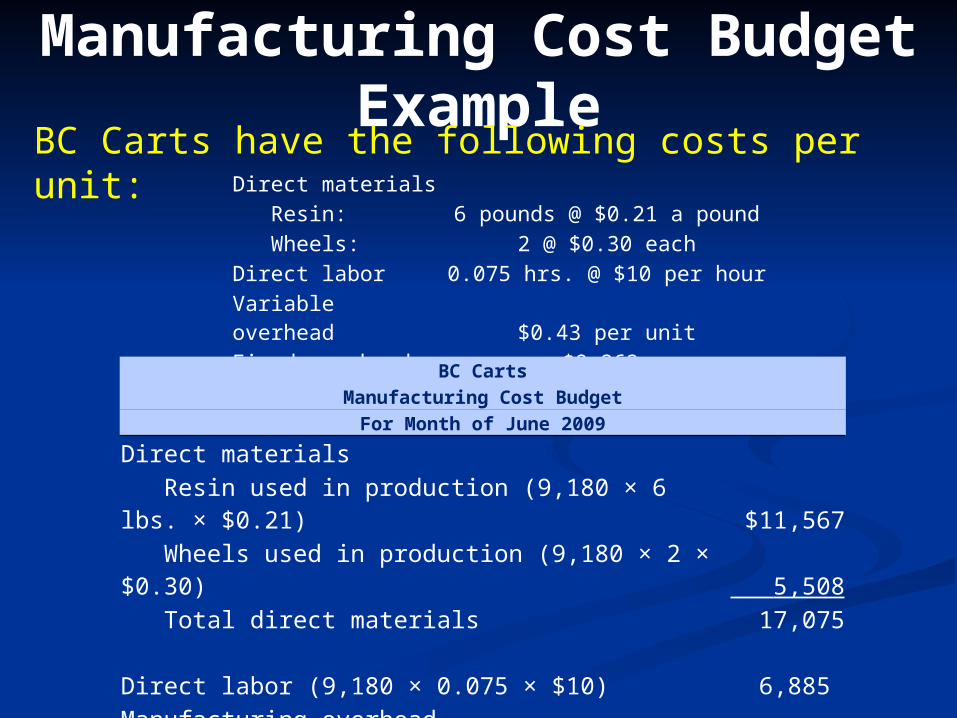
Manufacturing Cost Budget Example
BC Carts have the following costs per unit: Direct materials Resin: 6 pounds @ $0.21 a pound Wheels: 2 @ $0.30 eachDirect labor 0.075 hrs. @ $10 per hourVariable overhead $0.43 per unitFixed overhead $8,262
BC CartsManufacturing Cost Budget
For Month of June 2009
Direct materials Resin used in production (9,180 × 6 lbs. × $0.21) $11,567 Wheels used in production (9,180 × 2 × $0.30) 5,508 Total direct materials 17,075Direct labor (9,180 × 0.075 × $10) 6,885 Manufacturing overhead Variable ($0.43 per unit) 3,947 Fixed 8,262 Total manufacturing costs $36,169

Approaches to Budgeting
Input-output: Planned sales volumes and required inputs
Incremental: Add an increment to past year Example: Increase budgets by 3%.
Zero-based: Every $ justified starting at 0 for everything.
Activity-based: Project sales volume to activity and budget the $ based on activity cost
Rolling (continuous) example: each month, redo each of the next 12 monthly budgets

Participation Extent to which lower level personnel
involved with the budget process: participative or bottom up approach Alternative is top-down or imposed budgets Both approaches require top management
involvement
Since budgets used in performance measures, participation often results in budgetary slack: padding built in to expense or revenue estimates. Slack can provide needed flexibility when
situation has high uncertainty.