Modulation of the Chromatin Phosphoproteome by the Haspin Protein Kinase
57
" Title: Modulation of the chromatin phosphoproteome by the Haspin protein kinase Alessio Maiolica 1 , Maria De Medina Redondo 2 , Erwin M. Schoof 3 , Apirat Chaikuad 4 , Fabrizio Villa 5 , Marco Gatti 6 , Siva Jeganatgan 7 , Hua Jane Lou 8 , Karel Novy 1 , Simon Hauri 1 , Umut H. Toprak 2 , Franz Herzog 9 Patrick Meraldi 2 , Lorenza Penengo 6 , Benjamin E. Turk 8 , Stefan Knapp 4 , Rune Linding 3 , Ruedi Aebersold 1,10 1 Department of Biology, Institute of Molecular Systems Biology, ETH Zurich, Zurich, Switzerland. 2 Department of Physiology and Metabolism, Faculty of Medicine, University of Geneva, Geneva, Switzerland 3 Cellular Signal Integration Group (C-SIG), Center for Biological Sequence Analysis (CBS), Department of Systems Biology, Technical University of Denmark (DTU), Lyngby, Denmark. 4 Oxford University, Nuffield Department of Clinical Medicine, Target Discovery Institute (TDI) and Structural Genomics Consortium (SGC), Oxford OX3 7FZ, United Kingdom. 5 Department of Experimental Oncology, European Institute of Oncology, Milan, Italy 6 Department of Pharmaceutical Sciences, University of Piemonte Orientale “A. Avogadro” Novara, Italy 7 Department of Mechanistic Cell Biology, Max Planck Institute of Molecular Physiology, Dortmund, Germany 8 Yale University School of Medicine, Department of Pharmacology, New Haven, CT 06520, USA 9 Gene Center Munich Ludwig-Maximilians-Universität München, Munich, Germany 10 Faculty of Science, University of Zurich, Zurich, Switzerland Running title: Chromatin phosphoproteome modulation by Haspin kinase Corresponding author: Prof. Ruedi Aebersold Department of Biology, Institute of Molecular Systems Biology HPT E 51 Auguste-Piccard Court 1 CH- 8093 Zurich SWITZERLAND Fax: +41 44 633 10 51 E-Mail: [email protected] Keywords: Haspin, GSG2, kinase substrates, phosphoproteomic, in vitro kinase reaction MCP Papers in Press. Published on April 14, 2014 as Manuscript M113.034819 Copyright 2014 by The American Society for Biochemistry and Molecular Biology, Inc.
Transcript of Modulation of the Chromatin Phosphoproteome by the Haspin Protein Kinase

! "!
Title: Modulation of the chromatin phosphoproteome by the Haspin protein kinase Alessio Maiolica1, Maria De Medina Redondo2, Erwin M. Schoof3, Apirat
Chaikuad4, Fabrizio Villa5, Marco Gatti6, Siva Jeganatgan7, Hua Jane Lou8,
Karel Novy1, Simon Hauri1, Umut H. Toprak2, Franz Herzog9 Patrick Meraldi2,
Lorenza Penengo6, Benjamin E. Turk8, Stefan Knapp4, Rune Linding3, Ruedi
Aebersold1,10 1Department of Biology, Institute of Molecular Systems Biology, ETH Zurich, Zurich, Switzerland. 2Department of Physiology and Metabolism, Faculty of Medicine, University of Geneva, Geneva, Switzerland 3Cellular Signal Integration Group (C-SIG), Center for Biological Sequence Analysis (CBS), Department of Systems
Biology, Technical University of Denmark (DTU), Lyngby, Denmark. 4Oxford University, Nuffield Department of Clinical Medicine, Target Discovery Institute (TDI) and Structural
Genomics Consortium (SGC), Oxford OX3 7FZ, United Kingdom. 5Department of Experimental Oncology, European Institute of Oncology, Milan, Italy 6Department of Pharmaceutical Sciences, University of Piemonte Orientale “A. Avogadro” Novara, Italy 7Department of Mechanistic Cell Biology, Max Planck Institute of Molecular Physiology, Dortmund, Germany 8Yale University School of Medicine, Department of Pharmacology, New Haven, CT 06520, USA 9Gene Center Munich Ludwig-Maximilians-Universität München, Munich, Germany 10Faculty of Science, University of Zurich, Zurich, Switzerland
Running title: Chromatin phosphoproteome modulation by Haspin kinase Corresponding author: Prof. Ruedi Aebersold
Department of Biology,
Institute of Molecular Systems Biology
HPT E 51
Auguste-Piccard Court 1
CH- 8093 Zurich
SWITZERLAND
Fax: +41 44 633 10 51
E-Mail: [email protected]
Keywords: Haspin, GSG2, kinase substrates, phosphoproteomic, in vitro kinase reaction
MCP Papers in Press. Published on April 14, 2014 as Manuscript M113.034819
Copyright 2014 by The American Society for Biochemistry and Molecular Biology, Inc.

! #!
Abstract
Recent discoveries have highlighted the importance of Haspin kinase activity
for the correct positioning of the kinase Aurora B at the centromere. Haspin
phosphorylates Thr3 of the histone H3 (H3), which provides a signal for
Aurora B to localize to the centromere of mitotic chromosomes. To date
histone H3 is the only confirmed Haspin substrate. We used a combination of
biochemical, pharmacological and mass spectrometric approaches to study
the consequences of Haspin inhibition in mitotic cells. We quantified 3964
phosphorylation sites on chromatin-associated proteins and identified a
Haspin protein-protein interaction network. We determined the Haspin
consensus motif and the co-crystal structure of the kinase with the histone H3
tail. The structure revealed a unique bent substrate binding mode positioning
the histone H3 residues Arg2 and Lys4 adjacent to the Haspin phosphorylated
threonine into acidic binding pockets. This unique conformation of the kinase-
substrate complex explains the reported modulation of Haspin activity by
methylation of Lys4 of the histone H3. In addition, the identification of the
structural basis of substrate recognition and the amino acid sequence
preferences of Haspin aided the identification of novel candidate Haspin
substrates. In particular, we validated the phosphorylation of Ser137 of the
histone variant macroH2A as a target of Haspin kinase activity. MacroH2A
Ser137 resides in a basic stretch of about 40 amino acids that is required to
stabilize extranucleosomal DNA, suggesting that phosphorylation of Ser137
might regulate the interactions of macroH2A and DNA. Overall, our data
suggest that Haspin activity affects the phosphorylation state of proteins
involved in gene expression regulation and splicing.

! $!
Introduction
Eukaryotic protein kinases (ePK) constitute a large family of enzymes that
coordinate virtually any cellular processes by the phosphorylation of their
target proteins at specific sites (1, 2). Active kinases often modulate the
activity other enzymes, including other kinases, thus amplifying and extending
an initial signal that affect sometimes thousands of proteins (3). This creates a
highly complex network of feedback and forward loops where multiple kinases
can mutually influence each other’s activity. Kinases adopt three molecular
strategies to select and specifically phosphorylate their substrates in the
crowded environment of a cell (2). First, tight control of cellular kinase
localization assures that only proteins present in the close proximity of the
kinase can be phosphorylated; second, the kinase specific activity can be
regulated via post-translational modifications or the recruitment of cofactor
molecules; and third, the recognition of specific consensus motifs on
substrates ensures that phosphorylation only occurs at the intended site/s (2).
The Haspin kinase is a member of the ePK family that structurally diverges
from most ePK’s (1, 4). The Haspin kinase domain displays structural features
that have never been observed in other ePK family members (5, 6).
Specifically, the possibility of activation loop phosphorylation, a frequent
regulatory mechanisms to control kinase activity, is absent in Haspin (5).
Haspin is characterized by an active conformation that is stabilized by a
hydrophobic lock of the helix aC inducing a stable S conformation of the
structurally unique activation segment. These specific structural features also
create a structurally diverse substrate binding site comprising a highly

! %!
electronegative cleft for the histone H3 basic tails (5). Interestingly, the
recognition of H3 has been shown to be modulated by methylation at H3
residue Lys4, thus coupling Haspin activity with epigenetic mechanisms of
chromatin regulation (5). Histone H3 which is phosphorylated at Thr3 is so far
the only well-characterized Haspin substrate (7). H3Thr3 phosphorylation
(H3Thr3ph) is required for the localization of Aurora B at the centromere (8-10).
Inactivation of Haspin catalytic activity by ATP mimetic inhibitors induces
Aurora B centromeric delocalization, leading to a loss of phosphorylation in
chromatin associated Aurora B substrates (11, 12). To date, apart from this
well-characterized centromeric function of Haspin activity, the broader cellular
functions of the kinase and the phosphorylation events that control these
remain essentially unknown.
In this study we used an integrated biochemical, proteomic, pharmacologic
and structural biology approach to study the Haspin kinase, its substrates and
the cellular consequences of its activity. Specifically, we determined a new
mode of kinase substrate binding and identified a Haspin kinase substrate
recognition motif. We identified 3964 phosphorylation sites in chromatin-
associated proteins, quantified their response to Haspin inhibition, and verified
the mitotic phosphorylation of MacroH2A Ser137 (13) as directly dependent by
Haspin activity. Altogether our data suggest that Haspin regulates the
phosphorylation of proteins involved in mechanisms that control gene
expression, including the modifications of histones, and provide evidence for
novel molecular effects of Haspin activity on mitotic chromatin.
Experimental Procedures

! &!
Reagents
Chemicals of the highest available purity were purchased from Sigma- Aldrich
unless otherwise stated. The Haspin inhibitor 5-iodotubercidin (5-ITu) (5, 6)
was obtained from Cayman Chemical.
Haspin and CENP-T proteins production and purification
Haspin452–798 catalytic domain fragment was purified as previously reported
(5).
Sequence encoding N-terminal CENP T fragment (2–101) was PCR amplified
and cloned in the first cassette of pGEX-6P-2rbs, a di- cistronic derivative of
pGEX-6P vector generated in-house. The veracity of construct was confirmed
by sequencing. For the protein expression, BL21(DE3) Rossetta cells
containing the pGEX CENP T101 plasmid were grown in Terrific broth at 37°C
to an OD600 of ∼0.8. Cells were induced for expression with the addition of
0.25 mM ITPG at 20°C, and were incubated overnight. Cell pellets were
resuspended in buffer A (25 mM Tris/HCl, pH 8.0, 300 mM NaCl, 10% [vol/vol]
glycerol, and 2 mM dithioerythritol) plus protease inhibitor cocktail. Then, cells
were lysed by sonication, and cleared by centrifugation at 85,000 g for 60 min.
The cleared lysate was incubated with GST beads (GE Healthcare) pre-
equilibrated with buffer A and incubated for ~4 h. Beads were washed 3 times
with buffer A and the bound protein was cleaved from GST fusion with
overnight incubation of PreScission protase. The eluate was applied to a
Heparin HP (GE Healthcare) column preequilibrated in the same buffer.
Elution of bound protein was achieved by a linear gradient from 300 to 1000

! '!
mM NaCl in 20 bed column volumes. The protein fractions were pooled and
concentrated in 3-kD molecular mass cut-off Vivaspin concentrators
(Sartorius). The concentrated protein was subjected to final purification step
on a Superdex 200 10/300 column (GE Healthcare) equilibrated in size-
exclusion chromatography buffer (25 mM Tris/HCl, pH 8.0, 150 mM NaCl, and
1 mM DTE). Eluted protein fractions were analyzed by SDS-gel and fractions
containg CENP T101 were pooled, concentrated, flash-frozen in liquid N2, and
stored at !80°C.
Cell culture
HeLa cells used for chromatin purification were grown in Dulbecco’s modified
Eagle’s medium (DMEM, Invitrogen) supplemented with 10% fetal bovine
serum (FBS, Hyclone) and antibiotics. 293T cells were grown in DMEM
supplemented with 10% fetal bovine serum (GIBCO) and 2 mM L-Glutamine.
Nocodazole was used at concentrations of 3.3 µM and 0.33 µM, for 1-hour
arrest or 16-hours arrest, respectively.
Mitotic chromatin preparation
Chromatin samples were prepared as previously reported (14). Briefly, HeLa
cells were arrested in mitosis with 0.33 µM nocodazole for 16 hours and
successively treated with the proteasome inhibitor MG132 for 30 min. The
Haspin inhibitor 5-ITu was added for 1.5 hours and successively mitotic cells
were harvested by mitotic shake-off in cell growing medium. Cells were
centrifuged at 1000 rpm 3 minutes, resuspend in 10 mL of cold PBS and
placed on ice for 45 minutes. The cell suspension was then centrifuged at

! (!
3000 rpm for 10 minutes in a 4 ºC cold centrifuge. The cell pellet was
resuspended in a hypotonic buffer containing 50 mM NaCl, 5 mM HEPES pH
7.4, 5 mM MgCl2, 0.5 mM CaCl2, 0.1 mM PMSF and phosphatase and
protease inhibitors (Roche). After, the cell suspension was immediately
centrifuged for 10 min and the cell pellet was lysed in 4 ml of the hypotonic
buffer with the addition of 0.5% NP-40 and 1 mM PMSF. Cell lysis was
achieved using homogenizer (15 mL Wheaton) and 12 gentle complete
strokes. Sodium deoxycholate (to 0.1% final concentration) was successively
added to the cell solution and other 24 additional strokes were performed. The
cell extract was then transferred to a 15 ml tube (BD, Biosciences) and spun
down at 400 rpm for 10 minutes at 4ºC. The supernatant was collected and
centrifuged through 4 mL of 40% sucrose cushion at 2400 rpm for 30 min in a
4 ºC cold centrifuge. The mitotic chromosomes present in the pellet were first
washed three times with 500 µl of lysis buffer and, successively resuspended
in a solution containing 8M UREA and 0.1% RapiGest (Waters) and sonicated
at 4 ºC three times for 1 min with 3 min pause.
Immunofluorescence and antibodies
For immunofluorescence (IF) analysis HeLa cells were plated onto acid-
treated coverslips. Chromatin sample preparations for IF analysis were
centrifuged at 2500 rpm for 30 minutes over a 2.5 mL, 40% sucrose solution
onto an acid-treated coverslip.
Samples were fixed at room temperature for 10 min in PTEMF buffer (0.25%
TritonX-100, 20 mM PIPES pH 6.8, 1 mM MgCl2, 10 mM EGTA and 4%
formaldehyde). The following antibodies were used: human CREST (1/400;

! )!
Antibodies Incorportated). Mouse anti-phospho-H3 Ser10 (1/1000, Abcam)
rabbit monoclonal anti-phospho CENP-A Ser7 (1/2000; Upstate
Biotechnology), rabbit anti-AuroraB (1/2000)(15). Cross-adsorbed secondary
antibodies (Invitrogen) were used. 3D image stacks of mitotic cells were
acquired in 0.2 µm steps using a 60x oil-immersion NA 1.3 objective on an
Olympus DeltaVision microscope (Applied Precision, LLC) equipped with a
DAPI/FITC/Rhod/CY5 filter set (Chroma) and a CoolSNAP HQ camera
(Roper-Scientific). The three dimensional image stacks were deconvolved
with SoftWorx (Applied Precision, LLC).
Histone acidic extraction and Western Blot
293T cells used for acidic extraction of nucleosomal histones were transfected
both with Haspin and empty plasmids using calcium phosphate method as
reported before (16). Cellular extracts (80 to 150 µg) were separated on SDS–
polyacrylamide gel electrophoresis and transferred overnight at 4°C onto a
polyvinylidene difluoride membrane (Amersham Pharmacia Biotech).
Membranes were blocked for 40 min in 5% dry milk in Tween–tris-buffered
saline (TTBS) and incubated overnight at 4°C with a primary antibody diluted
in TTBS containing 1% bovine serum albumin.
Identification of Haspin consensus motif
Phosphorylation motif determination by peptide library array screening was
performed as described by Mok et al. (17). The array consisted of 200
peptides with the general sequence YAXXXXX-S/T-XXXXAGKK(biotin),
where X is an equimolar mixture of the 17 amino acids excluding Cys, Ser

! *!
and Thr, arrayed in a microtiter plate. In each well, the peptide mixture had
one of the X positions fixed as one of the 20 unmodified amino acids or
phosphoThr or phosphoTyr. Peptides (50 "M) were incubated with 200 or 400
nM Haspin in 50 mM Tris (pH 7.5), 10 mM MgCl2, 150 mM NaCl, 1 mM
EDTA, 1 DTT, 0.1% Tween 20, and 50 "M ATP with 0.03 "Ci/"l [g-33P]ATP
for 2 hours at 30 ºC. Aliquots (200 nl) were then spotted onto a streptavidin
membrane, which was washed, dried and exposed to a phosphor screen as
described. Radiolabel incorporation into peptides was quantified using
QuantityOne software (BioRad). Date from two runs were normalized and
averaged to generate the position-specific scoring matrix for use with
NetPhorest.
Computational prediction of Haspin substrates with the NetPhorest
algorithm
For the computational predictions of possible Haspin targets, we deployed an
updated version of the NetPhorest algorithm, which can predict substrates for
222 kinases in the human kinome (17). As input data for the predictions, we
used an in-house curated database (KinomeXplorer-DB), which collects
known phosphorylation sites from public resources such as Phospho.ELM
(18), PhosphoSitePlus (19) and PhosphoGRID (http://www.phosphogrid.org/).
In the current version, there are 64,232 phosphorylation sites available, for
each of which we predicted the most likely phosphorylating kinases. From
these predicted kinases, we filtered the phosphorylation sites for which
Haspin was a predicted kinase, and set a probability cutoff of 0.1, which
should equate to a false-positive rate of maximum 10%. These results were

! "+!
subsequently used as input for follow-up experiments. From the perturbation
experiments, the observed and quantified phosphorylation sites were used as
input for NetPhorest predictions, in order to determine which phosphorylation
sites are potential Haspin substrate sites based on their sequence motif.
Again, predictions were filtered for best scoring kinases and a cutoff of 0.1
was applied to maintain high accuracy.
In vitro kinase assays
Kinase reactions were carried out in a solution containing 50 mM Tris (pH
7.6), 10 mM MgCl2, 150 mM NaCl, 1 mM EDTA, 1 mM DTT. The peptides
used as Haspin substrates were chemically synthetized by On-SPOT
synthesis (JPT) (20), histones H3 and H2A were obtained form Roche and
New England BioLabs, respectively.
Final substrate concentrations in the assay were 250 µM ATP (5 µCi of #-
32ATP for SDS page only), 5 µM of histones H3 and H2A (Roche), and 5 nM
Haspin kinase. Reaction were initiated by the addition of ATP and carried out
at 30 °C for 15 min and finally terminated by adding SDS/PAGE loading buffer
or UREA 8M for the protein samples that were successively analyzed by
mass spectrometry. Assay reactions were then separated on a 15%
SDS/PAGE gel and the amount of transferred phosphate was visualized by
autoradiography or processed for mass spectrometry analysis.
Crystallization, data collection and structure determination
Recombinant Haspin (aa 465-798) was purified as described (6). The protein
was concentrated to 15 mg/mL for crystallization studies. The protein was pre-

! ""!
incubated with 1 mM iodotubercidin and 3 mM histone H3 peptide (aa 1-11;
ARTKQTARKSTY), and the complex was crystallized by sitting drop vapour
diffusion at 4 ˚C using the reservoir condition containing 20% PEG 3350, 0.2
M KSCN. Suitable crystals were cryo-protected with mother liquor
supplemented with 20% ethylene glycol and 2.2 mM peptide before flash-
cooled in liquid nitrogen. Diffraction data were collected in-house on a Rigaku
FRE SuperBright source, and processed and scaled with MOSFLM and Scala
from CCP4 suite (21). The complex crystals belonged to a primitive
orthorhombic P212121 spacegroup with a unit cell dimension of a = 50.5, b =
79.1, c = 100.8 Å, $=%=#= 90˚. Structure determination was achieved by
molecular replacement using PHASER (22) and the previously published
Haspin coordinates (6) as a search model. The structure was subjected to
iterative cycles of manual model re-building in COOT (23) alternated with
refinement using REFMAC (24). Geometric correctness of the final model was
verified with MOLPROBITY (25). Data collection and refinement statistics are
summarized in table S8.
Sample preparation for mass spectrometry analysis
For each condition, ten 15-cm dishes of Hela cells were grown to ~80%
confluence and treated with 1 µM 5-ITu. Chromatin proteins were prepared as
described before.
Protein digestion
Disulfide bonds were reduced with TCEP (Thermo) at a final concentration of
10 mM at room temperature for 1 hour. Free thiols were alkylated with 10 mM
iodoacetamide at room temperature for 30 min in the dark. The solution was

! "#!
subsequently diluted with 50 mM ammonium bicarbonate (AMBIC) (pH 8.3) to
a final concentration of 1.0 M urea, 0.1% RapiGest (Waters) and digested
overnight at 37°C with sequencing-grade modified trypsin (Promega) at a
protein-to-enzyme ratio of 50:1. Peptides were desalted on a C18 Sep-Pak
cartridge (Waters) and dried under vacuum. Phosphopeptides were isolated
from 300-500 µg of total peptide mass with TiO2 as described previously (26).
Briefly, the dried peptides were dissolved in an 80% acetonitrile (ACN) 3.5%
trifluoroacetic acid (TFA) solution saturated with phthalic acid. The peptides
were eluted twice with 150 µl 1% NH4OH.
Sample preparation for phosphoproteomics
Chromatographic separation of peptides was carried out with an Eksigent
(Eksigent Technologies) and Proxeon (Proxeon Biosystems) NanoLC system
connected to a 15-cm fused-silica emitter with 75-µm inner diameter (BGB
Analytik) packed in-house with a Magic C18 AQ 3-µm resin (Michrom
BioResources). The phosphopeptide samples were analyzed by LC–tandem
MS (LC- MS/MS) run with a linear gradient ranging from 95% solvent A (98%
H20,2% acetonitrile, 0.1% formic acid) to 35% solvent B (98% acetonitrile, 2%
H2O, 0.1% formic acid) over 90 min at a flow rate of 300 nl/min. Shorter
gradients of 60 min were instead used for, identification of Haspin binding
partners and in vitro kinase reactions on peptide and proteins. Mass
spectrometric analysis was performed with a LTQ-Orbitrap XL mass
spectrometer (Thermo Scientific) equipped with a nanoelectrospray ion
source (Thermo Scientific). Mass spectra were acquired in a data-dependent
manner, with an automatic switch between MS and MS/MS scans. High-

! "$!
resolution MS scans were acquired in the Orbitrap (60,000 FWHM, target
value 106) to monitor peptide ions in the mass range of 350–1,650 m/z,
followed by collision-induced dissociation MS/MS scans in the ion trap
(minimum signal threshold 150, target value 104, isolation width 2 m/z) of the
five most intense precursor ions. The precursor ion masses of scanned ions
were dynamically excluded from MS/MS analysis for 10 s. Singly charged ions
and ions with unassigned charge states were excluded from triggering MS2
events
Database searching
Raw data were converted to the open mzXML format with ReAdW (version
4.3.1). mzXML files were searched by the SEQUEST via Sorcerer Software
4.2.0 and Mascot (version: 2.4.1) against UniProtKB/Swiss-Prot protein
databases (release 2012_11, containing 20,243 proteins) concatenated with
reverse sequences. For in silico digestion, trypsin was used as the protease
and was assumed to cleave after lysine (K) and arginine (R) unless followed
by proline (P). Three missed cleavage sites and one non- tryptic terminus
were allowed per peptide. The precursor ion tolerance was set to 50 parts per
million (ppm), and fragment ion tolerance was set to 0.5 dalton. The data were
searched allowing phosphorylation (+79.9663 daltons) of serine, threonine,
and tyrosine as a variable modification and carboxy-amidomethylation of
cysteine (+57.0214 daltons) residues as a fixed modification. Finally, The
identification results were statistically analyzed with the PeptideProphet
algorithm (v 4.6) (27) and the results combined using the iProphet algorithm
(28). In all the datasets presented the FDR was maintained below 1%, this

! "%!
was based on the number of the decoy hits at the PeptideProphet cut-off
score used. Accuracy of phosphorylation site location was determined by
PTMprophet algorithm, the same mass accuracy specified for the database
search was also used for the calculation of phosphorylation site localization
probabilities.
The annotated spectra provided in figure S8 were generated using an in
house developed python script and SpectraST (29) to create consensus
spectra for all the identified phosphorylated peptides. Only fragment
assignments with a mass error below or equal to 0.5 Da were annotated in
each spectrum.
Label-free quantification
For label-free quantification of the identified peptides, mzXML files were
processed with OpenMS (30) suite to detect and extract ion signals. Each
signal feature was matched with the best peptide assignment obtained after
database searching. The generated intensity maps contained all aligned
features together with the corresponding peptide sequences. The intensities
maps of 3 different replicate experiments were analyzed to generate final fold-
change ratios in peptide amounts between treated and untreated samples.
Each experiment consisted of two consecutive injections for each cellular
condition (treated with 5-ITu and not treated cells). Feature intensity values
that were missing in the data matrix were addressed as follow. All peptide
identifications with three or one missing value for each condition were
excluded for further analysis. When instead two missing values were absent
in the same biological condition we set a nominal lower bound values

! "&!
consisting in the minimum measured intensity peak over the background ions;
we used 5*104. For the statistical analysis, the intensities for peptide features
were log-transformed; the fold change and the confidence of phosphopeptides
regulation was calculated by a linear model using the publicly available R-
based Limma package (31). The calculated P-values were adjusted for
multiple comparisons using Benjamini and Hochberg correction.
Functional annotation
For functional annotation and Gene Ontology (GO) enrichment analysis of
protein sets, we used the annotation tools GOrilla (32). The P-values were
calculated after FDR correction for multiple testing (Benjamini-Hochberg).
STRING database (version 9.05) was used to predicted protein-protein
interaction within Haspin binding partners (33). The STRING predictions were
based on: experiment and databases; the minimum STRING score was set to
0.4. The protein networks were represented using in Cytoscape (v. 2.6.2)
(34).
Kinase-substrate relationship prediction
To predict protein kinases affected by 5-ITu treatment, we used iGPS (version
1.0) and NetworKIN algorithms (version 2.0). Enrichment tests used the
hypergeometric distribution as previously shown (35). As a background in
these tests, we used peptide identifications that were not affected by 5-ITu
treatments (-3<FC<3, P-value <0.05). The P-value cutoff for enrichment was
set at 5 & 10!5.

! "'!
Generation of cell lines stably expressing Haspin and Haspin pull down
Open reading frames (ORFs) of Haspin were retrieved from the Gateway (Life
Technologies) adapted human ORF collection (horfeome v5.1, Open
Biosystems, www.openbiosystems.com). ORFs were introduced by LR
recombination into a destination vector that was constructed by ligating the
Gateway recombination cassette and an N-terminal His6-HA-StrepII-tag into
the polylinker of the pcDNA5/FRT/TO vector (Life Technologies).
HEK293 cells were grown in DMEM supplemented with 10% FBS (PAA
Laboratories), 0.2 mM L-glutamine, 100 µg/ml hygromycin B and 15 µg/ml
blasticidin S (all Life Technologies) and were plated on 15 mm cell culture
dishes (Nunc). Protein expression was induced in medium lacking hygromycin
and blasticidin by the addition of 1 µg/ml tetracycline 24 hours prior to harvest.
Cells were detached by pipetting, washed twice with ice-cold PBS and cell
pellets were frozen in liquid nitrogen.
For each pull-down we used a cell pellet deriving from 10 & 15–cm 80%
confluent both from cycling and prometaphase-arrested cells (0.33 µM
nocodazole for 16 hours). The cells were harvested and washed twice with
PBS. The cell pellets obtained were lysed on ice in 2 volumes of lysis buffer
(LB, 50 mM HEPES, pH 7.5, 150 mM NaCl, 5 mM EDTA, 0.1% NP-40,
phosphatase and protease inhibitor cocktail, Roche). Insoluble material was
removed by centrifugation at 13,000 r.p.m. for 30 min at 4 °C. Strep-Tactin
Sepharose beads (1200 µL, slurry) were transferred to a Bio-Spin
chromatography column and washed twice with 1.5 mL of LB. The cell lysates
were loaded two consecutive times on the Strep-Tactin columns. The beads
were washed with 3 & 1 mL lysis buffer, and bound proteins were eluted with

! "(!
3 & 300 µL freshly prepared 2 mM D-biotin in LB. Anti-HA agarose beads (80
µL) were washed with 2 & 1 mL LB buffer and centrifuged at 1,000 r.p.m. for 1
min at 4 °C. The supernatant was removed and the beads resuspended in
100 µL LB buffer. The anti-HA agarose beads were added to the biotin eluate
and rotated for 1 h at 4 °C. The anti-HA agarose beads were washed with 3 &
1 mL LB buffer and then with 3 & 1 mL LB buffer without detergent and
protease inhibitors. Retained proteins were eluted twice with 200 µL of 100
mM glycine, pH 2.5. The pH in the sample was adjusted using AMBIC 1M pH
8 and successively trypsin. The peptides originated were purified and
analyzed by mass spectrometry as previously described. To identify specific
Haspin binding partners we used a strategy based on spectral counts and
control pull downs. The dataset of control pull-downs consisted of 80 different
protein purifications either performed form cell expressing GFP or cells
transfected with an empty vector. We retrieved spectral counts for every
identified protein using the ABACUS software (36). For the set of proteins
identified in the control pull-downs we selected the highest five spectral count
values between all the 80 analyses performed. We estimated the probability
for each identified protein of being Haspin specific interactors using SAINT
(37). The SAINT algorithm creates separate distributions for true and false
interactions and assigns the probability of a bona fide protein-protein
interaction to each identified proteins in the dataset. We considered Haspin
specific interacting partners only proteins i) with spectral counts seven times
higher than the average values of the negative controls and ii) protein
interactions with the highest possible SAINT probability (SAINT probability=1).

! ")!
Results
Generation of a dataset of Haspin modulated, chromatin associated
phosphorylation events.
A robust cellular assay to detect chromosomal Haspin activity
We employed the small-molecule inhibitor 5-iodotubercidin (5-ITu) (fig. S1) to
inhibit Haspin kinase activity and to study the effect of its inhibition in human
mitotic HeLa cells. A specificity screen performed on a panel of 138 kinases in
vitro revealed the selectivity of 5-ITu towards Haspin and the members of Clk
kinase family (11). To confirm efficient Haspin inhibition in cells, we monitored
the phosphorylation of Thr3 of histone H3 by immunofluorescence (IF) (fig.
S2). Briefly, the cells were arrested in mitosis with nocodazole and after 16
hours the proteasome inhibitor MG132 was added to the medium to prevent
exit from mitosis. Finally, the cells were treated for 1.5 hours with 5-ITu
concentrations ranging from 0.1 to 10 µM (fig. S2). In agreement with
previously published studies (38), we observed a drastic reduction of H3Thr3ph
in cells treated with as little as 1µM 5-ITu (5) (fig. S2, fig. 1A-B). The loss of
H3Thr3ph is thought to prevent the recruitment of Aurora B to the centromere
(fig. 1A). However, under the experimental conditions used, centromeric
phosphorylation of the Aurora B substrate CENP-A at Ser7 (fig. 1C) was not
affected. This was probably due to incomplete Aurora B delocalization from
the centromeres (9, 11, 12, 39).
It has been reported in the literature that Haspin also localizes to condensed
chromatin during mitosis (7), implying that its direct substrates and the Haspin
dependent signaling cascade might affect the phosphorylation state of

! "*!
chromatin-associated proteins beside H3Thr3ph. To investigate the effect of
Haspin inhibition on the state of phosphorylation of chromatin-associated
proteins, we developed a robust protocol for the mass spectrometric
identification and quantification of phosphorylated peptides on a chromatin
fraction purified from mitotic cells (fig. 1D-E). First we established conditions
that prevented detectable de-phosphorylation of phosphoproteins during
sample workup. Phosphorylated proteins can be rapidly dephosphorylated by
phosphatases after cell lysis, if phosphatase inhibitors or denaturing
conditions are not employed. To determine whether phosphatases affected
the phosphorylation state of the samples during the chromatin enrichment
protocol we monitored the phosphorylation state of H3Thr3ph by IF. Chromatin
samples purified from Haspin inhibited mitotic cells and from cells mock
treated with DMSO, respectively, were gently centrifuged onto microscopy
slides and the specific protein epitopes were detected with antibodies (fig. 1D-
E). Mock treated cells substantially preserved the H3Thr3ph signal, while
phosphorylation of the Haspin histone H3 target in mitotic cells treated with 5-
ITu was barely detectable, validating the applied protocol (fig. 1D).
Interestingly, while centromere staining of Aurora B was strongly reduced
upon Haspin inhibition, its localization on chromosome arms remained
unchanged (fig. 1E). In conclusion, we established and validated a protocol
for the purification of mitotic chromatin from cells subjected to different
pharmacological regimens in a state that largely preserves the
phosphorylation state of the proteins. This allowed us to directly study the
effect of Haspin inhibition by 5-ITu on substrate phosphorylation in human
cells.

! #+!
Identification of sites of phosphorylation of chromatin associated proteins
We used quantitative mass spectrometry to identity Haspin modulated
phosphorylation sites on chromatin-associated proteins. Purified mitotic
chromatin samples from cells treated with the Haspin inhibitor 5-ITu and
untreated cells, respectively, were prepared using the conditions optimized
above, digested with trypsin and the phosphorylated peptides were enriched
using immobilized metal affinity chromatography prior to analysis by LC-
MS/MS (fig. 2A). We identified 5,822 phosphorylated sites on 1,347 proteins
(fig. 2B, table S1) at 1% FDR. Phosphorylation site localization probability was
controlled using the PTMprophet algorithm (table S1). The distributions of the
individual phosphorylated residues across the different hydroxyl amino acids
and the number of phosphorylation sites per peptide identified on chromatin
proteins were similar to those observed in other phosphoproteomic studies
focusing on different cellular sub-compartments (fig. 2B) (35, 40). Further, we
identified 1,217 previously unreported phosphorylation sites in the
PhosphoSitePlus database (19), corresponding to approximately 10% of
phosphosites identified in this study. To estimate the limit of detection of our
phosphopeptide measurements we related the identified phosphoproteins to
estimates of their cellular concentration (41). The results indicate that the
identified phosphoproteins spanned a range of abundance from over a million
to less than 500 copies per cell (table S1). More than 40% of the
phosphoproteins identified in this study are core components of mitotic
chromatin (42). Detailed analysis of the kinetochore, a macromolecular
structure larger than 1 MDa that assemble on the centromere of mitotic

! #"!
chromosomes, indicated that the gentle conditions used for the purification of
mitotic chromatin (Material and Methods) preserved even labile protein-
protein interactions (43, 44) and thus retained even loosely associated
proteins in the chromatin fraction. The kinetochore consists of more than 80
proteins (44). It has traditionally been sub-divided into three distinct structural
layers: i) the inner kinetochore which hosts proteins in close contact with the
centromere proteins and the DNA, ii) the outer kinetochore that functions as a
bridging platform between the inner kinetochore and the corona, iii) the
corona where the proteins transiently localize (43). In this study we identified
phosphorylation sites on proteins localized in all three layers, including the
kinase Aurora B and several CENP proteins that localize to the inner
kinetochore, Ndc80 and the kinases Plk1 and Mps1 along with structural
components of the outer kinetochore and Cdc20 and CENP-E, BUBR1,
proteins of the corona (fig. 2C; table S1).
In conclusion, we established and applied a strategy for the mass
spectrometric detection of proteins and their phosphorylation sites from
purified mitotic chromatin. To the best of our knowledge, this is the largest
existing dataset of phosphorylation sites on chromatin proteins in human cells.
Quantification of phosphorylation sites in chromatin-associated proteins
To identify phosphorylation sites modulated by 5-ITu treatment in the dataset
acquired above we related the precursor ion intensities of phosphopetides in
5-ITu treated and non-treated mitotic chromatin samples. We used the
OpenMS quantification tool (30) and statistically evaluated the data as
indicated in (45). To achieve robust phosphorylation site quantification we

! ##!
eliminated from further analysis those phosphopeptides that were
inconsistently detected in replicate analyses of the same sample (described in
the Material and Methods section). We confidently quantified 3,964
phosphorylation sites from 1,125 proteins (table S2). We considered
phosphopeptides as regulated if they showed a larger than six fold change in
signal intensities between inhibitor treated and not treated cells and a P-value
lower or equal to 0.05. Using these criteria we identified 258 and 324
phosphosites belonging to 338 proteins that were down- or upregulated,
respectively, in response to 5-ITu treatment (fig. 2D, table S2). To gain
insights in the cellular functions affected by the Haspin inhibitor treatment, we
performed gene ontology (GO) analysis using the GOrilla software (32) which
indicated 66 GO terms significantly (p-value <1E-7) enriched in the 338
phosphoregulated proteins (table S3, fig. 3E). We manually inspected the
function of the proteins grouped under each enriched GO term. In total we
could identify three major functional clusters of Haspin modulated
phosphoproteins: i) mitotic proteins, ii) RNA processing proteins and iii)
histones and chromatin modifier proteins (fig 2E, table S3).
Among the 574 phosphorylation sites modulated by Haspin inhibition, 25 sites
mapped to mitotic proteins localizing to the centromere. These included:
MIS18BP1, NSL1, CENP-E, CENP-F, Hec1, Borealin, INCENP (table S2-3)
as well as BUB1 and Aurora B kinases and, the BUBR1 pseudokinase. As
expected, we observed downregulation of phospho-sites on three of the four-
chromosome passenger complex (CPC) protein subunits identified in this
study: Aurora B, Borealin, and INCENP (9, 39). These data are consistent
with the notion that the absence of H3Thr3ph caused by 5-ITu treatment

! #$!
reduces both Aurora B localization at the centromere and the localization of
the other subunits of the CPC complex (fig. 1A-E). Interestingly, the
phosphorylation sites Ser593 and Thr601 on the BUB1 kinase were also
strongly downregulated upon 5-ITu treatment. Furthermore, about half of the
phosphorylation sites we quantified after Haspin inhibition were increased
compared to non treated cells, suggesting indirect or compensatory effects.
Upregulated sites include Ser69 and Ser62 on the Ndc80 protein as well as
phosphorylation sites on three proteins required for cytokinesis, namely
Septin 7 and Septin 9 and Anillin.
The “RNA processing cluster” included subunits of the splicesome,
ribonucleproteins, RNA binding proteins and transcription factors.
Interestingly, we identified induced or reduced phosphorylation in several
components of the splicesome including, SRSF1, SRSF2, SRSF3, SRSF6,
SRSF7, SRSF9. The phosphorylation sites Ser199 and Ser201 on SRSF1 were
downregulated, while the phosphorylations on Ser234 and Ser238 on the same
protein were upregulated. Further, the data indicated that all the quantified
sites on SRSF6, SRSF7, SRSF9, were upregulated. In contrast
phosphorylation sites on SRSF2 and SRSF3 were downregulated. The
complex regulation of phosphorylation on splicing proteins is likely due to a
combination of direct and indirect effects of Haspin inactivation.
The “chromatin modifier” cluster contained proteins involved in enzymatic
processing of DNA such as DNA and RNA helicases and polymerases, as
well as methyl and acetyl transferases (table S2, 3) and proteins that bind
specific post translationally modified histones. Interestingly, we observed
phosphorylation changes on a number of chromobox proteins, such as CBX1,

! #%!
CBX3 and CBX8 (table S2; 3). These proteins control epigenetic repression of
chromatin by affecting PTMs on histones (46). In addition, we observed
significant downregulation of the phosphorylation sites on several histone
isoforms upon 5-ITu treatment (table S2; 3). In contrast, Ser122 of the H2AX
and H4 Ser48 (47) were upregulated upon inhibitor treatment (fig 2E, table
S2).
Phosphorylation at Ser137 of the histone macroH2A was strongly
downregulated upon 5-ITu treatment (fig 3A). Recently, it has been reported
that the macro domain of histone macroH2A controls the phosphorylation
levels of Ser10 and Thr3 of histone H3 in human cells (48). To test whether
macroH2A Ser137 phosphorylation was directly dependent on Haspin activity,
we over-expressed Haspin in the presence or absence of the inhibitor 5-ITu
and quantified Ser137 phosphorylation using a phospho specific antibody (fig.
3B). The results showed a drastic reduction of macroH2A phosphorylation in
Hek293 cells upon treatment with 5-ITu (fig. 3B). In contrast, Haspin over-
expression led to a significant increase in macroH2A Ser137 and histone H3
Ser10 phosphorylation that again diminished upon 5-ITu treatment (fig. 3B). In
combination these results strongly suggest a direct dependence of histone
macroH2A Ser137 phosphorylation on Haspin catalytic activity (fig. 3B). In
summary, mass spectrometric quantification of phosphorylation sites on
chromatin-associated proteins upon 5-ITu treatment confirmed the importance
of Haspin kinase activity towards the phosphorylation of centromeric proteins.
Furthermore our data indicate potential novel connections between Haspin-
dependent signaling and processes involved in gene transcription.

! #&!
Kinase-substrate enrichment analysis (KSEA) reveals inactivation of
Aurora B, CLK and RSK kinases upon 5-iTu treatment
To gain functional insights into the phosphorylation sites regulated in the
quantitative phosphoproteomic dataset described above we performed a
kinase-substrate enrichment analysis (KSEA) (35, 49). Specifically, we first
used the iGPS (50) and NetworKin (51) kinase-substrate prediction algorithms
to identify those kinases that have predicted substrate phosphorylation sites
among the 3,964 quantified phosphorylation sites. We then further statistically
filtered this initial kinase-substrate matrix to determine those kinases that
were significantly associated with the 5-ITu modulated phosphorylation sites.
Substrates downregulated upon 5-ITu treatment implied that the activity of the
respective kinase(s) were reduced, e.g. by the inactivation of Haspin or the
direct Haspin dependent inactivation of a downstream kinase. Conversely,
upregulation of the phosphorylation sites would suggest that the activity of
specific kinases is increased upon 5-ITu treatment.
Both the iGPS and Networkin algorithms did not detect a significant
association between the upregulated sites and specific kinases. In contrast,
for the downregulated sites the two algorithms identified three kinase families
that were significantly associated (P-value lower than 0.0005) with the
phosphopeptides in that group: i) the Aurora family comprising Aurora B,
Aurora A, and Aurora C kinases (P-value 2.79*10-6), ii) the CLK family
consisting of the kinases Clk1, Clk2 and Clk3 (P-value 2.86*10-5) and iii) the
RSK family consisting of p90RSK, RSK2 and RSK3 kinases (P-value 1.7*10-4)
(fig. 4A, table S4). The downregulation of Aurora B substrates was expected
because 5-ITu treatment prevents Aurora B localization to the centromere

! #'!
(see above), thus preventing its activity at the centromere (fig. 4B, table S5).
CLKs are dual specificity protein kinases involved in pre-mRNA processing
(52). Inhibition of CLK family kinases can be interpreted as a direct effect of 5-
ITu treatment as reported by a specificity screen showing that 5-ITu inhibits in
vitro Clk2 (94% of the kinase activity) and less efficiently Clk3 (50% of the
kinase activity) kinases (11). 18 phosphorylation sites were predicted as CLK
substrates; more than 50% of those were from proteins involved in gene
expression and splicing mechanisms (fig. 4B, table S6).
The RSK family consists of a group of highly conserved Ser/Thr kinases that
regulate a range of cellular processes, including cell growth, cell motility, cell
survival and cell proliferation (53). Interestingly, substrate prediction
suggested that RSK activity mostly targets the histones and histone
associated (fig. 4B, table S7). The inhibition of RSK is unlikely to be caused
by off-target 5-ITu inhibition, since the concentration of the inhibitor used in
this study does not significantly affect RSK kinases activity in vitro (1 µM 5-ITu
reduces only of the 3% RSKs kinase activities) (11). Therefore, we consider
the downregulation of predicted RSK substrates as an indirect effect of
Haspin inhibition.
In summary, KSEA after Haspin inhibition correctly highlighted down-stream
effects of 5-iTU treatments such as the inhibition of both Aurora B and CLK
family kinases (9, 11, 39). Furthermore our data also shows a significant
downregulation of the RSK predicted substrates.
Identification of a Haspin consensus motif by positional scanning
oriented peptide library screening (PS-OPLS)

! #(!
Substrate recognition by kinases depends on different factors, including
spatial proximity, site accessibility and the amino acid sequence motifs
surrounding the phosphorylation sites (2). We determined a preferred Haspin
substrate motif by positional scanning oriented peptide library screening (fig.
5A) as described in (54).
We purified a recombinantly expressed Haspin kinase domain and used it for
the in vitro kinase reaction on degenerated peptide libraries. The
autoradiography pattern indicated a preference for poly-threonine compared
to poly-serine peptides (bottom left fig. 5A) suggesting a preference of Haspin
for threonine residues. Also, the phosphorylation of peptides carrying
threonine residues in the different positions tested could be explained by the
preference of Haspin for threonine residues (squared in blue fig. 5A). Haspin
was most strongly selective for peptides having an Arg residue at position P -
1, and displayed a substantial preference for Ala and Val at the P -2 position
and for Lys at the P +1 position. We therefore defined the preferred
recognition motif for Haspin as A/V-R-T/S-K-(X-noD/E) (fig. 5A). Strikingly,
this motif is in complete agreement with the only presently known Haspin
phosphorylation sequence centered around Thr3 of the histone H3 (fig. S3). In
addition, we also noted that acidic amino acids were strongly disfavored by
Haspin at multiple positions near the phosphorylation site (fig. 5A squared in
red). This observation is consistent with the negative net charge within the
Haspin active site (fig. S4) which likely creates ionic electrostatic repulsions
with acidic substrates. In summary, the positional scanning oriented peptide
library screening identified a preferred recognition sequence for Haspin that
matches with the Haspin phosphorylation site on histone H3 tail.

! #)!
Structural mechanisms of substrate recognition
To gain structural insights on the basis of the Haspin substrate recognition
motif identified, we co-crystallized the kinase catalytic domain with the H3 tail
substrate sequence. The structure was refined to 1.9 Å resolution (fig. 5B, S4
table S8). The kinase domain adopted a similar conformation when compared
to the apo-structure (5). The first 7 residues were modeled into the
experimental density revealing that three substrate residues Ala1 (position -2
in the PS-OPLS), Arg2 (-1) and phosphoacceptor site Thr3 (0) were anchored
deep within the substrate pocket. Surprisingly, the bound peptide adopted an
unusually sharp 180˚ turn at Lys4 (+1) projecting the C-terminal tail outward
(fig. 5B). This is in contrast to binding modes of substrates of other kinase-
substrate complexes, which typically exhibit an elongated linear conformation.
As a consequence of this unique substrate conformation, residues Arg2 (-1)
and Lys4 (+1) are positioned into deep hydrophilic pockets explaining the
strong selection for these two residues and position -1 and +1 in the
degenerated library peptide array. The only other residue preferentially
selected in position +1 was a tyrosine, which may functionally replace the
lysine forming a hydrogen bond with Asp707. The structure explains also the
strong selection for small hydrophobic residues at position -2 in the PS-OPLS
experiment. In this position the amino acid side chain is oriented towards a
small surface cavity excluding residues with bulkier groups than alanine or
valine.
Prediction and in vitro phosphorylation of potential Haspin substrates

! #*!
The strength of the interactions that stabilizes the binding of the substrates
with the kinase reflect the signal intensities of the phosphorylated peptides
measured in the PS-OPLS array and indicate the residues in the recognition
sequences that are particularly important in Hapin substrates. This
information, in turn is useful to predict substrates of a kinase (55, 56).
We used the NetPhorest algorithm to identify candidate Haspin direct
substrates in the fraction of the downregulated phosphorylation sites
measured on the chromatin associated proteins. The results were filtered
based on NetPhorest probability higher than 0.1, which led to a false positive
rate (FPR) of the Haspin substrate predictions lower than 10%. Using this
score cut-off we identified 11 candidate sites phosphorylated by Haspin (table
S9). These proteins include the splicing factors SRSF1, SRSF2 SRSF10, and
the PRP4 kinase, which controls RNA splicing (table S9). To extend Haspin
substrate prediction to proteins that were not identified in the chromatin
dataset presented here, we used the newly established Haspin consensus
recognition motif to computationally predict potential Haspin substrates from
phosphorylation sites identified in the literature. We employed the NetPhorest
algorithm to query a large collection of more than 64,000 identified
phosphorylation sites (Material and Methods). From these the algorithm
predicted 2,926 sites with a NetPhorest probability higher than 0.1 and a FPR
less 10% (table S10). We tested specificity of Haspin activity on 101 predicted
substrates sites (fig. S5) using an in vitro phosphorylation experiment. We
chemically synthetized 101 peptide sequences selected within the predicted
sites where Haspin was among the top 10 % most likely upstream kinases
and, tested them as Haspin substrates by in vitro phosphorylation experiment

! $+!
(fig. S5, table S11). We detected the newly formed phosphorylation sites on
the peptide sequences by shotgun mass spectrometry. More than 90% of the
peptides in the library contained at least two hydroxyl amino acids (table S11).
A kinase with poor substrate specificity would be expected to randomly
phosphorylate in vitro every site available on the peptide substrates. In the
experiment, Haspin showed high specificity for the selection of the substrate.
The kinase phosphorylated 96 sites within the peptide library (table S12). 35
of these were confidently assigned to specific sites when multiple hydroxyl
amino acids were present (PTMProphet probability equal to 1) and all of these
confirmed sites matched the predictions. On average about 80% of all
fragment ion spectra identified the predicted sites, confirming the specificity of
the kinase reaction and the accuracy of the NetPhorest predictions (fig. S5,
table S12). We further validated the phosphorylation sites associated with
CENP-T (NetPhorest probability 0.23) and histone H2A (NetPhorest
probability 0.11) by phosphorylating the respective proteins in vitro (fig. 5C-
D). We selected CENP-T because of its role in kinetochore assembly and
likely co-localization with Haspin (57). We selected histone H2A because of
the high degree of sequence conservation around the predicted Haspin
phosphorylation sites between H2AThr16 and macroH2ASer137 (fig. 5C) and,
because macroH2ASer137ph is reduced after Haspin inhibition. Specifically, a
fragment encompassing residues 1-101 of CENP-T, histone H2A and histone
H3, respectively were incubated with Haspin kinase domain in the presence of
32P ATP (fig. 5C-D). We found that Haspin very efficiently phosphorylated
both CENP-T and histone H2A in vitro (fig. 5C-D). To determine the number
of phosphorylated residues on CENP-T and histone H2A, respectively, we

! $"!
determined the intact molecular weight of the proteins by mass spectrometry.
The data showed that Haspin phosphorylated CENP-T preferentially on three
or four sites, whereas histone H2A was predominantly phosphorylated at a
single site (fig. 5C-D). Mass spectrometric analysis of tryptic digests of the
respective phosphoproteins identified Thr14/27/57 and Ser72, for CENP-T 1-101
and Thr16 for H2A as the phosphorylated residues. (fig. 5C-D). In summary,
using computational predictions based on the newly identified Haspin
consensus motif and mass spectrometric validation of the predictions we
identified novel bona fide Haspin substrates. This study extends the number
of putative Haspin substrates from 1 to 38.
Identification of Haspin protein interaction network
We next performed affinity purification-mass spectrometry (AP-MS) analysis
of the Haspin kinase to test whether some of the predicted substrates or other
proteins physically associated with the Haspin kinase. Haspin was expressed
as affinity tagged bait protein in FLP-in HEK293 cells using established
protocols (58) and the purified complex was analyzed by standard LC-MS/MS
(fig. 6A). To distinguish true interactors from proteins non-specifically
associating with the isolated complexes we generated data from control
samples using unrelated bait proteins (GFP) (36) and statistically filtered the
data (37) (Material and Methods). The results identified 50 proteins that
passed the filtering criteria and that were thus considered true interactors (fig.
6A). About 70% of these (33 of 50) were implicated with transcriptional
regulation and 50% (25 of 50) were previously reported to co-purify with
components of the spliceosome (http://spliceosomedb.ucsc.edu/) (fig. 6A)

! $#!
Indeed, STRING analysis of the identified proteins reported a highly
interconnected network of interactions between the spliceosome-associated
subset of Haspin interactors (fig. 6A, pink subgroup). Interestingly, in the
chromatin dataset 75 phosphorylation sites were observed on 18 of the 50
identified Haspin interactors. Ten phosphorylation sites mapping to 5 proteins
were significantly regulated upon 5-ITu treatment (table S14). However, none
of sites identified on Haspin binding partners matched the Haspin consensus
motif, suggesting that other kinases are responsible of these phosphorylation
events. Although none of the interactors was scored as a possible Haspin
substrate, we asked whether the protein complex could instead mediate the
interaction between Haspin and its predicted high confidence substrates.
Indeed, out of the 29 highly ranked predicted substrates 11 were previously
shown to physically interact with one or more of the Haspin binding partners,
(fig. 6B) suggesting that Haspin binding partners could physically mediated
the interaction between Haspin and its substrates. In conclusion, the
identification of a Haspin interaction network, both reinforces and
complements our substrate predictions; about 50% of the most confidently
predicted Haspin substrates physically interact with Haspin binding partners,
suggesting that Haspin might in vivo phosphorylate components of this
complex network of interactors on the predicted sites.
Discussion
In this study we used the ATP analogue 5-ITu to investigate the role of Haspin
catalytic activity in mitotic cells. A specificity screen performed on a panel of
138 kinases in vitro revealed a tight selectivity of 5-ITu towards Haspin and

! $$!
the members of Clk kinase family (11). We developed an efficient and robust
protocol to identify phosphorylation changes on chromatin associated proteins
as a result of treatment with 5-ITu (fig. 2A). We identified and quantified by
mass spectrometry, 3,964 phosphorylation sites mapping on 1,125 proteins
(fig. 2B-2D, table S2). As far as we are aware this represents the largest
dataset of phospho-sites available on chromatin proteins.
The vast majority of changes in phosphorylation state that we observed in
response to 5-ITu treatment affected mainly three classes of proteins: i)
proteins involved in mitotic regulation, ii) proteins involved in RNA processing
and iii) histones and chromatin processing proteins (fig. 2E). KSEA analysis of
the phosphorylation sites down regulated upon 5-ITu treatment of mitotic cells
indicated that Haspin and the three kinase families Aurora, CLK, and RSK,
were affected (fig. 4). This could either be due a direct inhibition mediated by
the 5-ITu, or due to indirect effects secondary to Haspin or CLK inhibition.
One known indirect effects of Haspin inactivation is the release of the CPC
complex (AuroraB, Incenp, Borealin, Survivin) from the centromere (fig. 1A).
In agreement with the literature we found that the phosphorylation sites
identified on CPC complex components are down regulated after 5-ITu
treatment (Fig 2D, table S2). It has been described previously that
centromeric enrichment of the CPC complex lead to an increased catalytic
activity of Aurora B (8). It is thus not surprising that we measured a strong
downregulation of Aurora B dependent phosphosites on CPC members (fig.
4B, table S5). Interestingly, we found that the Aurora B substrate Hec-1Ser69
is strongly upregulated upon 5-ITu treatment (table S2). This unexpected
result suggests the existence of a delicate equilibrium at the centromere,

! $%!
between phosphorylation and dephosphorylation of proteins that likely
involves, in addition to kinases as well as protein phosphatases (11).
While phosphorylation sites linked to mitosis could be confidently attributed to
both Haspin and Aurora B activities, the phosphorylation of proteins
implicated in the control of gene expression mechanisms cannot be
unambiguously assigned to any specific kinase highlighted by the KSEA.
Indeed, there are several lines of evidence that Aurora B, CLKs, RSKs and
Haspin kinase activities can affect, either directly or indirectly, the
mechanisms that control gene expression (9, 39, 59-74). To predict Haspin
direct substrates within the downregulated sites we determined the kinase’s
consensus motif. The results of PS-OPLS reveled a strong preference for Ala
in position P-2, Arg in P-1 and Lys in P+1 (fig. 5A) as also recently reported by
Kettenbach at al. (75). The Haspin preference for these residues finds a
structural explanation in the co-crystal structure of Haspin with the histone H3
tail added as substrate (fig. 5B-S4). This indicates a so far unique substrate-
binding mode, where the substrate backbone formed a 180∘ turn in the Haspin
active site placing residues Arg2 (P-1) and Lys4 (P+1), which are important for
consensus motif recognition, into deep hydrophilic pockets. Interestingly,
these two residues flanking the substrate Thr3 in histone H3 are a hotspot of
post-translational modifications such as methylation and acetylation, and thus
have key regulatory function for chromatin structure and transcription.
Previous studies showed that increased Lys4 methylation had an inhibitory
effect on Haspin substrate recognition (6). Lys4 forms an ion-pair network with
the two acidic residues Asp707 and Asp709. Lys4 methylation sterically hinders
substrate binding. Based on the structure and the data measured on

! $&!
trimethylated Lys4 we predict that Lys4 acetylation will also weaken H3
substrate recognition by Haspin, and therefore phosphorylation of the Thr3.
The identification of the Haspin consensus motif and the structural details of
the kinase-substrate interaction guided the identification of potential novel
substrates. We identified 11 bona fide novel Haspin substrates including
several splicing proteins (table S9). Ser137 of histone macroH2A was strongly
downregulated upon 5-ITu treatment. Even though the NetPhorest probability
was below the threshold set in this study we followed up on this
phosphorylation site as a potential Haspin substrate because it was recently
shown to be important for the phosphorylation of Ser10 and Thr3 of the histone
H3 (48). Histone macroH2A is a histone variant originally found enriched in
the inactive X chromosome of female mammals (76). Several studies
demonstrate that histone macroH2A functions both as positive and as
negative regulator of gene transcription (77). MacroH2A histone variant is
about three time larger than other canonical histone proteins and it is
composed of three segments: i) a histone like domain, 64% protein sequence
identical to histone H2A; ii) a highly positively charged flexible loop linking the
histone fold to the macro domain; and iii) a macro domain that is exposed to
the nucleoplasm (77). The DNA-linker interactions are stabilized by ionic
bonds involving the DNA negative charges and the positive charges of the
basic macroH2A stretch Thr120-Pro160 (78, 79), and these interactions are
likely to be important for the control of chromatin condensation (78, 79).
Interestingly, we noted that the consensus motif around Thr16 of histone H2
and Ser137 of histone macroH2A are conserved except for the residue in
position +1. In that position histone H2A contains an arginine (Arg17) whereas

! $'!
histone macroH2A has a proline residue (Pro138) (fig. 5E). Our data clearly
demonstrate that macroH2A Ser137 phosphorylation is dependent on the
Haspin kinase (fig. 3) and we speculate that this site is a Haspin direct
substrate in vivo whose phosphorylation could modulate the degree of
chromatin condensation and control DNA transcription. We validated CENP-
T Thr57 as bona fide Haspin substrate by in vitro kinase reaction of the CENP-
T protein fragment 1-101 (fig. 5C-D). CENP-T is a component of the CCAN
(constitutive centromere associated network) that plays a central role in the
kinetochore assembly, mitotic progression and chromosome segregation (57).
Haspin phosphorylates in vitro four CENP-T sites, Thr14/27/57 and Ser72 (fig.
5C-S6). Recently, it has been demonstrated that the tight control of CENP-T
phosphorylation, primarily by cyclin-dependent kinase (CDK), is important for
the assembly and the disassembly of the kinetochores (80) during mitosis. In
particular, CDK-dependent phosphorylation of CENP-T recruits Ndc80
complex to the kinetochore (80). It is therefore likely that Haspin activity could
assist CDK kinase in the control of protein recruitment at the kinetochores
during the different mitotic stages.
Altogether, the results presented here greatly expanded the number of Haspin
bona fide direct substrate in cells and clarified the structural mechanisms of
Haspin-substrate binding. Furthermore, a novel link between Haspin kinase
activity and phosphorylation of proteins involved in the regulation of gene
expression is presented.
For over half a century it has been assumed that transcription is globally
silenced during mitosis. Recently, new unexpected links between mitosis and
the general mechanisms that regulate gene transcriptions have been

! $(!
emerging (81-84). There is evidence of active transcription of centromere
satellite regions during mitosis and suggestions that such enzymatic activity is
essential to guarantee chromosome stability (84). Recently, It has been
shown that specific RNA transcripts interact with CENPA nucleosomes, and
that such proteins-RNA binding controls Aurora B localization and its activity
at the kinetochore (85). Our data indicate that Haspin might regulate
transcription by direct or indirect phosphorylation of splicing and transcription
factors, subunits of the transcription machineries, as well as histones. It is
therefore likely that Haspin controls the recruitment of Aurora B to the
kinetochore by the synergistic effect of its enzymatic activity, first
phosphorylating the histone H3 Thr3 (9, 39) and second by maintaining an
active RNA transcription during mitosis. This novel function should be
considered in future studies and take into account for a comprehensive
understanding of Haspin role in mitosis and more in general for a better
understanding of the molecular mechanisms that link DNA transcription and
cell cycle progression in human cells.
References
1. Manning, G. (2002) The Protein Kinase Complement of the Human Genome. Science 298, 1912–1934
2. Ubersax, J. A., and Ferrell, J. E. (2007) Mechanisms of specificity in protein phosphorylation. Nat. Rev. Mol. Cell Biol. 8, 530–541
3. Bodenmiller, B., Wanka, S., Kraft, C., Urban, J., Campbell, D., Pedrioli, P. G., Gerrits, B., Picotti, P., Lam, H., Vitek, O., Brusniak, M. Y., Roschitzki, B., Zhang, C., Shokat, K. M., Schlapbach, R., Colman-Lerner, A., Nolan, G. P., Nesvizhskii, A. I., Peter, M., Loewith, R., Mering, von, C., and Aebersold, R. (2010) Phosphoproteomic Analysis Reveals Interconnected System-Wide Responses to Perturbations of

! $)!
Kinases and Phosphatases in Yeast. Science Signaling 3, rs4–rs4
4. Higgins, J. M. (2001) Haspin-like proteins: a new family of evolutionarily conserved putative eukaryotic protein kinases. Protein Sci. 10, 1677–1684
5. Villa, F., Capasso, P., Tortorici, M., Forneris, F., de Marco, A., Mattevi, A., and Musacchio, A. (2009) Crystal structure of the catalytic domain of Haspin, an atypical kinase implicated in chromatin organization. Proc. Natl. Acad. Sci. U.S.A. 106, 20204–20209
6. Eswaran, J., Patnaik, D., Filippakopoulos, P., Wang, F., Stein, R. L., Murray, J. W., Higgins, J. M. G., and Knapp, S. (2009) Structure and functional characterization of the atypical human kinase haspin. Proceedings of the National Academy of Sciences 106, 20198–20203
7. Dai, J. J., Sultan, S. S., Taylor, S. S. S., and Higgins, J. M. G. J. (2005) The kinase haspin is required for mitotic histone H3 Thr 3 phosphorylation and normal metaphase chromosome alignment. Genes & Development 19, 472–488
8. Kelly, A. E., Sampath, S. C., Maniar, T. A., Woo, E. M., Chait, B. T., and Funabiki, H. (2007) Chromosomal Enrichment and Activation of the Aurora B Pathway Are Coupled to Spatially Regulate Spindle Assembly. Developmental Cell 12, 31–43
9. Wang, F., Dai, J., Daum, J. R., Niedzialkowska, E., Banerjee, B., Stukenberg, P. T., Gorbsky, G. J., and Higgins, J. M. G. (2010) Histone H3 Thr-3 Phosphorylation by Haspin Positions Aurora B at Centromeres in Mitosis. Science 330, 231–235
10. Yamagishi, Y., Honda, T., Tanno, Y., and Watanabe, Y. (2010) Two Histone Marks Establish the Inner Centromere and Chromosome Bi-Orientation. Science 330, 239–243
11. De Antoni, A., Maffini, S., Knapp, S., Musacchio, A., and Santaguida, S. (2012) A small-molecule inhibitor of Haspin alters the kinetochore functions of Aurora B. J. Cell Biol. 199, 269–284
12. Wang, F., Ulyanova, N. P., Daum, J. R., Patnaik, D., Kateneva, A. V., Gorbsky, G. J., and Higgins, J. M. G. (2012) Haspin inhibitors reveal centromeric functions of Aurora B in chromosome segregation. J. Cell Biol. 199, 251–268
13. Bernstein, E., Muratore-Schroeder, T. L., Diaz, R. L., Chow, J. C., Changolkar, L. N., Shabanowitz, J., Heard, E., Pehrson, J. R., Hunt, D. F., and Allis, C. D. (2008) A phosphorylated subpopulation of the histone variant macroH2A1 is excluded from the inactive X chromosome and enriched during mitosis. Proceedings of the National Academy of Sciences 105, 1533–1538
14. Adolph, K. W., Cheng, S. M., and Laemmli, U. K. (1977) Role of

! $*!
nonhistone proteins in metaphase chromosome structure. Cell 12, 805–816
15. The CENP-A NAC/CAD kinetochore complex controls chromosome congression and spindle bipolarity (2007) The CENP-A NAC/CAD kinetochore complex controls chromosome congression and spindle bipolarity. 26, 5033–5047
16. Gatti, M., Pinato, S., Maspero, E., Soffientini, P., Polo, S., and Penengo, L. (2012) A novel ubiquitin mark at the N-terminal tail of histone H2As targeted by RNF168 ubiquitin ligase. cc 11, 2538–2544
17. Mok, J., Kim, P. M., Lam, H. Y. K., Piccirillo, S., Zhou, X., Jeschke, G. R., Sheridan, D. L., Parker, S. A., Desai, V., Jwa, M., Cameroni, E., Niu, H., Good, M., Remenyi, A., Ma, J. L. N., Sheu, Y. J., Sassi, H. E., Sopko, R., Chan, C. S. M., De Virgilio, C., Hollingsworth, N. M., Lim, W. A., Stern, D. F., Stillman, B., Andrews, B. J., Gerstein, M. B., Snyder, M., and Turk, B. E. (2010) Deciphering Protein Kinase Specificity Through Large-Scale Analysis of Yeast Phosphorylation Site Motifs. Science Signaling 3, ra12–ra12
18. Dinkel, H., Chica, C., Via, A., Gould, C. M., Jensen, L. J., Gibson, T. J., and Diella, F. (2010) Phospho.ELM: a database of phosphorylation sites--update 2011. Nucleic Acids Research 39, D261–D267
19. Hornbeck, P. V., Kornhauser, J. M., Tkachev, S., Zhang, B., Skrzypek, E., Murray, B., Latham, V., and Sullivan, M. (2012) PhosphoSitePlus: a comprehensive resource for investigating the structure and function of experimentally determined post-translational modifications in man and mouse. Nucleic Acids Research 40, D261–70
20. Wenschuh, H., Volkmer-Engert, R., Schmidt, M., Schulz, M., Schneider-Mergener, J., and Reineke, U. (2000) Coherent membrane supports for parallel microsynthesis and screening of bioactive peptides. Biopolymers 55, 188–206
21. Collaborative Computational Project, Number 4 (1994) The CCP4 suite: programs for protein crystallography. Acta Crystallogr. D Biol. Crystallogr. 50, 760–763
22. McCoy, A. J., Grosse-Kunstleve, R. W., Storoni, L. C., and Read, R. J. (2005) Likelihood-enhanced fast translation functions. Acta Crystallogr. D Biol. Crystallogr. 61, 458–464
23. Emsley, P., and Cowtan, K. (2004) Coot: model-building tools for molecular graphics. Acta Crystallogr. D Biol. Crystallogr. 60, 2126–2132
24. Murshudov, G. N., Vagin, A. A., and Dodson, E. J. (1997) Refinement of macromolecular structures by the maximum-likelihood method. Acta Crystallogr. D Biol. Crystallogr. 53, 240–255
25. Chen, V. B., Arendall, W. B., Headd, J. J., Keedy, D. A., Immormino, R.

! %+!
M., Kapral, G. J., Murray, L. W., Richardson, J. S., and Richardson, D. C. (2010) MolProbity: all-atom structure validation for macromolecular crystallography. Acta Crystallogr. D Biol. Crystallogr. 66, 12–21
26. Bodenmiller, B., and Aebersold, R. (2010) Quantitative Analysis of Protein Phosphorylation on a System-Wide Scale by Mass Spectrometry-Based Proteomics. Meth. Enzymol. 470, 317–334
27. Keller, A., Eng, J., Zhang, N., Li, X.-J., and Aebersold, R. (2005) A uniform proteomics MS/MS analysis platform utilizing open XML file formats. Molecular Systems Biology 1, 2005.0017
28. Shteynberg, D., Deutsch, E. W., Lam, H., Eng, J. K., Sun, Z., Tasman, N., Mendoza, L., Moritz, R. L., Aebersold, R., and Nesvizhskii, A. I. (2011) iProphet: multi-level integrative analysis of shotgun proteomic data improves peptide and protein identification rates and error estimates. Molecular & Cellular Proteomics 10, M111.007690
29. Lam, H., Deutsch, E. W., Eddes, J. S., Eng, J. K., King, N., Stein, S. E., and Aebersold, R. (2007) Development and validation of a spectral library searching method for peptide identification from MS/MS. Proteomics 7, 655–667
30. Sturm, M., Bertsch, A., Gröpl, C., Hildebrandt, A., Hussong, R., Lange, E., Pfeifer, N., Schulz-Trieglaff, O., Zerck, A., Reinert, K., and Kohlbacher, O. (2008) OpenMS - an open-source software framework for mass spectrometry. BMC Bioinformatics 9, 163
31. Smyth, G. K. (2004) Linear models and empirical bayes methods for assessing differential expression in microarray experiments. Stat Appl Genet Mol Biol,
32. Eden, E., Navon, R., Steinfeld, I., Lipson, D., and Yakhini, Z. (2009) GOrilla: a tool for discovery and visualization of enriched GO terms in ranked gene lists. BMC Bioinformatics 10, 48
33. Franceschini, A., Szklarczyk, D., Frankild, S., Kuhn, M., Simonovic, M., Roth, A., Lin, J., Minguez, P., Bork, P., Mering, von, C., and Jensen, L. J. (2013) STRING v9.1: protein-protein interaction networks, with increased coverage and integration. Nucleic Acids Research 41, D808–15
34. Smoot, M. E., Ono, K., Ruscheinski, J., Wang, P.-L., and Ideker, T. (2011) Cytoscape 2.8: new features for data integration and network visualization. Bioinformatics 27, 431–432
35. Bensimon, A., Schmidt, A., Ziv, Y., Elkon, R., Wang, S. Y., Chen, D. J., Aebersold, R., and Shiloh, Y. (2010) ATM-Dependent and -Independent Dynamics of the Nuclear Phosphoproteome After DNA Damage. Science Signaling 3, rs3–rs3
36. Fermin, D., Basrur, V., Yocum, A. K., and Nesvizhskii, A. I. (2011)

! %"!
Abacus: a computational tool for extracting and pre-processing spectral count data for label-free quantitative proteomic analysis. Proteomics 11, 1340–1345
37. Choi, H., Larsen, B., Lin, Z.-Y., Breitkreutz, A., Mellacheruvu, D., Fermin, D., Qin, Z. S., Tyers, M., Gingras, A.-C., and Nesvizhskii, A. I. (2011) SAINT: probabilistic scoring of affinity purification-mass spectrometry data. Nature Methods 8, 70–73
38. Balzano, D., Santaguida, S., Musacchio, A., and Villa, F. (2011) A General Framework for Inhibitor Resistance in Protein Kinases. Chemistry & Biology 18, 966–975
39. Kelly, A. E., Ghenoiu, C., Xue, J. Z., Zierhut, C., Kimura, H., and Funabiki, H. (2010) Survivin Reads Phosphorylated Histone H3 Threonine 3 to Activate the Mitotic Kinase Aurora B. Science 330, 235–239
40. Bodenmiller, B., Mueller, L. N., Mueller, M., Domon, B., and Aebersold, R. (2007) Reproducible isolation of distinct, overlapping segments of the phosphoproteome. Nature Methods 4, 231–237
41. Beck, M., Schmidt, A., Malmstroem, J., Claassen, M., Ori, A., Szymborska, A., Herzog, F., Rinner, O., Ellenberg, J., and Aebersold, R. (2011) The quantitative proteome of a human cell line. Molecular Systems Biology 7, 1–8
42. Ohta, S., Bukowski-Wills, J.-C., Sanchez-Pulido, L., de Lima Alves, F., Wood, L., Chen, Z. A., Platani, M., Fischer, L., Hudson, D. F., Ponting, C. P., Fukagawa, T., Earnshaw, W. C., and Rappsilber, J. (2010) The Protein Composition of Mitotic Chromosomes Determined Using Multiclassifier Combinatorial Proteomics. Cell 142, 810–821
43. Musacchio, A., and Salmon, E. D. (2007) The spindle-assembly checkpoint in space and time. Nature Publishing Group 8, 379–393
44. Cheeseman, I. M., and Desai, A. (2008) Molecular architecture of the kinetochore-microtubule interface. Nature Publishing Group 9, 33–46
45. Clough, T., Key, M., Ott, I., Ragg, S., Schadow, G., and Vitek, O. (2009) Protein Quantification in Label-Free LC-MS Experiments. J. Proteome Res. 8, 5275–5284
46. Taverna, S. D., Li, H., Ruthenburg, A. J., Allis, C. D., and Patel, D. J. (2007) How chromatin-binding modules interpret histone modifications: lessons from professional pocket pickers. Nature Structural & Molecular Biology 14, 1025–1040
47. Kang, B., Pu, M., Hu, G., Wen, W., Dong, Z., Zhao, K., Stillman, B., and Zhang, Z. (2011) Phosphorylation of H4 Ser 47 promotes HIRA-mediated nucleosome assembly. Genes & Development 25, 1359–1364

! %#!
48. Kim, W., Chakraborty, G., Kim, S., Shin, J., Park, C.-H., Jeong, M.-W., Bharatham, N., Yoon, H. S., and Kim, K.-T. (2012) Macro histone H2A1.2 (macroH2A1) protein suppresses mitotic kinase VRK1 during interphase. Journal of Biological Chemistry 287, 5278–5289
49. Casado, P., Rodriguez-Prados, J. C., Cosulich, S. C., Guichard, S., Vanhaesebroeck, B., Joel, S., and Cutillas, P. R. (2013) Kinase-Substrate Enrichment Analysis Provides Insights into the Heterogeneity of Signaling Pathway Activation in Leukemia Cells. Science Signaling 6, rs6–rs6
50. Song, C., Ye, M., Liu, Z., Cheng, H., Jiang, X., Han, G., Songyang, Z., Tan, Y., Wang, H., Ren, J., Xue, Y., and Zou, H. (2012) Systematic analysis of protein phosphorylation networks from phosphoproteomic data. Molecular & Cellular Proteomics 11, 1070–1083
51. Linding, R., Jensen, L. J., Ostheimer, G. J., van Vugt, M. A. T. M., Jørgensen, C., Miron, I. M., Diella, F., Colwill, K., Taylor, L., Elder, K., Metalnikov, P., Nguyen, V., Pasculescu, A., Jin, J., Park, J. G., Samson, L. D., Woodgett, J. R., Russell, R. B., Bork, P., Yaffe, M. B., and Pawson, T. (2007) Systematic Discovery of In Vivo Phosphorylation Networks. Cell 129, 1415–1426
52. Zhou, Z., and Fu, X.-D. (2013) Regulation of splicing by SR proteins and SR protein-specific kinases. Chromosoma,
53. Anjum, R., and Blenis, J. (2008) The RSK family of kinases: emerging roles in cellular signalling. Nature Publishing Group 9, 747–758
54. Hutti, J. E., Jarrell, E. T., Chang, J. D., Abbott, D. W., Storz, P., Toker, A., Cantley, L. C., and Turk, B. E. (2004) A rapid method for determining protein kinase phosphorylation specificity. Nature Methods 1, 27–29
55. Obenauer, J. C. (2003) Scansite 2.0: proteome-wide prediction of cell signaling interactions using short sequence motifs. Nucleic Acids Research 31, 3635–3641
56. Miller, M. L., Jensen, L. J., Diella, F., Jorgensen, C., Tinti, M., Li, L., Hsiung, M., Parker, S. A., Bordeaux, J., Sicheritz-Ponten, T., Olhovsky, M., Pasculescu, A., Alexander, J., Knapp, S., Blom, N., Bork, P., Li, S., Cesareni, G., Pawson, T., Turk, B. E., Yaffe, M. B., Brunak, S., and Linding, R. (2008) Linear Motif Atlas for Phosphorylation-Dependent Signaling. Science Signaling 1, ra2–ra2
57. Gascoigne, K. E., Takeuchi, K., Suzuki, A., and Hori, T. (2011) Induced ectopic kinetochore assembly bypasses the requirement for CENP-A nucleosomes. Cell,
58. Glatter, T., Wepf, A., Aebersold, R., and Gstaiger, M. (2009) An integrated workflow for charting the human interaction proteome:

! %$!
insights into the PP2A system. Molecular Systems Biology 5,
59. Amabile, G., D'Alise, A. M., Iovino, M., Jones, P., Santaguida, S., Musacchio, A., Taylor, S., and Cortese, R. (2008) The Aurora B kinase activity is required for the maintenance of the differentiated state of murine myoblasts. Cell Death Differ 16, 321–330
60. Lemaitre, J.-M., Danis, E., Pasero, P., Vassetzky, Y., and Méchali, M. (2005) Mitotic Remodeling of the Replicon and Chromosome Structure. Cell 123, 787–801
61. Kloc, A., Zaratiegui, M., Nora, E., and Martienssen, R. (2008) RNA Interference Guides Histone Modification during the S Phase of Chromosomal Replication. Current Biology 18, 490–495
62. Georgatos, S. D., Markaki, Y., Christogianni, A., and Politou, A. S. (2009) Chromatin remodeling during mitosis: a structure-based code? Front. Biosci. 14, 2017–2027
63. Schneider, R., Bannister, A. J., Weise, C., and Kouzarides, T. (2004) Direct binding of INHAT to H3 tails disrupted by modifications. J. Biol. Chem. 279, 23859–23862
64. Couture, J.-F., Collazo, E., and Trievel, R. C. (2006) Molecular recognition of histone H3 by the WD40 protein WDR5. Nature Structural & Molecular Biology 13, 698–703
65. Chignola, F., Gaetani, M., Rebane, A., Org, T., Mollica, L., Zucchelli, C., Spitaleri, A., Mannella, V., Peterson, P., and Musco, G. (2009) The solution structure of the first PHD finger of autoimmune regulator in complex with non-modified histone H3 tail reveals the antagonistic role of H3R2 methylation. Nucleic Acids Research 37, 2951–2961
66. Southall, S. M., Wong, P.-S., Odho, Z., Roe, S. M., and Wilson, J. R. (2009) Structural basis for the requirement of additional factors for MLL1 SET domain activity and recognition of epigenetic marks. Molecular Cell 33, 181–191
67. Varier, R. A., Outchkourov, N. S., de Graaf, P., van Schaik, F. M. A., Ensing, H. J. L., Wang, F., Higgins, J. M. G., Kops, G. J. P. L., and Timmers, H. M. (2010) A phospho/methyl switch at histone H3 regulates TFIID association with mitotic chromosomes. The EMBO Journal 29, 3967–3978
68. Markaki, Y., Christogianni, A., Politou, A. S., and Georgatos, S. D. (2009) Phosphorylation of histone H3 at Thr3 is part of a combinatorial pattern that marks and configures mitotic chromatin. Journal of Cell Science 122, 2809–2819
69. Flanagan, J. F., Mi, L.-Z., Chruszcz, M., Cymborowski, M., Clines, K. L., Kim, Y., Minor, W., Rastinejad, F., and Khorasanizadeh, S. (2005) Double chromodomains cooperate to recognize the methylated histone

! %%!
H3 tail. Nature 438, 1181–1185
70. Verschure, P. J., van der Kraan, I., de Leeuw, W., van der Vlag, J., Carpenter, A. E., Belmont, A. S., and van Driel, R. (2005) In vivo HP1 targeting causes large-scale chromatin condensation and enhanced histone lysine methylation. Molecular and Cellular Biology 25, 4552–4564
71. Thomson, S., Clayton, A. L., Hazzalin, C. A., Rose, S., Barratt, M. J., and Mahadevan, L. C. (1999) The nucleosomal response associated with immediate-early gene induction is mediated via alternative MAP kinase cascades: MSK1 as a potential histone H3/HMG-14 kinase. The EMBO Journal 18, 4779–4793
72. Lim, J.-H., Catez, F., Birger, Y., West, K. L., Prymakowska-Bosak, M., Postnikov, Y. V., and Bustin, M. (2004) Chromosomal Protein HMGN1 Modulates Histone H3 Phosphorylation. Molecular Cell 15, 573–584
73. West, K. L., Ito, Y., Birger, Y., Postnikov, Y., Shirakawa, H., and Bustin, M. (2001) HMGN3a and HMGN3b, two protein isoforms with a tissue-specific expression pattern, expand the cellular repertoire of nucleosome-binding proteins. J. Biol. Chem. 276, 25959–25969
74. Lee, J. W., Choi, H. S., Gyuris, J., and Brent, R. (1995) Two classes of proteins dependent on either the presence or absence of thyroid hormone for interaction with the thyroid hormone receptor. Molecular !,
75. Kettenbach, A. N., and Gerber, S. A. (2011) Rapid and Reproducible Single-Stage Phosphopeptide Enrichment of Complex Peptide Mixtures: Application to General and Phosphotyrosine-Specific Phosphoproteomics Experiments. Anal. Chem. 83, 7635–7644
76. Costanzi, C., and Pehrson, J. R. (1998) Histone macroH2A1 is concentrated in the inactive X chromosome of female mammals. Nature 393, 599–601
77. Gamble, M., and Kraus, W. L. (2010) Multiple facets of the unique histone variant macroH2A: From genomics to cell biology. cc 9, 70–69
78. Chakravarthy, S., Patel, A., and Bowman, G. D. (2012) The basic linker of macroH2A stabilizes DNA at the entry/exit site of the nucleosome. Nucleic Acids Research 40, 8285–8295
79. Muthurajan, U. M., McBryant, S. J., Lu, X., Hansen, J. C., and Luger, K. (2011) The Linker Region of MacroH2A Promotes Self-association of Nucleosomal Arrays. Journal of Biological Chemistry 286, 23852–23864
80. Gascoigne, K. E., and Cheeseman, I. M. (2013) CDK-dependent phosphorylation and nuclear exclusion coordinately control kinetochore assembly state. J. Cell Biol. 201, 23–32
81. Hofmann, J. C., Husedzinovic, A., and Gruss, O. J. (2010) The function

! %&!
of spliceosome components in open mitosis. Nucleus 1, 447–459
82. Kadauke, S., and Blobel, G. A. (2013) Mitotic bookmarking by transcription factors. Epigenetics & Chromatin 6, 1–1
83. Neumann, B., Walter, T., Hériché, J.-K., Bulkescher, J., Erfle, H., Conrad, C., Rogers, P., Poser, I., Held, M., Liebel, U., Cetin, C., Sieckmann, F., Pau, G., Kabbe, R., Wünsche, A., Satagopam, V., Schmitz, M. H. A., Chapuis, C., Gerlich, D. W., Schneider, R., Eils, R., Huber, W., Peters, J.-M., Hyman, A. A., Durbin, R., Pepperkok, R., and Ellenberg, J. (2010) Phenotypic profiling of the human genome by time-lapse microscopy reveals cell division genes. Nature 464, 721–727
84. Chan, F. L., Marshall, O. J., Saffery, R., Kim, B. W., Earle, E., Choo, K. H. A., and Wong, L. H. (2012) Active transcription and essential role of RNA polymerase II at the centromere during mitosis. Proceedings of the National Academy of Sciences 109, 1979–1984
85. Ferri, F., Bouzinba-Segard, H., Velasco, G., Hube, F., and Francastel, C. (2009) Non-coding murine centromeric transcripts associate with and potentiate Aurora B kinase. Nucleic Acids Research 37, 5071–5080
86. MacLean, B., Tomazela, D. M., Shulman, N., Chambers, M., Finney, G. L., Frewen, B., Kern, R., Tabb, D. L., Liebler, D. C., and MacCoss, M. J. (2010) Skyline: an open source document editor for creating and analyzing targeted proteomics experiments. Bioinformatics 26, 966–968
Notes:
Acknowledgements: We thank members of the Aebersold, Gstaiger and
Wollscheid laboratories at IMSB for helpful discussions. Dr. Chris Barnes and
Dr. Martin Junger for critical reading of the manuscript. Funding: AM is
supported by EMBO long-term fellowship. Work in the Aebersold laboratory is
supported by the European Research Council (ERC) advanced proteomics
grant v3.0’ (grant#233266) and the PhosphoNetX program from SystemsX.ch.
Work in the Meraldi lab is supported by an SNF project grant, the Swiss
Cancer League and the Novartis Foundation. SK is grateful for support from
the SGC, a registered charity (number 1097737) that receives funds from
AbbVie, Boehringer Ingelheim, the Canada Foundation for Innovation, the
Canadian Institutes for Health Research, Genome Canada, GlaxoSmithKline,

! %'!
Janssen, Lilly Canada, the Novartis Research Foundation, the Ontario
Ministry of Economic Development and Innovation, Pfizer, Takeda, and the
Wellcome Trust [092809/Z/10/Z]. AC is supported by the European Union FP7
Grant No. 278568 "PRIMES". Author contributions: AM coordinated the
project, conducted most of the experimental work, and the data analysis.
MDM performed immunofluorescence experiments and contributed to set up
the purification of the chromatin samples for phosphorylation analysis, EMS
performed Haspin substrates prediction, AC crystallized Haspin-histoneH3 tail
complex, MG performed acidic extraction of the macroH2A from chromatin
samples, SJ purified CENP-T, HJL performed PS-OPLS experiment. AM, FV,
MDM, RA participated in the experimental design. KN, SKH, UHT, EMS
contributed to the data analysis. AM and RA wrote the manuscript with further
contribution from SK and FV. Competing interests: The authors declare that
they have no competing interests.
Figure legends:
Fig 1. Immunofluorescence analysis of the mitotic cells and the purified
mitotic chromatin.
(A) Schematic representation of AuroraB recruitment at centromeres.
Haspin phosphorylates Thr3 of the histone H3 (H3Thr3) at the
centromere. Survivin a component of the CPC recognize H3Thr3ph
and recruits other subunits of the complex including Aurora B
(adapted form (11)).
(B) 5-iTu has been shown to in inhibit phosphorylation of H3Thr3 at
concentration 1uM. HeLa cells were arrested in mitosis for 16

! %(!
hours with nocodazole (0.33 µM) and successively 10µ MG132
was added for 15 min to prevent mitotic exit. The cells were treated
with 1 µM 5-iTU to block Haspin activity. After 1,5 hours the mitotic
cells were isolated by shake-off and successively processed for
immunofluorescence. The cells were stained with DAPI (DNA,
blue), CREST sera (kinetochores, red), H3Thr3ph (green).
(C) Hela cells were treated as in B and stained with DAPI (DNA, blue),
CREST sera (kinetochores, red), CENP-A Ser7 phosphorylation
(green)
(D) Hela cells were prepared as in B and the mitotic chromatin purified.
Mitotic chromatin samples were gently centrifuged and stained with
DAPI (DNA, blue), CREST sera (kinetochores, red), H3Thr3ph
(green)
(E) Mitotic chromatin samples were prepared as in D and stained with
DAPI (DNA, blue), CREST sera (kinetochores, red), AuroraB
(green)
Fig 2. Inhibition of Haspin activity affects the phosphorylation status of
chromatin associate proteins.
,- Workflow describing the mass spectrometry approach used for
quantification of phosphorylation sites on chromatin proteins.
Chromatin samples were prepared as in figure 1D and the
phosphorylated peptides were enriched by titanium dioxide
chromatography (TiO2).
.- Overview of the identified phosphorylated sites on chromatin proteins.

! %)!
/- The protocol used for the purification of chromatin preserves protein-
protein interactions within the kinetochore. We identified several
phosphorylated proteins that are stably associated to the centromere
as well as proteins that just transiently localize to the corona of the
kinetochore. Either individual proteins or subunits of protein complexes
identified in this study are labeled in orange some of the other known
constituents of the kinetochore are colored in grey.
0- Volcano plot representing quantification of the phosphorylated
peptides. Logarithmic ratio of phosphorylated peptide intensities is
plotted against the negative logarithmic P-value. Blue and red circles
represent phosphorylation sites up- or down-regulated respectively
(log2FC '-3 and ( 3 and a p-value ' 0.05).
1- Functional classifications of the regulated phosphorylated proteins.
GOrilla algorithm (32) was used to retrieve statistically significant
enriched Gene Ontology (GO) terms within the set of regulated
phosphorylated proteins. Numbers on top of each bar indicate the
number of proteins in each identified GO cluster. Full list of the
enriched GO terms is available in table SS3.
Fig 3. The phosphorylation of histone macroH2A Ser137 depends by
the Haspin activity
,- Mass spectrometry quantification of the histone macroH2A doubly
charged phosphorylated peptide 135-AKS(Phospho)PSQKKPVSK-146
in chromatin samples upon Haspin inhibitor treatment. Areas of the
MS1 peaks were extracted using Skyline (86).

! %*!
.- HEK293 cells were either transfected with a cDNA encoding Haspin
(lanes 2 and 3) or the empty vector (Lane 1). Samples in lanes 3 and
4 were treated with the Haspin inhibitor 5-ITu (10uM) for 1,5 hours
before cell lysis. Protein extract were subjected to acid extraction and
analyzed by SDS-PAGE and immunodecorated with anti
phosphorylated-Ser137 of histone macroH2A, anti macroH2A, anti HA
or anti phosphorylated-Ser10 of the histone H3.
Fig 4. Kinase substrate enrichment analysis (KSEA) of the down-
regulated phosphorylated sites upon 5-iTu treatment.
,- Kinases inhibited by the 5-ITu treatment. Kinase targets were
predicted both with the Netphorest and GPS algorithms (17, 50). We
calculate the confidence of the kinase enrichments using the
hypergeometryc test distribution. The P-value cut-off was set at 5 x 10-
4 (table S4 contain the full list of kinase prediction).
.- Pie charts describing the substrates perditions for Aurora, CLK and
RSK kinases (tables S5-7 show the full list of substrates).
Fig 5. Identification of Haspin consensus motif and Haspin substrates
prediction
,- Identification of Haspin motif by positional scanning oriented peptide
library screening. Haspin reveals a strong selection for Ala in the
Ser/Thr -2, Arg in -1 and, Lys in +1 positions. Blue squared signals
denote Haspin preferences towards threonine rather than serine
residues. Negatively charged residues in the peptide substrate
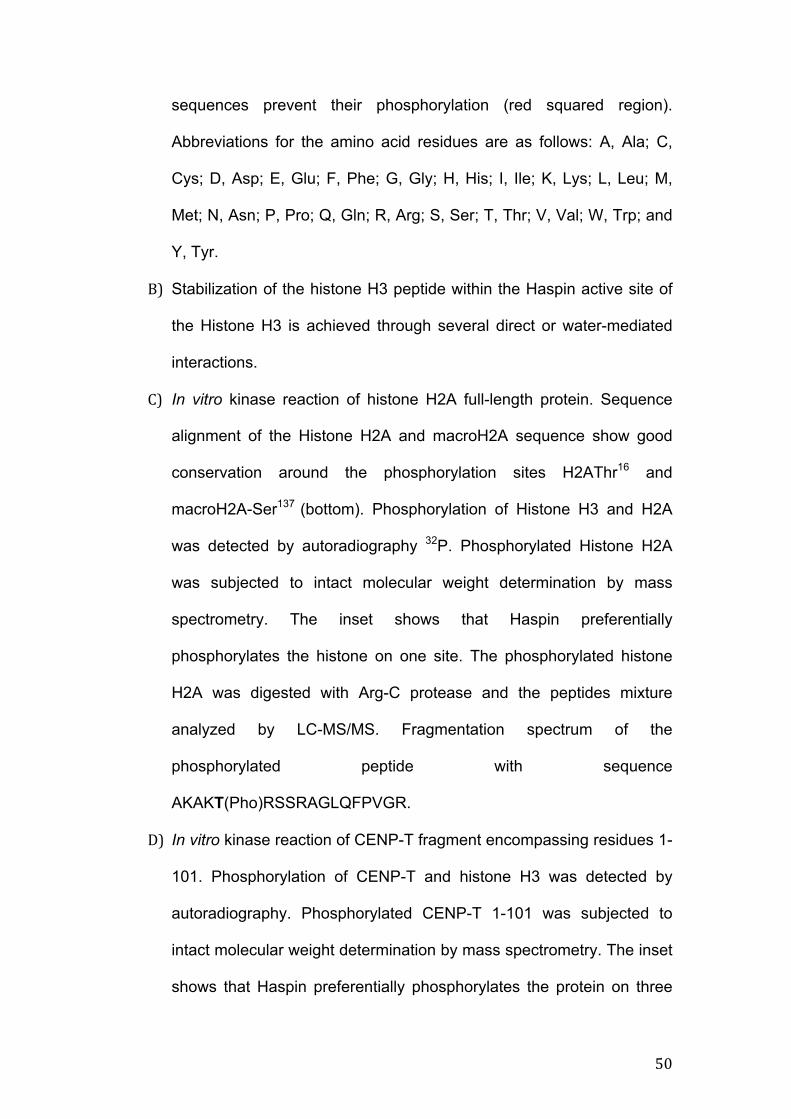
! &+!
sequences prevent their phosphorylation (red squared region).
Abbreviations for the amino acid residues are as follows: A, Ala; C,
Cys; D, Asp; E, Glu; F, Phe; G, Gly; H, His; I, Ile; K, Lys; L, Leu; M,
Met; N, Asn; P, Pro; Q, Gln; R, Arg; S, Ser; T, Thr; V, Val; W, Trp; and
Y, Tyr.
.- Stabilization of the histone H3 peptide within the Haspin active site of
the Histone H3 is achieved through several direct or water-mediated
interactions.
/- In vitro kinase reaction of histone H2A full-length protein. Sequence
alignment of the Histone H2A and macroH2A sequence show good
conservation around the phosphorylation sites H2AThr16 and
macroH2A-Ser137 (bottom). Phosphorylation of Histone H3 and H2A
was detected by autoradiography 32P. Phosphorylated Histone H2A
was subjected to intact molecular weight determination by mass
spectrometry. The inset shows that Haspin preferentially
phosphorylates the histone on one site. The phosphorylated histone
H2A was digested with Arg-C protease and the peptides mixture
analyzed by LC-MS/MS. Fragmentation spectrum of the
phosphorylated peptide with sequence
AKAKT(Pho)RSSRAGLQFPVGR.
0- In vitro kinase reaction of CENP-T fragment encompassing residues 1-
101. Phosphorylation of CENP-T and histone H3 was detected by
autoradiography. Phosphorylated CENP-T 1-101 was subjected to
intact molecular weight determination by mass spectrometry. The inset
shows that Haspin preferentially phosphorylates the protein on three

! &"!
and four residues respectively. The phosphorylated CENP-T 1-101
protein fragment was digested with Arg-C protease and the peptide
mixture analyzed by LC-MS/MS. We identified phosphorylation events
on Thr14/27/57 and Ser72 residues. The spectrum shows the
fragmentation of the peptide sequence
ALLETASPRKLSGQTRT(Pho)IAR.
Fig 6. A Haspin protein-protein interaction network
A) Haspin was expressed in Hek293 cell as strep-HA fusion protein. The
complex was purified from nococazole-arrested cells as well as cycling
cells. Only high confidence protein interactions are displayed (see
material and methods). The violet square groups proteins identified
being part of the splicesome complex (www. spliceosomedb.ucsc.edu).
The Green square groups proteins involved in the regulation of gene
transcription. Blue edges indicate protein-protein interactions annotated
in the STRING database with confidence score ( 0.4. Only
“experiments” and “databases” were considered as prediction methods
in STRING.
B) STRING interaction network of top scoring Haspin predicted substrate
proteins (green squares) and Haspin interacting partners. Blue edges
represent protein-protein interaction as described in (A)

16 hrs 33 nM
0.5 hrs 10 uM
1.5 hrs 1 uM
Figure 1
EC
BA
Control
1 M 5-iTU
Control
1 M 5-iTU
DControl
1 M 5-iTU
Control
1 M 5-iTU
CREST H3-T3Ph isolated DNA Merge
CREST AurB isolated DNA Merge
CREST H3-T3Ph CREST H3-T3Ph Overlay
CREST CenpA-S7Ph CREST CenpA-S7Ph Overlay
Nocodazole IFMG132 5-ITu
16 hrs 33 nM
0.5 hrs 10 uM
1.5 hrs 1 uM
Nocodazole IFMG132 5-ITu Chromatin purification
Haspin
Inhibitor
Aurk B
Sur
INCE
NP
BOR
P
5-iTu
Thr3
H3
H2A H2B
H4

Control
LC-MS/MSIdentification and quantification
Mitotic Chromatin purification
A
B
C
D E
Haspin inhibitor5-Iodo tubercidin
Mitotic Chromatin purification
Phosphorylated peptidesenrichment
9 188
1287
6537
4 Phosphorylation sites 3 Phosphorylation sites 2 Phosphorylation sites 1 Phosphorylation sites
4605
1217
0
1000
2000
3000
4000
5000
6000
7000 NovelPhosphorylation sites KnownPhosphorylatiion sites
1.00E-30
1.00E-27
1.00E-24
1.00E-21
1.00E-18
1.00E-15
1.00E-12
1.00E-09
1.00E-06
1.00E-03
1.00E+00
chromosome organization
RNA processing
RNA splicing
chromatin organization
cell cycle process
chromatin modification
regulation of RNA splicing
regulation of gene expression
chromosome segregation
mitosis
DNA packaging
Log10 P-value
Kinetochoremicrotubules
CentromereCENP-A nucleosomes
DLGAP5
RanGAPRanBP2
LIS1
CRM1 Nup 107-160complex APC/C
Dynein/dynactin
Mtw1Mis12complex
Spc105/KNL1
CENP-P CENP-Q CENP-UCENP-O
CENP-I
CENP-K CENP-R
ZWINT
CENP-L CENP-M
CENP-H
CENP-S CENP-X CENP-W
PLK1
MPS1
PLK1
Ndc 80HEC
complex
KIF23
KIF23
Fibrous corona
Outer kinetochore
Inner kinetochore
AurB
SURINCENP
BORAurB
SURINCENP
BOR MCAK
BUB1
BUB3
MPS1
MAD2
CENP-F
RZZ
MAD1
MCAK
Spindly
CENP-TCENP-C CENP-N
SGOL1
ch-TOG1 dimer
BUB3
HASP
EB1 dimer
CLASP1
CENP-E
BUBR1
Cdc20
Cdc20
Cdc20Cdc20
Soluble Cdc20 pool
CLIP
170
CLASP2
Nde1Ndel1
CENP-B
Kif2b
Ska1Ska2
1289
4375
158
Thr PhosphorylationsSer PhosphorylationsTyr Phosphorylations
64
57
3844
56
31
12 108 12 18 9
Log2 Fold Change
V
0
5
10
15
20
25
0 10
!!
!
!
!!!!
!!!!
!
!
!
!
!
!
!
!
!
!!!!!
!
!
!
!
!
!
!
!
!
!
!
!
!
!
!
!
!
!
!
!
!
!
!!
!!
!!!!!
!
!
!
!!!
!!!
!!!
!
!
!
!!
!!
!
!
!!!
!
!!
!
!
!
!!!!!
!
!
!
!
!
!
!
!!
!
!
!
!
!
!
!!
!
!
!
!
!
!
!
!
!!
!!
!
!!!!
!
!
!
!
!!!!!!!
!
!
!!!
!
!
!
!
!
!
!
!!!
!
!
!
!
!!!
!
!!
!
!
!
!
!
!!
!
!
!!!!
!
!!!!!
!
!
!
!!!!
!
!
!
!!
!
!
!
!
!
!
!
!
!
!!!
!
!
!
!
!
!!!
!
!
!
!
!!
!!
!
!
!
!!
!!
!
!!
!
!!!!!
!
!
!
!
!
!
!
!
!
!
!
!!!
!
!
!
!!!
!!!!!!!
!
!!!
!
!!!!!!
!!
!
!
!
!
!!
!
!!!!
!
!
!
!
!
!
!!
!
!
!
!
!!!!!!!!!
!!
!!
!!
!
!!
!
!!
!
!!!!!
!
!
!
!
!
!
!
!
!!!!
!
!!
!
!
!
!
!
!
!
!
!!!
!!!!!
!
!
!!!
!!
!
!!
!
!
!!!
!!!!!
!
!!!
!
!!
!
!!!!!
!!
!
!
!!
!
!!!
!!
!
!!!!!
!!
!
!
!
!
!
!
!
!!
!
!
!
!
!
!
!
!
!!!
!!!
!
!
!
!
!!!!!
!
!
!!!!!
!
!
!
!!!!!!!!
!
!
!
!
!
!
!
!
!
!
!
!
!
!!
!
!!
!!
!
!
!
!!!
!!
!
!
!!!!
!!
!
!
!
!
!!!
!!
!!!
!
!
!
!!!!
!
!!
!!
!
!
!
!!
!
!!
!!!!
!
!
!!
!
!
!
!!
!
!
!
!!!
!
!
!
!
!!
!!
!
!
!!!!
!
!!
!!
!
!!!
!
!
!
!!
!
!!
!!
!!
!!!
!
!!!!
!!
!!!!!!
!
!
!!!
!
!
!
!
!!
!
!
!
!!
!
!!!!!
!
!
!
!
!
!!
!
!
!
!!
!
!
!
!
!!
!
!!
!
!!
!
!
!
!!!
!
!
!!!
!
!
!
!
!
!!!!!
!
!
!!!!!
!
!
!!!!!
!!
!!
!
!!
!!!!
!
!
!
!!!!!!
!!!!
!
!
!!!
!!!!
!
!
!
!!
!!!!!!
!
!
!
!
!
!
!!
!
!!!!!
!
!!!!
!
!
!
!
!!!
!
!!!!!!!!!
!
!!!
!!
!
!
!
!
!
!!
!!
!
!!
!
!!
!
!
!
!
!!!
!
!
!
!!
!!!!
!
!!!
!!
!
!
!!
!!!
!!
!
!!!!
!
!!
!
!
!!!!!
!
!
!
!
!
!
!!
!!
!
!
!
!
!
!!
!
!
!!!
!!
!
!
!!!!
!
!!!!!!
!!
!
!
!
!
!
!
!!
!
!
!
!
!
!!
!
!!!
!!
!!
!
!!!!
!
!
!
!
!
!!!!
!
!!!!!
!!!
!
!
!
!
!!!!!
!!!!
!
!
!
!
!
!
!
!
!!
!
!!
!!!!
!!!!
!
!
!!
!
!
!!
!!
!
!
!
!
!!!!!
!
!
!
!!
!!
!!!!
!
!
!
!!!!!!!
!
!
!
!
!
!!!!!!!!
!
!
!!!
!!!!!!!!!
!!!
!
!!
!
!!
!
!
!
!
!!
!
!
!
!!
!
!
!
!!!
!!
!
!
!!!!
!
!
!!
!!
!
!
!
!!!!
!!
!
!
!!!!!!!!!!!!
!!!
!!!
!!
!
!!!
!
!!!!!!!!!!
!!!
!
!
!!
!
!
!
!
!!!
!!!!
!!
!
!!
!
!!
!
!
!!!!!!!!!!
!!!
!
!!
!
!!!!
!
!!!!!!
!
!
!
!!
!!!!!!!!
!!!!!!
!
!!!!!!!!!!!
!
!!!!!!!!!
!!!
!!
!
!!
!
!!
!!
!
!
!
!!!!
!
!!
!!
!
!
!!
!!!!!
!
!
!
!
!
!
!!!!!
!
!!!!!!!
!
!
!
!!!
!!
!!!!!
!
!!
!
!
!!
!
!
!!!!!
!
!!
!
!!!
!
!!!
!
!!!!!
!
!!!!!!!!
!
!
!
!
!
!
!
!!!!
!
!!!!!!!
!
!!!!!!!!!!!!
!
!!!!
!!
!
!
!
!
!
!
!!!!!
!
!
!
!!
!
!
!!
!!!!
!!!
!!
!
!
!!!!!
!!
!!!!!
!
!
!
!!!!!!
!
!
!
!!!!!
!!!!!!!!!!!!
!
!!!!!
!!
!!!!!
!!!!!!!!!!!!!!
!!
!!!
!
!
!
!!!!!
!!
!
!
!!!!!!!!!!!!!
!
!!
!
!!!!!
!!!!!!
!
!!!!!!
!
!!!!
!!!!!!!!!!!!!
!
!
!
!!!!!!!!
!
!!!!
!!!!!!
!
!!!!!
!
!!!!
!!!
!
!!!!!!!!!!!
!
!!!!!!!!!
!
!!!!!!!!!
!!!!!!!!!!
!!!!
!
!!!!!!!!!!!!!!
!
!!!!!!!!!!!!!!!!!!
!
!
!
!!!
!
!!!!!!!!!!!!!!!!!!!!!!!!!!!!!
!!!!!!!!!!!!!!!!!!!!!!!!!!!!!!!
!
!
!
!!!!!!!!!!!!!!!!!!!!!!!!!!!!!!!!!!!!!!!!!!!!!!!!!!!!!!!!!!!!!!!!!!!!!!!!!!!!!!!!!!!!!!!!!!!!!!!!!!!!!!!!!!!!!!!!!!!!!!!!!!!!!!!!!!!!!!!!!!!!!!!!!!!!!!!!!!!!!!!!!!!!!!!!!!!!!!!!!!!!!!!!!!!!!!!!!!!!!!!!!!!!!!!!!!!!!!!!!!!!!!!!!!!!!!!!!!!!!!!!!!!!!!!!!!!!!!!!!!!!!!!!!!!!!!!!!!!!!!!!!!!!!!!!!!!!!!!!!!!!!!!!!!!!!!!!!!!!!!!!!!!!!!!!!!!!!!!!!!!!!!!!!!!!!!!!!!!!!!!!!!!!!!!!!!!!!!!!!!!!!!!!!!!!!!!!!!!!!!!!!!!!!!!!!!!!!!!!!!!!!!!!!!!!!!!!!!!!!!!!!!!!!!!!!!!!!!!!!!!!!!!!!!!!!!!!!!!!!!!!!!!!!!!!!!!!!!!!!!!!!!!!!!!!!!!!!!!!!!!!!!!!!!!!!!!!!!!!!!!!!!!!!!!!
!!!!!!
!
!
!
!!!!!!!!!!!!!
!
!!
!!!!!!!!!!
!
!!!!!!!!!!!!!!!!!!!!!!!!!!!!!!!!
!
!!!
!!!!!!!!!!
!!
!!!!!!!!!!!
!
!!!
!!!
!!!
!
!
!!!!!!!
!!!
!!!!!!
!!!
!
!
!!!!!!!!!!!
!
!!!!!!!!!!!!!!
!
!!!
!
!
!
!
!!!!!
!
!!!!
!
!!!!
!
!!!!!!!!!
!!!
!!!!!
!!!
!
!
!
!!!!!!!!!!!!!!!
!!!!!!!!!!!!!!
!
!!
!
!
!!!!
!
!!
!
!!!!
!!!!!!
!
!!!!!!!!!!
!
!!
!
!!!!
!!
!!
!
!
!
!!!!!
!!
!
!
!
!!!
!
!
!!!
!!!!!
!
!
!
!!!!!!!
!
!
!!!!!!!
!
!
!!!
!
!
!
!
!!!
!!!!
!
!
!!
!
!
!
!
!!
!!!!!!
!!!!!!!
!
!
!!!!
!
!
!
!
!!!
!!!!
!!
!
!!
!
!!!!
!
!!!!!!!!!!
!!!!!
!
!
!
!
!
!!!
!
!!!!!!!!!!!!!
!
!!
!
!!!!
!!
!!
!!!!!
!
!!
!
!!
!
!!!
!!!!!!!
!
!!!!!!
!!!
!!!!!!
!
!!!!!!!!!
!
!
!
!!!!
!!!
!
!
!!!!!!
!!
!!!!
!!
!
!!
!
!!!
!!!!!!
!!!!!
!
!!!
!
!!!!
!
!!!!!!!!!!!
!
!
!!
!!
!
!
!!
!!
!!
!!!!
!
!
!
!
!
!!
!
!!!
!
!
!
!!!
!!
!!!
!!
!
!
!
!
!
!
!!
!!!
!
!!!
!
!!
!
!
!
!
!!!!
!!
!!!!
!
!
!
!
!
!!!!
!!
!
!
!!!
!
!
!
!
!!!!!!!
!
!
!
!
!
!!!!!
!!!!!!
!
!
!
!
!
!
!!!!!
!!!!
!
!!
!
!!
!
!
!!!
!
!!
!
!!!
!!!!!!
!
!
!
!
!!
!!!
!!!!!!
!
!
!
!
!!!!!!
!
!
!!!!
!!
!!!
!
!
!
!!!
!
!!!!!!!!!!!
!
!!
!!
!!!!
!
!!!
!!!!
!
!!!!!
!
!!!
!!
!!
!!!!
!
!
!
!
!
!
!!
!
!!!!!
!!!
!
!
!
!
!!
!
!
!
!!!
!
!!
!
!!!!!!
!
!!
!!
!!!!
!
!
!
!
!!!!!
!
!!!!
!!
!!
!
!
!
!
!
!
!
!!
!
!!
!
!
!
!!
!
!!
!!!
!
!!!
!
!!!
!!!
!!
!
!
!
!
!!
!!
!!!!
!!!!!
!
!
!!
!
!!!!
!
!!!!
!
!
!
!!
!
!!
!
!
!
!!!!
!
!
!
!!
!
!
!
!
!
!
!!!!!!!!!!!!!!!
!
!
!!!
!
!
!
!
!!!
!!
!
!!!
!
!!
!
!
!
!!!!
!
!!
!
!
!!!!!
!
!
!
!!!
!
!
!
!
!
!!!!
!
!
!
!
!!
!!
!
!!
!!!!!!
!!
!
!
!
!
!
!
!!!!
!
!
!
!
!
!!!
!!
!!!
!!!!!
!
!!!!
!
!
!!!
!
!!
!
!
!
!!!!!!!!!
!
!!
!
!
!
!
!!!!
!
!
!!
!
!
!!!
!
!!!
!
!
!
!
!!!
!
!!!!
!!!
!!
!
!
!
!
!
!
!!!!!!!!
!!!!!
!
!
!!!!!
!
!
!
!
!
!!!
!
!
!!
!
!!!
!
!
!
!!
!
!
!
!
!
!
!
!!!!!!
!
!!!
!
!
!
!
!!!!!
!
!!!!!
!
!!
!
!
!
!
!!!
!
!!
!
!!!
!
!!
!
!
!!
!!
!!
!
!
!!!
!
!
!!!!!
!
!!
!!
!
!
!!!
!
!!!!!
!!!!!
!!
!
!
!
!!!!
!
!!!!!!
!
!
!!
!
!!!!
!!
!
!!
!!
!!!
!!
!
!!!!!!!!
!
!!!
!!
!
!!
!
!!
!
!!!!!
!
!
!
!
!
!
!
!
!
!
!
!!!
!!
!!!!!!!!
!
!
!
!!
!
!!
!
!
!
!!
!
!
!
!!
!
!!
!
!!!
!
!
!
!
!
!!!
!
!
!!
!
!
!!
!
!
!
!
!
!!!
!!!
!
!!
!
!!!!!!!!!!!!!!!
!
!!
!!!!
!
!
!
!
!!
!
!!!
!
!!!!!!!!
!
!
!
!!
!
!!
!!
!!
!!!!
!!
!
!
!
!!
!!!
!
!
!
!
!!
!
!!!!!!
!
!!
!
!!!
!!!
!!
!
!!!!!!!!
!
!
!
!!!
!
!!!!!
!
!!!
!!
!
!
!
!!
!
!
!!!
!
!
!
!
!!!!!
!
!!
!
!!
!!
!!
!!
!!!!
!!
!
!!
!
!!!!
!!
!
!!!!!
!
!!
!
!
!
!!!
!
!!
!
!
!
!
!
!
!
!!!!
!!!!
!
!!
!!
!
!
!!!!!
!
!
!!
!!
!
!
!
!
!!!
!
!
!!
!!!!!!!
!!!!
!!!!
!
!
!
!
!
!!!!
!
!
!
!
!!!!
!
!
!
!
!
!
!!!!!!!
!
!!!!
!
!
!
!
!
!
!!!!
!
!
!
!
!
!!!!!
!!!!
!
!!
!
!!
!
!!
!!!
!
!
!!!!!!!!!!!!!!!!!!!!!
!
!!
!
!!
!!!!!!
!
!!!!!!
!
!!
!
!!!!!!!!!!!!!!!
!
!!!!!!!!!!!
!!!!!!!!!!!!!!!!!!!!!
!
!!!!!
!
!!!!
!
!
!
!
!
!!!!
!
!!!!!!!!
!!!!!!!!!!!!!!!!!!!!
!
!!!!
!
!!
!
!
!
!!!!!!
!
!!!!!!!!!!!
!
!!!
!
!!!!!!!!!!!!!
!!
!!!!!!
!
!!!!
!
!!
!!!!!!!
!!!
!
!
!
!!!!
!!!!
!!
!
!
!
!
!
!
!
!
!
!
!
!
!
!
!
!
!
!
!
!
!!!
!
!
!!
!
!
!
!!!
!
!
!!!
!
!
!
!
!
!!!
!
!
!
!
!!
!
!
!!!
!
!
!!!!
!
!
!
!
!
!
!
!
!
!
!!
!
!
!!
!
!
!
!
!!
!
!
!
!
!
!
!
!
!
!
!!
!
!!!!!!
!
!
!
!
!
!
!!!
!
!
!
!
!
!
!
!!
!
!!!
!
!
!!!
!
!
!
!!
!
!!!
!
!
!
!!
!
!
!
!!
!
!
!!!!!!
!
!
!
!
!!
!
!!!!!
!
!
!
!!
!
!
!
!
!
!
!!!
!!
!
!
!!
!
!
!
!
!!
!
!
!
!
!!
!
!
!!
!
!
!!!
!!
!
!!
!!
!!!!!!
!
!
!!
!
!!!!
!!!
!
!!!
!!
!
!
!
!!
!!!!!!
!!!
!!!
!
!!!
!
!!!
!!
!!
!
!!!
!
!
!!!
!
!
!
!!!
!!
!
!
!
!
!!
!
!
!!!
!
!!!
!!!!!
!
!!!!
!
!
!
!!
!
!!!
!
!
!
!
!!!!!
!
!!
!
!
!
!
!
!!!
!!
!!
!
!
!
!!
!!
!
!
!!!
!
!!
!!!!!!
!
!!!!!!!!
!
!!!!!!
!
!
!!
!
!!!!
!
!
!
!
!
!
!!
!!
!
!
!
!
!!
!!
!
!
!!
!
!
!
!
!
!
!
!
!
!!
!
!
!!!
!
!
!!!
!
!
!
!
!
!
!
!
!
!
!
!
!
!
!
!
!
!!
!!!!!!
!
!
!
!!
!!!
!
!
!
!!!!
!
!
!
!
!
!!!!!!!
!
!!!!!
!
!
!
!!
!!!!
!
!
!
!!!!
!
!!!!!!
!
!
!!
!
!!!!!!!!!!
!
!!
!
!!
!
!
!
!!!!!!!!!!!!!!!
!
!!!!!!!!!
!
!!
!
!!!!!!!!!!
!
!
!
!!!!
!
!!!
!
!
!!!!
!!
!
!!
!
!!
Figure 2
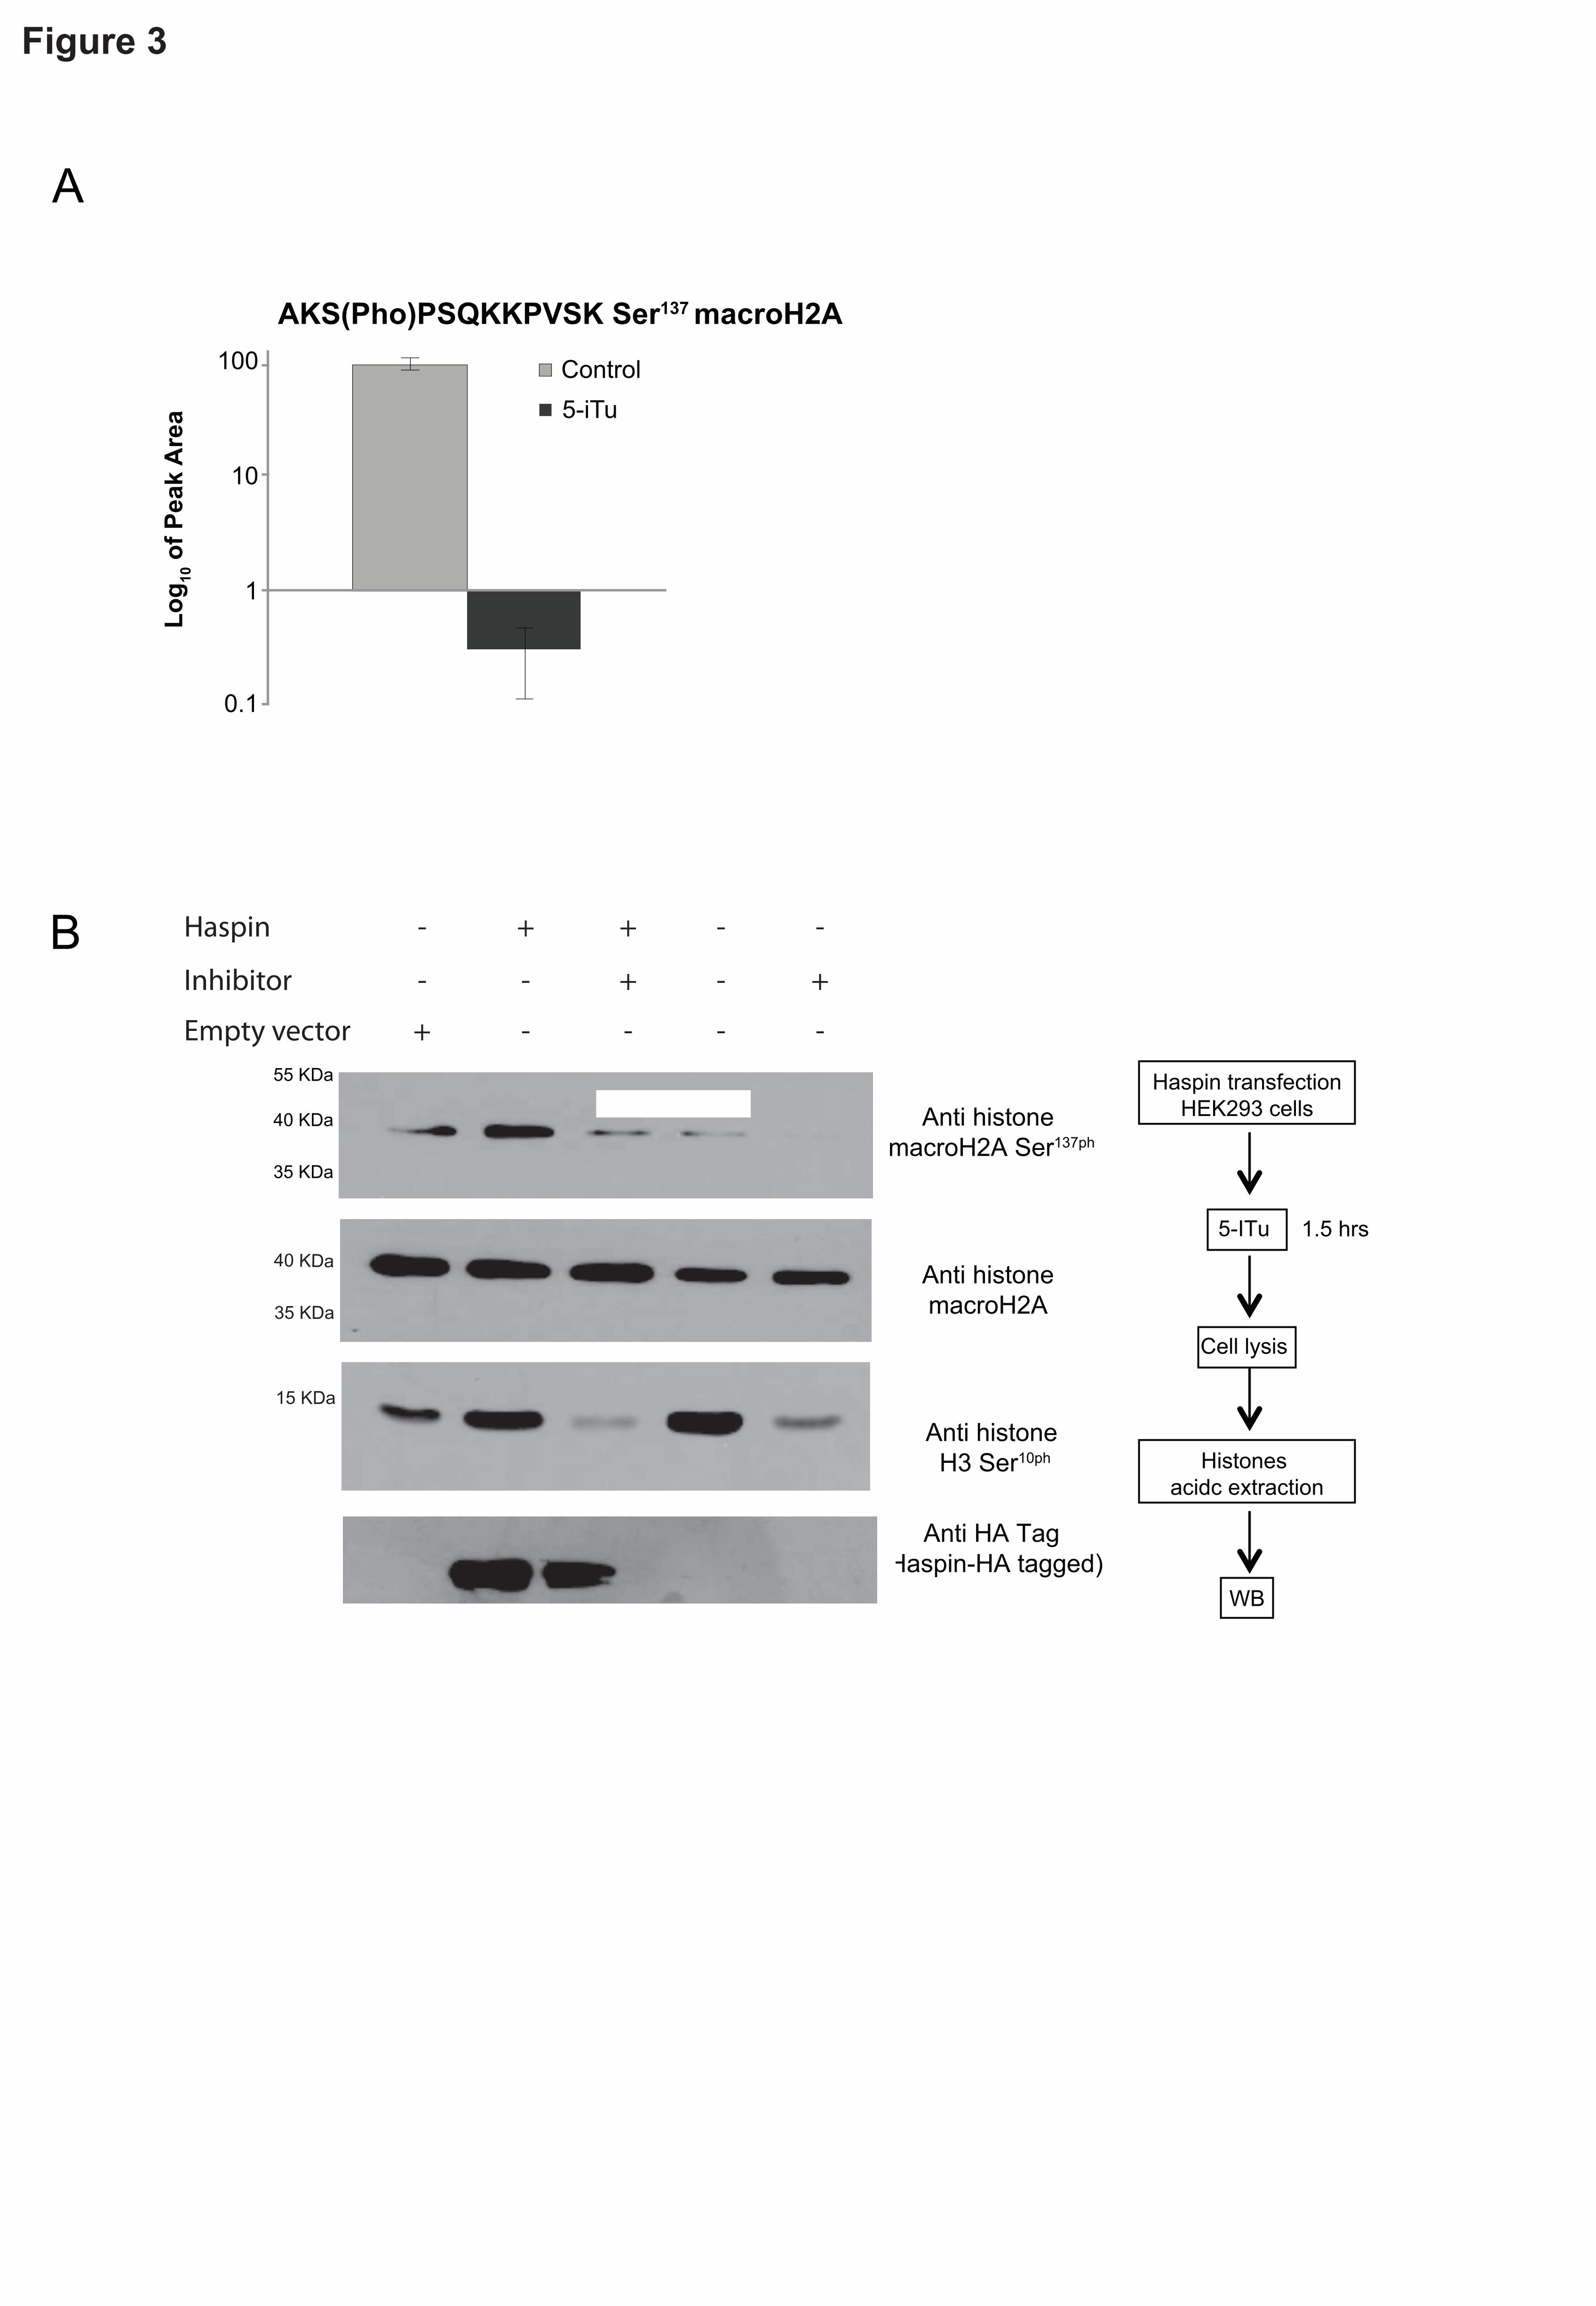
0.1
1
10
100
Log10 of Peak Area
AKS(Pho)PSQKKPVSK Ser137 macroH2A
Control
5-iTu
A
B
Anti histone
macroH2A Ser137ph
Anti histone
macroH2A
Anti histone
H3 Ser10ph
Anti HA Tag
(Haspin-HA tagged)
35 KDa
55 KDa
40 KDa
35 KDa
40 KDa
Haspin -
-
- - - -
- +
+
+
+
+-
- -
Inhibitor
Empty vector
15 KDa
1.5 hrs
Haspin transfection
HEK293 cells
Histones
acidc extraction
WB
Cell lysis
5-ITu
Figure 3

A
B
AUR
Aurorapredicted substrates
CLKpredicted substrates
RSKpredicted substrates
2.79E-06CLK_group 2.86E-05AGC.RSK 0.00017791
4
14
8 Other
Mitosis
Histon
10 5
3
Gene expression/Splicing factor
Microtubles stabilization and organization
Other 4
2
4
1
Regulation of transcription
Figure 4
Other
Histon associated protein
Histon

Figure 5
poly Ser/Thr peptides
786.4198
791.7550
805
800
795
790
785
780
775
3P15+781.0904
P
P
5P
13871303
12221143
1067993
922854
788725
665
100
0
Histone H
3Hist
one H2A
Haspin
b9 -98968.6
y9944.5
y16++906
y15++870.5
y7816.5
b15 -98++791.5
b14 -98++742.9
y13++715.9
b12++654.4
y16+++604.3
b11++597.8
y11++594.3
y10++550.8b14 -98+++495.6b5-98
482.3
y4428.3
b4=399.3
y2232.1
b2200.1
200 400 600 800 1000 1200 1400 m/z
Inte
nsity
AKAKT(Pho)RSSRAGLQFPVGR, Charge 3 H2A1-Thr 16
100
0
P
663
660
657
672
669
666
678
675
21+665.2790
21+669.0863
21+672.8868
P
950900
850800
1000
100
0
y ++1 0 3 2 . 5
y79 2 5 . 4y1 5 -9 8 ++
8 1 2 . 1
b1 4 ++7 2 6 . 8
b76 8 5 . 9
y1 1 ++6 5 6 . 6
y5 -9 85 9 8 . 7
pre c u rso r -9 8 ++++5 3 8 . 8
y9 ++5 3 5 . 9
b9 ++4 7 0 . 6
b44 2 7 6b7 ++
3 4 4
b32 9 7 . 9
y22 4 6 . 4
b21 8 4 . 9
200 400 600 800 1000 1200 m/z
Inte
nsity
1 8
ALLETASPRKLSGQTRT(Pho)IAR, Charge 4 CENPT-Thr54
Histone H
3CEN
P T 1-101
Haspin
Histone_H2A1 11 RAKAKTRSSRAGL -23Histone_macro-H2A 132 AKKAKSPSQKKPV -144
A
C D
B
P G A C S T V I L M F Y WH K R Q N D E-5-4-3-2-1
+1+2+3+4
Fixed residue
Fixe
d po
sitio
n
0- S T
pTpY
Y-A-X-X-X-X-X-S/T-X-X-X-X-A-G-K-K(biotin)-5 -4 -3 -2 -1 +1+2+3+40
-1
A1R2 T3 K4
Q5E613
hinge
!AS
Q718
activationloop
!F
D649 (HRD)
"1
!-uIH-"5loop
W652
D714
D707
D709L710
N588N522
E492
"7
2.8
2.9
2.7
2.9
2.6
2.8
2.93.0
3.02.7
2.9
2.7
2.8
2.8
2.8
3.02.6
5-iTU
-2 0 +1
+2

A B
Haspin Strep-HA
Purification
Hek293
cell
Haspin interacting partners
Haspin interacting partners Haspin top scoring predicted substrates
LC-MS/MSIdenti!cation of
Haspin Binding partners
PSMD2 TCOF
RL37A
MYO1B
SHRM3
EIF3J
LG3BP
C1TC
DNJA1
U520
RUVB2
HNRL1
DDB1
RBMX
CHIP
HNRPC
H2B1J
RS15
G3BP1
FBRL
H13
IPO5
TBB6
K1967 SF3B1
PRP8
UBR5
U5S1
DHX15
LC7L2
SF3B2
RTCBHNRPF
TBB4A
TBA1C
RS5MUC5A
DNJA2
SEMG1 IQGA2
STIP1
PSME3
RUVB1
HNRPQ
ROA0
PRP19
HS90A
SF3B3
H2A1
Splicing Database
Regulation of Genes
trascription
LAP2 TRA2A
CLK2
NPAT
PRP4B
SF3B3
U520
U5S1
HNRL1
SF3B2
ROA0HS90A
RUVB2
PRP8
HNRPC
DDB1
K1967
CHIP
UBR5
STIP1
SRSF7
TRA2B
SRS11
NUP93 SRSF2
SRSF1
HNRPF
PRP19
RUVB1 RBMX
DNJA1
FBRL
DHX15DNJA2
SF3B1
Figure 6


![Long Noncoding RNAs, Chromatin, and Developmentdownloads.hindawi.com/journals/tswj/2010/180798.pdf · active chromatin modifications and a more open chromatin conformation[26,39,40,41,42].](https://static.fdocuments.us/doc/165x107/5f8885d811957319d07a36bf/long-noncoding-rnas-chromatin-and-active-chromatin-modifications-and-a-more-open.jpg)