Modulation of neuronal activity using magnetic ...
102
Modulation of neuronal activity using magnetic nanoparticles and magnetic field stimulation – a computational modeling study Nahid Taheri Mestrado em Física Médica Faculdade de Ciências da Universidade de Porto Supervisor: Paulo de Castro Aguiar Co-Supervisor: Joaquim Agostinho Moreira
Transcript of Modulation of neuronal activity using magnetic ...

Modulation of neuronal activity using magnetic nanoparticles and magnetic field
stimulation – a computational modeling study
Nahid Taheri
Mestrado em Física Médica
Faculdade de Ciências da Universidade de Porto
Supervisor: Paulo de Castro Aguiar Co-Supervisor: Joaquim Agostinho Moreira

II

III
Acknowledgments
I thank my dissertation advisors Dr. Paulo Aguiar and Dr. Joaquim Moreira. Their
encouragement and advice has made the study and redaction of this thesis a very
rewarding experience, with many challenges and hard work.
Additionally, I could not have accomplished what I have without the love and support
of my family. I express my gratitude for their moral and financial support during my
years of study. Finally, I would like to address special thanks to my husband for his
assistance and encouragement.
Nahid Taheri

IV
Abstract
This work focused on modeling and simulating the conditions in which external radio-
frequency magnetic fields can be effectively and safely used to activate neurons
expressing temperature sensitive transient receptor potential cation channels, subfamily
V member 1 (TRPV1).
Advances in different fields of science such as nanotechnology and neuroscience leads
to the pursuit of new methods to achieve neuronal stimulation/modulation. An innovative
method for remote control of neuronal activity has recently been achieved through
combination of magnetic nanoparticles and magnetic stimulation. Magnetic
nanoparticles (e.g. iron oxide based) submitted to tuned magnetic fields convert the
magnetic energy to local heat. The change in temperature is within the range that
activates neuronal TRPV1 channels, which are one of the principal, ubiquitous, thermal
sensors/transducers in the nervous system - thermal energy stimulates these channels
and an action potential (AP) is produced (or facilitated) in the neural membrane. Although
many studies have addressed the effect of temperature on neural ionic channels, the
mechanism of temperature sensitivity is still obscure. More importantly, the details on the
temperature-dependent dynamics of the interaction between (AP)s generating channels
and TRPV1 channels are unknown.
The main goal of this study was to describe, in high biophysical detail, the neuronal
membrane electrophysiological mechanisms behind AP generation by magneto-thermal
stimulation. This implicated the development and simulation of biologically realistic
models of neuronal membrane dynamics, including the contribution of temperature on
the gating mechanism of the core membrane channels: sodium (NaV), potassium (KV),
calcium (CaV) and TRPV1 channels. For the mathematical description of the channels’
dynamics, we used the Hodgkin and Huxley conductance formalism/models. The
dynamics of TRPV1 channels are directly gated by temperature, however they are also
voltage dependent; on the other hand, sodium, potassium and calcium voltage-gated
channels have their kinetics modulated by temperature; their synergistic interactions are
far from understood. The NEURON simulation environment, a well-established
computational tool for theoretical / in silico neuroscience, was used to develop and

V
simulate our models. Specific stimulation protocols were designed and applied to assess
neuronal responses. With these stimulation protocols, we analyzed the combined
behavior of the voltage-gated channels during electrical stimulations and at different
temperatures (as produced by magneto-thermal stimulation).
In this work, we constructed the first computational model for TRPV1 channels. The
results of simulations with this model were validated and a good match to experimental
records was observed. With the goal of understanding the behavior of TRPV1 channels,
several simulations were designed and interesting results were reached. As an example,
results show that AP does not occur at temperatures higher than about 40𝑜𝐶 when
TRPV1 channels are not expressed in the membrane. TRPV1 channels are responsible
for generation of APs in the temperature range of 40𝑜𝐶 to 51𝑜𝐶. Interestingly, a different
trend for 𝐶𝑎𝑉 channels gating was recorded at 43𝑜𝐶 which is an important temperature
level for activation of TRPV1 channels. It can be concluded that 𝐶𝑎𝑉 channels may have
an important role in gating process of TRPV1s. The produced biophysical models of the
neuronal membrane also allowed us to uncover the combined contributions of the
temperature- and voltage-gated channels in the process of AP generation upon
magneto-thermal stimulation. This allows optimization of future systems using this type
of stimulation. Finally, a novel quantal model is put forward as an aid to explain the
behavior of ionic channels when thermal stimulation changes the temperature of the
system and cause neural impulses. Using basic rules of thermodynamics, the behavior
of channels under thermal and electrical stimulation is formalized. It is suggested that
this model can be applied to find the mechanisms of a wide range of channel type under
a wide range of physical stimulation. In fact, it is indicated that channels use the easiest
way to consume energy for gating. The gate to activate/deactivate uses any type of
energy that matches well with the gating requirements (in the case of energy amount
and frequency). Thereafter, this model is investigated for TRPV1 and voltage gated
channels in general. This leads to mathematical equations describing the gating process
when heat and/or current is ‘injected’ to the membrane. The constructed model shows
that exposure of heat increases the entropy and enthalpy of the system to a threshold
value which provides the required conditions for generation of TRPV1-caused spikes.
The results of simulations with this model matches well experimental data. In addition,
our model addresses key problems arising from the use of the temperature factor (𝑄10)
for the description of temperature dependence.
Key words: neuron, soma, TRPV1, Hodgkin and Huxley, ionic channel,
temperature, Gibbs energy

VI
VII
Table of Contents
Abstract ....................................................................................................................... IV
Chapter 1 ...................................................................................................................... X
Introduction ............................................................................................................... - 1 -
Chapter 2 .................................................................................................................. - 5 -
Literature Review ...................................................................................................... - 5 -
Heating of ionic channels by magnetic stimulation of nanoparticles ...................... - 5 -
Membrane potential .............................................................................................. - 6 -
Electrical circuits help explain neural functions ..................................................... - 9 -
Hodgkin and Huxley model for equivalent circuit of 𝑵𝒂𝑽 , 𝑲𝑽 , 𝑪𝒍𝑽 channels..... - 11 -
Action Potential ................................................................................................... - 13 -
Potassium current ............................................................................................... - 15 -
Sodium current ................................................................................................... - 18 -
Leak current ........................................................................................................ - 19 -
Summary of HH model: ....................................................................................... - 19 -
Effect of temperature .......................................................................................... - 20 -
Voltage gated Calcium currents .......................................................................... - 21 -
Transition State Theory ....................................................................................... - 22 -
TRP channels ..................................................................................................... - 23 -
Effect of Magnetic field ........................................................................................ - 23 -
Basic principles ............................................................................................... - 23 -
NEURON software .............................................................................................. - 30 -
Creating a simple compartment ....................................................................... - 30 -
Inserting the properties of the membrane ........................................................ - 32 -
Injection of current: .......................................................................................... - 32 -
How to run the simulation? .............................................................................. - 34 -
Modeling by graphical interface ....................................................................... - 34 -
Kirchhoff’s law: ................................................................................................ - 35 -

VIII
Neuronal Network ........................................................................................... - 37 -
Figures generation .......................................................................................... - 40 -
Chapter 3 ................................................................................................................ - 41 -
Effect of temperature on voltage gated sodium, potassium and calcium channels .. - 41 -
Methods and Settings ......................................................................................... - 41 -
Result 1: Membrane voltage versus time ............................................................ - 42 -
Result 2: Gating parameters ............................................................................... - 45 -
Effect of thermal and electrical stimulation in VClamp condition .......................... - 47 -
Result 1 : Effect of temperature on time constant ............................................ - 47 -
Result 2: Gate number versus temperature and voltage ................................. - 48 -
Chapter 4 ................................................................................................................ - 51 -
A code for TRPV1 ................................................................................................... - 51 -
Experiments on dependence of TRPV1 on membrane voltage ........................... - 51 -
Results of simulations for voltage dependency of TRPV1 ................................... - 52 -
Chapter 5 ................................................................................................................ - 58 -
Simulation: Role pf TRPV1 channels in membrane stimulations ............................. - 58 -
Simulation settings .............................................................................................. - 58 -
Result 1: Simulation of Pulses caused by alteration of temperature .................... - 59 -
Result 2: Membrane potential perturbations ........................................................ - 60 -
Result 3: Contribution of 𝑪𝒂𝑽,𝑵𝒂𝑽,𝑲𝑽 channels in membrane potential variations .. -
63 -
Result 4: Threshold values .................................................................................. - 67 -
Result 5: Series of APs ....................................................................................... - 68 -
Chapter 6 ................................................................................................................ - 71 -
A mathematical model for ionic channels ................................................................ - 71 -
Theory and Facts ................................................................................................ - 71 -
New Model .......................................................................................................... - 72 -
Calculations ........................................................................................................ - 73 -
Conditions ........................................................................................................... - 77 -

IX
Model for TRPV1 and voltage gated sodium and potassium channels ................ - 77 -
Chapter 7 ................................................................................................................ - 81 -
Conclusions & Discussion ....................................................................................... - 81 -
Conclusions ........................................................................................................ - 81 -
Discussion .......................................................................................................... - 83 -
Further research ..................................................................................................... - 84 -
References ............................................................................................................. - 85 -
X
List of Figures
2.1 Schematic illustration of nerve magnetic stimulation ……………………………. 6
2.2 Cell membrane and pumps ………………………………………………………... 8
2.3 Consideration of membrane lipid as a capacitor …………………………………. 10
2.4 Consideration of ionic channel as a resistor ……………………………………… 11
2.5 Voltage Clamp technique …………………………………………………………… 12
2.6 HH circuit model ……………………………………………………………………. 12
2.7 Stages of action potential …………………………………………………………. 13
2.8 Time curse of potassium conductance ………………………………………….. 16
2.9 Adjusting the power of potassium gating number ……………………………… 17
2.10 Rate constants of potassium conductance as a function of voltage….………. 17
2.11 Time curse of sodium conductance ……………………………………………... 18
2.12 Time evolution of membrane potential during the action potential …………... 20
2.13 TMS technique …………………………………………………………………….. 25
2.14 Magnetic stimulation of a culture in the form of a ring …………………………. 26
2.15 Compartments of HH model in NEURON ……………………………………….. 30
2.16 Modeling in Neuron by graphical interface ……………………………………… 34
2.17 Chain of components connected each other in NEURON ……………………… 37
2.18 Construction of a complex network of nerves in NEURON ……………………. 37
2.19 Connection of independent segments of soma and dendrites ………………….. 38
3.1 Initial settings for our simulations with ICLAMP technique …………………….. 42
3.2 Reaction of soma to the injection of current at various temperatures …………. 43
3.3 Voltage difference, rate and duration of spikes at different temperatures …….. 44
3.4 Changes of the spike durations (spike width) with temperature .……………….. 44
3.5 fraction of gating number of NaV and KV at different temperatures ……………. 45
3.6 maximum percentage of gating numbers …………………………………………. 46
3.7 Activation percentage versus membrane voltage ……………………………….. 47
3.8 Time constant for m,h and n gates versus time …………………………………. 48
3.9 Fraction of m,h and n gates due to change in voltage and temperature ………. 49
3.10 Fraction of activated gate numbers versus voltage an temperature(3-D) ……. 50
4.1 Initial settings for simulation of the TRPV1 channels ……………………………. 53

XI
4.2 Comparing the simulated function of TRPV1s with experimental records …….. 54
4.3 Simulation settings for measurement of effect of voltage changes on TRPV1 … 55
4.4 Effect of variation in the injected voltage to dynamics of TRPV1 channels ……. 56
4.5 Settings for simulation of opening probability of TRPV1s at different
voltages and temperatures ………………………………………………………… 57
4.6 Comparing opening probability-V of TRPV1 with experimental data …………… 57
5.1 ICLAMP settings for TRPV1 and voltage gated channels ……………………….. 59
5.2 Membrane voltage versus temperature with 0nA current injection ……………. 59
5.3 V-time graph for electric stimulation of voltage gated channels ……………..... 60
5.4 V-time graph for electric stimulation of voltage gated and TRPV1 channels …. 61
5.5 Details of V-time graph for the spikes at different temperatures ………………... 62
5.6 proportion of activated m∞ and nTRPV1∞ at different temperatures …………. 63
5.7 m∞, h∞, n∞ and nTRPV1∞ during curent injection at 36 and 40oC …………….. 64
5.8 m∞, h∞, n∞ and nTRPV1∞ during curent injection at 43 and 45oC ……………... 64
5.9 Percentage of considered gate-number∞ at different temperatures ………… 65
5.10 Time constant for m, h,n and nTRPV1 gates in different temperatures ………. 66
5.11 Fraction of voltage gated and TRPV1 gating numbers at 40oC ………………. 67
5.12 V-time graph for voltage gated channels with and without TRPV1s at 55oC …. 67
5.13 Ithreshold-temperature with and without TRPV1s ……………………………….. 68
5.14 Graphs of V-t at different temperatures and injected currents …………………. 69
5.15 firing rate of APs versus temperature …………………………………………….. 70
6.1 (Logarithm of) Opening probability- temperature for NaV, KV and TRPV1s ……… 80
6.2 (Logarithm of) Opening probability- voltage for NaV, KV and TRPV1s …………… 80

XII
List of Tables
2.1 Model parameters of neuron cell ……………………………………………........ 27
2.2 Default properties of nerve a section ……………………………………………. 31
2.3 Default properties of the pas channel …………………………………………… 32

- 1 -
Chapter 1
Introduction
Neurons are the basic element of the nervous system. Despite of the different responses
of the nervous system to various stimulations, similar fundamental mechanisms underlie
their response to the physical inputs. Ionic channels are pores in lipid bilayer, which allow
certain ions to pass in response to the changes in the neuron environment and generate
electrical neural impulses. Studying the gating mechanism of these channels helps to
understand the behavior of neurons in particular circumstances.
Several techniques are used in both research and clinical approaches to control the
nerve behavior by modulating the activity of ionic channels. In electric stimulation,
injection of a specific amount of current changes membrane potential. Since the voltage
gated ionic channels depend strongly on the membrane voltage, they start to show
reaction and generate APs. Therefore, electrical stimulation is capable to control the
signaling process of neurons. Another technique used for signal controlling is named
optogenetic, which involves the use of light to control the kinetics of ion flux through light-
sensitive ion channels. However, since visible light does not penetrate deep into tissues,
optical stimulation approach also requires implantation of an optical fiber. Therefore,
despite of several advantages, these techniques are invasive because of the
requirement of surgical implantations. In this thesis, we discuss an alternative non-
invasive technique of magnetic stimulation and the roles it plays for gating the ionic
channels.
In magneto thermo genetics technique, superparamagnetic ferrite nanoparticles are
targeted to the membrane plasma expressing Transient Receptor Potential type V
member 1 (TRPV1) channels. Application of magnetic field heats the nano-labeled
membrane and so temperature sensitive TRPV1 channels are activated. In this
technique, magnetic field is applied remotely to stimulate the nanomagnets attached to
the neuron membrane. The applied magnetic field interacts very weakly with biological
molecules but the depth of penetration is large. These properties results in noninvasive
magnetic therapy techniques that are used for treatment of various neurological
disorders. Contribution of several factors such as voltage, magnetic and particularly
thermal stimulation results in generation of an action potential. One way to understand

- 2 -
the involvement of each stimulation factor is computing their effect on the conductance
of ionic channels on a single nerve cell[1] .
Hodgkin and Huxley or HH mathematical model is one of the quantitative models that
describes the behavior of the membrane potential under various conditions [2]. In this
model, Voltage Clamp amplifier is used in space clamp configuration to study the current
carried mostly by sodium and potassium ions. Since temperature has strong effect on
the behavior of voltage gated channels, a temperature coefficient is used to quantify this
dependence.
HH model can only be solved numerically, and although several software packages
include the appropriate numerical methods to solve HH equations, Neuron software
provides a flexible numerical environment for modeling and study of neuroscience
including the possibility of using databases and software tools. The NMODEL language
can be used to add new components by specification of reaction and diffusion
systems[3]. This simulation environment is suitable for modeling individual neurons and
neuron networks. NEURON software has tools to simulate the behavior of voltage gated
channels at different membrane temperatures. In this work, this simulation environment,
and its associated numerical methods are used to create biophysically detailed neuronal
models and to assess the impact thermos-stimulation of magnetic nanoparticles.
Namely, the profile, rate and threshold value of action potentials generated on a soma
membrane are analyzed as a function of thermos/magnetic-stimulation parameters.
Studding the effect of temperature on dynamics of voltage gated channels provide a
general perspective for function of Transient Receptor Potential (TRP) channels that are
the main candidates responsible for generation of action potential caused by magnetic
nanoparticles thermo stimulation. The mechanism of its interaction with biological cells
is still unknown. Using NEURON software programming environment, we constructed a
computational model for simulating voltage sensitivity of TRPV1 channels . Thereafter,
several simulations are designed to evaluate the mechanism of TRPV1 channels during
electrical stimulation at different initial temperatures on a single soma that includes
voltage gated 𝐶𝑎𝑉 , 𝑁𝑎𝑉 𝑎𝑛𝑑 𝐾𝑉 channels on its membrane.
Furthermore, considering basic roles of thermodynamic, we present a mathematical
model that suggests a unifying framework for the function of voltage gated and
temperature sensitive channels. These expressions enable us to compare the
contribution of thermal and electrical stimulation factors on voltage gated and
temperature sensitive channels and find the mechanism of AP generated by temperature
changes in the environment of TRPV1s. Since physical base roles are utilized in this
- 3 -
model, and the channels are considered as (an) energy barrier(s), it is possible to
investigate this model for all types of ionic channels under all types of physical or even
chemical stimulations.
The work presented here have the following main contributions:
1. Using HH model in NEURON to simulate the kinetics of ion flux through voltage-gated
𝑁𝑎𝑉 , 𝑘𝑉 𝑎𝑛𝑑 𝐶𝑎𝑉 channels when a specific amount of current is injected in the membrane.
Then the results are analyzed in MATLAB.
2. Construction of the first computational model for behavior of TRPV1 channels under
electric stimulation and at different initial temperatures.
3. Comparing the behavior of a soma under electric stimulation in the case that only
voltage gated channels are inserted to the simulation and the case that TRPV1 channel
model is added to the simulation construction.
5. Introdusing a mathematical model by basic thermodynamic roles that not only
suggests a mathematical expression for temperature-caused gating of TRPV1 channels
but also it is capable to include the expressions for effect of other types of stimuli on
TRPV1 and other types of channels.
Overall, we studied the effect of temperature in two aspects: 1- numerical method that
the results of simulations and model constructions are presented in chapters 3 to 5 and
2- suggestion of a mathematical model with physical perspective that is explained in
chapter 6.
Chapter 2 reviews the general properties of neuron membrane and mathematical models
for generation of spikes focusing on certain aspects of ionic channels, HH
model,Goldman-Hodjkin-Kats (GHK)flux equation, TRP family and effect of electrical,
thermal and magnetic stimulation on ionic channels.
In chapter 3, the results of simulations about different effects of temperature on voltage
gated sodium, potassium and calcium channels is presented using NEURON software
and MATLAB.
Chapter 4 presents the numerical model we instructed for voltage sensitivity of TRPV1
channels at different initial temperatures. It concludes the methods we used to reach this
approach. At the end of this chapter, several simulations are designed to check if our
model matches well with the experimental records of Voets et al [4].
- 4 -
Chapter 5 presents the results of simulations about the condition that TRPV1 model is
inserted on a soma that includes voltage gated 𝑁𝑎𝑉 , 𝐾𝑉 and 𝐶𝑎𝑉 channels and is applied
electric stimulation. This chapter compare the effect of electric exposure on soma at
different initial temperatures.
Finally, in chapter6, several mathematical formulas are derived and a quantal model is
generated to describe the mechanism of temperature-caused AP by TRPV1 channels.
In addition, this model includes the effect of voltage on TRPV1 as well as voltage gated
channels.

- 5 -
Chapter 2
Literature Review
In this chapter, we explain the method for remote activation of the ionic channels.
Additionally, the action potential (AP), physiological concepts and several methods that
can be used to evaluate the effect of this procedure is analyzed. These methods include
expressions formechanism of voltage gated sodium and potassium channels, voltage
gated calcium channels, Transient Receptor potential (TRP) channels under electrical,
magnetic and thermal stimulation.
This chapter describes many of the publications relevant for this work.
Heating of ionic channels by magnetic stimulation of nanoparticles
In a new approach by Huang et al. a new method for magnetic stimulation of cells is
suggested. Since the interaction of magnetic field with tissue is very low, exposure of
this field alone cannot cause a noticeable effect on issue. However, targeting
nanoparticles on neural membrane converts the magnetic field to local thermal energy,
which is high enough to stimulate temperature-sensitive channels to generate neural
impulse. Because of small side effect of magnetic stimulation on tissue and its large
depth of penetration, it is a proper method to use in clinical procedures.
To produce an effective interaction, it is possible to label magnetic sensitive nano-
particles to cell membrane, so that the nanoparticles translate the magnetic field to
mechanical or thermal irritations. In an in vivo experiment presented by Huang et al. (Fig
2.1) superparamagnetic nanoparticles named Manganese ferrite(𝑀𝑛𝐹𝑒2𝑂4) with 6 nm
diameter were labeled to the cell membrane expressing TRPV1 channels and heated
using a RF magnetic field that resulted in increasing the temperature of the cells’
membrane. At about 42𝑜𝐶 APs are recorded by fluorophores in molecular-scale.

- 6 -
Fig 2.1 a)A schematic illustration to show the activation process of ionic channels by magnetic stimulation. The nanomagnets are labeled near the ionic channels and convert the magnetic field to local heat, which leads to increase the local temperature near the gates, and result is activation of the temperature sensitive ionic channels b) effect of magnetic stimulation on water is much smaller than the case it includes magnetic sensitive nanoparticles[1].
It is suggested that TRPV1 channels are the main responsible to generate AP in this
method. Moreover, cells with the absence of TRPV1 channels did not generate spikes
upon application of RF magnetic field. Therefore, it is concluded that activation of TRPV1
channels is triggered by heating of RF magnetic-field-induced nanoparticles.
In this experiment, hippocampal neurons that included uniform expression of TRPV1
channels were targeted by nanoparticles. Stimulation of the nanoparticles resulted in the
local heating of the channels and changes in the membrane potential that was measured
by ANNINE6 dye. When the membrane temperature reached about 40𝑜𝐶 an AP
happened. Huang et al. concluded that this method can be used for remote stimulation
of nerve cells in different future researches and clinical approaches.
In other experiment, during the magnetic stimulation of human embryonic kidney (HEK
293) cells the concentration of calcium ions inside the cell is recorded to increase as the
result of 𝐶𝑎2+ flux. So it is suggested that TRPV1 channels may be activated by passing
calcium ions through them.
To understand the contribution of electric, magnetic and thermal factors on excitation of
different types of ionic channels, we will study the effect of these factors on a single nerve
cell in the next chapters [1].
Membrane potential
Neurons are the signaling units of the body. Their capability for electrical excitation leads
the process and transfer of signals rapidly over large distances. Electrical activation of
the neurons is possible by action potential (AP), phenomenon in the cell membrane that
is defined as the extreme change of the membrane potential due to flow of ions inside,
and then, outside the cell through the ionic channels of the membrane.
The structure and function of nerve cells can be divided in four main parts:

- 7 -
1. Soma that is the body of the cell
2. Dendrites
3. Axon, long nerve fiber
Neural membrane consists a double layer of phospholipids impermeable to water and
intra-extra cellular ionic solutions which causes excess of positive charges on the outside
than the inside. Membrane rest potential is about -70 mV relative to the potential of the
outside of the cell (consider 𝑽𝒐𝒖𝒕 = 0) and the cell is in polarized condition.
Membrane also consists of a number of ionic channels made up of proteins that transfer
selective ion flow through the membrane. Change in potential or other parameters of the
membrane irritate the channels to open and close. Ion flow occurs to keep the balance
between the chemical driving force (concentration gradient) and electrical driving force
(potential difference) inside and outside the cell. There are several types of channels in
the membrane that each type is activated only by a specific ion flux. Usually the name of
the channel is determined by the ion that the channel is permeable to it, for example,
potassium channel only transfers 𝐾+ions in-out side of the cell.
Studies show that nerve cells are permeable to 𝑁𝑎+, 𝐾+ and 𝐶𝑙− ions when they are at
rest. The number of 𝐾+ resting channels is much more than the other channels. So, the
rest potential in the membrane is closer to the equilibrium potential of the 𝐾+ions. 𝐾+ions
tend to move out of the cell because of their high concentration inside. But, the
concentration of 𝑁𝑎+ ions is more than the outside, so they tend to flow inside the cell.
This phenomenon may also happen for other types of ionic channels. The membrane
has a steady rest potential, so the influx ions are balanced by the out-flux ions. Passive
movements of ions reduce the rest potential, so to have a constant rest potential, ion
leaks are prevented by 𝑁𝑎+- 𝐾+ pump channels that pump the ions against their
electrochemical gradients (flow two 𝐾+ions in and three 𝑁𝑎+ ions out of the cell). An ATP
is used to provide energy for each pump. Fig 2.2 illustrates the explained phenomenon.
- 8 -
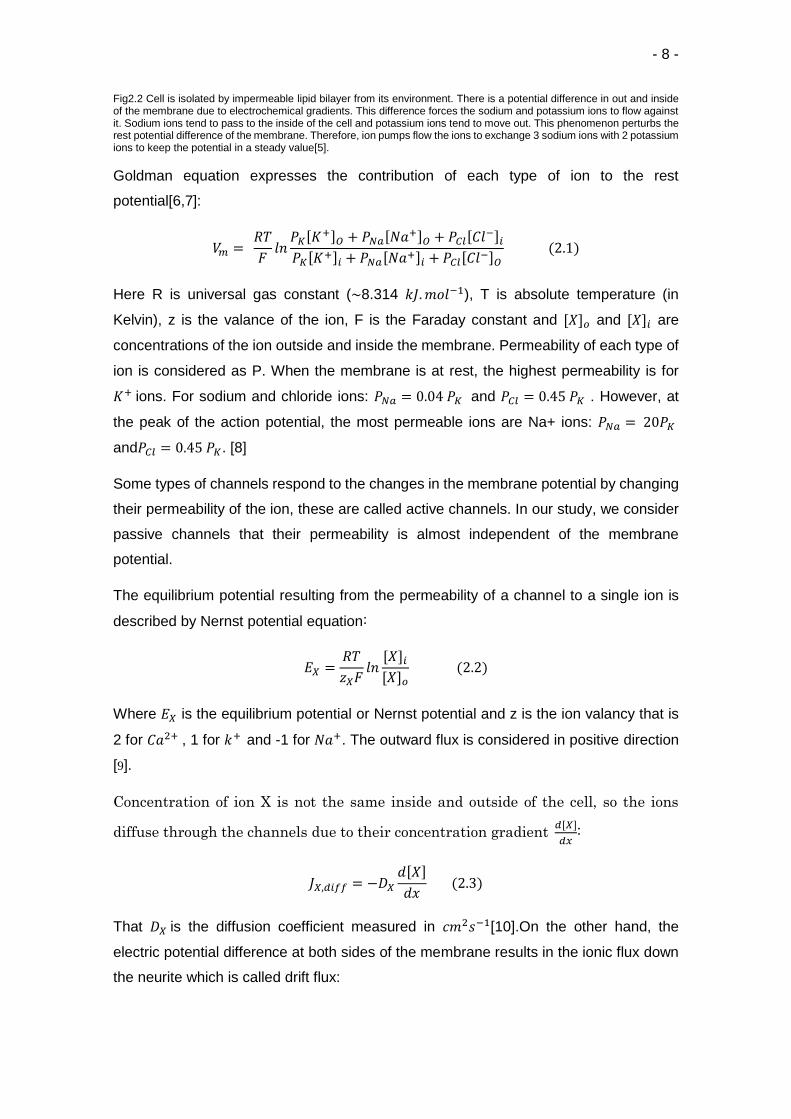
Fig2.2 Cell is isolated by impermeable lipid bilayer from its environment. There is a potential difference in out and inside of the membrane due to electrochemical gradients. This difference forces the sodium and potassium ions to flow against it. Sodium ions tend to pass to the inside of the cell and potassium ions tend to move out. This phenomenon perturbs the rest potential difference of the membrane. Therefore, ion pumps flow the ions to exchange 3 sodium ions with 2 potassium ions to keep the potential in a steady value[5].
Goldman equation expresses the contribution of each type of ion to the rest
potential[6,7]:
𝑉𝑚 = 𝑅𝑇
𝐹𝑙𝑛𝑃𝐾[𝐾
+]𝑂 + 𝑃𝑁𝑎[𝑁𝑎+]𝑂 + 𝑃𝐶𝑙[𝐶𝑙
−]𝑖𝑃𝐾[𝐾
+]𝑖 + 𝑃𝑁𝑎[𝑁𝑎+]𝑖 + 𝑃𝐶𝑙[𝐶𝑙
−]𝑂 (2.1)
Here R is universal gas constant (~8.314 𝑘𝐽.𝑚𝑜𝑙−1), T is absolute temperature (in
Kelvin), z is the valance of the ion, F is the Faraday constant and [𝑋]𝑜 and [𝑋]𝑖 are
concentrations of the ion outside and inside the membrane. Permeability of each type of
ion is considered as P. When the membrane is at rest, the highest permeability is for
𝐾+ ions. For sodium and chloride ions: 𝑃𝑁𝑎 = 0.04 𝑃𝐾 and 𝑃𝐶𝑙 = 0.45 𝑃𝐾 . However, at
the peak of the action potential, the most permeable ions are Na+ ions: 𝑃𝑁𝑎 = 20𝑃𝐾
and𝑃𝐶𝑙 = 0.45 𝑃𝐾. [8]
Some types of channels respond to the changes in the membrane potential by changing
their permeability of the ion, these are called active channels. In our study, we consider
passive channels that their permeability is almost independent of the membrane
potential.
The equilibrium potential resulting from the permeability of a channel to a single ion is
described by Nernst potential equation:
𝐸𝑋 =𝑅𝑇
𝑧𝑋𝐹𝑙𝑛[𝑋]𝑖[𝑋]𝑜
(2.2)
Where 𝐸𝑋 is the equilibrium potential or Nernst potential and z is the ion valancy that is
2 for 𝐶𝑎2+ , 1 for 𝑘+ and -1 for 𝑁𝑎+. The outward flux is considered in positive direction
[9].
Concentration of ion X is not the same inside and outside of the cell, so the ions
diffuse through the channels due to their concentration gradient 𝑑[𝑋]
𝑑𝑥:
𝐽𝑋,𝑑𝑖𝑓𝑓 = −𝐷𝑋𝑑[𝑋]
𝑑𝑥 (2.3)
That 𝐷𝑋 is the diffusion coefficient measured in 𝑐𝑚2𝑠−1[10].On the other hand, the
electric potential difference at both sides of the membrane results in the ionic flux down
the neurite which is called drift flux:

- 9 -
𝐽𝑋,𝑑𝑟𝑖𝑓𝑡 = −𝐷𝑋𝐹
𝑅𝑇𝑧𝑋[𝑋]
𝑑𝑉
𝑑𝑥 (2.4)
Taking into account both diffusion flux and drift flux we can express the total
electrodiffusion flux of ion X:
𝐽𝑋 = 𝐽𝑋,𝑑𝑖𝑓𝑓 + 𝐽𝑋,𝑑𝑟𝑖𝑓𝑡 (2.5)
This expression is named Nernst-Planck equation [9,11]. We will use this expression to
explain the mathematics for function of TRPV1 channels.
Electrical circuits help explain neural functions
It is useful to consider the neurons as electrical circuit units. In this frame, conductors
and resistors represent the ion channels, batteries represent the pumping of the charges,
and Capacitors displays the ability of the membrane to store the charge.
Consider the neural membrane. Since, double lipid layer of the membrane is
impermeable, the charges inside and outside of the membrane cannot move according
to their electrical and chemical gradients. So the inside surface of the membrane is
negatively charged and the outside surface of it is positively charged. This condition is
similar to the capacitance with parallel plates. One of the plates is negatively charged
and the other (outside surface) is positively charged. As we know, the separation of the
positive and negative charges on both sides of the capacitor creates an electric field, and
thus a potential difference between the plates is proportional to the charge excess
between two plates:
𝑉 =𝑞
𝐶 (2.6)
Here q is the charge excess between the surfaces and C is the capacitance measured
in farads. The capacity of the parallel surfaces is proportional to the area of the plates ‘a’
and the distance between them ‘d’:
𝐶 =𝑎
휀𝑑 (2.7)
Where 휀 is the permittivity of the insulator.
By differentiating the V=q/C formula it is found that current is proportional to the changes
in the membrane potential and capacitance:
𝑑𝑉
𝑑𝑡= 𝐼
𝐶= 1
𝐶
𝑑𝑞
𝑑𝑡 (2.8)

- 10 -
The electromotive force that causes the ions to gather in both side of the membrane is
shown by a Battery in the equivalent circuit.
Figure 2.3 the collection of charges on both sides of dielectric membrane creates an electric field in the membrane that can be considered to function as a capacitor[8].
If potential of the inside of the cell is 𝑉𝑖𝑛 and for outside is 𝑉𝑜𝑢𝑡 then the membrane
potential is determined as:
𝑉𝑚 = 𝑉𝑖𝑛 − 𝑉𝑜𝑢𝑡 (2.9)
The membrane potential is positive when the inside of the membrane is more positively
charged than the outside. [5]
Ions flow in or out of the cell through the ion channels. Each channel can be considered
as a resistor or conductor with a conductance of 𝛾 (1/Ω). If there was no electrochemical
forces, the flow through the channel would be 𝑖 = 𝛾 × 𝑉𝑚 . However, due to the effect
of the electromotive force the ionic flow is determined by:
𝑖 = ( 𝛾 × 𝑉𝑚) − (𝛾 × E) (2.10)
= 𝛾 × ( 𝑉𝑚 − 𝐸)
Here ( 𝑉𝑚 − 𝐸) is called electrochemical driving force.
For N number of a specific type of channel, the overall conductance is:
𝑔 = 𝑁 × 𝛾 (2.11)
In the equivalent circuit, each population of channels can be represented by a battery in
series with a conductor (Fig 2.4)
Fig 2.4 Each type of ionic channel is considered as a resistor and the electromotive force through the channels is illustrated as a battery that pushes the sodium ions inside the cell and the potassium and Chloride ions out of the cell[8].

- 11 -
As the ions flow through the selective ionic channels due to the electrochemical force,
the pumps flow the ions back to keep the membrane potential at the steady state (for
example Na+-K+ channels pump out three Na+ for every two K+ ions pumping inside the
cell using an ATP molecule). This process can be represented as a current generator in
the equivalent circuit.
The total membrane current is the sum of the capacitive current and the current passing
through the channels[8].
Hodgkin and Huxley model for equivalent circuit of 𝑁𝑎𝑉 , 𝐾𝑉 , 𝐶𝑙𝑉
channels
The Hodgkin and Huxley (HH) model explains the effect of movement of ions through
ionic pores on the membrane potential and generation of AP in voltage-gated channels.
The current generated by the voltage-gated channels varies in time and voltage.
Therefore, to model these channels, several methods were used to control the
parameters. In 1940 Hodgkin and Huxley successfully used VClamp technique on squid
giant axon to produce some experimental data for constructing their model [12-16].
Voltage clamp (VClamp) technique holds the voltage to a specific value to control the
membrane potential and study the effects of stimuli on it. First, an electrode is injected
to the membrane. It measures the membrane potential by an amplifier, then, to provide
voltage difference between the measured and considered voltage, a proper current is
generated by an amplifier and is injected to the membrane (Fig 2.5)
Fig 2.5 Voltage clamp technique used to keep the membrane potential unchanged. First the voltage difference(V) is measured for both sides of the membrane, then a current electrode injects current to provide the voltage difference(V) that was necessary to keep the membrane potential to a constant value [5].
To be sure that membrane potential is uniform in a large volume of the membrane,
Hodgkin and Huxley used space clamp technique where the electrodes are long and thin
- 12 -
wires, so, the resistance of the cytoplasm and extracellular space can be assumed to be
zero[17,18].
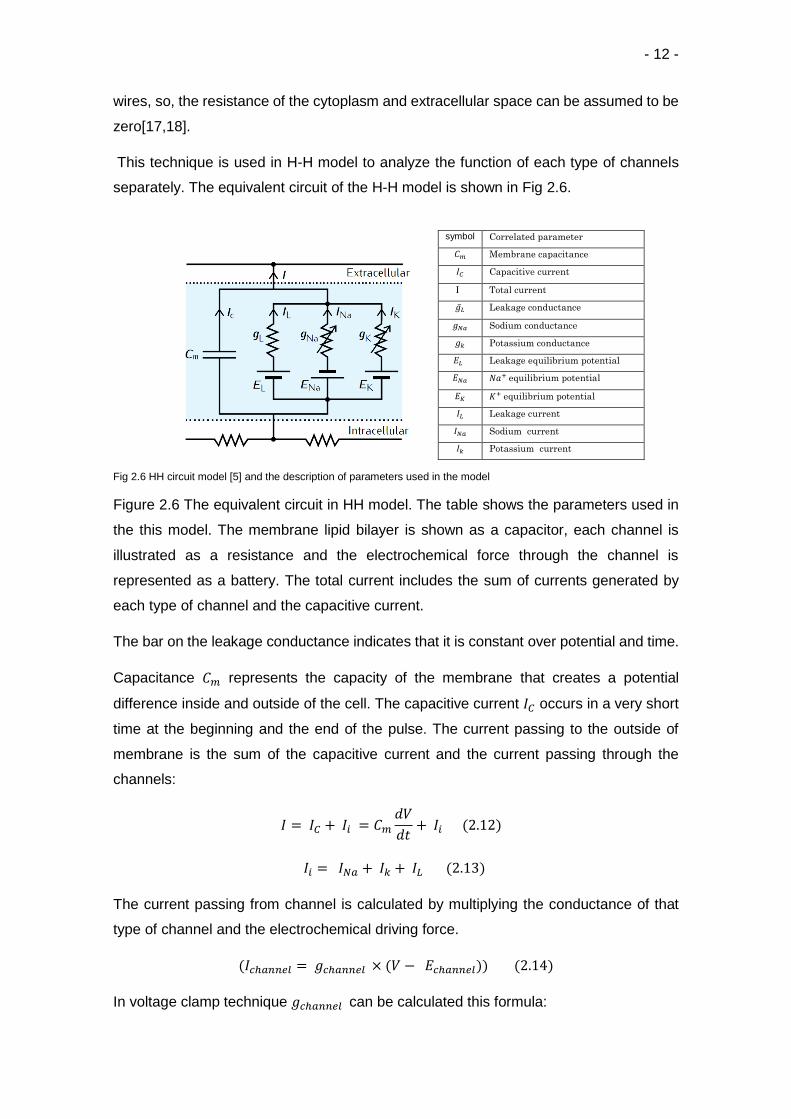
This technique is used in H-H model to analyze the function of each type of channels
separately. The equivalent circuit of the H-H model is shown in Fig 2.6.
Fig 2.6 HH circuit model [5] and the description of parameters used in the model
Figure 2.6 The equivalent circuit in HH model. The table shows the parameters used in
the this model. The membrane lipid bilayer is shown as a capacitor, each channel is
illustrated as a resistance and the electrochemical force through the channel is
represented as a battery. The total current includes the sum of currents generated by
each type of channel and the capacitive current.
The bar on the leakage conductance indicates that it is constant over potential and time.
Capacitance 𝐶𝑚 represents the capacity of the membrane that creates a potential
difference inside and outside of the cell. The capacitive current 𝐼𝐶 occurs in a very short
time at the beginning and the end of the pulse. The current passing to the outside of
membrane is the sum of the capacitive current and the current passing through the
channels:
𝐼 = 𝐼𝐶 + 𝐼𝑖 = 𝐶𝑚𝑑𝑉
𝑑𝑡+ 𝐼𝑖 (2.12)
𝐼𝑖 = 𝐼𝑁𝑎 + 𝐼𝑘 + 𝐼𝐿 (2.13)
The current passing from channel is calculated by multiplying the conductance of that
type of channel and the electrochemical driving force.
(𝐼𝑐ℎ𝑎𝑛𝑛𝑒𝑙 = 𝑔𝑐ℎ𝑎𝑛𝑛𝑒𝑙 × (𝑉 − 𝐸𝑐ℎ𝑎𝑛𝑛𝑒𝑙)) (2.14)
In voltage clamp technique 𝑔𝑐ℎ𝑎𝑛𝑛𝑒𝑙 can be calculated this formula:
symbol Correlated parameter
𝐶𝑚 Membrane capacitance
𝐼𝐶 Capacitive current
I Total current
𝐿 Leakage conductance
𝑔𝑁𝑎 Sodium conductance
𝑔𝑘 Potassium conductance
𝐸𝐿 Leakage equilibrium potential
𝐸𝑁𝑎 𝑁𝑎+ equilibrium potential
𝐸𝐾 𝐾+ equilibrium potential
𝐼𝐿 Leakage current
𝐼𝑁𝑎 Sodium current
𝐼𝑘 Potassium current

- 13 -
𝑔𝑐ℎ𝑎𝑛𝑛𝑒𝑙 = 𝐼𝑐ℎ𝑎𝑛𝑛𝑒𝑙
𝑉 − 𝐸𝑐ℎ𝑎𝑛𝑛𝑒𝑙 (2.15)
Action Potential
Action potential (AP) is an impulse phenomenon in which the membrane potential
increases sharply to a positive value and then decreases to the rest value in a short
period of time (Fig 2.7). The process and details of action potential was studied first by
Hodgkin and Huxley. Their experiments show that the action potential can be described
by the variation in the conductance of Na+ and k+ channels. Other type of channels has
small contribution in action potential. They measured the rate, shape and other
properties of the gated channels.
Fig 2.7 Action potential and the different stages that membrane passes to return to the rest value. The kinetics of sodium and potassium ions are illustrated at each state[8].
The first step to reach this model was discovering the increase in ion flow during the
action potential.
For measuring the parameters contributed in action potential, ‘Voltage Clamp’
technique is used. This technique enables the experimenter to set the voltage of the
membrane to the considered value. Hodgkin and Huxley used the ion substitution
method to separate the inward and outward current. They prevented the inward
current by decreasing the extracellular sodium concentration. The K+ current was
obtained by reducing 𝐼𝑁𝑎 ,𝐼𝐿 and 𝐼𝐶 from the total current. Fig 6 illustrates the
function of related channels in detail.
According to HH model for AP:
1- Increasing the membrane potential is called depolarization and decreasing
the potential is named repolarization.

- 14 -
2- The depolarization of membrane leads the opening of Na+ channels that
results further membrane depolarization. So more 𝑁𝑎𝑉 channels are opened
that causes increasing the inward current. After a very short period time, KV
channels are opened and K+ current begin flowing outward. The outflow of
potassium ions prevents the voltage inside the cell to increase, so the
membrane potential reaches to a peak value. This process continues to
decrease the potential of cell to the rest value.
3- When the membrane potential reaches the rest value, some of the potassium
channels are still open and flow the positive ions outside the cell. This process
leads decreasing the membrane potential to a value a little smaller than the
rest value (hyperpolarization) After a short time all the stimulated 𝐾𝑉
channels close and the membrane potential increases to the rest value.
HH model suggests all –or- none behavior for the action signals. It means that for a
voltage more than threshold value, the amount of signal does not affect the amplitude of
the action potential.
In the HH model, the first order chemical reaction model is used to express the ‘open’ or
‘close’ state of the individual gates.
(2.16)
that 𝛼 𝑛 is the number of times per second that a close-gate opens and 𝛽𝑛 is the number
of times per second that a gate closes. These two factors are called ‘rate constants’ and
depend on the membrane potential.
In HH model, the probability of an individual gate to be in open state is 𝑃𝑛 ranging
between 0 and 1. For a large number of a specific type of channel, 𝑃𝑛 and (1 − 𝑃𝑛) can
be expressed as the fraction of gates in the open state and close state respectively. The
rate of transition between open and close state is:
𝑑𝑃𝑖
𝑑𝑡= 𝛼𝑖(𝑉)(1 − 𝑃𝑖) − 𝛽𝑖(𝑉)𝑃𝑖 (2.17)
If the membrane potential is clamped to a fixed value, the fraction of gates in open state
reaches a steady-state value (𝑑𝑃𝑖 𝑑𝑡⁄ = 0 𝑎𝑠 𝑡 → ∞)
𝑃𝑖,∞(𝑉) = 𝛼𝑖(𝑉)
𝛼𝑖(𝑉) + 𝛽𝑖(𝑉) (2.18)
And the time needed to reach the steady state is called time constant 𝜏𝑖(𝑉) given by:
𝜏𝑖(𝑉) = 1
𝛼𝑖(𝑉) + 𝛽𝑖(𝑉) (2.19)
The general form of the answer for equation 2.17 is:

- 15 -
𝑃(𝑡) = 𝑃∞(𝑉) − [𝑃∞(𝑉) − 𝑃0] exp (−𝑡
𝜏𝑖(𝑉)) (2.20)
Or
𝜏𝑖(𝑉)𝑑𝑃𝑖𝑑𝑡= 𝑃𝑖,∞(𝑉) − 𝑃(𝑡) (2.21)
Here 𝑃0 is the initial value of P at the beginning of the step. Equation (2.20) describes
that 𝑃(𝑡) reaches to the steady value at time 𝜏𝑖(𝑉) .
The value of 𝑃𝑖,∞(𝑉),𝜏𝑖(𝑉), 𝛼𝑖(𝑉) and 𝛽𝑖(𝑉) is determined(as a function of voltage) from
experiment. However, to give a physical description for 𝛼𝑖(𝑉) and 𝛽𝑖(𝑉), the
thermodynamic arguments are useful. The rate of function of 𝛼𝑖(𝑉) and 𝛽𝑖(𝑉) is
controlled by barriers requiring thermal energy. The function of rate constants is effective
when an effective charge (denoted by q𝐵𝛼) passes the membrane (with potential V), so
the thermal energy barriers depend on the membrane potential [19].
In the AP process, Boltzmann factor is used to express the probability that the thermal
energy transitions provide enough energy to come over the energy barrier:
exp (−𝑞𝐵𝛼 𝐾𝑇⁄ ) . The expression for 𝛼𝑖(𝑉) can be determined based on this factor:
𝛼𝑖(𝑉) = 𝐴𝛼 exp(−𝑞𝐵𝛼 𝐾𝑇⁄ ) = 𝐴𝛼 exp(−𝐵𝛼𝑉 𝑉𝑇⁄ ) (2.22)
In this equation 𝐴𝛼 and 𝐵𝛼 are determined from experimental data. The closing rate 𝛽𝑖(𝑉)
is expressed similarly with different constants.
If we consider 𝑖 as the maximum possible conductance in the condition that all the
channels are open for a specific type of ion, the total conductance for that type of channel
will be [19]:
𝑔𝑖 = 𝑖∏𝑃𝑖𝑖
(2.23)
Potassium current
To determine the KV channel conductance, from the Hodgkin and Huxley experiment,
the time course of the potassium conductance shows that the steady-state potassium
conductance (𝑔𝑘∞)increases with increasing the voltage. The graph also shows that 𝑔𝑘∞
reaches a maximum value (denoted𝐾). At higher voltages, the speed at which the
conductance reaches the maximum value becomes faster (Fig 2.8).

- 16 -
Fig 2.8 Potassium conductance changing with time in VCLAMP technique. Conductance of potassium increases faster in higher membrane voltages to its maximum value[5,16].
To describe this process, Hodgkin and Huxley represent that the expected fraction of 𝐾𝑉
channels in open state(∏ 𝑃𝑖)𝑖 is 𝑛𝑥, so from equation(2.23) the potassium conductance
is:
𝑔𝐾 = 𝐾 𝑛𝑥 (2.24)
Hodgkin and Huxley fit the calculated date with the experimental data by assuming x=4.
Therefore, the conductance of 𝐾𝑉 channels is (Fig 2.9):
𝑔𝐾 = 𝐾𝑛4 (2.25)
Fig 2.9 The time evolution of potassium conductance with different values for power of n. The data fit well with 𝑛4.[5,16]
According to Equation (2.17) the time evolution of a first order kinetic process is:
𝑑𝑛
𝑑𝑡= 𝛼𝑛(1 − 𝑛) − 𝛽𝑛𝑛 (2.26)
According to Equation (2.20) the general form for n(t) is:
𝑛(𝑡) = 𝑛∞(𝑉) − [𝑛∞(𝑉) − 𝑛0] exp (−𝑡
𝜏𝑛(𝑉)) (2.27)
Where 𝑛0 is the value of n at the beginning of the step.
From Equation (2.18) and (2.19) the values for 𝑛∞(𝑉) and 𝜏𝑛(𝑉) can be calculated:
𝑛∞(𝑉) = 𝛼𝑛(𝑉)
𝛼𝑛(𝑉) + 𝛽𝑛(𝑉) (2.28)

- 17 -
𝜏𝑛(𝑉) = 1
𝛼𝑛(𝑉) + 𝛽𝑛(𝑉) (2.29)
To simplify Equation (2.26) we consider that the increment of the open-gates(𝛼𝑛) is linear
with voltage(Fig 2.9).
Fig 2.10 Rate constants of potassium conductance as a function of voltage can be considered linear[5,16].
Therefore the amount of changes from n to dn during dt is the same as the changes from
n to 𝑛∞ during time 𝜏𝑛:
𝑑𝑛
𝑑𝑡=𝑛∞ − 𝑛
𝜏𝑛 (2.30)
And:
𝛼𝑛 =𝑛∞𝜏𝑛 (2.31)
𝛽𝑛 = 1 − 𝑛∞𝜏𝑛
(2.32)
Using Equation (2.25) we can find the value for 𝑛∞:
𝑛∞(𝑉) = (𝑔𝐾∞(𝑉)
𝐾)
14 (2.33)
Finally, the summary of the calculations for the potassium ionic current through the
membrane is:
𝐼𝑘 = 𝐾𝑛4(𝑉 − 𝐸𝐾) (2.34)
𝑑𝑛
𝑑𝑡= 𝛼𝑛(1 − 𝑛) − 𝛽𝑛𝑛 (2.35)
𝛼𝑛 = 0.01𝑉 + 55
1 − exp (− (𝑉 + 55) 10)⁄ (2.36)

- 18 -
𝛽𝑛 = 0.125exp (− (𝑉 + 65) 80)⁄ (2.37)
Sodium current
Hodgkin and Huxley isolated the sodium current using the substitution method and
measured the conductance of 𝑁𝑎+ current in voltage clamp condition.
As we see in the Fig (2.11) 𝑁𝑎+current increases and reaches a peak value, then,
decreases to the rest condition (inactivation). In potassium channels, the conductance
reaches a maximum value and remains constant. However, for the sodium channels, the
gates spend very short period at the maximum conductance state. To explain the
difference in the conductance of sodium channels with potassium gates, Hodgkin and
Huxley suggested activation and inactivation gate for sodium channels.
Fig 2.11 The conductance of sodium channel over time. The conductance reaches a peak value and then decreases by time. Two gates (activation and inactivation gates) are considered to explain these channels conductance [5,8,16].
The variable ‘h’ represents the level of inactivation and ‘m’ for activation level.
The rate of transition between two open-close states for ‘h’ gating particle is:
𝑑ℎ
𝑑𝑡= 𝛼ℎ(1 − ℎ) − 𝛽ℎℎ (2.38)
And for ‘m’ gating particle is:
𝑑𝑚
𝑑𝑡= 𝛼𝑚(1 −𝑚) − 𝛽𝑚𝑚 (2.39)
Using the above formulas, the inflected activation curve for sodium conductance is
explained by:
𝑔𝑁𝑎 = 𝑁𝑎𝑚3ℎ (2.40)
That fit well with the experimental recordings. So the model of sodium current is:
𝐼𝑁𝑎 = 𝑁𝑎𝑚3ℎ(𝑉 − 𝐸𝑁𝑎) (2.41)

- 19 -
With the same method for potassium channels, Hodgkin and Huxley find the model for
sodium conductance:
𝛼𝑚 = 0.1𝑉 + 40
1 − exp (− (𝑉 + 40) 10)⁄ (2.42)
𝛽𝑚 = 4exp (− (𝑉 + 65) 18)⁄ (2.43)
𝛼ℎ = 0.07exp (− (𝑉 + 65) 20)⁄ (2.44)
𝛽ℎ =1
1 + exp (− (𝑉 + 35) 10)⁄ (2.45)
These expressions for rate constants of sodium channels are used to find the number of
activated and inactivated sodium channels in HH model.
Leak current
When there is no sodium current and potassium flux is the major current, the diving force
of K+ ions is zero (V-𝐸𝐾 = 0) and no potassium current flows. At this level of potential,
Hodgkin and Huxley found some non-sodium current. They suggested that this current
is the mixture of ions (mostly chloride ions) that does not depend on voltage and named
it leakage current ‘𝐼𝐿′. Using aquasi-ohmic current–voltage relationship they derived[15]:
𝐼𝐿 = 𝐿 × (𝑉 − 𝐸𝐿) (2.46)
Summary of HH model:
HH current model is the sum of the contributed ionic current models[12-16]:
𝐶𝑚𝑑𝑉
𝑑𝑡= − 𝐿(𝑉 − 𝐸𝐿) − 𝑁𝑎𝑚
3ℎ(𝑉 − 𝐸𝑁𝑎) − 𝐾𝑛4(𝑉 − 𝐸𝐾) + 𝐼 (2.47)
That I is the circuit current. Fig 2.12 shows the contribution of sodium and potassium
conductance in action potential.

- 20 -
Fig 2.12 time evolution of membrane potential during the action potential phenomenon. The second graph compares the conductance of Na+ and k+ channels over the action potential period and the last graph illustrates the related gating variables[12-16].
From Fig 2.12 it is clear that the conductance of sodium channels starts increasing earlier
than that for potassium channels, so we can conclude that sodium current is the beginner
of action potential. The outflow of potassium channels and inactivation of sodium
channels lead the voltage stop increasing and go back to the rest value. However, since
a proportion of potassium channels are still activated, the membrane voltage continues
to decrease under the rest potential value.
A number of numerical methods attempt to solve the HH model, such as: forward Euler,
modified Euler, backward Euler, Runge-Kutta, Adams-Bashforth-Moulton predictor-
corrector, and Matlab’s ODE45 function[19].
Effect of temperature
Temperature highly affects the constant rates. To involve its effect a temperature
coefficient is used. Temperature coefficient 𝑄10 is a measurement of increasing in the
rate coefficient due to 10𝑜𝐶 temperature alteration:
𝑄10 = 𝑟𝑎𝑡𝑒 𝑎𝑡 𝑇 + 10𝑜𝐶
𝑟𝑎𝑡𝑒 𝑎𝑡 𝑇 (2.48)
We can find the rate constants by using this factor:
𝛼(𝑉, 𝑇2) = 𝛼(𝑉, 𝑇1)𝑄10
𝑇2−𝑇110 (2.49)
And
𝛽(𝑉, 𝑇2) = 𝛽(𝑉, 𝑇1)𝑄10
𝑇2−𝑇110 (2.50)

- 21 -
And for maximum conductance:
𝑋(𝑇2) = 𝑋(𝑇1)𝑄10
𝑇2−𝑇110 (2.51)
This expression can be explained also by Arrhenius equation. This equation is a formula
for temperature dependent reaction rates in equilibrium condition. According to this
equation for a mole of particles, the rate constant k is:
𝑘 = 𝐴𝑒−𝐸𝑎𝐾𝑇 (2.52)
That 𝐸𝑎 is the activation energy, R is the Boltzmann constant and T is the absolute
temperature.
The rate coefficient at temperature 𝑇1 and 𝑇2 is 𝑘(𝑇1) and 𝑘(𝑇2):
𝑙𝑜𝑔 ( 𝑘(𝑇2)
𝑘(𝑇1)) =
𝐸𝑎𝑅(1
𝑇1−1
𝑇2) (2.53)
We consider 𝑇2 = 𝑇1 + 10. [12,20,21]
So:
𝑙𝑜𝑔(𝑄10) =𝐸𝑎𝑅(
10
𝑇1(𝑇1 + 10)) (2.54)
Voltage gated Calcium currents
Voltage-gated Calcium channels initiate and moderate many physiological events. 𝐶𝑎𝑉
channels are effective in mechanisms such as cardiac and smooth muscle
cells[22,23],Skeletal muscles[24,25] and in neurons, they initiate synaptic
transmission[24,26,27,28].
Concentration of calcium inside the cell is very low, so a model named GHK is used to
study the behavior of voltage-gated calcium channels. Goldman (1943) and Hodgkin and
Katz (1949) devised the theory of membrane current flow and derived GHK formula
based on this theory that describes the currents and voltages through permeable
membranes[6,29,30]. The net current 𝐼𝑋 (in 𝑐𝑚−2) of ion X through a unit area of
membrane is:
𝐼𝑋 = 𝑃𝑋𝑧𝑋𝐹𝑧𝑋𝐹𝑉
𝑅𝑇([𝑋]𝑖𝑛 − [𝑋]𝑜𝑢𝑡𝑒
−𝑧𝑋𝐹𝑉 𝑅𝑇⁄
1 − 𝑒−𝑧𝑋𝐹𝑉 𝑅𝑇⁄) (2.55)

- 22 -
That 𝑧𝑋 and 𝑃𝑋 in (𝑐𝑚𝑠−1) are the valency and permeability of ion X respectively:
𝑃𝑋 = −𝐽𝑋
[𝑋]𝑖𝑛 − [𝑋]𝑜𝑢𝑡 (2.56)
𝑃𝑋 is proportional to the diffusion coefficient (𝐷𝑋) described by Fick’s low. It is assumed
that the membrane includes a homogenous distribution of the activated calcium ion
channels. However, to consider the direct relationship of the number of opened channels
with the amount of ionic current, diffusion coefficient 𝐷𝑋 is interpreted as variable:
𝐽𝑋,𝑑𝑖𝑓𝑓 = −𝐷𝑋𝑑[𝑋]
𝑑𝑥 (2.57)
Here 𝐽𝑋,𝑑𝑖𝑓𝑓 is the molar flux of ion X that is diffused due to concentration gradient 𝑑[𝑋]
𝑑𝑥.
The current is not proportional to the voltage, so the I-V curve does not abbey the Ohm’s
law. In the GHK equation, it is assumed that ions flow independently. According to
Nernst–Plank equation, the gradient of ion internal concentration and electric field control
the movement of the ions through the membrane.
This expression can also be used to obtain more accurate I-V relationship for sodium
and potassium voltage gates[20] .
Transition State Theory
Transition State theory is based on Arrhenius (1889) concept and describes the energy
𝐸𝑎 required for an ion to pass through the voltage gated channels [31]. The reaction rate
𝑘𝜇 is given by
𝑘𝜇 ∝ 𝑒𝑥𝑝 (−𝐸𝑎𝑅𝑇) (2.58)
That R is the universal molar gas constant and T is temperature in Kelvin.
To find an expression for the reaction rate between the opening and closing states, Gibbs
free energy is introduced as the required energy to activate the channels:
𝑘𝜇 =𝑘𝐵𝑇
ℎexp (−
∆𝐺𝜇
𝑅𝑇) (2.59)
Where 𝑘𝐵 is the Boltzmann constant and h is the planck’s constant. The difference in the
Gibbs energy is described by:
∆𝐺𝜇 = ∆𝐻𝜇 − 𝑇∆𝑆𝜇 (2.60)

- 23 -
Here ∆𝐻𝜇 and ∆𝑆𝜇 are the differences in enthalpy and entropy between the two states
[31-33].
TRP channels
Our nerve system is capable of detecting the changes in the environment temperature.
Thermal detection occurs in the dorsal root and trigeminal ganglia through the primary
afferent sensory neurons [34,35].TRP superfamily is mainly responsible for temperature
sensation[36,37].Different types of temperature sensitive channels exist that each can
be activated in a specific temperature range. The basic principle for temperature sensing
of these channels belong to the Transient Receptor Potential (TRP) family [36-40]. There
are four types of heat sensitive channels. Increasing the temperature first excites TRPV4
channels which are activated for the temperature ranges higher than 25𝑜𝐶, when the
temperature reaches 31𝑜𝐶 TRPV3 channels produce signal[41-45],ranges higher
than 430𝐶 results in generation of action potentials by TRPV1 channels[46,47] and the
TRPV2 channels begin to produce signals for temperatures greater than 52𝑜𝐶 [48].
Indeed, TRPM8 and TRPA1 are cold sensitive TRP channels [49-51]. TRPs are also
sensitive to pain, touch, taste and other stimulations [52]. Although several studies
evaluated the mechanism of these channels [55-59], the fundamental knowledge of the
gating mechanism of TRP channels is still unsolved.
In this study, since TRPV1 channels are activated in the temperature range that magnetic
stimulations are applied, this channel type is studied in more details.
Effect of Magnetic field
Some physical explanations are developed to provide a new insight for utilizing the
magnetic stimulation technique. Magnetic stimulation of the tissue induces electric field
that causes AP or inhibition in the nerve cell. The connection between time varying
electric and magnetic fields can be described by Maxwell equations.
In Transcranial Stimulation of the brain, magnetic field penetrates through the skull with
ignorable interaction. Therefore, this technique is the most interesting method to
stimulate the nervous system[60,61].
Basic principles
Several Experiments have done to study TMS mechanism. In an experiment that
successfully described the mechanism of signaling, a time-varying electromagnetic field
is applied externally which results in excitation in nerve cells. In this method, a coil is

- 24 -
placed on the surface of the skin or over the tissue. Pulses with current I(t) passes
through the coil and magnetic field B is produced according to Biot-Savart law:
𝐵(𝑟, 𝑡) =𝜇04𝜋𝐼(𝑡)∮
𝑑𝑙(𝑟′) × (𝑟 − 𝑟′)
|𝑟 − 𝑟′|3
𝐶
(2.61)
Where 𝑙 is the length of the coil and 𝜇0 is the permeability of free space measured in
H/m. in practice, first, a large capacitor is charged a passing current to a high voltage,
then it discharges by a thyristor switch through the coil.
According to Faraday’s law, magnetic waves then induce an electric field E in the tissue:
∇ × 𝐸 = −𝜕𝐵
𝜕𝑡 (2.62)
Fig 2.13 shows the process of inducing magnetic field and the neural response[62] . This
magnetic field induction method is called TMS or Transcranial Magnetic Stimulation. The
induced magnetic field has a sinusoidal wave form that lasts about 300 𝜇𝑠 16.
The required threshold voltage for generation of AP is described by cable equation
[63,64].
The required energy to excite the nerve cells in tissue is proportional to the square of
magnetic field: 𝑊 ∝ 𝐵2, that B is the magnetic flux density
According to Faraday’s law, the magnetic field is proportional to the product of the electric
field and the pulse duration:𝐵2 ∝ 𝐸2𝑡2 [65,66].
Fig 2.13 TMS technique, magnetic field B induces electric field E by a coil placed over the patient’ head. Induced electric field then excites the Pyramidal nerves. The activation of nerves can be detected by some tools such as EEG, PET, fMRi, NIRS and Spect, with behavioral or surface EMG changes. [62]

- 25 -
In an experiment, Rotem and Moses located a closed loop over a disk of 1-D cell culture
and generated magnetic field induced an electric field in the culture. They present a
mathematical expression for generation of AP due to MF induction[67].We consider a
coil of radios R placed in x-y plane at z=0. We can calculate the induced electric field E
along the closed loop L. According to Faraday’s law, the changes of magnetic flux (ϕ(t))
with time through the surface s enclosed by L is equal to the induced electric field along
the loop with radios r:
∫
E (t). d𝑙
L
= ∂
∂tϕ(t) =
∂
∂t∫
B (t). d𝑠
s
(2.63)
Magnetic field near and inside the coil is almost uniform and perpendicular to the coil
plane:
∫
B (t). d𝑠 = 𝐵(𝑡)∫ ds
s
= 𝐵(𝑡) × 𝜋𝑟2
s
(2.64)
Therefore, magnetic flux through L is
ϕ(t) =𝐵(𝑡) × 𝜋𝑟2 (2.65)
and
∂
∂tϕ(t) = 𝜋𝑟2 ×
∂
∂t𝐵(𝑡) (2.66)
In this experiment, all boundaries of the vessel and neurites are concentric with the coil,
thus, the amount of the electric field in any radius is uniform.
∫
E (t). d𝑙
L
= 2πr ×E(t) (2.67)
So, the equation is simplified to
E(t) = 𝑟
2
∂
∂t𝐵(𝑡) (2.68)

- 26 -
Fig 2.14 Magnetic stimulation of a culture in the form of a ring . A 1-d neuronal ring culture is placed 5 mm under the circumference of a coil. We use Faraday’s law to calculate the electric field induced at rings concentric and parallel to the plane of the coil[67].
We consider that the neurite lie along the x direction and its passive length and passive
time constants are 𝜆 and 𝜏
𝜆2𝜕2𝜑𝑚𝜕𝑥2
− 𝜏𝜕𝜑𝑚𝜕𝑡
− 𝜑𝑚 = 𝜆2𝜕𝐸𝑥𝜕𝑥 (2.69)
That 𝜑𝑚 is the deviation of the membrane potential from the resting value. To solve the
passive cable equation, it is necessary to use Green’s function:
𝐺(𝑥, 𝑦; 𝑡) =𝑒−𝑡𝜏
𝐿+2
𝐿∑(𝑐𝑜𝑠
𝑛𝜋𝑥
𝐿
⋈
𝑛=1
𝑐𝑜𝑠𝑛𝜋𝑦
𝐿𝑒−𝛼𝑛
1𝜏) 𝑡 ≥ 0 (2.70)
And
𝛼𝑛 = 1 + (𝑛𝜋𝜆
𝐿)2 (2.71)
The magnetic sinusoidal pulse induce an electric field parallel to the x direction,
consisting a sinusoidal cycle with a constant time cycle of 240 𝜇𝑠 that depends on the
amplitude of the magnetic field
𝐸𝑥(𝑥, 𝑡) = (𝐸0 . 𝑥) cos𝜔𝑡 𝜔 = 2𝜋
240𝜇𝑠≈ 25 𝐾𝐻𝑧 (2.72)
Here 𝐸0 is the maximum amplitude of the electric field. It depends on the strength of the
magnetic pulse and the geometry of the experiment. In Table 2.1 the geometrical and
electrophysiological parameters of neurons are given.
PARAMETERS DENDRITE AXON
DIAMETER 5 𝜇𝑚 1 𝜇𝑚
LENGTH CONSTANT 𝝀 865 𝜇𝑚 384 𝜇𝑚
PHYSICAL LENGTH L ≤ 200𝜇𝑚 ≥ 1000𝜇𝑚
TIME CONSTANT 𝝉 ≈ 5 𝑚𝑠 ≈ 300 𝑚𝑠
𝐄𝐓 ≥ 458 𝑉/𝑚 ≈ 280 𝑉/𝑚
Table 2.1 the model parameters of axons and dendrites [64,68-71] The data is collected by Rotem et al.[67]
𝐸𝑥(𝑥, 𝑡) = 𝐸0 cos𝜔𝑡 𝜔𝑡 ∈ [0,2𝜋] (2.73)
To determine the boundary condition we assume that 𝜑𝑇 is the voltage threshold of the
membrane and induces a threshold electric field𝐸𝑇.

- 27 -
Boundary conditions:
Uniform external field induces currents in the membrane at the two ends (0, L) of the
neurite.
𝐹(𝑥, 𝑡) = 𝜆2𝜕
𝜕𝑥(𝐸0 . 𝑥) cos𝜔𝑡 = 𝜆
2 𝐸0[𝛿(𝑥) − 𝛿(𝑥 − 𝐿)] cos𝜔𝑡 (2.74)
Combination of this formula with Green function yields[72]:
𝜑𝑚(𝑥, 𝑡) = ∫ 𝐺(𝑥, 𝑦; 𝑡)𝐿
0
𝜑𝑚(𝑦, 0)𝑑𝑦 + ∫ ∫ 𝐺(𝑥, 𝑦; 𝑡 − 𝑠)𝐿
0
𝐹(𝑦, 𝑠)𝑑𝑠𝑑𝑦𝐿
0
(2.75)
To solve the integral, it is important to note that the ends of the neurite is considered to
be fixed:
𝜕𝜑𝑚(0, 𝑡)
𝜕𝑥=𝜕𝜑𝑚(𝐿, 𝑡)
𝜕𝑥= 0 (2.76)
Membrane resting potential is assumed to be zero before the excitation:
𝜑𝑚(𝑥, 0) = 0 (2.77)
Therefore
∫ 𝐺(𝑥, 𝑦; 𝑡)𝐿
0
𝜑𝑚(𝑦, 0)𝑑𝑦 = 0 (2.78)
SO
𝜑𝑚(𝑥, 𝑡) = 0 + 𝜆2𝐸0∫ ∫ [
𝑒−𝑡𝜏
𝐿+2
𝐿∑(𝑐𝑜𝑠
𝑛𝜋𝑥
𝐿
⋈
𝑛=1
𝑐𝑜𝑠𝑛𝜋𝑦
𝐿𝑒−𝛼𝑛
𝑡−𝑠𝜏 𝑐𝑜𝑠𝜔𝑠]
𝑡
0
𝐿
0
[𝛿(𝑦)
− 𝛿(𝑦 − 𝐿)]𝑑𝑠𝑑𝑦 (2.79)
The existence of two delta functions gives two discrete values for y (y=0 and y=L) .Thus
∫ [𝑒−𝑡𝜏
𝐿+2
𝐿∑(𝑐𝑜𝑠
𝑛𝜋𝑥
𝐿
⋈
𝑛=1
𝑐𝑜𝑠𝑛𝜋𝑦
𝐿𝑒−𝛼𝑛
𝑡−𝑠𝜏 𝑐𝑜𝑠𝜔𝑠]
𝑡
0
[𝛿(𝑦) − 𝛿(𝑦 − 𝐿)]𝑑𝑦
= 0 +2
𝐿∑(𝑐𝑜𝑠
𝑛𝜋𝑥
𝐿
⋈
𝑛=1
)(1 − cos𝑛𝜋)𝑒−𝛼𝑛𝑡−𝑠𝜏 𝑐𝑜𝑠𝜔𝑠 (2.80)
So for n= 2,4,.. the above equation is zero[(1 − cos 𝑛𝜋) = 0 𝑓𝑜𝑟 𝑛 = 2,4,… ]. The solution
for 𝜑𝑚(𝑥, 𝑡) will be

- 28 -
𝜑𝑚(𝑥, 𝑡) =2𝜆2𝐸0𝐿
∑ [(𝑐𝑜𝑠𝑛𝜋𝑥
𝐿)(1 − cos 𝑛𝜋)∫ 𝑒−𝛼𝑛
𝑡−𝑠𝜏 𝑐𝑜𝑠𝜔𝑠𝑑𝑦
𝑡
0
]
⋈
𝑛=1
=4𝜆2𝐸0𝐿
∑ [𝑐𝑜𝑠𝑛𝜋𝑥
𝐿×𝛼𝑛𝑐𝑜𝑠𝜔𝑡 + 𝜔𝜏𝑠𝑖𝑛𝜔𝑡 − 𝛼𝑛𝑒
−𝛼𝑛𝑡𝜏
𝛼𝑛2 + (𝜔𝜏)2
]
⋈
𝑛=1
=4𝜆2𝐸0𝐿
× ∑𝑐𝑜𝑠𝑛𝜋𝑥
𝐿[sin (𝜔𝑡 + 𝜙𝑛)
√𝛼𝑛2 + (𝜔𝜏)2
+𝛼𝑛𝑒
−𝛼𝑛𝑡𝜏
𝛼𝑛2 + (𝜔𝜏)2
]
⋈
𝑛=1
(2.81)
The answers for 𝛼𝑛 and 𝜙𝑛 is:
𝛼𝑛 = 1 + (𝑛𝜋𝜆
𝐿)2 𝜙𝑛 = 𝑡𝑎𝑛
−1 (𝛼𝑛
√𝛼𝑛2 + (𝜔𝜏)2
) (2.82)
For numerical solutions:
The passive cable can be solved numerically using PDE toolbox in MATLAB. The
boundary conditions are (𝜕𝜑𝑚(0,𝑡)
𝜕𝑥=𝜕𝜑𝑚(𝐿,𝑡)
𝜕𝑥= 0 ), initial value (𝜑𝑚(𝑥, 0) = 0). The
biological values for l, L and t are substitute. We assume that the cell start to be activated
when the membrane reaches the threshold value.
Considering the boundary conditions (𝜕𝜑𝑚(0,𝑡)
𝜕𝑥=𝜕𝜑𝑚(𝐿,𝑡)
𝜕𝑥= 0 ), initial value (𝜑𝑚(𝑥, 0) =
0) , and an external force, we can solve passive cable numerically using PDE toolbox in
MATLAB (The Math Works, Natick, MA).
The values for l, L and t are chosen according to biological data. When membrane
voltage reaches a threshold value (Here is considered 𝜑𝑇 =30 mV), AP happens. The
correlated threshold electric field ET is:
𝐸𝑇 = (𝑚𝑖𝑛𝐸0|𝑚𝑎𝑥𝑥,𝑡𝜑𝑚(𝑥, 𝑡) ≥ 𝜑𝑇) (2.83)
Where E0 is the minimum electric field amplitude matches with the requirements. So the
value of 𝜑𝑚 in the boundaries (0, L) is maximum. For x=0
𝑚𝑎𝑥𝑥𝜑𝑚(𝑥, 𝑡) = 𝜑𝑚(0, 𝑡) (2.84)
=4𝜆2𝐸0𝐿
∑ [sin (𝜔𝑡 + 𝜙𝑛)
√𝛼𝑛2 + (𝜔𝜏)2
+𝛼𝑛𝑒
−𝛼𝑛𝑡𝜏
𝛼𝑛2 + (𝜔𝜏)2
]
⋈
𝑛=1
(2.85)
For a typical dendrite, we use the approximation (𝜆 𝐿⁄ ≫ 𝜔𝜏 ≫ 1:
𝜑𝑚𝑎𝑥 = 𝑚𝑎𝑥𝑥,𝑡𝜑𝑚(𝑥, 𝑡) (2.86)

- 29 -
≈ 𝑚𝑎𝑥𝑡 4𝐸0𝐿
𝜋2cos(𝑤𝑡) ∑
1
𝑛2
∞
𝑛=1,3,..
= 𝐸0𝐿
2 (2.87)
𝜆 > 0.8 𝑚𝑚 𝐿 < 0.1 𝑚𝑚 𝜏 < 10 𝑚𝑠
If the length L increases or I decreases, axon condition will be 𝜆 𝐿 < 𝜔𝜏⁄ . The maximum
value for 𝜑𝑚 is the sum that can be solved numerically using PDE:
𝜑𝑚𝑎𝑥 ≈𝐸𝑜𝜆
√𝜔𝜏 (2.88)
𝜆 < 0.5 𝑚𝑚 𝐿 > 1 𝑚𝑚 𝜏 > 0.1 𝑚𝑠
Reduction of 𝜏 to to <0.1 ms results in saturation of 𝜑𝑚 at the highest value (𝜑𝑚𝑎𝑥 =
𝐸𝑜𝜆). Therefore, reducing 𝜏 does not result in maximum value of 𝜑𝑚.
Likewise, we can not increase L , 𝜆 to reach the maximum value. So, we conclude
that 𝜑𝑚𝑎𝑥 has a limited range[67]
𝑚𝑎𝑥𝜏𝜑𝑚𝑎𝑥 ≤ 𝑚𝑖𝑛 𝜆,𝐿
2 × 𝐸 (2.89)

- 30 -
NEURON software
NEURON is a simulation environment that present neural models. This program is
designed with a flexible environment that includes a high range of simulation scales from
(or a part of) a single neuron to complex nerve models. It allows inserting the properties
of nerve sections and connecting them together to form complex morphologies. In
Neuron software, simulation of models are specified with GUI tools or with the HOC
language. The NMODL language allows for development and improvement of neural
models by adding new components to a model [73]. These advantages allowed the
researches in Human Brain Project (HBP) for modeling several neural instructions by
this software [74,75].
NEURON is an object-oriented interpreter based on creating cable sections which
include the physical properties of the section and can be connected together to form an
arbitrary branched cable[76].
Creating a simple compartment
To create a compartment in NEURON using Hodgkin and Huxley model, the simplest
possible model is neuron’s body simulation. In this model, neuron’s axon and dendrites
are removed: According to HH model, the simplest form of the membrane circuit consists
of a membrane capacitance 𝐶𝑚, a membrane resistance 𝑅𝑚, a leakage reversal potential
𝐸𝐿 and a current source 𝐼𝑒 (Fig 2.14).
Fig 2.15 The simplest compartment in HH model considered in modeling by NEURON, consisting of a capacitanceC_m that represents the voltage difference between two sides of membrane lipid bilayer, a resistor and battery representing the conductance and passing force of the channel and a current source [78]
To create this circuit first we create a section. Each section contains several segments
that have the same membrane potential. We create soma:
create soma
A new section with default properties (Table 2.2) is created.
To refer to this section in the object oriented environment of NEURON we type:

- 31 -
access soma
To print the properties of the section type:
soma psection()
The printed properties, their default values and units are shown in Table.
VARIABLE MEANING VALUE UNITS
NSEG Number of segments in section 1
L Length of section l 100 𝜇𝑚
RA
(PASSIVE)
Specific axial resistance 𝑅𝑎 35.4 Ω cm
DIAM Diameter d 500 𝜇𝑚
CM
(PASSIVE)
Specific membrane capacitance 𝐶𝑚 1 𝜇𝐹/𝑐𝑚2
Table 2.2 Default properties of a section[78]
The section has nseg segments with L/nseg length.
The default values of the parameters can be changed. For example, we change the
diameter to 400 μm, soma length to 120 μm and Ra to 70 Ω cm:
soma.diam = 400
soma.L = 120
soma.Ra = 70
or we can type the name of the parameter in front of the statement without using dot:
soma diam = 400
soma L = 120
soma Ra = 70
or :
soma
diam = 400
L = 120
Ra = 70
- 32 -
The third way to change the values is :
access soma
diam = 400
L = 120
Ra = 70
The access statement should not be used for more than one otherwise, we will get
confused what section we are referring to.
Inserting the properties of the membrane
To create channels on the model, NEURON includes two mechanisms: passive
channels(pas) and Hodgkin and Huxley channels(hh).
According to Fig 2.14 we need to create the properties for the leakage channel that are
the leakage reversal potential ‘𝐸𝐿’ and its related specific leakage conductance ‘𝐿’. To
introduce the membrane conductance and reversal potential to the leakage and other
types of channels we use pas channel[78]:
soma insert pas
This command adds more two properties to soma section that are listed in Table 2.4.
The resistance of the channel is the reverse of the conductance, so 𝑟𝑚 =1
0.001= 1000 Ω
𝑐𝑚2
VARIABLE MEANING VALUE UNITS
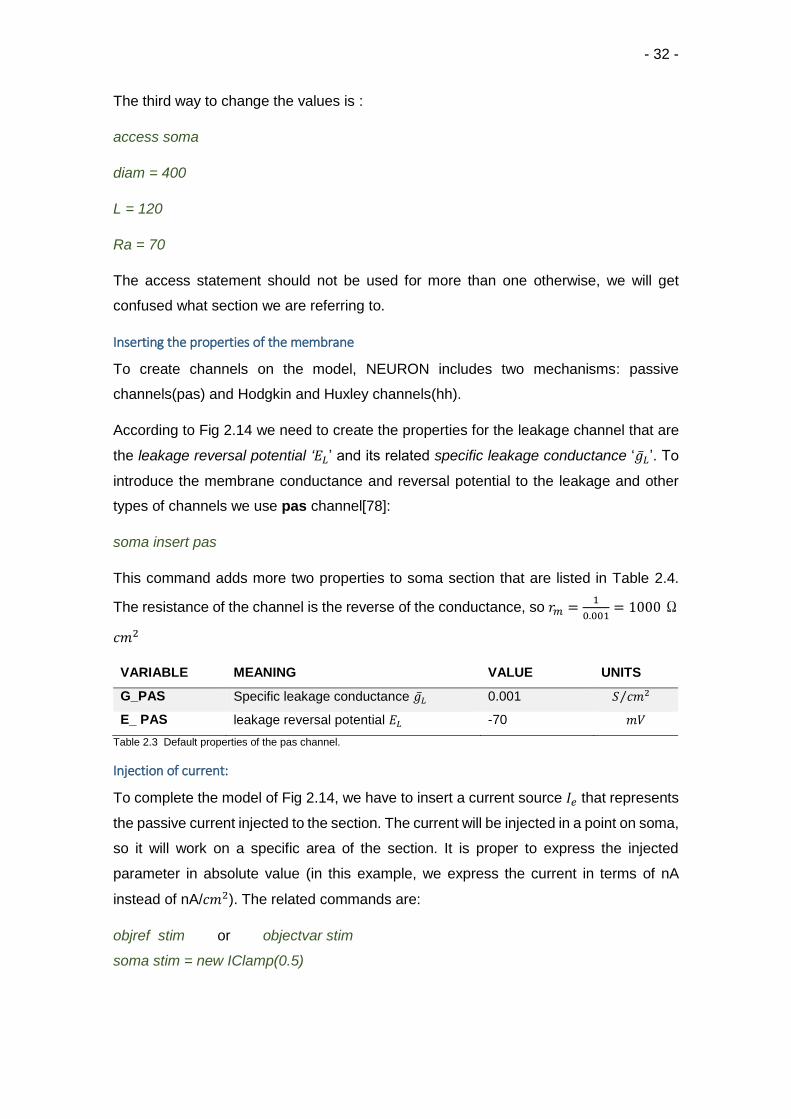
G_PAS Specific leakage conductance 𝐿 0.001 𝑆 𝑐𝑚2⁄
E_ PAS leakage reversal potential 𝐸𝐿 -70 𝑚𝑉
Table 2.3 Default properties of the pas channel.
Injection of current:
To complete the model of Fig 2.14, we have to insert a current source 𝐼𝑒 that represents
the passive current injected to the section. The current will be injected in a point on soma,
so it will work on a specific area of the section. It is proper to express the injected
parameter in absolute value (in this example, we express the current in terms of nA
instead of nA/𝑐𝑚2). The related commands are:
objref stim or objectvar stim
soma stim = new IClamp(0.5)

- 33 -
The object is named stim, objref creates a new reference to stim. In the second
command, we created an object variable named stim. In the second line the property of
the new object (stim) is determined that is the injection of current (current clamp: IClamp).
The new created object is associated to soma section. The location of the point process
is justified in the parenthesis.
Three properties of IClamp are:
- del: The delay until the onset of the stimulus (in ms)
- dur: The duration of the stimulus (in ms)
- amp: The amplitude of the stimulus (in nA)
In our model, we set the properties of the IClamp as follows:
stim.amp = 1
stim.del = 100
The current pulse has 1 nA amplitude, starts after 100 ms and lasts for 90 ms.
For point process objects we have to use ‘dot’ notation.
The point processes are expressed in absolute terms(ex: nA) whereas the parameters
that are attributed to the entire section are usually expressed in terms of per unit area(ex:
nA/𝑐𝑚2).
In addition to IClamp, there are VClamp, ExpSyn poin processes.Each of them have their
own properties that should be set.The program for our model is [77,78]:
create soma
access soma
soma diam = 400
soma L = 120
soma Ra = 70
objectvar stim
stim = new IClamp(0.5)
stim.amp = 0.1
stim.del = 100
stim.dur = 90

- 34 -
How to run the simulation?
A simple command to run the program is.
run()
To compare the changes in membrane potential, we use ‘print’ command before and
after running the program:
soma print v
The default duration for running the program is 5 ms. However, we can change the
duration time by the command bellow [77]:
tstop = 300
run()
Modeling by graphical interface
From the main menu (Fig 2.16.up) click Tools/RunControl. A window will be open that
allows us to specify the related parameters for the simulations (Fig 2.16.down). There
are several buttons; each is used to determine the value of a specific property on the
membrane. A general initial default values are set in front of each icon. We can change
the values by typing the numbers or using the ‘up& down’ button. When a new value is
set, a check mark appears beside the value. Clicking on it returns the parameter to the
initial default value.
Fig 2.16 up) the NEURON main menu, down) RunControl window is designed to determine the related values of properties of the model and see the graphical plot of the changes of the membrane parameters[77].

- 35 -
After specification of the parameter values, we apply them on the model by pressing
Enter key or clicking or Init&Run button.
To see the plot for the time evolution of the membrane voltage, we click the Voltage axis
button from the Graph window of the NEURON main menu. A window will open that
shows the time course (horizontal axis) of the voltage (vertical axis).
The initial value for membrane potential is -70 mV. This amount of voltage is related to
the voltage difference in the capacitance, leakage reversal potential and resistance.
Application of current with 1 nA amplitude, and 5 mS duration (is plotted as a sloping
line) increases the membrane voltage to -40 mV.
There is a square mark at the top-left corner of the window. We can study the figure with
more details by clicking on it or just right-click on the plot and choosing the submenus[77].
Kirchhoff’s law:
From the Kirchhoff’s first law, we drive the equation which relates the time corse of
voltage with other related parameters:
𝐶𝑑𝑉
𝑑𝑡= −
𝑉 − 𝐸𝐿𝑅𝑖𝑛
+ 𝐼𝑒 (2.90)
Here 𝑅𝑖𝑛 is the inject current needed to increase the membrane potential by a desired
amount and 𝐼𝑒 is the current injected.
The answers of equation above is:
When the current is began to inject at t=0, the time evolution of the membrane is:
𝑉 = 𝐸𝐿 + 𝑅𝑖𝑛 (2.91)
When there is no injected current, membrane potential changes according to the
equation below:
𝑉 = 𝐸𝐿 + 𝑉0𝑒− 𝑡𝜏 (2.92)
That 𝑉0 is membrane voltage at the beginning t=0 and 𝜏 is the time constant that is the
time it takes for the membrane potential to get the limited value.
𝜏 = 𝑟𝑚𝑐𝑚 (2.93)
To define𝑅𝑖𝑛 , we use Ohm law that is the ratio of the small changes in membrane
potential over the injected current:

- 36 -
𝑅𝑖𝑛 =∆𝑉
∆𝐼𝑒 (2.94)
The input resistance depends on the specific membrane resistance and the area of the
membrane:
𝑅𝑖𝑛 =𝑟𝑚𝐴 (2.95)
The area of the membrane ’A’ is defined by:
𝐴 = 𝜋. 𝑑𝑖𝑎𝑚𝑒𝑡𝑒𝑟. 𝐿 (2.96)
In our model:
𝐴 = 𝜋. 50 × 10−4. 120 × 10−4
= 1.88 × 10⁻⁴ 𝑐𝑚2 (2.97)
According to table 2.3, the specific membrane resistance is:
𝑟𝑚 =1
𝑠𝑝𝑒𝑐𝑖𝑓𝑖𝑐 𝑙𝑒𝑎𝑘𝑎𝑔𝑒 𝑐𝑜𝑛𝑠𝑡𝑎𝑛𝑡=
1
𝑔_𝑝𝑎𝑠=
1
0.001= 1 𝑘Ω𝑐𝑚2 (2.98)
Therefore 𝑅𝑖𝑛 is:
𝑅𝑖𝑛 =𝑟𝑚𝐴=
1000 Ω𝑐𝑚2
1.88 × 10⁻⁴ 𝑐𝑚2= 5.3 × 10⁶Ω = 5.3 MΩ (2.99)
We compare the result for 𝑅𝑖𝑛 with the result calculated with the other formula:
𝑅𝑖𝑛 =∆𝑉
∆𝐼𝑒=𝑉0 − 𝐸𝐿𝐼𝑒 − 0
=(−59.69 − (−65)) × 10−3
1 × 10−9= 5.3 × 10⁶Ω = 5.3 MΩ (2.100)
Immediately after the current injection, membrane potential is -59.69 mV and its value
before the injection (initial value determined for the model) is -65 mV. The amplitude of
the injected current is 1 nA and there is no initial current. The results show that the
value of 𝑅𝑖𝑛 calculated using the two methods match each other[77].
Saving the program
To edit the commands and reuse them, it is more practical to enter the commands in
notepad for windows users and save them. We can reopen the program by double click
on it.
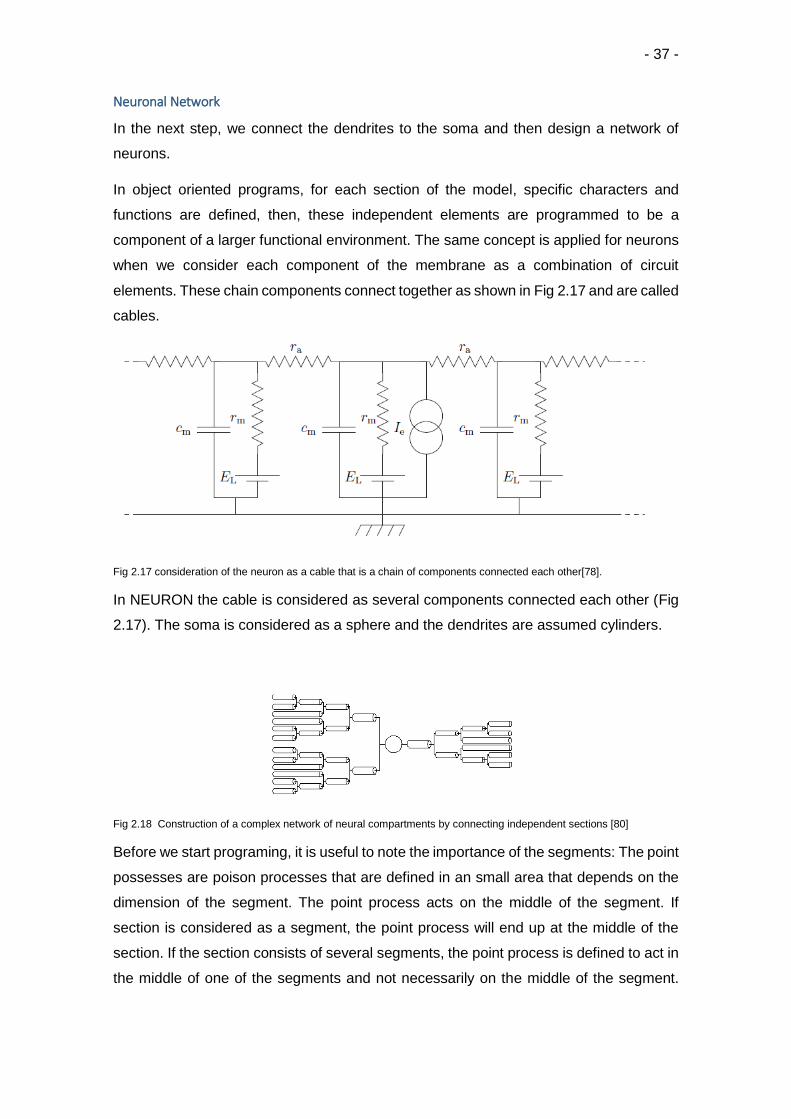
- 37 -
Neuronal Network
In the next step, we connect the dendrites to the soma and then design a network of
neurons.
In object oriented programs, for each section of the model, specific characters and
functions are defined, then, these independent elements are programmed to be a
component of a larger functional environment. The same concept is applied for neurons
when we consider each component of the membrane as a combination of circuit
elements. These chain components connect together as shown in Fig 2.17 and are called
cables.
Fig 2.17 consideration of the neuron as a cable that is a chain of components connected each other[78].
In NEURON the cable is considered as several components connected each other (Fig
2.17). The soma is considered as a sphere and the dendrites are assumed cylinders.
Fig 2.18 Construction of a complex network of neural compartments by connecting independent sections [80]
Before we start programing, it is useful to note the importance of the segments: The point
possesses are poison processes that are defined in an small area that depends on the
dimension of the segment. The point process acts on the middle of the segment. If
section is considered as a segment, the point process will end up at the middle of the
section. If the section consists of several segments, the point process is defined to act in
the middle of one of the segments and not necessarily on the middle of the segment.

- 38 -
Therefore, division of the section into segments increases the spatial resolution of the
simulation.
In this report, our approach is to add two dendrites to the soma. A simple model of
connection is illustrated in Fig 2.19.
Fig 2.19 Three independent segments are connected each other. Dendrites are shown in cylindrical shape are connected to a soma (with spherical shape).
To create the components, we type create command with the name of the sections that
are two dendrites and a soma:
ndend = 2
create soma, dend[ndend]
access soma
The second step is defining the characteristics of each of the sections. For soma:
soma
nseg = 1
diam = 18.8
L = 18.8
Ra = 123.0
insert hh
Then, we determine the properties for each dendrite:
dend[0]
nseg = 5
diam = 3.18
L = 701.9
Ra = 123
- 39 -
insert pas
dend[1]
nseg = 5
diam = 2.0
L = 549.1
Ra = 123
insert pas
To connect the components, we use connect command in the form below:
connect dend[0](0), soma(0)
connect dend[1](0), soma(1)
After introducing the components, we can apply different processes on the sections. For
example, we inject a current pulse in the soma:
objectvar stim
stim = new IClamp(0.5)
stim.del = 100
stim.dur = 100
stim.amp = 0.1
tstop = 300
It is important to note that the initial potential of the membrane is similar but not
necessarily the same in all the components. Voltage variation on the membrane depends
on time, so , to reach a stable state, it is better to let the simulation run for a while before
applying a stimulation (in our program the delay is 100 ms before applying IClamp
)[79,80].

- 40 -
Figures generation
To plot the voltage graph of the three section, we right click on the voltage graph window
and choose “plot what?” A window will open with the list of the sections and their
properties.
The variables are calculated at different times. For example, voltage is calculated at the
beginning of the time step, whereas current is calculated at the middle of the time
step[80].

- 41 -
Chapter 3
Effect of temperature on voltage-gated sodium,
potassium and calcium channels
Regarding the influence of temperature on chemical and enzymatic processes involved
in channels function, as well as its effect on membrane lipids associated with channels
[81], effect of temperature on channel responses is an important issue. Influence of
temperature on ion channels of unmammalian neurons have been studied in several
researches [82-85], nevertheless its effect on mammalian neural channels have become
a hot topic recently.
In this section, we analyze the response of the voltage gated sodium 𝑁𝑎𝑉 and potassium
𝐾𝑉 channels to the changes in temperature with NEURON software. We apply Hodgkin
and Huxley equations for Na, K, leak currents in mammalian nerve cells (HH2). Using
ICLAMP technique, we injected a current with specific amplitude (0.1 nA) and duration
(5 ms) and simulate the behavior of voltage gated ionic channels at temperatures 30
(activation range of TRPV4 channels), 36, 40, 43 (TRPV1 is activated at this temperature
[46]), 45, 52 (activation temperature of TRPV2 channels) and 55𝑜𝐶. Finally, we use
VCLAMP technique and find the changes in time constant and gating parameters versus
temperature and voltage.
Methods and Settings
In this simulation, a typical soma with 20𝜇𝑚 length and 20𝜇𝑚 diameter is considered,
then we express 𝑁𝑎𝑉 and 𝐾𝑉 channels by inserting hh2 model and adding leakage
current:
create soma
soma diam = 20
soma L = 20
insert hh2
insert pas

- 42 -
The amplitude of the leakage current is set to )(0001.02
cmS . The values of Na
g and
kg equals to )(003.0
2cmmho and )(005.0
2cmmho respectively according to the hh2
model conditions. After initial settings , we fix the temperature to 25𝑂𝐶 and form ‘
NEURON Main Menue’ we choose ‘Tools’ and select ‘RunControl’ to control the initial
potential , simulation duration and other parameters. Then from ‘Tools’ , ‘Point
Processes’ we select ‘ Managers’ then ‘ Electrode’. ‘I/V Clamp Electrode’ window will
open. We choose ICLAMP and set the delay period to 5 ms, current injection period to 5
ms and the current amplitude to 0.1 nA. In Fig 3.1 the considered settings are illustrated.
Fig 3. 1 Initial settings for our simulations with ICLAMP technique.
After setting the parameters, we run the program for several considered temperatures.
To see the simulation results, Neuron has graph options that is explained in Ch2. We
illustrated V-t, gating numbers-t and time constant 𝜏 − 𝑡 graphs in the following sections.
Result 1: Membrane voltage versus time
Membrane potential remains at rest value until the time the current is injected (t = 5ms
to 10 ms). From t = 5ms, the potential starts to rise and when it passes the threshold
potential, AP happens. According to Fig 3.2.a, the amplitude and duration of the spikes
decrease with temperature significantly.
For more precised evaluation, we divide the AP process to 3 stages as shown in Fig
3.2.b. The first stage is from the time that the current is turned on to the threshold voltage
which is about -40 mV ( from Voff to Vinit), the second stage is the time that the potential

- 43 -
jumps from the threshold value (-40 mV) to the maximum peak of the spike(Vmax) and
the last stage is the time interval that the membrane potential drops from Vmax to its
threshold value named Vend.
Fig 3. 2 a) Reaction of soma to the injection of current with 0.1 nA amplitude and 5ms duration at 30, 36, 40, 43, 45, 52, and 55𝑜𝐶. The dynamic rate of channels increases with temperature. b) AP at 30 C that is pointed by four voltage values to divide the AP process to several stages for more precise evaluation.
Fig 3.3 shows the changes in potential versus time. As it is clear form Fig 3.3.a,
membrane potential at lower temperatures rises more than the case it does at higher
temperatures. The pattern of membrane voltage is similar from Voff to Vinit in all
temperatures as shown in Fig 3.3.b.But the differences are significant from Vinit to
maximum peak (Fig 3.3.c) and it is almost equal for the pattern from Vmax to Vend but
with inverse trend.
Fig 3.3.e, f and g show the duration of APs in various temperatures. In these figures, the
duration of the ionic flux from Voff to Vmax have an exponential trend. At low
temperatures, the spike duration is high. However, alteration of the temperature results
in decreasing the duration of the ionic fluxes except in Fig 3.3.f that the duration of the
ion flux from Voff to Vinit is highest at C0
30 , then it decreases by temperature and hits
a minimum peak at C0
45 and then rises again. Although, the changes of the period from
Voff to Vinit is very small in this graph, it has a small effect on the total figure of APs.
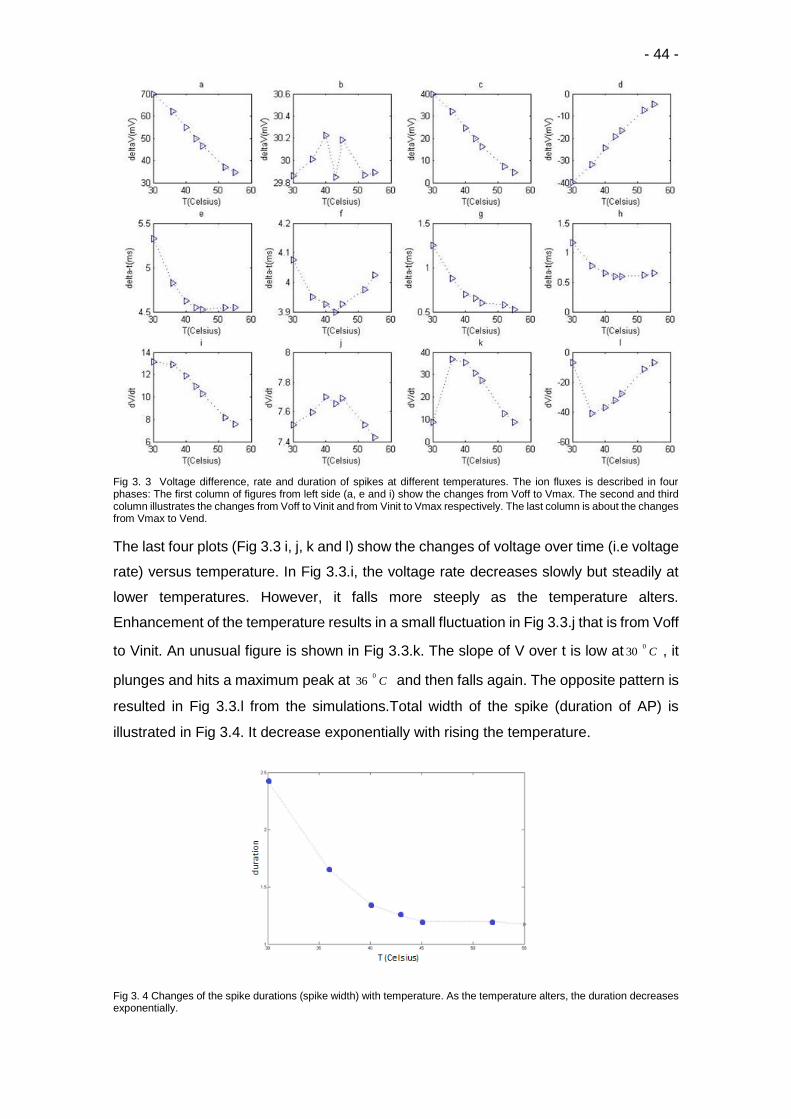
- 44 -
Fig 3. 3 Voltage difference, rate and duration of spikes at different temperatures. The ion fluxes is described in four phases: The first column of figures from left side (a, e and i) show the changes from Voff to Vmax. The second and third column illustrates the changes from Voff to Vinit and from Vinit to Vmax respectively. The last column is about the changes from Vmax to Vend.
The last four plots (Fig 3.3 i, j, k and l) show the changes of voltage over time (i.e voltage
rate) versus temperature. In Fig 3.3.i, the voltage rate decreases slowly but steadily at
lower temperatures. However, it falls more steeply as the temperature alters.
Enhancement of the temperature results in a small fluctuation in Fig 3.3.j that is from Voff
to Vinit. An unusual figure is shown in Fig 3.3.k. The slope of V over t is low at C0
30 , it
plunges and hits a maximum peak at C0
36 and then falls again. The opposite pattern is
resulted in Fig 3.3.l from the simulations.Total width of the spike (duration of AP) is
illustrated in Fig 3.4. It decrease exponentially with rising the temperature.
Fig 3. 4 Changes of the spike durations (spike width) with temperature. As the temperature alters, the duration decreases exponentially.

- 45 -
Result 2: Gating parameters
We also study the contribution of m and h gates for sodium channels and n gates of
potassium channels. The time course of these gate activations is illustrated in Fig 3.5.
In Fig 3.5a, as the temperature increases, the percentage of the activated m gates and
its duration decreases. The apposite pattern is shown for h gates (Fig 3.5.b). For
Potassium channels only one type of gate is defined (n gates). In Fig 3.5.c, the
enhancement of temperature results in decreasing the width and amplitude of the n-t
graphs. The plot for n gates at 43𝑜𝐶 follows an unusual trend. It is important to note that
at this temperature range TRPV1 channels are activated. We can conclude that 𝐾𝑉
channels may moderates the TRPV1-caused spikes.
Fig 3. 5 The percentage of the activated gating number of a)Na-m, b)Na-h and c) k-n gates over time and at various
temperatures. In all plots, as the temperature rises, the proportion of reacted gates decreases except the n gates at 43𝑜𝐶
that show a different pattern in plot c
Fig 3.6 shows the maximum number of activated m, h and n gates and the related time.
Considering that m gates of the sodium channels start action potential, and HH model
considers all or none role, response is possible only when high proportion of m gates are
activated. Since only around 60% of the channels get activated, we can indicate from
Fig 3.6.a that the membrane perturbations at 53 and C0
55 are not defined as an AP.

- 46 -
It is important to note that in Fig 3.6.c, mechanism of n gating at C0
43 does not follow
similar pattern of gating at other temperatures.
Fig 3. 6 the maximum percentage of gating of a) m gates for sodium channels, b) h gates for sodium channels, c) n gates
for potassium channels and d) comparison of the three plots. The time and maximum gating numbers decrease with
temperature. However, maximum n at 43o C shows a different trend.
From Fig 3.6.d it is clear that h gates reach their maximum activation percentage earlier
than the m and n gates. Comparing the plots for m and n gates for sodium and potassium
channels, the time and percentage of maximum gating for both gates and the related
time period is similar at high temperatures( C0
43,45,52,55 ) but at low temperatures the
plot for m gates is far higher than n gates. Indeed, although the numbers of activated
gates change very small by temperature, the m gates activation percentage is increasing
but for n gates it is decreasing.
Fig 3.7 compares the activation percentage of m, h and n gates as a function of voltage
for different temperatures. As it is clear from Fig 3.7a, none of the m gates are in activated
condition at rest potential. Injection of current leads to the activation of gates that is
continued until it reaches a maximum value, which is proportional reversely to the
temperature. Then it goes back to the initial value. Fig 3.6.b shows the activation
percentage of h gates. For the membrane temperature of C0
30 , the activation process
happens in vast wide of voltages, however as we set the membrane to higher
temperatures, the width and the percentage of the h gates become smaller. For the n

- 47 -
gates of potassium channels, in low temperatures ( C0
45,40,36,30 ), the maximum
number of activated gates have similar value around 60% of the total number of gates.
In this plot also, we see the activation trend of n gates at C0
43 behave differently with
others. The maximum percentage and the voltage interval of the activation at 52 and
C0
55 is much smaller than those for low temperatures.
Fig 3.7 Activation percentage versus membrane voltage for a)m gates and b)h gates of voltage gated sodium channels
and c)n gates of potassium channels at different temperatures. As the temperature decreases the rating process happens
in smaller range of voltage.
Effect of thermal and electrical stimulation in VClamp condition
Vclamp technique is the other method that is used in HH model. In this case, the
voltage remains constant during the experiment. To study the effect of temperature
on the kinetics of ionic fluxes, we use the formulas in the HH2 model. We set the
voltage to change from -75 to 45 mV and the temperature from 25 to C0
65 with 1𝑜𝐶
steps. The results are shown in Fig 3.8.
Result 1 : Effect of temperature on time constant
Before analyzing the results, it is useful to note that changes in temperature affects the
time constant ( ) directly:

- 48 -
tadjba )(
1
(3.1)
That
10
36)(0
3
CT
tadj (3.2)
The temperature factor (tadj) is appeared only in time constant parameter in HH model
in NEURON [73].
In this simulation, we changed the temperature from 25𝑜𝐶 to 65𝑜𝐶 with 1𝑜𝐶 steps to find
the relation of time constants with temperature.
Fig 3.8 compares the changes in the time constant of m, h and n gates with temperature.
The m gates, which are beginners of AP,
are affected very small from changing the temperature, but the time constant for h gates
of sodium channels decrease exponentially. Effect of temperature on time constant for n
gates of potassium channels is higher than for those of sodium channels but the trend of
changes is similar with the h gates.
Fig 3. 8 Changes of the time constant for m, h gates of the sodium channels and n gates of the potassium channels. Temperature increases from 25o C to 65o C with 1o C steps.
Result 2: Gate number versus temperature and voltage
Fig 3.9 illustrates the kinetics of V
Na and V
k channels as a result of thermal and electrical
stimulation of soma. In the first plot, the fraction of activated gates is shown (in 20
temperature values) as a function of voltage. The graphs at different temperatures almost
coincide each other. As it is clear from the plots, the number of activation of m and n

- 49 -
gates increases by thermal and electrical stimulations, but the number of activated h
gates decreases from 100% to zero. At first glance, we see that the patterns of the gating
is the same in both types of stimulation. However, it is important to note that the voltage
stimulation is in [-80(mV):1 mV: 60(mV)] interval but the thermal stimulation is between
25 to C0
65 with 1𝑜𝐶 step.
For better comparison between the effect of thermal and electrical stimulation, the 3
dimensional plot is illustrated for changes in fraction of activated gates with temperature
(Fig 3.9.a) and also with voltage (Fig 3.9.b).
Fig 3. 9 Fraction of m gates(blue), h gates(green) and n gates(red) that are activated due to change in a) voltage from -
80 to -60 mV. Each gating number trend is simulated at temperatures 25,26,… , 65o C . b) Fraction of m gates (blue), h gates(green) and n gates(red) that are activated due to change in temperature at constant voltage of -80,-79,…,60 mV.
As it is clear from Fig 3.9.a, the GateNumber-V graph for each gate is almost the same
at all temperatures.( The lines include the overlapped plots of the Gate Number-V graph
at considered temperatures). Similar figure is recorded for Gate Number-T at considered
voltages). Changes in Gate number with temperature and voltage looks similar. The only

- 50 -
notable difference is the range of variations in voltage(-80 to 60 mV ) and temperature(25
to 65𝑜𝐶). For better comparison, we illustrate the 3-D plot for the Gate Number-V-T in
Fig 3.10.
Fig 3.10 changes in the fraction of activated gate number as a result of thermal ( 25:1: 65o C) and electrical (-80:1:60 mV) stimulations.

- 51 -
Chapter 4
A code for TRPV1
Mechanism of TRPV1 channels is still obscured. However, some experimental attempts
involve the contribution of electrical stimulation on TRPV1 channels [4]. To construct an
appropriate numerical model for gating mechanism of TRPV1 channels, we first use
these experimental results to study the mathematics for involvement of voltage changes
on TRPV1 gating. These expressions help us to provide an algorithm for electrical
stimulation of TRPV1 channels at different temperatures. After bulding a computational
model, we design several simulations similar to the experimented data recorded by Voets
et al. [4] and discuss the cases that the results agree or disagree with experimental
records. We also simulate and discus the effect of voltage on 𝑁𝑎𝑉, 𝑘𝑉, 𝐶𝑎𝑉 and TRPV1
channels.
Experiments on dependence of TRPV1 on membrane voltage
Heat-sensitive TRPV1 channels are also sensitive to the changes in membrane voltage.
It seems that voltage and temperature dependency are linked together.
In an experiment, Voets et .al used whole-patch clamp technique on human embryonic
kidney (HEK) 293 cells to study the kinetics of ion flux through TRPV1 gates[4]. The
time course of current is described with a two state model for voltage gated channel.
(4.1)
They fitted the results to a mathematical model and derived a formula for opening and
closing rate of the TRPV1 channels that determines the contribution of voltage on them:
𝛼 = 𝐴𝑒−𝐸𝑎,𝑜𝑝𝑒𝑛𝑅𝑇 𝑒
𝛿𝑧𝐹𝑉𝑅𝑇 (4.2)
𝛽 = 𝐵𝑒−𝐸𝑎,𝑐𝑙𝑜𝑠𝑒𝑅𝑇 𝑒−
(1−𝛿)𝑧𝐹𝑉𝑅𝑇 (4.3)
That 𝐸𝑎,𝑜𝑝𝑒𝑛 and 𝐸𝑎,𝑐𝑙𝑜𝑠𝑒 are activation energies for opening and closing the gates, R is
the gas constant(8.31 J.𝑚𝑜𝑙−1. 𝐾−1), T is absolute temperature, z is effective charge
associated with voltage dependent gating , 𝛿 is the fraction of z moved outward, F is
Faraday constant(9.65× 10⁴ 𝐶𝑒𝑙𝑠𝑖𝑢𝑠.𝑚𝑜𝑙−1) and A and B are preexponential factors.
According to Eyring rate theory, the activation energy is calculated by[20,87]:

- 52 -
𝐸𝑎 = ∆𝐻 + 𝑅𝑇 (4.4)
And 𝐴 = 𝑘0𝑒∆𝑆 𝑅⁄ (4.5)
Where 𝑘0 is the frequency factor. The gating rates are related to channel opening
probability by:
𝛼=𝑃𝑜𝑝𝑒𝑛 𝜏⁄ (4.6)
And
𝛽 = (1 − 𝑃𝑜𝑝𝑒𝑛) 𝜏⁄ (4.7)
The following parameters are obtained for TRPV1 channels in -100 and +100 mV :
A =1.61 × 1037 𝑆−1 , 𝐸𝑎,𝑜𝑝𝑒𝑛 = 208 kJ. 𝑚𝑜𝑙−1 (4.8)
B = 9.67 × 10⁵ 𝑆−1, 𝐸𝑎,𝑐𝑙𝑜𝑠𝑒 = 23.2 kJ. 𝑚𝑜𝑙−1 (4.9)
𝛿= 0.5
z = 0.71
We used the above information to build our model for voltage sensitivity of TRPV1
channels in NEURON. In this model, we can fix membrane temperature at different
temperatures and inject arbitrary amount of current. The same as 𝐾𝑉 channels, only one
type of gating is considered for TRPV1s. The following sections explains the results of
simulations we did with our model that matches well with the experimental records.
Results of simulations for voltage dependency of TRPV1
We provided a model that is the computational construction of the set of equations
explained above. To check if the computational model match with the experimental
records, we designed some simulations:
We create a soma with 20 𝜇𝑚 length and 20 𝜇𝑚 diameter and then insert TRPV1 model.
After that, we use VCLAMP technique to keep the membrane voltage at a constant value.
The value for g_pas is set to 0.0001 (S/𝑐𝑚2).
Create soma
Soma diam = 20
Soma L = 20
insert pas

- 53 -
insert TRPV1
The primary membrane voltage is set to -70 mV with 100 ms duration and the simulation
voltage amplitude is set to 100 mV with duration of 100 ms. Fig 4.1 shows the VCLAMP
settings.
Voets et al. calculated the opening probability and activation and inactivation rates for
25, 30, 35, 42𝑂𝐶 temperature (Fig 4.2) [4]. We do the same measurements to test if the
simulation results match with the experimented records. We plot 𝑛∞(i.e 𝑃𝑜𝑝𝑒𝑛) and 𝜏𝑛 for
25, 30, 35, 42𝑂𝐶 temperature as a function of time for each temperature and find 𝛼 , 𝛽
and 𝑃𝑜𝑝𝑒𝑛 and compare them with the correlated experimental result.
Fig 4.1 initial settings for simulation of the activation current and opening probability of TRPV1

- 54 -
b
Fig 4.2 a) Current(nA) related to the activation of TRPV1 channels at 25, 30, 35, 42^O Cduring depolarization of the membrane from 0 to 0100 mV. Opening probability and the time constant is indicated under each graph and the constant rates is calculated from the measurements [4]. The fitted currents is shown in red and scale bars indicate 10 ms duration. b) Similar trend is used to simulate the related parameters in NEURON with TRPV1 code and non-passive current condition.
Fig 4.2.a illustrates the experimental measurements of current, opening probability
(𝑃𝑜𝑝𝑒𝑛) ,the time constant (𝜏) and the activation and deactivation rate constants at
25,30,35 and 42𝑂C.
Changing the membrane voltage results in a rising trend of current through TRPV1
channels. As the result of electrical stimulation, the low-level current increases in all four
temperatures albeit to varying the flux rates and then remains stable. It can be concluded
that temperature alteration leads to decrease in time constant and increase in 𝑃𝑜𝑝𝑒𝑛 , and
the constant rates.
Simulation of this experiment in NEURON with TRPV1code is illustrated in Fig 2.b It
shows that the stimulation of TRPV1 channels results in dramatic increasing of the ionic
current. At 42𝑂𝐶 the current increases from about -34 nA to 36 nA. As the temperatures
falls, the primer current increases to about -9, -3 and -1 nA, and the maximum current
amplitude also decreases. As temperature declines, the value for 𝑃𝑜𝑝𝑒𝑛 decreases and
the time constant rises which result in smaller flux rates.
Overall, it can be concluded that the quantity for the parameters simulated using TRPV1
code does not show a considerable difference with the experimental records.
a

- 55 -
In the next simulation, we evaluated the changes in current amplitude at various injected
voltage (-120, -100 , -80, … , 100, 120 mV) with similar condition with the experiment
done by Voet et al. which is illustrated in Fig 4.3.a below. In this experiment, the primary
voltage is set to 0 mV for 12 ms and the final voltage is set to +60 mV with 38 ms duration.
The injected voltages range from -120 mV to +160 mV with 20 mV steps and the duration
is 100 ms (Fig 3c and Fig 2.c Voet et al). In our simulations the function of TRPV1
channels are simulated by TRPV1 code(Fig 4.3.b). In Fig 2 the related settings is
illustrated.
Fig 4.3 Simulation settings related to measurement of effect of voltage changes on TRPV1 in different temperatures (The result of simulations is shown in Fig 4.3)
The experimental records[4] in Fig 4.3.a show that changes in voltage does not affect
the mechanism of TRPV1 channels significantly at low temperatures, but as the
temperature increases, increasing voltage cause a larger alteration of ionic current
through the TRPV1 gates. Indeed, stimulation of the TRPV1 gates with positive voltages
leads large ionic fluxes.

- 56 -
a
b
Fig 4.4 Effect of changing in the amplitude of injected voltage to dynamics of TRPV1 channels at 17, 25, 35 and 42o C. A) the experimental results recorded by Voet et al [4] b) result of simulations by TRPV1 code
It is also clear from the graphs that stimulation of membrane with negative voltages does
not affect the gates considerably, however as the voltage increases (voltage steps are
equal, 20 mV), the current steps become larger. At 42𝑂𝐶 ,the difference between the
current flowed in +160 mV and in -120 mV is about 11 nA in the records of Voet et . al.
However, the current amplitude difference in our simulations with TRPV1 code is about
8 nA.
The last simulation is set to check the opening probability of the TRPV1 gates in different
voltages and temperatures. Fig 4.5 shows the related settings.
Voet et .al studied the probability of gating of the TRPV1 channels (P_open)at various
temperatures(Fig 4.6.a). They set the temperature to a specific value and injected -120
mV voltage and recorded 𝑃𝑜𝑝𝑒𝑛, they measured 𝑃𝑜𝑝𝑒𝑛 each time they increased the
voltage to +20 mv higher amplitude.

- 57 -
Fig 4.6 b show that the opening probability obtained from simulations by TRPV1 code is
similar with the experimental records.
Fig 4.5 Settings related to simulation of opening probability at different voltages and temperatures
Fig 4.6 The opening probability versus voltage at different temperatures. A) experimental records by voet et .al [4] b) Results of simulation by TRPV1 code

- 58 -
Chapter 5
Simulation: Role pf TRPV1 channels in
membrane stimulations
We aim to investigate some properties of TRPV1 channels function and compare it with
Voltage gated sodium, potassium and calcium channels for mammalian. We compare
the voltage and its rate of change, duration of spike and related gating numbers when
thermal or electrical stimulation is applied in the cases with and without TRPV1 channels.
In the next step, we compare the threshold current required to generate AP with
contribution of all the considered channels. Finally, the firing rate and the spike widths at
different simulation condition is studied.
Simulation settings
To construct the model of our simulations, first, we create soma with 20𝜇𝑚 diameter and
20𝜇𝑚 length. Second, we insert passive current, HH2 and Ca_t_thal. Finally, we insert
TRPV1 model to the previous simulation instruction and compare the kinetics of ionic
fluxes through 𝐶𝑎𝑉 𝑁𝑎𝑉 and 𝑘𝑉 and TRPV1 gates.
create soma
access soma
L = 20
diam=20
insert pas
insert hh2
insert Ca_t_thal
*insert TRPV1
We set the passive conductance to 0.0005 𝑆 𝑐𝑚2⁄ and 𝑇𝑅𝑃𝑉1 to 1.7 × 10⁻⁴mho/𝑐𝑚2. Fig
5.1 shows the primer settings for the simulations. We simulate the stimulation of soma
at 30, 36, 40, 43, 45, 52, 55𝑂𝐶. At each temperature, we inject 0.1 nA current with 5 ms
duration.

- 59 -
Fig 5. 1 Settings for simulating the stimulation of a soma using ICLAMP technique .
Result 1: Simulation of Pulses caused by alteration of temperature
Using TRPV1 model, it is possible to study the effect of fixed temperatures on TRPV1
channels and the spikes produced by these temperature sensitive channels. We set the
amplitude of the current to zero and increase the temperature to evaluate the mechanism
of voltage gated and TRPV1 channels in the condition that no current is injected.
Fig 5. 2 changes in membrane voltage due to the change in temperature in the condition with 0 nA current amplitude
Fig 5.2 shows that at low temperatures, TRPV1 channels are not activated to produce
AP, therefore at 43𝑂𝐶 and lower temperatures, AP does not happen. However, in higher
temperatures, ionic fluxes through TRPV1 gates are high enough to generate AP. This
figure is illustrated for simulation of TRPV1 gates together with the
𝐶𝑎𝑉 𝑁𝑎𝑉 𝑎𝑛𝑑 𝑘𝑉 channels. Two spikes can be observed at 45𝑂𝐶, one of them is occurred

- 60 -
during the current application, the second spike is after stimulation period. The width of
the AP is the same for both spikes (0.7 ms) but the height of the spike for the first AP is
slightly higher than the second spike. At T= 52𝑂𝐶 , although we see several APs in the
V-t graph, since the membrane voltage after each spike does not pass to
hyperpolarization stage, these spikes are do not occur in reality and perhaps another
temperature sensitive TRP channel is activated to moderate the condition.
Result 2: Membrane potential perturbations
We can study the effect of temperature on AP at different temperatures. The graphs for
spikes at various temperature are illustrated in Fig5.3 .We use MATLAB in our
evaluations.
Fig 5.3.a shows the voltage perturbations resulted due to the ionic flux through
𝐶𝑎𝑉 𝑁𝑎𝑉 𝑎𝑛𝑑 𝑘𝑉 channels. The same stimulation is applied for only 𝑁𝑎𝑉 𝑎𝑛𝑑 𝑘𝑉
channels. As it is clear from the figures, injection of current from 5 ms to 10 ms results in
small increase in the potential that its magnitude is the same in all considered
temperatures. Comparing the two figures, function of calcium channels do not cause any
significant difference in the pattern of voltage changes.
Fig 5. 3 perturbation in membrane potential caused by ionic flux through a) 𝑁𝑎𝑉 𝑎𝑛𝑑 𝑘𝑉 channels and b)𝐶𝑎𝑉, 𝑁𝑎𝑉 𝑎𝑛𝑑 𝑘𝑉 channels under the stimulation of the soma with 0.1 nA current with 5 ms duration.
However, when TRPV1 model is inserted in the simulation instruction, notably several
spikes are observed.

- 61 -
Fig 5. 4 perturbation in membrane potential due to injection of 0.1 nA current with 5 ms duration at different temperatures.
Red graphs represent the ionic fluxes through) 𝑁𝑎𝑉, 𝑘𝑉 𝑎𝑛𝑑 𝑇𝑅𝑃𝑉1 channels, and the blue graphs show the flux through
) 𝐶𝑎𝑉 , 𝑁𝑎𝑉, 𝑘𝑉 and TRPV1 channels.
Now we analyze the APs illustrated in Fig 5.4. These spikes are generated by voltage
gated sodium, potassium, calcium and temperature sensitive TRPV1 channels. At low
temperatures of 30𝑂C and 36𝑂𝐶 the voltage rose gradually to about -55 mV, so no spike
is occurred. Nevertheless, at 40𝑂𝐶 an AP with 1ms duration is happened due to the
alteration of temperature and injection of current. Fig 5.5 shows the details of the spike.
Application of current at t=5 ms cause the membrane voltage increase slowly, then after
2.7 ms an AP starts at 7.7 ms, the membrane voltage is soared from -40 mV to 47 mV,
then it plummeted to again -40 mV at 8.7 ms. Then it dips during the hyperpolarization.
After this injection period that ends at 10 ms, the membrane potential decreases steadily.
Comparing Fig 5.4.c with Fig 5.3.a, it can be concluded that despite the fact that
temperature has a large effect on production of AP at 40𝑂𝐶, the main reason for its
generation is injection of 0.1 nA current to the membrane that include TRPV1 channel
distribution.

- 62 -
Fig 5. 5 Detail of V-t graphs for the spikes happened at different temperatures and 0.1 nA current application with 5 ms duration in ICLAMP technique.
At higher temperature of 43𝑂𝐶 two APs are recorded that both are generated during the
stimulation period. AP durations are almost the same, but the peak value of the second
spike is slightly smaller than the first spike. Also, at 45𝑂𝐶 two APs are produced. In
addition to these spikes, we can see a third AP that happens after the stimulation period.
The width of all three spikes are the same with 0.7 ms duration. The magnitude of peak
voltage is highest in the first spike, decreases about 6.4 mV in the second peak, and
stays almost the same in the third AP.
Comparing the V- t graphs at considered temperatures, we conclude that with an
insignificant difference, the height and the duration of the spikes decreases as the
temperature alters. It is interesting to note that the width of the AP does not change in a
specific temperature. In addition, the spike at 40𝑂𝐶 begins at t=7.7 ms with 1 ms
duration. At 43𝑂𝐶, generation of spike starts earlear at t=6.3 ms with lower duration(0.7
ms) than that for the AP at 40𝑂𝐶. The time of AP generation is even smaller at 45𝑂𝐶
(t=5.6 ms) and the duration of the AP is also smaller ( 0.7 ms) . Therefore, increasing the
temperature alters firing rate when soma is exposed to electrical stimulation.
Fig 5.2.c shows that at higher temperatures even without current injection, the membrane
can have an AP. At 45𝑂𝐶 two spikes are recorded that the first spike occurs during the
stimulation. It is produced at 6.4 ms with 0.7 ms duration and the maximum voltage in
42.8 mV. Injection of 0.1 nA current (Fig 5.5) causes generation of AP 0.6ms earlier and
alteration in firing rate. However, the width of the spike is the same in both conditions.

- 63 -
The graphs related to T= 52𝑂𝐶 and higher temperatures show that since the membrane
does not pass to hyperpolarization stage, the temperature sensitive TRPV1 channels
and voltage gated channels do not generate action potential at this temperature (Fig 5.2
and 5.4 ).
Result 3: Contribution of 𝐶𝑎𝑉 , 𝑁𝑎𝑉 , 𝐾𝑉 channels in membrane
potential variations
We aim to find out which channel is the main responsible for beginning of AP at
36, 40, 43 𝑎𝑛𝑑 45𝑂𝐶. The candidates are m, nTRPV1 and mCa channels. First, we
compare 𝑚∞ and 𝑛𝑇𝑅𝑃𝑉1∞ versus time. We plot the kinetics of ionic flux through the
channels in Fig 5.6.
Fig 5. 6 proportion of activated 𝑚∞ for 𝑁𝑎𝑉 channels (blue) and 𝑛𝑇𝑅𝑃𝑉1∞ (red) at different temperatures
According to Fig 5.6.a, at 36𝑂𝐶 the proportion of both 𝑚∞ and 𝑛𝑇𝑅𝑃𝑉1∞ parameters
does not increase significantly when current is applied at 5 ms. For this reason, AP does
not happen at this temperature. Fig 5.6.b shows the proportion of the considered
parameters at 40𝑂𝐶. At t=7.7 ms that the membrane voltage reaches -40 mV (beginning
of AP) 45% of 𝑛𝑇𝑅𝑃𝑉1∞ is activated but only 18% of 𝑚∞ is opened. The value of
𝑛𝑇𝑅𝑃𝑉1∞ is much higher than 𝑚∞ at high temperatures. Therefore, nTRPV1 channels
are mainly responsible for beginning of AP and contribution of sodium channels is small.
In addition, it seems that temperature does not affect the gating of m channels at -40mV,
because at this voltage, the percentage of 𝑚∞ is the same (18%) in all temperatures.
On the other hand, although the width of spikes is the same for 𝑚∞ and 𝑛𝑇𝑅𝑃𝑉1∞, the
maximum value and the related duration is larger for nTRPV1 channels. During the spike,

- 64 -
the maximum value that 𝑚∞ of sodium channels reaches is 100% and remains in this
stage for a short period. This period is less than 1 ms and decreases by temperature,
nevertheless, the maximum percentage of 𝑛𝑇𝑅𝑃𝑉1∞ is not constant and increases as
the temperature alters, but unlike the m gates, the duration of this condition is about a
microsecond.
In Fig 5.7 all these parameters and the correlated time constants are compared at a 36𝑂𝐶
and 40𝑂𝐶.
Fig 5. 7 changes of 𝑚∞, ℎ∞, 𝑛∞ 𝑎𝑛𝑑 𝑛𝑇𝑅𝑃𝑉1∞ when 0.1 nA current with 5 ms duration is injected at left) 36𝑂𝐶 right) 40𝑂𝐶
As it is clear in Fig 5.7, although at 36𝑂𝐶 the current is induced, the proportion of the
parameters do not change significantly. However, when we increase the temperature
and apply the current the gates become activated and after a while, they approach their
maximum possible percentages. This pattern is the same at higher temperatures of 43𝑂𝐶
and 45𝑂𝐶 illustrated in Fig 5.8.
Fig 5. 8 Changes of 𝑚∞, ℎ∞, 𝑛∞ 𝑎𝑛𝑑 𝑛𝑇𝑅𝑃𝑉1∞ when 0.1 nA current with 5 ms duration is injected at a) 43𝑂𝐶 b) 45𝑂𝐶 . The period of first spike is zoomed below each graph. The black line shows the time that the AP is began.
According to Fig 5.8, the percentage of 𝑚∞,𝑚𝑎𝑥 and also the rate of activation of sodium
gates is the largest during action potential at all temperatures. The two graphs are plot
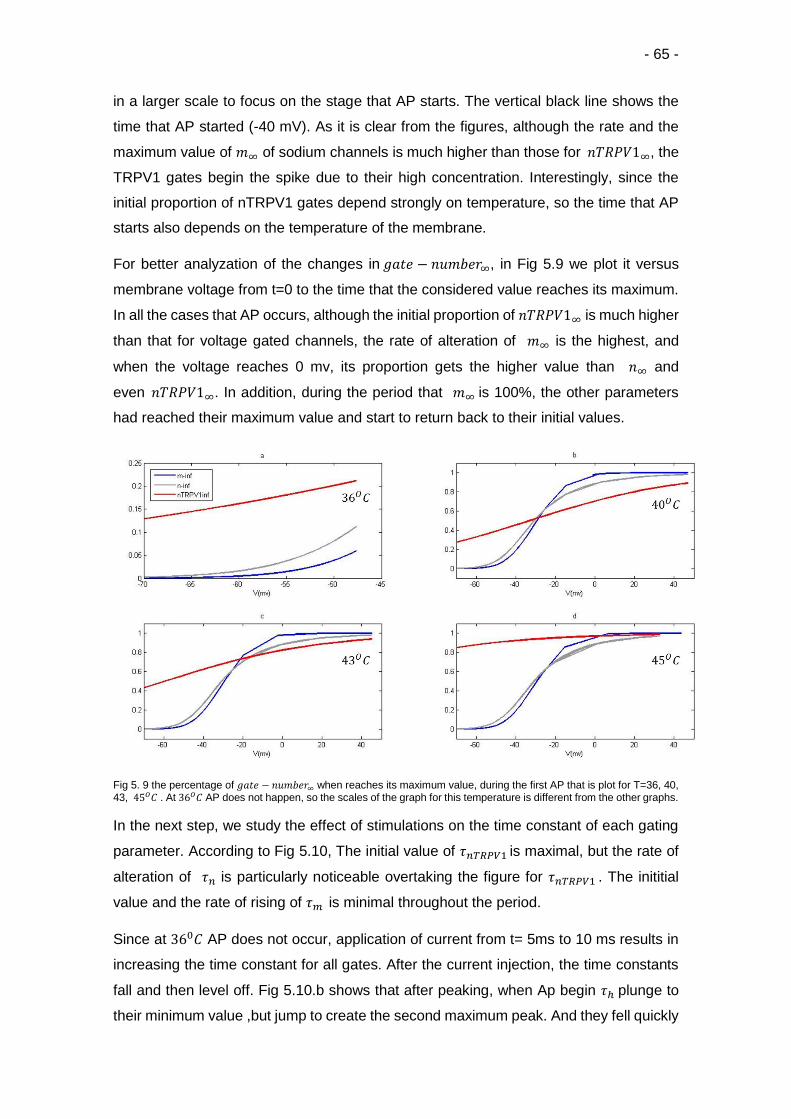
- 65 -
in a larger scale to focus on the stage that AP starts. The vertical black line shows the
time that AP started (-40 mV). As it is clear from the figures, although the rate and the
maximum value of 𝑚∞ of sodium channels is much higher than those for 𝑛𝑇𝑅𝑃𝑉1∞, the
TRPV1 gates begin the spike due to their high concentration. Interestingly, since the
initial proportion of nTRPV1 gates depend strongly on temperature, so the time that AP
starts also depends on the temperature of the membrane.
For better analyzation of the changes in 𝑔𝑎𝑡𝑒 − 𝑛𝑢𝑚𝑏𝑒𝑟∞, in Fig 5.9 we plot it versus
membrane voltage from t=0 to the time that the considered value reaches its maximum.
In all the cases that AP occurs, although the initial proportion of 𝑛𝑇𝑅𝑃𝑉1∞ is much higher
than that for voltage gated channels, the rate of alteration of 𝑚∞ is the highest, and
when the voltage reaches 0 mv, its proportion gets the higher value than 𝑛∞ and
even 𝑛𝑇𝑅𝑃𝑉1∞. In addition, during the period that 𝑚∞ is 100%, the other parameters
had reached their maximum value and start to return back to their initial values.
Fig 5. 9 the percentage of 𝑔𝑎𝑡𝑒 − 𝑛𝑢𝑚𝑏𝑒𝑟∞ when reaches its maximum value, during the first AP that is plot for T=36, 40, 43, 45𝑂𝐶 . At 36𝑂𝐶 AP does not happen, so the scales of the graph for this temperature is different from the other graphs.
In the next step, we study the effect of stimulations on the time constant of each gating
parameter. According to Fig 5.10, The initial value of 𝜏𝑛𝑇𝑅𝑃𝑉1 is maximal, but the rate of
alteration of 𝜏𝑛 is particularly noticeable overtaking the figure for 𝜏𝑛𝑇𝑅𝑃𝑉1 . The inititial
value and the rate of rising of 𝜏𝑚 is minimal throughout the period.
Since at 360𝐶 AP does not occur, application of current from t= 5ms to 10 ms results in
increasing the time constant for all gates. After the current injection, the time constants
fall and then level off. Fig 5.10.b shows that after peaking, when Ap begin 𝜏ℎ plunge to
their minimum value ,but jump to create the second maximum peak. And they fell quickly

- 66 -
and then slightly recover. This trend is repeated whenever an AP happens throughout
the period in all temperatures albeit to widely varying degrees. The time constant for h
gates of sodium channels see a dramatic changing trend and the figure of 𝜏𝑚 remained
the smallest over the simulation period. Despite a minimum peak in the figure for 𝜏𝑛𝑇𝑅𝑃𝑉1,
the graph does not show a significant rising trend for this parameter. 𝜏𝑛 show similar
trend but with a noticeable gap with 𝜏𝑛𝑇𝑅𝑃𝑉1 figure.
Fig 5. 10 the time constant for m, h,n and nTRPV1 gates in different temperature.
The last parameter we evaluate is the gating number m,h for 𝑁𝑎𝑉, n for 𝑘𝑉, mCa and
hCa for 𝐶𝑎𝑉 and nTRPV1 for TRPV1 channels. Fig 5.11 shows that m gates of sodium
channels have the maximum percentage and duration among other gates. Graph for
activation of mCa gates is almost similar with m gats. However, it takes longer time for
mCa gates to inactivate. The rate and proportion of activation of gates is smaller for n
gates, but the ending tail is much longer than the other voltage gated channels. Finally,
the proportion and the rate of TRPV1 gates is the lowest among the other channels. In
the right side, the graphs for h and hCa gates is illustrated. Although the proportion of
hCa is minimal in all considered time, the rate of function of h gates is much higher.

- 67 -
Fig 5. 11 the proportion of m and h gates of 𝑁𝑎𝑉 , n gates of 𝑘𝑉 , mCa and hCa gates of 𝐶𝑎𝑉 and nTRPV1 gates at 40𝑂𝐶 during the stimulation of the soma.
Result 4: Threshold values
In this section, we study the effect of TRPV1 channels on the minimum current required
to produce AP. Fig 5.12 shows that in the condition we insert only voltage gated channel
models in our simulation, when we inject 0.7 nA current with 5 ms duration, no spike is
produced. However, this amount of current can produce an AP when we insert TRPV1
model to the program construction. In addition, for temperatures higher than 55𝑂𝐶 the
graph show an irregular v-t trend when only 𝑁𝑎𝑉 , 𝐾𝑉 𝑎𝑛𝑑 𝐶𝑎𝑉 channels are distributed on
soma. We will discuss the role of TRPV1 channels on V-t graphs at this temperature
range in this section.
Fig 5. 12a) Voltage-time graph for the condition that only voltage gated Na, K and Ca channels are considered (in blue)
and the condition that TRPV1 model is added to the simulation program(in red). B) Voltage –time graph at 55𝑂𝐶 for the case that TRPV1 channels are not considered.
measurements. As it is clear from the figure, at room temperatures, TRPV1
channels do not show reaction to electrical stimulations, However as the
temperature increases, the role of TRPV1 gates become more notable(Fig 5.13.a). For
the temperatures higher than 43𝑂𝐶, alteration of temperature is more effective than

- 68 -
the injection of current in producing spikes and further for T>45𝑂𝐶 contribution of
temperature is dominated and application of current does not affect significantly in
the process of generation of first AP.
Fig 5. 13 the amplitude of threshold current at different temperatures for blue)NaV , KV and CaV, red) NaV , KV and CaV and TRPV1 gatings.
Since the role of temperature at T>43𝑂𝐶 is more important than in low temperatures, we
focus on the behavior of considered channels at this range. At low temperatures, only
one or two spikes appear during and after the application of current. However, when the
temperature reaches 43𝑂𝐶 or higher values, series of APs happen that the time and
type of spikes depend on the current amplitude. In these conditions, application of
negative currents also generates APs. Nevertheless, this process continues until the
temperature reaches 51𝑂𝐶. At larger temperatures, spikes are not be produced any
more. In Fig 5.12.a , the plot of V-t graph at 55𝑂𝐶 is shown as an example.
Result 5: Series of APs
We measure the time, type and voltage of APs produced from 43𝑂𝐶 to 51𝑂𝐶 in the
condition that current with -2, -1.5, -1, 0, 0.5 and 1 nA amplitude and 5 ms duration is
injected and study the results from t=0 to t=30 ms. The initial setting is the same with our
previous simulation that is illustrated in Fig 5.1.
Fig 5.14 shows the changes of the membrane voltage with time when currents with
negative, zero and positive amplitude of -1.5, 0 and 0.5 nA is injected. The figure includes
the simulations at 44, 48 and 51𝑂𝐶. We analyze compare the results in three stages: from
t= 0 to 5 ms that the current is not injected yet, the period that the current is applied, i .e
from 5 to 10 ms and the period after the stimulation from t=10 to 30ms. Although the

- 69 -
peaks are continued to be recorded after this time, they do not happen in the real soma
because the related changes are effective maximum for 20 ms after the stimulation.
Fig 5. 14 membrane voltage versus time at T= 44, 48, 51𝑂𝐶 when current with I= -1.5, 0 and 0.5 nA amplitude is applied from t= 5 to 10 ms.
From t = 0 to 5 ms we do not see any spike from 43 to 46𝑂𝐶 even when the amount of
current is increased. However, due to alteration of temperature, one spike is produced
from T= 47 to 50OC. Until this temperature, the AP happens few seconds earlier as we
increase the temperature, but it does not change by current. At 51OC , the number of
spikes increase to two. In fact the spikes that happen in this time interval are survived
from the current applied to the membrane at 5 ms. In the case that we do not inject any
current to the membrane ( I= 0 nA) spikes with the same delay and rate happens. Fig
514.b,e and h show the condition that the spikes are produced as the result of high
membrane temperature. As it is clear from the graphs, the height and the frequency of
APs at each temperature remains constant and interestingly increases by temperature.
In the next section, we will compare the firing rates at different temperatures.
Induction of current cause perturbations in the trend of spikes. When negative current
is applied to the membrane( Fig 5.14.a, d, g) the membrane potential starts to decrease
until the end of the stimulation at 10 ms. Since the voltage decreases, no AP happens in
this condition. In the case we inject positive current, at low temperatures, the firing rate
increases, thus there is not enough time for complete outflow of the positive ions from
cell. Therefore, the next spike starts in the condition that there is a small amount of

- 70 -
unflawed ion inside the cell( voltage is higher than the rest potential) , additionally, the
difference between the peak value and the voltage before the event gets smaller. The
vertical axis shows the changes of the voltage on the membrane, therefore the height of
the events decreases by time.
After the stimulation, from t= 10 ms to 30 ms, the membrane recovers and the trend of
spike becomes normal. Although the firing rate in this condition is the same with no-
current condition, the time of APs change insignificantly.
Firing rate (spike/total time) versus temperature is illustrated in Fig 5.15. Total time in
this case is 30 ms and no current is injected. According to this graph, as the temperature
rises, the frequency of AP generation increases. It is important to note that either positive
or negative current is applied; the firing rate is the same. In other words, firing rate
depends on temperature and is independent of injected current.
Fig 5. 15 firing rate of APs versus temperature. The total time of simulation is 30 ms

- 71 -
Chapter 6
A mathematical model for ionic channels
One of the recent challenges in neuroscience is to find out how nervous system
discriminate different stimulations. A number of quantitive models have been proposed
for mechanism of voltage gated channels which are also exhibit high temperature
sensitivity. However, the mechanism underlying the temperature sensory of Transient
Receptor potential (TRP) channels is still unknown. We expanded the Hodgkin and
Huxley model by entering an additional term for mechanism of TRPV1 channels. In this
model, we investigate transition state theory for a two state process for both voltage
gated and temperature gated channels. This study offers a physical point of view for the
evaluations with chemistry and biology perspectives. We suggest that using the basic
roles of thermodynamics we can present a unified expression for voltage and
temperature sensitivity of considered channels. This expression therefore can solve the
problems related to the explanations for temperature sensitivity (𝑄10) for voltage gated
channels. However, experimental measurements are required to determine the precise
value of the parameters used in the model.
Theory and Facts
This paper suggests considering the process of channel gating with physical and
thermodynamical framework.
The gate opens when a selective ion provides a specific amount of energy rate range.
Several thermodynamical facts are considered to build up the model:
1. Each type of channel requires specific amount of energy in a specific time interval
(specific energy rate) for gating.
2. If ion provide the required amount of energy rate, it can open the barrier.
3. Physical stimulation input is considered as a specific amount of energy given to
the system in a specific period.
4. Since all the stimulation methods result in changing the membrane potential, we
relate all the physical inputs to voltage. This is possible by Gibbs energy equation,
because Voltage and other types of stimulations transfer the required energy by
changing the entropy and enthalpy of the channel system.

- 72 -
New Model
For the two sate model and in constant pressure and acidity the parameters related to
gating of voltage gated channels and TRPV1 is:
𝐼 = ∑𝐼𝑐ℎ𝑎𝑛𝑛𝑒𝑙 (6.1)
𝐼𝑐ℎ𝑎𝑛𝑛𝑒𝑙 = 𝑃𝑋𝑧𝑋𝐹. 𝜈.[𝑋]𝑖𝑛 − [𝑋]𝑜𝑢𝑡𝑒
−𝜈
1 − 𝑒−𝜈 , 𝜈 =
∆𝐶𝑃(𝑇 − 𝑇0)
𝑅𝑇+𝑧𝑋𝐹𝑉
𝑅𝑇−∆𝐶𝑃𝑅ln (
𝑇
𝑇0) (6.2)
For a simple two state model (𝑜𝑝𝑒𝑛 𝛽(𝑉,𝑇)⇔ 𝑐𝑙𝑜𝑠𝑒) the activation and deactivation rates are:
𝛼 = 𝑘0 exp (−∆𝐶𝑃(𝑇 − 𝑇0)
𝑅𝑇−𝛿𝑧𝐹𝑉
𝑅𝑇+∆𝐶𝑃𝑅ln (
𝑇
𝑇0) ) (6.3)
𝛽 = 𝑘0 exp (∆𝐶𝑃(𝑇 − 𝑇0)
𝑅𝑇+(1 − 𝛿)𝑧𝐹𝑉
𝑅𝑇−∆𝐶𝑃
𝑅ln (
𝑇
𝑇0) ) (6.4)
𝑘0 = exp (−∆𝐻0𝑅𝑇
+∆𝑆0𝑅)
That 𝑘0 is the frequency factor, ∆𝐻0 and ∆𝑆0 are the initial enthalpy and entropy and 𝛿 is the
fraction of ions that pass through the channel. The time constant is
𝜏 =𝑃𝑜𝑝𝑒𝑛
𝛼 (6.5)
And
𝑃𝑜𝑝𝑒𝑛 =1
1 + exp (−1 × (∆𝐻𝑅𝑇−∆𝑆𝑅)) (6.6)
=1
1 + exp [(−∆𝐻0𝑅𝑇
−∆𝐶𝑃(𝑇 − 𝑇0)
𝑅𝑇−𝑧𝐹𝑉𝑅𝑇
+∆𝑆0𝑅+∆𝐶𝑃𝑅ln (
𝑇𝑇0) )]
(6.7)
𝐼𝑐ℎ𝑎𝑛𝑛𝑒𝑙 :current of ion X through channel
𝑃𝑋 : permeability of ion X
𝑧𝑋 : valency of ion X

- 73 -
F : Faraday constant
[𝑋]𝑜𝑢𝑡 : concentration of the ion outside
[𝑋]𝑖𝑛 : concentration of the ion inside
𝐶𝑃 : heat capacity of the channel at constant pressure
T : absolute temperature
𝑇0 : an arbitrary reference temperature
R :universal gas constant
𝐻 : enthalpy of system
S : entropy of the system
∆𝐻0 : enthalpy at 𝑇0
∆𝑆0 : entropy at 𝑇0
𝛿 : fraction of z moves outward direction
Calculations
Transition state theory is one of the methods that can be applied to express the reaction
of ionic channels to voltage and temperature [18]. It describes the required work to
activate/inactivate a channel. It describes the activation energy of the channel as Gibbs
energy. Gibbs energy is sum of changes in enthalpy(H) and entropy(S) terms of a
system. (∆𝐺(𝑃, 𝑇) = ∆𝐻 − 𝑇∆𝑆).
Considering transition state theory in combination with the first and second
thermodynamic roles, each channel can be considered as an energy barrier. The
correlation of the activation probability and the required gating energy is described by
Van’t Hoff equation [87-89].
𝑃𝑔𝑎𝑡𝑖𝑛𝑔 =𝐾
1 + 𝐾 (6.8)
𝑙𝑛𝐾 =∆𝐺
−𝑅𝑇 (6.9)

- 74 -
Here k is the equilibrium constant, 𝑃𝑔𝑎𝑡𝑖𝑛𝑔 is the gating probability ∆𝐺 is the Gibbs energy
R is the universal gas constant (8.31 J. 𝑚𝑜𝑙𝑒−1𝐾−1) and T is absolute temperature
(Kelvin).
Changes in enthalpy and entropy of the system depends on temperature [90-92].
Considering a molar heat capacity for a channel, contribution of temperature on K can
be determined by [53]:
lnK = −∆𝐻0 + ∆𝐶𝑃(𝑇 − 𝑇0)
𝑅𝑇+∆𝑆0 + ∆𝐶𝑃 × ln (
𝑇𝑇0)
𝑅 (6.10)
Where ∆𝐻0 is enthalpy at a reference temperature ( 𝑇0), ∆𝑆0 is entropy at 𝑇0 and ∆𝐶𝑃 is
the temperature-independent heat capacity of the barrier at fixed pressure [93].
On the other hand, Voets et. al offer an expression for involvement of voltage in activation
of TRPV1 channels [4]
𝑙𝑛𝑃𝑜𝑝𝑒𝑛 = −𝐸𝑎,𝑜𝑝𝑒𝑛
𝑅𝑇+∆𝑆
𝑅+𝛿𝑧𝐹𝑉
𝑅𝑇 (6.11)
That z is the effective charge associated with voltage dependent gating, 𝛿 is the fraction
of z moves outward direction, V is the membrane potential and 𝐸𝑎,𝑜𝑝𝑒𝑛 is the activation
energy [20,87]. The effect of temperature is involved in 𝐸𝑎,𝑜𝑝𝑒𝑛. Eq (6.11) separates the
effect of voltage from other parameters in channel activation. So, we conclude that using
the term (𝛿𝑧𝐹𝑉
𝑅𝑇) will help us to get V-independent expression for temperature contribution.
Therefore, if we use Eq(6.10) to explain the effect of T on 𝐸𝑎,𝑜𝑝𝑒𝑛 ,the heat capacity
∆𝐶𝑃 will be voltage-independent.
Using Eq 6.10 to describe the contribution of temperature parameter in Eq 6.11 we have:
𝑙𝑛𝑃𝑜𝑝𝑒𝑛 = −∆𝐻0𝑅𝑇
−∆𝐶𝑃(𝑇 − 𝑇0)
𝑅𝑇−𝑧𝛿𝐹𝑉
𝑅𝑇+∆𝑆0𝑅+∆𝐶𝑃𝑅ln (
𝑇
𝑇0) (6.12)
We can write Eq 6.12 in the form of:
lnk/𝑘0 = −∆𝐺0𝑅𝑇
−∆𝐶𝑃(𝑇 − 𝑇0)
𝑅𝑇−𝑧𝐹𝑉
𝑅𝑇+∆𝐶𝑃𝑅ln (
𝑇
𝑇0) (6.13)
for simplicity in our calculations;

- 75 -
𝜈 =∆𝐶𝑃(𝑇− 𝑇0)
𝑅𝑇+𝑧𝐹𝑉
𝑅𝑇−∆𝐶𝑃𝑅ln(
𝑇
𝑇0) (6.14)
This expression is used to extend the GHK equation. We consider that the concentration
of ion X at any binding site is large, therefore, its movement is independent. The electrical
distance of the barrier is denoted by 𝜆.
We assume that channel includes n barriers with electrical distance of 𝜆.The flux across
the jth barrier is proportional to 𝑐𝑗−1. So the flux over the jth barrier is assumed to be:
𝐽𝑗 = 𝜆( 𝑘𝑗−1𝑐𝑗−1 − 𝑘−𝑗𝑐𝑗) (6.15)
The total flux is the sum of fluxes across all the barriers:
𝐽 =𝜆𝑘0 (𝑐0 − 𝑐𝑛
𝑘−1…𝑘−𝑛𝑘0…𝑘𝑛−1
)
1 +𝑘−1𝑘1+𝑘−1𝑘−2𝑘1𝑘2
+⋯+𝑘−1…𝑘−(𝑛−1)𝑘1…𝑘𝑛−1
(6.15)
We consider 𝑛 → ∞ and there is no barrier height difference through the membrane:
𝐽 =𝐷𝑋𝐿. 𝜈.𝑐0 − 𝑐𝑛𝑒
−𝜈
1 − 𝑒−𝜈 (6.16)
Here 𝐷𝑋 is the diffusion coefficient (𝐷𝑋 = 𝑘0(𝑉=0,𝑇=𝑇0)𝜆2) over the membrane in the
absence of electric or thermal induction and L is the width of the membrane.
In conclusion, for voltage sensitive and some channel types of TRP family, the flux of ion
X can be explained by:
𝐽 = 𝑃𝑋. 𝜈.[𝑋]𝑖𝑛 − [𝑋]𝑜𝑢𝑡𝑒
−𝜈
1 − 𝑒−𝜈 (6.17)
That is very similar with the GHK equation explained by Goldman-Hodgkin-Katz, but the
value of 𝜈 is determined by taking account the effect of temperature on the enthalpy and
entropy of the system.
Therefore the current is:
𝐼 = 𝑃𝑋𝑧𝑋𝐹. 𝜈.[𝑋]𝑖𝑛 − [𝑋]𝑜𝑢𝑡𝑒
−𝜈
1 − 𝑒−𝜈 , 𝜈 =
∆𝐶𝑃(𝑇 − 𝑇0)
𝑅𝑇+𝑧𝐹𝑉
𝑅𝑇−∆𝐶𝑃𝑅ln (
𝑇
𝑇0) (6.18)
With time constant:

- 76 -
𝜏 =𝑃𝑜𝑝𝑒𝑛
𝛼 (6.19)
And activation and deactivation rates[20,87]:
𝛼 = exp (−∆𝐻0𝑅𝑇
−∆𝐶𝑃(𝑇 − 𝑇0)
𝑅𝑇−𝛿𝑧𝐹𝑉
𝑅𝑇+∆𝑆0𝑅+∆𝐶𝑃𝑅𝑙𝑛 (
𝑇
𝑇0) ) (6.20)
𝛽 = exp (∆𝐻0𝑅𝑇
+∆𝐶𝑃(𝑇 − 𝑇0)
𝑅𝑇+(1 − 𝛿)𝑧𝐹𝑉
𝑅𝑇+∆𝑆0𝑅−∆𝐶𝑃𝑅ln (
𝑇
𝑇0) ) (6.21)
That 𝑘0 is the frequency factor, ∆𝐻0 and ∆𝑆0 are the initial enthalpy and entropy and 𝛿 is
the fraction of ions that pass through the channel.
Eq (6.11) is similar to the relation used to describe the dependence of the voltage gated
channels. In V-gated channels, changing the membrane potential leads the movement
of channel protein and changing the state of the channel. Here, we focus on the work
that electric energy consumes to activate the voltage gated channels:
𝑙𝑛𝑃𝑜𝑝𝑒𝑛 = −
𝑧𝐹 (𝑉 − 𝑉12)
𝑅𝑇 (6.22)
Where 𝑉12
is the half activate voltage (𝑉12
=∆𝐺𝑉=0
𝑧𝐹 ) [3,4] that includes the contribution of
temperature dependency of voltage gated channels. Using Transition state theory and
Eyring equation we can correlate the temperature changes to thermodynamic of the
system [33,35]. Nevertheless, it does not describe the dependence of transition state
theory to membrane voltage. A number of researches have done to produce an
explanation for the contribution of voltage on the enthalpy and entropy of the system
[33,94,95]. Using transition state theory parameters, the voltage dependence of 𝑁𝑎𝑉
channels[96-99], 𝐶𝑎𝑉 channels[96,100-103], 𝑘𝑉 channels [94,97,102,104-109] and other
types of voltage gated channels is described.
Since we consider the channel as an energy barrier, we can use Eq 6.10 to express the
contribution of temperature on gating probability. Therefore, Eq 6.12 can be used also
for voltage gated channels.

- 77 -
Conditions
This model uses basic physics roles. The concept is simple: How much energy does an
ion need to open the barrier. Since we can consider all types of the channels as gating
barrier(s), it is possible to use this model for mathematical explanation of any channel
dynamics. Each physical stimuli such as changing the pressure or PH or exposure of
radiation, changes the enthalpy and entropy of the system. Since, the opening probability
of the channel is related to the Gibbs energy, it is possible to calculate theoretically the
effect of each physical input on the opening probability of a channel.
In channels that sensations happen by phase transition of lipid membrane or
conformational transition of the channel protein structures, these phenomenon change
the enthalpy and entropy of the system. Therefore, these gating processes also can be
studied by our model by calculating the energy required for an ion to provide the
conformation or transition energy to open the barrier.
Presentation of the model for TRPV1 and voltage gated sodium and potassium channels
is only an example for application of this model. In our calculations for TRPV1, we only
considered the variation of two inputs: voltage and temperature. However, it is possible
to measure the effect of other stimulus.
Some types of channels such as TRPV1, are multiple gating channels. This model can
offer expression for two conditions. First, the simplest expression is to present an overall
estimation in energy, enthalpy and entropy of all barriers in a single channel. In this case
two state of open-close system is considered. The second case is finding the changes
in Gibbs energy over each barrier in a single channel. Since first and second roles of
thermodynamic is universal, the explanations for both cases is correct theoretically.
Model for TRPV1 and voltage gated sodium and potassium channels
TRPV1 is a type of TRP channels, which play important role in mammalian senses.
TRPV1 channels are mainly expressed in small-diameter primary afferent neurons. They
respond to many unpleased or harmful stimuli such as heat changing (t≥ 43𝑜𝐶)[47], low
PH(<6) and also are activated by capsaicin[34,36,46,58,110]. The duration of AP
caused by TRPV1 channels is about 100 times larger than the wide AP generated by
voltage gated sodium channels. In ischemia and inflammation acidification increases, it
is suggested that in this conditions, the temperature-threshold activation of TRPV1

- 78 -
decreases and AP occurs [111,112]. TRPV1s are permeable to𝑁𝑎+ ,𝑀𝑔+ and mainly
to 𝐶𝑎2+ ions (𝑃𝐶𝑎
𝑃𝑁𝑎= 10 𝑎𝑛𝑑
𝑃𝑀𝑔
𝑃𝑁𝑎= 5) [36, 58]
TRPV1 is also sensitive to changes in membrane potential [20,113,114].Having similar
topology with voltage gated channels, including (S1-S6)segments and reentrant pore
loop between S5 and S6, TRPs are less sensitive to voltage because of the lack of a
charged S4 segment[115].
The temperature sensitivity of the TRPV1 channels is a thermodynamic process and
does not associated with the temperature –dependent phase transition of the channel
protein structure [4]. Therefore, to explore the mechanism of this process, it is desirable
to consider some basic thermodynamic roles [116]. Although experiments on gating
mechanism of a single TRPV1 channel recorded multiple open and closed sates[89] for
simplicity, we consider two state model for a voltage gated channel with correlated
opening and closing rates 𝛼 𝑎𝑛𝑑 𝛽 respectively [20,87].
On the other hand, voltage dependency of the voltage gated channels can be expressed
by thermodynamic roles. According to these explanations, the voltage course of
considered functions has exponential forms. The temperature dependence of the
considered functions is described by 𝑄10 parameter, which is a nominal function.
However, experimental results showed that using this parameter, some unignorabl errors
happen in describing the processes. Controlling the temperature dependence by
thermodynamical expressions links the activation energy and𝑄10.
Since fitting the processes to the most principled functions is likely to minimize errors, it
is desirable to base the form of voltage gated and temperature gated functions as much
as possible on the thermodynamic theories [94].
We plot the changes in the opening probability due to changes of T or V for TRPs ad
voltage gated 𝑁𝑎𝑉 and 𝐾𝑉 channels and compare the effect of considered parameters
on them.
For 𝑁𝑎𝑉 and 𝐾𝑉 channels 𝑄10 ≈ 3 [5] and for TRP channels 𝑄10 ≈ 20 [53].we set 𝑇0 to
273 + 25𝑜𝐶 = 298 𝐾 , rest potential to -70 mV.
We can estimate the heat capacity for 𝑁𝑎𝑉 and 𝐾𝑉 channels using eq (6.13). We ignore
the voltage dependent term (−𝑧𝐹V
𝑅𝑇) and use the approximation for the logarithmic term
(ln (𝑇
𝑇0) ≈ 1 −
𝑇0
𝑇+ (
𝑇0
𝑇)2) we have:

- 79 -
𝑙𝑛𝑃𝑜𝑝𝑒𝑛 = 𝑙𝑛𝑃𝑖,𝑜𝑝𝑒𝑛 −∆𝐶𝑃𝑅(1 −
𝑇0𝑇) +∆𝐶𝑃𝑅(1 −
𝑇0𝑇+ (𝑇0𝑇)2) (6.23)
𝑙𝑛𝑘0 is the sum of initial entropy and enthalpy terms.
ln (𝑃𝑜𝑝𝑒𝑛
𝑃𝑖,𝑜𝑝𝑒𝑛) =
∆𝐶𝑃𝑅(𝑇0𝑇)2 (6.24)
𝑄10 is the ratio (𝑃𝑜𝑝𝑒𝑛
𝑃𝑖,𝑜𝑝𝑒𝑛). Therefore it is possible to calculate ∆𝐶𝑃 from 𝑄10 :
Ln (𝑄10) = ∆𝐶𝑃
𝑅(𝑇0
𝑇0+10)2 (6.25)
A typical value for this ratio for 𝑁𝑎𝑉 and 𝐾𝑉 is 3.8 [5] but Hodgkin et al. (1952) recorded
the value to be 3.and T=𝑇0 + 10. According to Rosen [117], the value for 𝑄10 is different
for sodium channels in 23-28𝑜𝐶 and in 29-37𝑜𝐶. For the membrane voltage of -70 mV
and in the temperature interval of 29-37𝑜𝐶 the value for 𝑄10 equals to about 3.8.
So for voltage gated sodium and potassium channels at 𝑇0 = 250𝐶 the heat capacity
is ∆𝐶𝑃 ≈ 250 (𝑐𝑎𝑙
𝑚𝑜𝑙.𝐾) ∗ 4.184 × 10⁶(
𝑚𝐽
𝑐𝑎𝑙) that is about 1/8 of TRP heat capacitance. The
effective charge of sodium channels is about 6[118,119].
Eq (6.13) enables us to compare the reaction of voltage gated and TRP channels to
thermal and electrical stimulation. To study the effect of temperature, we first consider
that stimulation occurs only by changing the membrane temperature and not the voltage.
Fig 6.1 compares the kinetics of 𝑁𝑎𝑉 , 𝐾𝑉 and TRP channels under thermal stimulation.
It can be seen that the activation probability in all cases increased, but activation
probability for TRPV1 remained at higher rate throughout the stimulation period.
Contribution of temperature in activation probability of 𝑁𝑎𝑉 , 𝐾𝑉 is similar because their
heat capacities are considered to have ignorable difference. At the room temperature,
the activation probability of voltage gated channels is not considerable, but it increases
continuously as the temperature reaches higher values. Although according to Eq (6.13),
the rates for TRP and voltage gated channels follow similar pattern, the probability of
activation increased quite sharply from about 8 at T=273 K to about 35 at 393 K. This is
because the heat capacity of TRPs are assumed to be 8 times larger than voltage gated
channels. Thus, they are more sensitive to the changes in the temperature of the
membrane.

- 80 -
Fig 6. 1 contribution of temperature (in Kelvin) in the changes in activation probability of temperature sensitive TRP and
voltage gated 𝑁𝑎𝑉 and 𝐾𝑉 channels.
Voltage is the other parameter that is considered to affect the kinetics of voltage gated
and TRP channels. Fig 6.2 compares the activation probability of 𝑁𝑎𝑉 , 𝐾𝑉 and TRP
channels at constant temperature. It can be seen that the value of activation probability
in all three cases is currently declining as the membrane voltage is increasing. Overall,
the activation probability of sodium channels is far higher than that for the remaining
channels (Fig 6.2.b) so the correlated graphs coincide each other. This is because the
effective charge of the sodium channels is assumed to be around 6, which is 3 and 12
times higher than that for potassium and TRPs respectively.
When we increase the temperature, in fact, we provide a fraction of energy required to
come over the barrier energy, the rest of the energy will be provided by electric energy.
As the temperature increases, less amount of voltage is needed for ion to pass through
a channel. Since each channel requires smaller amount of energy to activate in higher
temperatures, the injected electric energy is consumed to activate larger number of
channels. This is the reason that the rate of activation is larger in higher temperatures.
Fig 6. 2 The activation probability of 𝑁𝑎𝑉 , 𝐾𝑉 and TRP channels are compared. A) the logarithmic graph lines for the activation probability of the considered channels. B) The activation probability of sodium channels is much higher in the negative membrane potentials. C) comparison between the activation probability of 𝐾𝑉 and TRP channels

- 81 -
Chapter 7
Conclusions & Discussion
The purpose of this research is to develop methods for measuring the parameters
contribute to generate signals when nano-labeled neuron is heated under exposition of
magnetic field. We provide mathematical and computational analyses to measure the
contribution of voltage gated and TRPV1 channels in the generation of AP.
Conclusions
In this study, we evaluated the involvement of temperature on dynamics of voltage gated
and Temperature Resistor Potential, member V, number1 (TRPV1) channels. To
approach this goal, we used NEURON software that is one of the important programing
environments for simulations of nervous system behavior. This software is used in
several important neuroscience studies such as Human Brain Project (HBP).
In our simulations, first, voltage gated potassium and sodium channels are distributed on
a single soma by inserting Hodgkin and Huxley (hh2) model for mammalian. Behavior of
these channels under electrical stimulations (using IClamp and VClamp stimulation
techniques) is studied at various membrane temperatures. Results show that alteration
of temperature increases the rate of channels dynamic. Notably the pattern of changes
in potassium gate number at 43𝑂𝐶 (the temperature that TRPV1 channels produce AP)
is significantly different from the patterns generated in other temperatures.
Secondly, we used the expression suggested by Voets et .al explaining the effect of
voltage on temperature sensitive TRPV1 channels [4] to construct a computational model
for voltage sensitivity of TRPV1s in NEURON environment. We simulated the APs
produced at different temperatures by 𝑁𝑎𝑉 , 𝑘𝑉 ,𝐶𝑎𝑉 and TRPV1 channels and compare
with simulations when only voltage gated channels are inserted. Results show that
existence of TRPV1 channels leads generation of a spike that does not occur in the case
that only voltage gated channels are inserted. According to these results, firing rate
increases with temperature, but the spikes width does not change significantly. In
addition, only in the range of temperature between 43 to 52𝑜𝐶, high temperature causes
spike(s), even without electrical stimulation.
Since magnetic stimulation of neurons is effective only when it is converted to thermal
energy by magnetic nano particles, the most important issue in this type of stimulation is

- 82 -
the involvement of temperature on behavior of membrane channels. Therefore, the
information of these simulations can be used to define the magnetic stimulation protocol,
by providing insights. For example, it is possible to measure the effect of
temperature(and thus the effect of magnetic field) on duration, current threshold, gating
numbers etc. by our analyses.
Finally, this thesis proposed a mathematical model to express the effect of arbitrary
inputs on gating of ionic channels. We used basic thermodynamic rules to express
channel behavior. According to the transition state theory, the channel is considered as
a single or a number of barriers. In the case that a selective ion provides the required
energy, the channel activates and ion passes through the gate. The amount of this
energy- that is described as Gibbs energy- is specific for each type of ionic channel and
is dependent on environment condition. It includes the contribution of enthalpy and
entropy on the system of the channel and its environment. As the physical stimulations
change the entropy and/or enthalpy of the system, it is possible to calculate their effect
on gating dynamics by this expression.
This model suggests a single expression for effect of different inputs on different types
of channels. We applied this model on TRPV1 and voltage gated channels to compare
the effect of temperature and voltage on them. Results show that in voltage-gated
channels, the dependence of Gibbs energy on voltage is larger than the temperature.
Thus, they are affected highly by electrical stimulations. However, in TRPV1 channels,
the barrier energy depends strongly on the temperature than the voltage; therefore,
thermal energy is more effective on their behavior.
Investigation of this model will enable the scientists to study and discover the effect of
changes in environment on nervous system.

- 83 -
Discussion
The goal of this study is to evaluate the neuronal processes occur in the magnetic
stimulation of the nano—labeled neurons. Since for effective stimulation, magnetic
energy is converted to thermal energy by the labeled nanoparticles, the most important
parameter contributed in this type of stimulation is temperature.
Experimental records show that magnetic stimulation results in an action potential at
temperature range of 40-43𝑜𝐶 that is the range that TRPV1 channels are activated. To
find the contribution of TRPV1 channels in gating processes, we provided a programming
model using NEURON environment. With this model, it is possible for the scientists to
measure the contribution of TRPV1 channels in different signaling processes.
The neural modeling approach proposed evaluates the function of TRPV1 channels
under electrical stimulations at different membrane temperatures. This model is the first
construction used to simulate the ionic flux through TRPV1 channels. Using this new
model, it is possible to design several simulations to study the effect of temperature on
the function of TRPV1 channels under electrical stimulation. However, other channels
may also involve in signaling process that can affect the rate, period etc. Therefore, we
also analyzed the behavior of voltage gated 𝑁𝑎𝑉 , 𝑘𝑉 𝑎𝑛𝑑 𝐶𝑎𝑉 channels and compared
signaling condition when the TRPV1 channels are distributed in the membrane.
Our TRPV1 model describe these channel function under electrical stimulation at
different fixed temperatures. Nevertheless, it does not describe the gating process of
TRPV1 channels when the membrane temperature changes (without involving electrical
stimulation). The new mathematical model that we suggested for the contribution of
temperature on opening probability of channels enables us to calculate the effect of
heating phenomenon.
In the ne, thermodynamic model, mathematical expressions are proposed for the first
time to measure the ionic flux generated by heating the membrane. In addition, this
expression explains the effect of temperature and voltage on the ionic flux through
voltage gated and temperature sensitive TRPV1 channels. This means that using this
formula, it is possible to construct devices to stimulate and treat the nervous system by
temperature. In addition, this expression can be important for devices used for electrical
stimulation therapies, in the context of deep brain stimulation or pain.

- 84 -
Further research
The following list presents a compilation of ideas, and future directions that would be
very interesting to pursue,and can benefit from the work developed in this thesis:
1. This research evaluates the effect of physical inputs on the function of voltage gated
and TRPV1 channels on a single soma. Further study is required to measure the
propagation of the spikes throughout a neuron or a number of neurons.
2. COMSOL software could be used to simulate the thermal stimulation condition in 2-
D scale. We consider the soma as a cylinder and the nano particles as small heating
sources. A dense distribution of nano particles in one side of cell results in
temperature difference in different soma parts.
3. The simulations designed in this thesis by NEURON software can also be studied
experimentally.
4. Since the mathematical model is constructed theoretically by considering a heat
capacity for the channel, several experiments are required to find the value for related
parameters. Experimental data about TRPV1 channels was recorded only for a fixed
initial temperature and was not changed during the electrical stimulations. In some
other experiments that thermal stimulation causes TRPV1 impulses, the parameters
required to indicate in our model was not measured or the difference between the
values of a parameter were high because of different environmental condition of
TRPV1 channels.
5. It is possible to use the computational model introduced in this study to explore
possible therapeutic strategies to address diseases and pathologies such as pain,
Parkinson, among other neurological diseases.

- 85 -
References
1. Huang, H., et al., Remote control of ion channels and neurons through magnetic-field heating of
nanoparticles. Nat Nanotechnol, 2010. 5(8): p. 602-6.
2. Hodgkin, A.L. and A.F. Huxley, A quantitative description of membrane current and its application
to conduction and excitation in nerve. J Physiol, 1952. 117(4): p. 500-44.
3. Carnevale, F. and F. Capacci, [The occupational carcinogenic risk at present time in Italy.
Continuity and discontinuity with the past: emerging issues and perspectives]. Epidemiol Prev,
2009. 33(4-5 Suppl 2): p. 6-16.
4. Voets, T., et al., The principle of temperature-dependent gating in cold- and heat-sensitive TRP
channels. Nature, 2004. 430(7001): p. 748-54.
5. Sterratt, D., et al., Principles of Computational Modelling in Neuroscience. 2011: Cambridge
University Press.
6. Goldman D. E., Potential, impedance, and rectification in membranes. 1943: J. Gen.Physiol. 27, 37–
7. Hodgkin A. L. and Katz B. (1949). The effect of sodium ions on the electrical activity of the giant axon of the squid.
J. Physiol. 108, 37–77.
8. Kandel, E., Principles of Neural Science, Fifth Edition. 2013: McGraw-Hill Education.
9. Nernst W. (1888). Zur Kinetik der Lösung befindlichen Körper: Theorie der Diffusion. Z. Phys. Chem. 2, 613–637.
10. Fick A. (1855). Über Diffusion. Ann. Phys. Chem. 94, 59–86.
11. Planck M. (1890). Über die Erregung von Electricität und Wärme in Electrolyten. Ann. Phys. Chem.
Neue Folge 39, 161–186.
12. Hodgkin, A. L., et al. (1952). "Measurement of current-voltage relations in the membrane of the
giant axon of Loligo." J Physiol 116(4): 424-448.
13. Hodgkin, A. L. and A. F. Huxley (1952). "The components of membrane conductance in the giant
axon of Loligo." J Physiol 116(4): 473-496.
14. Hodgkin, A. L. and A. F. Huxley (1952). "Currents carried by sodium and potassium ions through
the membrane of the giant axon of Loligo." J Physiol 116(4): 449-472.
15. Hodgkin, A. L. and A. F. Huxley (1952). "The dual effect of membrane potential on sodium
conductance in the giant axon of Loligo." J Physiol 116(4): 497-506.
16. Hodgkin, A. L. and A. F. Huxley (1952). "A quantitative description of membrane current and its
application to conduction and excitation in nerve." J Physiol 117(4): 500-544.
17. Marmont M. (1949). Studies on the axon membrane. J. Cell. Comp. Physiol. 34,351–382
18. Cole K. S. (1968). Membranes, Ions, and Impulses: A Chapter of Classical Biophysics(University
of California Press, Berkeley).
19. Siciliano, Ryan, The Hodgkin-Huxley Model.2012: Conference Proceedings
20. Hille, B. (2001). Ionic Channels of Excitable Membranes, Sinauer.
21. Rodriguez, B. M., et al. (1998). "Voltage gating of Shaker K+ channels. The effect of temperature
on ionic and gating currents." J Gen Physiol 112(2): 223-242.

- 86 -
22. Reuter, H. (1979). "Properties of two inward membrane currents in the heart." Annu Rev Physiol 41: 413-
424.
23. Tsien, R. W. (1983). "Calcium channels in excitable cell membranes." Annu Rev Physiol 45: 341-
358.
24. Catterall, W. A. (1991). "Excitation-contraction coupling in vertebrate skeletal muscle: a tale of two calcium
channels." Cell 64(5): 871-874.
25. Tanabe, T., et al. (1993). "Structure and function of voltage-dependent calcium channels from muscle." Ann
N Y Acad Sci 707: 81-86.
26. Tsien, R. W., et al. (1988). "Multiple types of neuronal calcium channels and their selective
modulation." Trends Neurosci 11(10): 431-438.
27. Dunlap, K., et al. (1995). "Exocytotic Ca2+ channels in mammalian central neurons." Trends Neurosci 18(2):
89-98.
28. Catterall, W. A. (2011). "Voltage-gated calcium channels." Cold Spring Harb Perspect Biol 3(8): a003947.
29. Johnston, D. and S. M.-s. Wu (1995). "Foundations of cellular neurophysiology.
30. Hodgkin A. L. and Katz B. (1949). The effect of sodium ions on the electrical activity of the giant axon of the
squid. J. Physiol. 108, 37–77.
31. Arrhenius S. (1889). Über die Reaktionsgeschwindigkeit bei der Inversion von Rohrzucker in Säuren. Z. Phys.
Chem. 4, 226–248.
32. Eyring H. (1935). The activated complex in chemical reactions. J. Chem. Phys. 3, 107–115.
33. Pollak E. and Talkner P. (2005). Reaction rate theory: what it was, where is it today, and where is it going?
Chaos 15, 26116
34. Julius, D. & Basbaum, A. I. Molecular mechanisms of nociception. Nature 413, 203–210 (2001).
35. Patapoutian, A., Peier, A. M., Story, G. M. & Viswanath, V. ThermoTRP channels and beyond:mechanisms of
temperature sensation. Nature Rev. Neurosci. 4, 529–539 (2003).
36. Clapham, D. E. TRP channels as cellular sensors. Nature 426, 517–524 (2003).
37. Voets, T. & Nilius, B. TRPs make sense. J. Membr. Biol. 192, 1–8 (2003).
38. (2006). "Ca2+ Signaling, TRP Channels, and Endothelial Permeability." Microcirculation 13(8): 693-708.
39. Cosens, D. J. and A. Manning (1969). "Abnormal electroretinogram from a Drosophila mutant." Nature
224(5216): 285-287.
40. Minke, B., et al. (1975). "Induction of photoreceptor voltage noise in the dark in Drosophila mutant." Nature
258(5530): 84-87.
41. Watanabe, H. et al. Heat-evoked activation of TRPV4 channels in a HEK293 cell expression system and in
native mouse aorta endothelial cells. J. Biol. Chem. 277, 47044–47051 (2002).
42. Gu¨ler, A. D. et al. Heat-evoked activation of the ion channel, TRPV4. J. Neurosci. 22, 6408–6414 (2002).
43. Xu, H. et al. TRPV3 is a calcium-permeable temperature-sensitive cation channel. Nature 418,181–186
(2002).

- 87 -
44. Smith, G. D. et al. TRPV3 is a temperature-sensitive vanilloid receptor-like protein. Nature 418, 186–190
(2002).
45. Peier, A. M. et al. A heat-sensitive TRP channel expressed in keratinocytes. Science 296, 2046–2049(2002).
46. Caterina, M.J., et al., The capsaicin receptor: a heat-activated ion channel in the pain pathway. Nature, 1997.
389(6653): p. 816-24.
47. Caterina, M. J. (2007). "Transient receptor potential ion channels as participants in thermosensation and
thermoregulation." Am J Physiol Regul Integr Comp Physiol 292(1): R64-76.
48. Caterina, M.J., et al., A capsaicin-receptor homologue with a high threshold for noxious heat. Nature, 1999.
398(6726): p. 436-41.
49. McKemy, D. D., Neuha¨usser,W.M. & Julius, D. Identification of a cold receptor reveals a general role for TRP
channels in thermosensation. Nature 416, 52–58 (2002).
50. Peier, A. M. et al. A TRP channel that senses cold stimuli and menthol. Cell 108, 705–715 (2002).
51. Story, G. M. et al. ANKTM1, a TRP-like channel expressed in nociceptive neurons, is activated by cold
temperatures. Cell 112, 819–829 (2003).
52. Voets, T., et al., The principle of temperature-dependent gating in cold- and heat-sensitive TRP channels.
Nature, 2004. 430(7001): p. 748-54.
53. Clapham, D.E. and C. Miller, A thermodynamic framework for understanding temperature sensing by
transient receptor potential (TRP) channels. Proc Natl Acad Sci U S A, 2011. 108(49): p. 19492-7.
54. A.M. Phillips, A. Bull, L.E. Kelly, Identification of a Drosophila gene encoding a calmodulin-binding protein
with homology to the trp phototransduction gene, Neuron 8 (1992) 631–642.
55. Minke, B. and B. Cook (2002). "TRP channel proteins and signal transduction." Physiol Rev 82(2): 429-472.
56. Montell, C. (2005). "The TRP superfamily of cation channels." Sci STKE 2005(272): re3.
57. Nilius, B. and T. Voets (2005). "TRP channels: a TR(I)P through a world of multifunctional cation channels."
Pflugers Arch 451(1): 1-10.
58. S.F. Pedersen, G. Owsianik, B. Nilius, TRP channels: an overview, Cell Calcium 38 (2005) 233–252
59. T. Voets, K. Talavera, G. Owsianik, B. Nilius, Sensing with TRP channels, Nat. Chem. Biol. 1 (2005) 85–92.
60. George, M. S., E. M. Wassermann, and R. M. Post. 1996. Transcranial magnetic stimulation: a
neuropsychiatric tool for the 21st century.J. Neuropsychiatry Clin. Neurosci. 8:373–382.
61. Hallett, M. 2000. Transcranial magnetic stimulation and the human
brain. Nature. 406:147–150.
62. Sack, A.T. and D.E. Linden, Combining transcranial magnetic stimulation and functional imaging in cognitive
brain research: possibilities and limitations. Brain Res Brain Res Rev, 2003. 43(1): p. 41-56.
63. Hodgkin, A. L., and W. A. Rushton. 1946. The electrical constants of a crustacean nerve fiber. Proc. R. Soc.
Lond. B. Biol. Sci. 133:444–479.
64. Roth, B. J., and P. J. Basser. 1990. A model of the stimulation of a nerve fiber by electromagnetic induction.
IEEE Trans. Biomed. Eng. 37:588–597.
65. Irwin, D.A. and C.S. Rebert, Slow potential changes in cat brain during classical appetitive conditioning of
jaw movements using two levels of reward. Electroencephalogr Clin Neurophysiol, 1970. 28(2): p. 119-26.
66. Malmivuo, J. and R. Plonsey (1995). Bioelectromagnetism: principles and applications of bioelectric and
biomagnetic fields, Oxford University Press, USA.
67. Rotem, A. and E. Moses (2008). "Magnetic Stimulation of One-Dimensional Neuronal Cultures." Biophysical
Journal 94(12): 5065-5078.

- 88 -
68. Meyer, E., C. O. Muller, and P. Fromherz. 1997. Cable properties of dendrites in hippocampal neurons of the
rat mapped by a voltagesensitive dye. Eur. J. Neurosci. 9:778–785.
69. Feinerman, O., M. Segal, and E. Moses. 2005. Signal propagation along unidimensional neuronal networks.
J. Neurophysiol. 94:3406–3416.
70. Barker, A. T., C. W. Garnham, and I. L. Freeston. 1991. Magnetic nerve stimulation: the effect of waveform
on efficiency, determination of neural membrane time constants and the measurement of stimulator output.
Electroencephalogr. Clin. Neurophysiol. Suppl. 43:227–237.
71. Rovira, C., and Y. Ben-Ari. 1999. Developmental study of miniature IPSCs of CA3 hippocampal cells:
modulation by midazolam. Brain Res. Dev. Brain Res. 114:79–88.
72. Tuckwell, H. C. 1988. Introduction to Theoretical Neurobiology. Cambridge University Press, Cambridge, New
York.
73. http://neuron.duke.edu/
74. https://www.humanbrainproject.eu/ [HBP2012] The Human Brain Project,
75. https://www.humanbrainproject.eu/documents/10180/17648/TheHBPReport_LR.pdf
76. Hines, M. L. and N. T. Carnevale (2001). "NEURON: a tool for neuroscientists." Neuroscientist 7(2): 123-135.
77. http://web.mit.edu/neuron_v7.3/nrntuthtml/tutorial/tutA.html
78. David Sterratt, Neural Computation Practical 1: Getting to grips with Neuron and passive properties
79. David Sterratt, Neural Computation 2001/2002 Practical 2: The Hodgkin-Huxely model
80. http://web.mit.edu/neuron_v7.3/nrntuthtml/tutorial/tutB.html
81. Chapman, D. (1975). "Fluidity and phase transitions of cell membranes." Biomembranes 7: 1-9.
82. Kimura, J. E. and H. Meves (1979). "The effect of temperature on the asymmetrical charge movement in
squid giant axons." J Physiol 289: 479-500.
83. Schauf, C. L. (1973). "Temperature dependence of the ionic current kinetics of Myxicola giant axons." J
Physiol 235(1): 197-205.
84. Schwarz, W. (1979). "Temperature experiments on nerve and muscle membranes of frogs. Indications for a
phase transition." Pflugers Arch 382(1): 27-34.
85. van Lunteren, E., et al. (1993). "Effects of temperature on calcium current of bullfrog sympathetic neurons."
J Physiol 466: 81-93.
86. Yang, F. & Zheng, J.Aldrich, R. (Ed.) High temperature sensitivity is intrinsic to voltage-gated potassium
channels, eLife, eLife Sciences Publications, Ltd, 2014, 3, e03255
87. Sigworth, F. J. Voltage gating of ion channels. Q. Rev. Biophys. 27, 1–40 (1994).
88. Dickerson, R.E. and I. Geis, Chemistry, matter, and the universe: an integrated approach to general
chemistry. 1976: Addison Wesley Longman.
89. Liu, B., Hui, K. & Qin, F. Thermodynamics of heat activation of single capsaicin ion channels VR1.Biophys. J.
85, 2988–3006 (2003).
90. Baldwin RL (1986) Temperature dependence of the hydrophobic interaction in protein folding. Proc Natl
Acad Sci USA 83:8069–8072.
91. Kauzmann W (1959) Some factors in the interpretation of protein denaturation. Adv Prot Chem 14:1–63.
92. Schellman JA, Lindorfer M, Hawkes R, Grutter M (1981) Mutations and protein stability. Biopolymers
20:1989–1999.
93. Privalov PL (1997) Thermodynamics of protein folding. J Chem Thermo 29:447–474.

- 89 -
94. Borg-Graham L. J. (1989). Modelling the somatic electrical response of hippocampal pyramidal neurons.
Technical Report AITR-1161, MIT AI Laboratory.
95. Irvine L.A., Jafri M. S. and Winslow R. L. (1999). Cardiac sodium channel Markov model with temperature
96. Magee J.C. and Johnston D. (1995). Characterization of single voltage-gated Na+ and Ca2+ channels in apical
dendrites of rat CA1 pyramidal neurons. J. Physiol.487, 67–90.
97. Hoffman D.A., Magee J.C., Colbert C.M. and Johnston D. (1997). K+ channel regulation of signal propagation
in dendrites of hippocampal pyramidal neurons. Nature 387, 869–875.
98. Magistretti J. and Alonso A. (1999). Biophysical properties and slow voltage-dependent inactivation of a
sustained sodium current in entorhinal cortex layer-II principal neurons: a whole-cell and single-channel
study. J. Gen. Physiol. 114, 491–509.
99. Köhling R. (2002). Voltage-gated sodium channels in epilepsy. Epilepsia 43, 1278–1295.
100. Jaffe D. B., Ross W.N., Lisman J. E., Lasser-Ross N., Miyakawa H. and Johnston D. (1994). A model for
dendritic Ca2+ accumulation in hippocampal pyramidal neurons based on fluorescence imaging
measurements. J. Neurophysiol. 71, 1065–1077.
101. Fox A. P., Nowycky M.C. and Tsien R.W. (1987). Kinetic and pharmacological properties distinguishing three
types of calcium currents in chick sensory neurones. J. Physiol. 394, 149–172.
102. Gillies A. and Willshaw D. (2006). Membrane channel interactions underlying rat subthalamic projection
neuron rhythmic and bursting activity. J. Neurophysiol. 95, 2352–2365.
103. Brown A.M., Schwindt P.C. and Crill W.E. (1993). Voltage dependence and activation kinetics of
pharmacologically defined components of the high-threshold calcium current in rat neocortical neurons. J.
Neurophysiol. 70, 1530–1543.
104. Wigmore M.A. and Lacey M.G. (2000). A Kv3-like persistent, outwardly rectifying, Cs+-permeable, K+ current
in rat subthalamic nucleus neurones. J. Physiol. 527, 493–506.
105. Heinemann S.H., Rettig J., Graack H.R. and Pongs O. (1996). Functional characterization of Kv channel beta-
subunits from rat brain. J. Physiol. 493 (3), 625–633.
106. Halliwell J.V. and Adams P.R. (1982). Voltage-clamp analysis of muscarinic excitation in hippocampal
neurons. Brain Res. 250, 71–92.
107. Storm J. F. (1988). Temporal integration by a slowly inactivating K+ current in hippocampal neurons. Nature
336, 379–381.
108. Sah P., Gibb A. J. and Gage P.W. (1988). Potassium current activated by depolarization of dissociated
neurons from adult guinea pig hippocampus. J. Gen. Physiol. 92, 263–278.
109. Borg-Graham L. J. (1999). Interpretations of data and mechanisms for hippocampal pyramidal cell models.
In Cerebral Cortex, Volume 13: Models of Cortical Circuits, eds P. S. Ulinski, E.G. Jones and A. Peters (Plenum
Publishers, New York), pp. 19–138.
110. Moran, M.M., H. Xu, and D.E. Clapham, TRP ion channels in the nervous system. Curr Opin Neurobiol, 2004.
14(3): p. 362-9.
111. Tominaga, M., et al. (1998). "The cloned capsaicin receptor integrates multiple pain-producing stimuli."
Neuron 21(3): 531-543.
112. Hellwig, N., et al. (2004). "TRPV1 acts as proton channel to induce acidification in nociceptive neurons." J
Biol Chem 279(33): 34553-34561.
113. Gunthorpe, M. J., Harries, M. H., Prinjha, R. K., Davis, J. B. & Randall, A. Voltage- and timedependent
properties of the recombinant rat vanilloid receptor (rVR1). J. Physiol. (Lond.) 525,747–759 (2000).

- 90 -
114. Vlachova, V. et al. Functional role of C-terminal cytoplasmic tail of rat vanilloid receptor 1. J.Neurosci. 23,
1340–1350 (2003).
115. ?
116. Collins, C.A. and E. Rojas, Temperature dependence of the sodium channel gating kinetics in the node of
Ranvier. Q J Exp Physiol, 1982. 67(1): p. 41-55.
117. Rosen, A.D., Nonlinear temperature modulation of sodium channel kinetics in GH(3) cells. Biochim Biophys
Acta, 2001. 1511(2): p. 391-6.
118. Plakhova, V.B., et al. Infrared light irradiation diminishes effective charge transfer in slow sodium channel
gating system. in Fourth International Workshop on Nondestructive Testing and Computer Simulations in
Science and Engineering. 2001. International Society for Optics and Photonics.
119. Behrens, M.I., et al., Batrachotoxin-modified sodium channels from squid optic nerve in planar bilayers. Ion
conduction and gating properties. The Journal of general physiology, 1989. 93(1): p. 23-41.