MODULAR TISSUE SCAFFOLDING TOOLS: A NEW...
89
MODULAR TISSUE SCAFFOLDING TOOLS: A NEW FAMILY OF SELF-ASSEMBLED BIOMATERIALS DERIVED FROM COPPER-CAPILLARY ALGINATE GELS By BRADLEY JAY WILLENBERG A DISSERTATION PRESENTED TO THE GRADUATE SCHOOL OF THE UNIVERSITY OF FLORIDA IN PARTIAL FULFILLMENT OF THE REQUIREMENTS FOR THE DEGREE OF DOCTOR OF PHILOSOPHY UNIVERSITY OF FLORIDA 2005
Transcript of MODULAR TISSUE SCAFFOLDING TOOLS: A NEW...

MODULAR TISSUE SCAFFOLDING TOOLS:
A NEW FAMILY OF SELF-ASSEMBLED BIOMATERIALS DERIVED FROM COPPER-CAPILLARY ALGINATE GELS
By
BRADLEY JAY WILLENBERG
A DISSERTATION PRESENTED TO THE GRADUATE SCHOOL OF THE UNIVERSITY OF FLORIDA IN PARTIAL FULFILLMENT
OF THE REQUIREMENTS FOR THE DEGREE OF DOCTOR OF PHILOSOPHY
UNIVERSITY OF FLORIDA
2005

Copyright 2005
by
Bradley Jay Willenberg

To the old man who drowned so near the shore.

iv
ACKNOWLEDGMENTS
I would like to sincerely thank Dr. Christopher Batich, my supervising committee
chairman. His hands-off approach and wealth of scientific and engineering knowledge
propelled me and this project faster and farther than initially envisioned. I thank Dr.
Anthony Brennan, Dr. Robert DeHoff and Dr. Thomas Mareci for their time and efforts
as my teachers and committee members. I also specially thank Dr. Naohiro Terada and
Dr. Takashi Hamazaki for their tremendous efforts, input and profound support of this
work.
Much praise and thanks go to Marina Scotti for giving me roots; split a piece of
wood and she is there. Lift a stone and you will find her. I thank my family for their
consistent support, guidance, criticism and strength. I especially thank, Mom, Jimbo,
Dan and Ryan, Dr. Amelia Dempere and Specialist Wayne Acree (“The Lab Dude”). I
also thank the entire Major Analytical Instrumentation Center (MAIC) staff for their
scientific and social insights. I further thank all those students, faculty and staff who took
the time to know and talk with me.
Special thanks go to Charlie Murphey (Precision Tool & Engineering, Gainesville,
FL) for custom machining all my tools and reactors, and to Dr. Charles (Chuck) Seegert
for shaping my early scientific and tissue-engineering thinking.

v
TABLE OF CONTENTS page
ACKNOWLEDGMENTS ................................................................................................. iv
LIST OF FIGURES ......................................................................................................... viii
LIST OF OBJECTS .............................................................................................................x
ABSTRACT....................................................................................................................... xi
CHAPTER
1 INTRODUCTION ........................................................................................................1
2 BACKGROUND AND SIGNIFICANCE....................................................................5
3 MATERIALS AND METHODS ...............................................................................15
Scaffold Synthesis ......................................................................................................15 Raw Copper-Capillary Alginate Gel (RCCAG)..................................................15
Classic descending growth technique ..........................................................16 Time-lapse videoscopy.................................................................................17
Barium Stabilized Copper-Capillary Alginate Gel (BCCAG) ............................17 Exchange-reactor design and setup ..............................................................17 Barium hydroxide processing.......................................................................18
Oligochitosan-Barium (OBCCAG) and Oligochitosan (OCCAG) Stabilized RCCAG............................................................................................................19
Scaffold Characterization ....................................................................................20 Optical microscopy ......................................................................................20 Scanning electron microscopy .....................................................................21
Percent Water Content Determination.................................................................22 Biological Assesment .................................................................................................22
In Vitro Study: Swiss Albino Embryonic Mouse Fibroblasts Expressing Green Fluorescent Protein (GFP-3T3).............................................................24
In Vitro Study: Mouse Embryonic Stem Cells Expressing Green Fluorescent Protein (GFP-mES)..........................................................................................24
Evaluation of mES cell growth, survival and morphology vs. time.............24 Comparison of ES maintenance (LIF+) and ES differentiation (LIF-)
media conditions .....................................................................................25

vi
4 RESULTS AND DISCUSSION.................................................................................26
Scaffold Synthesis and Processing .............................................................................26 RCCAG ...............................................................................................................26
Growth videos ..............................................................................................27 Growth kinetics ............................................................................................27 Storage concerns ..........................................................................................28
BCCAG ...............................................................................................................29 Colorimetric changes during barium hydroxide treatment ..........................29 Exchange-reactor advantages and difficulties..............................................30
OBCCAG and OCCAG.......................................................................................31 Consequences of Media Wash.............................................................................32
Scaffold Characterization ...........................................................................................32 Optical Microscopy .............................................................................................33
RCCAG ........................................................................................................33 Evidence of precipitates within BCCAG .....................................................34
Scanning Electron Microscopy/Energy Dispersive Spectroscopy (SEM/EDS) and X-ray Mapping ..........................................................................................35
Consequences of freeze-drying ....................................................................35 RCCAG Data................................................................................................35 BCCAG Data................................................................................................37 OCCAG Data ...............................................................................................39 Summary of morphologic and compositional analysis ................................39
Equilibrium Water Weight Percent Analysis ......................................................40 Biologic Assessment...................................................................................................41
Mouse Embryonic Fibroblasts (GFP-3T3)..........................................................41 Mouse Embryonic Stem Cells (GFP-mES).........................................................42
Evaluation of cell Growth, survival and morphology vs. time ....................43 Confocal microscopy and video data ...........................................................43 Comparison of ES maintenance (Lif+) and ES differentiation (Lif-) media
conditions................................................................................................44
5 CONCLUSIONS ........................................................................................................62
Introduction.................................................................................................................62 Scaffold Synthesis: The Agony and the Ecstasy ........................................................62 Characterization: CCAG Scaffolds as Subtle Composites .........................................63 Biological Assessment: Living with Success and Failure ..........................................64
6 FUTURE WORK........................................................................................................66
Introduction.................................................................................................................66 Synthesis: Expanding the CCAG Scaffold Family.....................................................66 Scaffold Characterization: Quantitative Bulk and Surface Compositional Analysis .66 Biologic Assessment: Standardized Methods and Controls for Stem Cell Studies....67
APPENDIX PUBLICATIONS, PRESENTATIONS AND PATENTS.........................69

vii
LIST OF REFERENCES...................................................................................................70
BIOGRAPHICAL SKETCH .............................................................................................76

viii
LIST OF FIGURES
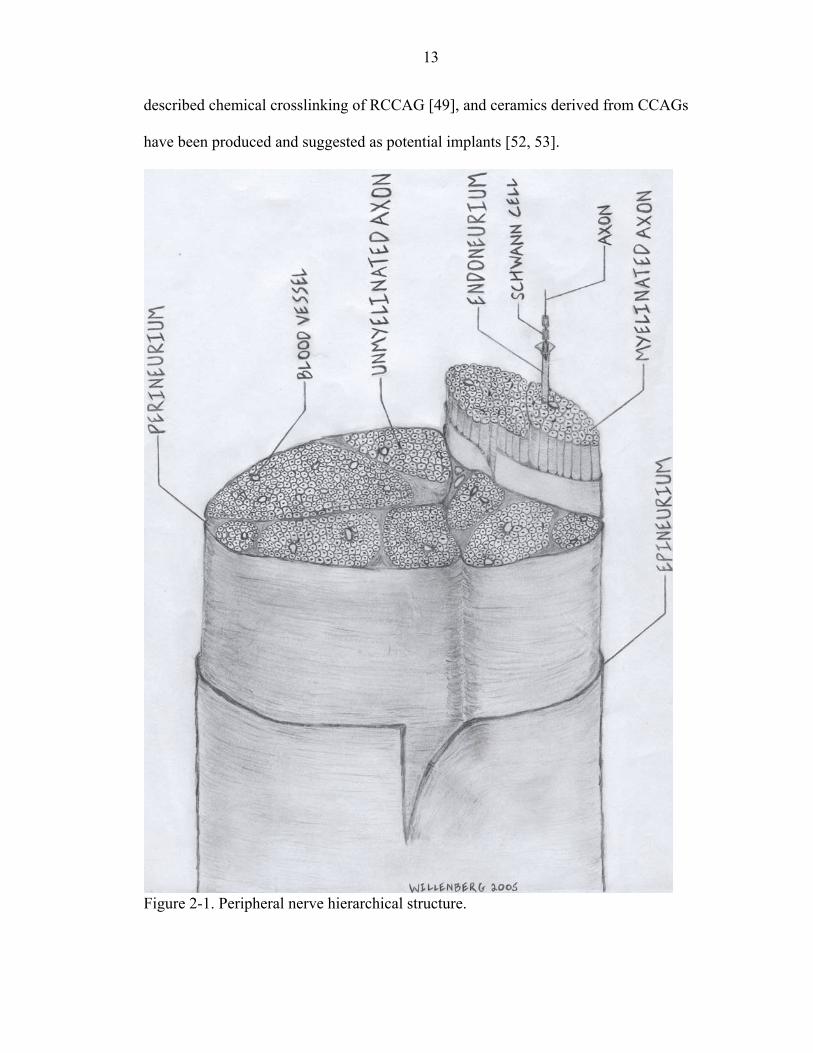
Figure page 2-1 Peripheral nerve hierarchical structure.....................................................................13
2-2 Molecular structures of alginate and oligochitosan polymers..................................14
3-1 Raw-CCAG (RCCAG) classical descending technique synthesis scheme. .............17
3-2 Teflon™ exchange-reactor.......................................................................................18
4-1 Plot of RCCAG growth as a function of time. .........................................................46
4-2 First derivative plot of RCCAG growth data. ..........................................................47
4-3 Low magnification optical micrographs of representative RCCAG sample discs...47
4-4 Increased magnification optical micrographs of RCCAG at sections at different parent gel levels........................................................................................................48
4-5 Graph of RCCAG average capillary diameter vs. parent gel thickness. ................48
4-6 Graph of calculated RCCAG metrics vs. parent gel thickness.................................49
4-7 Optical micrograph of BCCAG showing brown precipitate. ...................................49
4-8 Optical micrograph of BCCAG showing shimmering precipitate. ........................50
4-9 Summary of RCCAG SEM/EDS and X-ray mapping data......................................51
4-10 Summary of BCCAG SEM/EDS and X-ray mapping data......................................52
4-11 Higher magnification BCCAG morphologic and compositional study. ..................53
4-12 Large false color compositional map of a BCCAG. ................................................54
4-13 Summary of OCCAG SEM/EDS and X-ray mapping data. ....................................55
4-14 A 4000X secondary electron image highlighting the “hairy” OCCAG surface character. ..................................................................................................................56
4-15 Equilibrium water weight percents of different CCAG derivatives........................56

ix
4-16 Confocal microscope image of live GFP-3T3 cells seeded within an OCCAG scaffold at day 2 in culture. ......................................................................................57
4-17 Phase contrast and complementary fluorescence microscope image series of GFP-mES cultured in OCCAG over nine days.................................................................58
4-18 Confocal microscope image of live GFP-mES cells seeded within an OCCAG scaffold at day 7 in culture. ......................................................................................59
4-19 Hoechst stained nuclei of mES cells in an OCCAG capillary at day 4 in culture....60
4-20 Growth of GFP-mES cells in OCCAG scaffolds cultured in maintenance (M) or differentiation (D) media or a combination (M/D) over 4 days. ..............................61

x
LIST OF OBJECTS
Object page 4-1 Time-Lapse Video of RCCAG Growth. ..................................................................46
4-2 Confocal microscope video of live GFP-3T3 cells seeded within an OCCAG scaffold at day 2 in culture. ......................................................................................57
4-3 Confocal microscope video of live GFP-mES cells seeded within an OCCAG scaffold at day 7 in culture. ......................................................................................59

xi
Abstract of Dissertation Presented to the Graduate School of the University of Florida in Partial Fulfillment of the Requirements for the Degree of Doctor of Philosophy
MODULAR TISSUE SCAFFOLDING TOOLS: A NEW FAMILY OF SELF-ASSEMBLED BIOMATERIALS DERIVED FROM COPPER-CAPILLARY ALGINATE GELS
By
Bradley Jay Willenberg
August 2005
Chair: Christopher Batich Major Department: Biomedical Engineering
Tissue engineering aims to regenerate or replace lost/damaged cells, tissues and
organs. Biomaterial scaffolds are often fundamental components of many tissue
engineering strategies. Development of advanced biomaterial scaffolds is crucial to the
continued progress and ultimate success of the field. Motivated to aid peripheral nerve
regeneration/engineering, our study offers an innovative way to produce advanced
biomaterial scaffolds derived from copper-capillary alginate gel (CCAG).
These novel materials possess regular, continuous microtubular architectures that
relatively few fabrication techniques can achieve. These hydrogel materials have been
morphologically and compositionally characterized using scanning electron microscopy
and energy dispersive spectroscopy (SEM/EDS). We conducted X-ray mapping studies
yielding the spatial distribution of elements within the different scaffolds. Fluorescence

xii
and confocal microscopy studies detail the unique growth and survival of mouse
embryonic stem cells (mES) and fibroblasts (3T3) in and on CCAG scaffolds in vitro.

1
CHAPTER 1 INTRODUCTION
Clinical motivation. Peripheral nerve injuries are extremely prevalent. Injury is
often the result of trauma (e.g., lacerations, gunshot wounds, motor vehicle accidents),
acute compression, stretching and tension or disease (e.g., cancer, leprosy). Each year, an
estimated 50,000 peripheral nerve repair procedures are performed in the United States
alone [1]. Much of what has been learned about peripheral nerve repair has grown out of
the treatment of warfare injuries [2]. Unfortunately, despite many advances and creative
repair strategies, functional outcomes of nerve repairs are still far from optimal, and
motor nerves tend to be more refractory than sensory to full recovery [1].
Ideally, surgeons attempt a neurorrhaphy (direct suture of the nerve ends without
tension) for all laceration or avulsive injuries [3, 4]. When transected or resected nerve
ends cannot be coapted without tension, a gap defect results requiring nerve grafting to
restore neural continuity [5]. Autograft (autologous nerve) is the “gold standard” graft
material, and is preferentially obtained from harvest of the sural nerve, antebrachial
cutaneous radial nerve or superficial sensory radial (SSR) nerve [5]. Fundamental
determinates of functional regeneration for autograft are the endoneurium and remaining
Schwann cells, since the epi- and perineural elements are trimmed from harvested nerve
before engraftment.
Although reported to facilitate neuroregeneration over substantial distances (2-15
cm) [6], autograft has some disadvantages, including lack of donor supply, donor-site
morbidity, need for a secondary surgical site and insufficient functional outcomes [1, 6-

2
7]. Harvesting donor nerve is also time-consuming and often the fascicles do not match
the target nerve in both number and diameter. Central or segmental necrosis can also
occur in large diameter grafts [8].
Tissue engineering could be a promising approach to functional neurorepair.
Many tissue engineering strategies have already been used to facilitate neuroregeneration
(chapter 2). Pinpointing the first tissue engineering experiments is difficult; however,
most credit Langer and Vacanti [9] with crystallizing the central dogma and fundamental
strategies of the field. They define tissue engineering as “. . . an interdisciplinary field
that applies the principals of engineering and the life sciences toward the development of
biological substitutes that restore, maintain or improve tissue function.”
A primary thrust of tissue engineering is to develop three-dimensional biomaterials
for use as scaffolds- templates to format growing/regenerating cells and tissues.
Scaffolds are becoming integral components of tissue reparative, restorative and
regenerative strategies [9], and development of advanced biomaterial scaffolds is crucial
to the continued progress and success of the tissue engineering field. The ability to
impose structural order on growing/regenerating cells and tissues via scaffold architecture
and geometry is a key feature of advanced scaffolds.
According to a review by Ma [10], scaffolds are usually highly porous with large
surface areas. Biodegradability is also generally required, with degradation rates
designed to match the rate of neotissue formation. Further, the scaffold material(s) and
possible degradation products should be non-toxic (i.e., biocompatible), especially to
target cells and tissues. Finally, scaffolds should maintain adequate mechanical
properties and enhance cell adhesion, growth, migration and differentiated function. The

3
underlying idea of the above design guidelines is to produce biomaterials that bring
together large numbers of cells in comfortable close quarters, and provide an
environment that facilitates growth/regeneration/remodeling into functional target
tissue(s).
Scaffolds are essentially modular biomaterial tools. The word modular is
intended to convey flexibility, customizability and dynamic range. To illustrate this
concept, consider a computer software program. At its most basic level, the program
comes with some set of features that perform needed functions. If more than the basic
features are required to address specific needs, then often times one can enable or install
additional program modules (for a small fee, of course) adding the needed functionality.
This concept is well articulated in current microsphere technology, yet is still nascent in
current scaffolding designs.
Modular homes are another example of the concept discussed above. The home
analogy is particularly instructive from a biological perspective; no longer simply tools,
scaffolds are homes for regenerating cells and tissues. One wants to encourage
cells/tissues to take up orderly, productive residence and integrate into a much larger
community.
Using this logic, combinations of different biomaterial modules (e.g., architecture,
modulus, surface chemistry) are used to create a family of related scaffolds. These tailor-
made tools can then be implemented in tissue engineering. The science is to know (at the
molecular level) the effects of specific combinations of scaffold modules on cells/tissues.
Only with this knowledge can we engineer scaffolds with tremendous flexibility and
broad applicability.
4
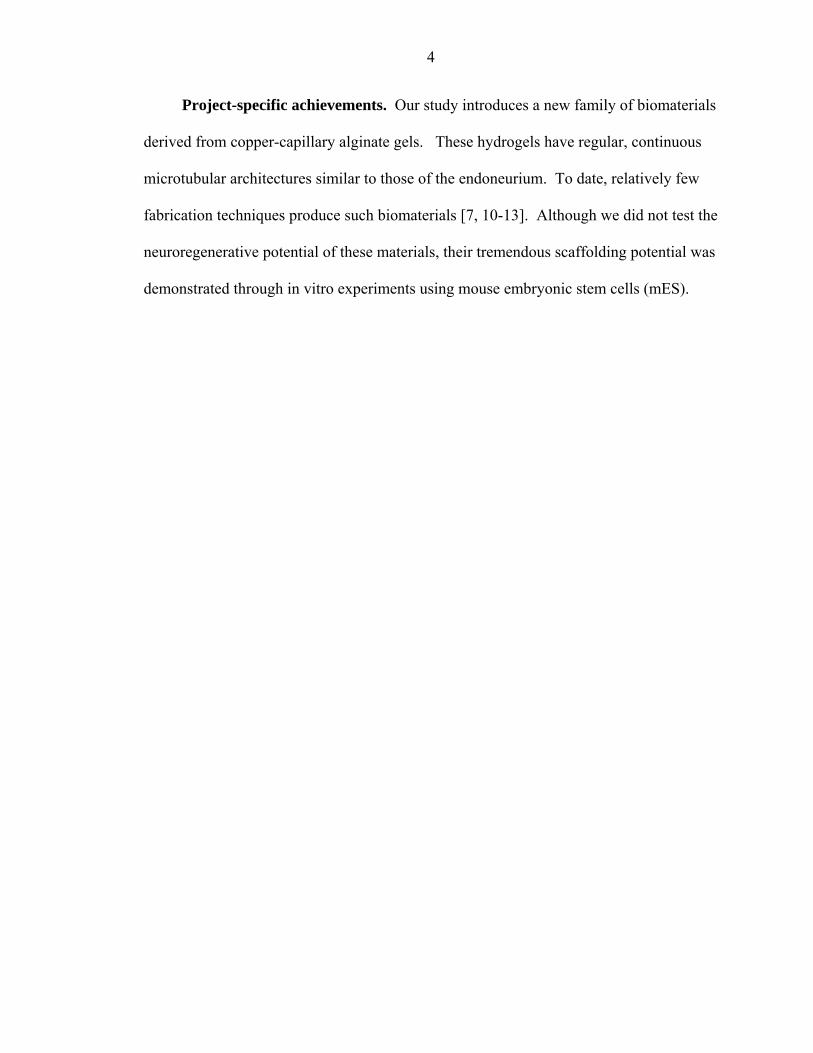
Project-specific achievements. Our study introduces a new family of biomaterials
derived from copper-capillary alginate gels. These hydrogels have regular, continuous
microtubular architectures similar to those of the endoneurium. To date, relatively few
fabrication techniques produce such biomaterials [7, 10-13]. Although we did not test the
neuroregenerative potential of these materials, their tremendous scaffolding potential was
demonstrated through in vitro experiments using mouse embryonic stem cells (mES).

5
CHAPTER 2 BACKGROUND AND SIGNIFICANCE
Classification of peripheral nerve injury. In 1943, Sir Herbert Seddon
introduced a peripheral nerve injury classification system comprising 3 categories:
neurapraxia, axonotmesis and neurotmesis [1]. In 1951, Sundeland expanded the Seddon
system to five categories by further subdividing axonotmesis [3, 4]. A first-degree injury
(neurapraxia) involves a temporary conduction block with local demyelination.
Complete recovery occurs and may take up to 12 weeks. A second-degree injury
(axonotmesis) involves more-severe trauma or compression causing Wallerian
degeneration. The endoneurial tubes remain intact and therefore recovery is expected to
be complete, but could take months. A third-degree injury also involves Wallerian
degeneration, however the endoneurial tubes are not intact. Therefore, axons may not
reinnervate their original motor/sensory targets and recovery is incomplete. A fourth-
degree injury is a partial transection of the nerve, ultimately resulting in a large scar area
at the site of injury. This scar precludes axons from advancing distally, and requires
surgery for any chance at meaningful functional recovery. A fifth-degree injury
(neurotmesis) is a complete transection of the nerve and requires surgery to restore neural
continuity. MacKinnon added a sixth degree that combines the other degrees to describe
a mixed nerve injury [3]. Age and location are also key factors governing functional
recovery, with poorer results expected for increasing age and more-proximal injuries.
Anatomy and biology of adult peripheral nerve in the healthy state. Figure 2-1
illustrates peripheral nerve hierarchy. Nerves are composed of motor, sensory and

6
sympathetic components [1]. Nerves may be designated as primarily motor or sensory;
however, no nerve is purely one or the other [1]. Myelinated and unmyelinated axons
comprise the nerve fibers. Motor fibers are primarily myelinated and are outnumbered 4
to 1 by unmyelinated sensory fibers [1]. Myelinated fibers range in size from 1 to 20 µm
in diameter, while umyelinated fibers are typically below 1 µm diameter [14, 15].
The edoneurium is composed mainly of longitudinally aligned collagen fibers 30 to
60 nm in diameter [14, 16-17]. Tiny capillaries (<10 µm), fibroblast, mast cells and
macrophages are also found in the endoneurium. The innermost endoneurial layer is
often observed to be in close contact with Schwann cell basal laminae.
Compared to the epinerium and endoneurium the perineurium is unique [14, 16-
17]. Cells composing the perineurium exhibit both myoid and epithelioid features and
express basal lamina on both surfaces. The cells are interlocked in successive sheets via
tight junctions. Blood vessels also infiltrate this layer, with the perineurim functioning as
a selectively permeable barrier. The outermost perineurial layers are composed of dense
concentric layers of mostly longitudinally arranged collagen fibrils ~50 nm diameter with
a few fibroblasts and macrophages among the strands.
The epineurium is a dense collagenous layer surrounding all peripheral nerve
trunks [14, 16-17]. Fibers in this layer are disposed mainly longitudinally with diameters
between 70 and 85 nm. Elastin fibers are also present, with diameters ranging from 250
to 500 nm. Fibroblast and mast cells are scattered throughout this layer.
Peripheral nerve in the injured state. Axotomy (axon severance) occurs after
any 2nd degree injury and beyond. The cell body then undergoes chromatolysis
(swelling) and increased protein and RNA metabolism [1, 14, 16]. Later, axonal sprouts

7
grow from the proximal stump, and the distal stump undergoes Wallerian degeneration (a
process in which the distally remaining severed axon swells and breaks apart). During
Wallerian degeneration, Schwann cells in the distal stump concomitantly dedifferentiate,
reduce myelin protein synthesis, fragment remaining myelin sheaths into ovoids,
phagocytize myelin debris along with macrophages, and proliferate to form tubular
structures termed bands of Büngner that guide regenerating axon sprouts. Regenerating
axons typically grow at a rate of 1 to 4 mm per day, and the events of degeneration and
regeneration overlap.
Schwann cells and macrophages also play a role in degeneration/regeneration at the
molecular level through cytokine and growth factor production [18]. Immediately after a
crushing injury, Schwann cells show increased levels of IL-1β, IL-6, LIF (leukemia
inhibitory factor) and IL-10 mRNA transcripts. IL-1β possibly induces nerve growth
factor (NGF) synthesis while IL-6 appears to affect sensory fiber regeneration. LIF
appears to affect the conduction velocity of regenerating fibers reportedly increasing the
size and number of myelinated fibers. Schwann cells also produce basal lamina
components laminin and collagen type IV which are required for neuroregeneration.
Furthermore, Schwann cells secrete a cocktail of neurotrophic factors like NGF,
neurotrophin-3, brain-derived growth factor (BDGF), neuregulin, fibroblast growth
factors (FGF) 1 and 2, insulin-like growth factors (IGF) 1 and 2, and ciliary
neurotrotrophic factor (CNTF) that play active roles in neuroregeneration [19].
Transcript levels for the IL-18, IFN-γ and TNF-α (pro-inflammatory cytokines)
describe a more persistent upregulation peaking ca. 1 to 2 weeks post injury [18].
Infiltrating macrophages appear to be the cellular source of IL-18, but the source of

8
IFN-γ is less clear. Schwann cells, fibroblasts, endothelial cells and macrophages all
express TNF-α following injury. Strong evidence supports the contention that TNF-α
plays a significant role in macrophage recruitment [18]. Transcripts for the anti-
inflammatory cytokine transforming growth factor-beta-1 (TGF-β1), the p40 subunit of
IL-12 also peek 14 days following injury. Murine macrophages stimulated with myelin
in vitro were shown to release IL-12 and TNF-α, suggesting that IL-12 expression is
potentially a consequence of myelin phagocytosis and part of macrophage autoregulation
[18].
Previously studied biomaterial nerve conduits. Entubulation is the most
common alternative to autograft repair [20]. In entubulation, severed nerve ends are
inserted into a hollow or filled-lumen biomaterial tube employed to protect, facilitate and
guide neuroregeneration. Gaps of centimeters have been regenerated successfully
depending upon the specific materials used [6, 9, 19, 21-28]. Ideally, conduits [6] should
be:
• Easily available • Resorbable • Readily vascularized • Non-immunogenic • Permeable to oxygen and other nutrients • Able to block infiltrating scar tissue • Able to function as depots for biologically active compounds
Clinically investigated biomaterial conduits. According to a clinical review by
Meek and Coert [6], vein, denatured muscle, combination vein filled with muscle,
silicone, Gore-Tex™, and polyglycolic acid (PGA) tubes have been used clinically (in
humans) for nerve reconstruction with success. Vein grafts were found suitable for gap
lengths of ≤4.5 cm depending upon the nerve under repair. Muscle grafts appeared

9
suitable for reconstruction of >6 cm gaps in leprosy patients and were judged superior to
conventional nerve grafting for repairing 1.5 to 2.8 cm gaps resulting from laceration
injuries. Combination vein filled with muscle conduits have been used successfully to
reconstruct 6 cm gaps. The ready supply of vein and muscle makes them attractive graft
material choices, and combination vein-muscle grafts have shown superior results to vein
alone in similar defects. Allografts in combination with systemic immunosuppressive
therapy have also been used successfully in the clinic to reconstruct massive (>10 to 20
cm) peripheral nerve defects [29].
Hollow Gore-Tex™ conduits are indicated in reconstructions up to 4 cm and cause
less tissue irritation than silicone tubes. Silicone tubes were only shown successful for 4
mm gaps, and 29% of the tubes had to be removed because of (compressive) irritation. In
clinical studies using PGA tubes, the maximum defect that could be reconstructed was 3
cm and the conduits performed significantly better than autograft. The PGA conduits
permitted reconstruction of larger gaps perhaps because they were porous, permeable to
oxygen and less likely to collapse. Also, because these tubes were bioabsorbed, there
was no need to re-operate for compression/irritation.
Hence, clinical studies show that conduits (natural or synthetic) are at least
comparable to autograft for repairing short defects (≤ ~3 cm). However, the ideal conduit
milieu has not been established for repairing larger nerve gaps [20]. The studies also
indicate that bioresorbable synthetic conduits are preferable to biodurable ones; filling the
conduit lumen with a permissive tissue (e.g., muscle) appears to yield significantly better
regenerative outcomes. Although allografts have been used successfully to reconstruct

10
large nerve defects, the need for systemic immunosuppressive therapy is a serious
drawback.
Experimentally investigated biomaterials. Many experimental studies in animal
models (primarily rat) aimed to improve conduit design and performance. Essential facts
gained from that literature are as follows: Permeable conduits and conduits possessing
smooth inner walls significantly outperformed impermeable conduits or conduits with
rough inner walls [28, 30]. More importantly and perhaps not surprisingly,
culturing/seeding autologous Schwann cells in conduits before implantation positively
impacted regeneration, improving recovery [19, 26, 27]. Combining Schwann cells with
a basement membrane gel such as Matrigel® in the conduit lumen also positively affects
nerve regeneration [9, 24].
The assertion that nerve conduits need to function as a scaffold more for Schwann
cells than axons is gaining strength in the experiment literature. A few researchers have
fashioned scaffolds that induce cultured/seeded Schwann cells to form structures
reminiscent of Büngner bands [7, 12, 26], although results of these studies are
preliminary. The multi-lumen PLGA-Schwann cell seeded conduits constructed to
implement this strategy are of particular interest [7, 12]. Hadlock et al. [7, 12] have
produced conduits incorporating both fundamental determinants of functional
regeneration present in autograft. Thin stainless steel wires in the polymer injection mold
were used to approximate the continuous, tubular microstructure of the endoneurium.
Autologous Schwann cells were then flow-seeded into these laminin-coated conduits and
the cellularized implant was placed in a 7 mm rat sciatic nerve defect. After 6 weeks,
these conduits had statistically similar amounts of neural tissue per cross-sectional open

11
area compared to autograft. However, the mean myelinated fiber diameter of 3.73 ± 0.51
µm was significantly higher than the 2.3 ± 0.24 µm mean diameter found in autograft
controls (p < 0.05). Although these multi-lumen conduits are innovative and show
promising initial results, studies using these conduits are far from comprehensive, and the
requisite production methods could ultimately limit their widespread use.
Alginate (Figure 2-2A) is a linear polysaccharide discovered by E.C.C. Stanford in
1880 obtained from alkali digestion of various brown sea algae [31, 32]. The polymer
chain is composed of β-1,4 linked D-mannuronic acid (M) and α-1,4 linked L-guluronic
acid (G) monosaccharides found in three distinct blocks: polyM, polyMG and PolyG
blocks [33]. Compositional variation is a reflection of source and processing. The pKa’s
of the C5 epimers are 3.38 and 3.65 for M and G respectively, with the pKa of an entire
alginate molecule somewhere inbetween [31, 32].
Alginate forms colloidal gels (high-water-content gels, hydrogels) with divalent
cations. In the alginate ion affinity series Pb2+>Cu2+>Ba2+>Ca2+>Zn2+>Ni2+>Co2+>Mn2+,
Ca2+ is perhaps the most used and characterized to form gels [34]. Studies indicate that
Ca-alginate gels form via cooperative binding of Ca2+ ions by polyG blocks on adjacent
polymer chains, the so-called “egg-box” model [32, 33]. G-rich alginates tend to form
thermally stable, strong, yet brittle Ca-gels that are likely to undergo syneresis. M-rich
alginates tend to form less thermally stable, weaker but more elastic gels.
Alginate is commercially used as a binding, stabilizing and/or thickening additive
in many foods and cosmetics [32]. Clinically, alginate is used in dental-impression
materials and hemostatic wound dressings [35, 36]. Alginate:poly-L-lysine
polyelectrolyte complex (PEC) encapsulated pancreatic islet cells were also evaluated in

12
a human clinical trial for treatment of type I diabetes [37, 38]. Alginate:chitosan PEC
beads and films have been made experimentally for cellular immunoprotective capsules
and drug release devices [39, 40]. Ionically (Ca2+) and covalently (e.g., ethylene
diamine) crosslinked freeze-dried foams and gels have been developed and implemented
as tissue scaffolds [39-43]. Copper alginate gel beads have been used for enzyme
immobilization with success [44]. Barium and oligochitosan (Figure 2-2B) crosslinked
alginate microspheres have also been previously synthesized and investigated [45-47].
Copper-capillary alginate gel(s) (CCAG) have been previously described and
studied in the scientific literature [31, 48-51]. These self-assembled gels are essentially
formed by allowing solutions of Cu2+ to diffuse uniformly into viscous solutions of
alginate. During this diffusion process, Thumbs and Kohler [48] state that fluid
instabilities arise from the friction forces involved in the contraction of alginate polymer
chains to the newly forming gel front. Convecting tori (similar to those observed in the
Raleigh-Benard model of heat convection) result from these hydrodynamic instabilities.
In a sense, these tori tunnel parallel capillaries through the forming gel in the direction of
diffusion. A continuous, tubular microstructure is mapped onto the forming gel because
of the convective-like process the system undergoes to dissipate energy. Gel capillary
diameter can be adjusted by manipulating (singly or in combination) the initial alginate
concentration, initial Cu2+ concentration or system pH [31, 48-49].
Surprisingly, no previous reports describe CCAG-derived hydrogels synthesized
and implemented as tissue scaffolds; this beautiful material and all its tissue engineering
potential uninvestigated. This could be because raw CCAG (RCCAG) dissolves in
several hours under cell culture conditions. However, many studies have already
13
described chemical crosslinking of RCCAG [49], and ceramics derived from CCAGs
have been produced and suggested as potential implants [52, 53].
Figure 2-1. Peripheral nerve hierarchical structure.

14
A
B
O
OH HOO
OCO2H
OH HOO
n
CO2H
x yM
G
O
NH2
CH2OHO
OH
NHCOCH3
CH2OHO
OHO
n
x y
Figure 2-2. Molecular structures of alginate and oligochitosan polymers. A) Alginate, B)
Oligochitosan
15
CHAPTER 3 MATERIALS AND METHODS
Scaffold Synthesis
All alginate used was Keltone LV obtained from ISP Alginates, Inc. (formally
known as Keltone, MW range: 12,000-80,000 g/mol). Copper sulfate pentahydrate ACS
grade was obtained from Acros Organics, NJ. Barium hydroxide monohydrate was
obtained from Aldrich Chemical Company, Inc., Milwaukee, WI. Oligochitosan was a
kind gift from Dr. Dong-Won Lee who originally obtained it from E-ZE Co., Ltd., Korea;
manufacturer-reported average molecular weight and moisture content were 1150 g/mol
and 8%, respectively. Dr. Lee reported a 70% degree of deacetylation measured by
1HNMR [54].
Raw Copper-Capillary Alginate Gel (RCCAG)
Preparation of 2% w/v alginate solution. 4 g of Keltone LV sodium alginate was
dispersed in 170 mL of distilled water in a 500-mL Erlenmeyer flask. The suspension
was stirred with a stir plate at medium-high speed until a clear, homogenous solution was
obtained. Distilled water was then added to the solution until the final solution volume
was 200 mL, yielding a 2% w/v solution of sodium alginate (manufacturer-reported
viscosity, 100-300 centipoise (cP)). The alginate solution was stirred for 2 h and allowed
to stand for an additional 2 h to minimize solution bubbles. Solutions were either used
immediately or stored for no more than a week at 4ºC.
Petri dish preparation. A thin coat of alginate needs to be baked onto the petri
dish to prevent gel separation from the vessel wall during growth [31, 49-51]. Five thin

16
coats of freshly prepared 2% w/v alginate solution were smeared onto the entire inner
surface and rim of a Pyrex™ petri dish (9 cm diameter × 2 cm height or 9 cm diameter ×
3.25 mm height). A few minutes for air-drying were allowed between coats. Once the 5
coats were applied, the coated petri dish was baked in an oven heated at 120ºC for 10
minutes. The dish was then removed, allowed to cool and the procedure was repeated 3
additional times.
Classic descending growth technique
The method below resembles the methods described previously [31, 49-51]. An
alginate-coated petri dish was carefully filled to the brim, almost overflowing, with
freshly prepared 2% w/v sodium alginate solution (Figure 3-1). A large Kimwipe™
soaked with freshly prepared 0.5M copper sulfate solution was pulled taut like a drum
(using a needlepoint hoop) and brought down directly on top of the alginate-filled petri
dish. The entire surface of the alginate solution and rim of the petri dish were assured to
be in good contact with the soaked Kimwipe™. Over the course of 5-7 minutes at
approximately 10-15 second intervals, 1-2 mL of 0.5M copper sulfate solution was
dripped onto the soaked Kimwipe™ now covering the alginate-filled petri dish. The
soaked Kimwipe™ was then slowly and gently peeled off the alginate filled petri dish. A
solid membrane, contiguous with the rim of the petri dish (~ 1 mm thick) completely
covered the top of the alginate-filled petri dish. This membrane (the primary membrane)
was a little rough, approximately the color of the 0.5M copper sulfate solution and
contained no visible voids. Taking extreme care not to jar the gelling solution, the filled
petri dish was transferred to a large covered tank. The tank’s geometry allowed for a 1.5
to 2 cm submersion of an alginate filled petri dish in 700 mL of the 0.5M copper sulfate

17
solution. The tank was slowly filled with 700 mL of 0.5M copper sulfate, covered,
placed on a leveled table w/anti-fatigue padding and left undisturbed for 36 hours.
9 cm
2 cm Thin Layer of
Baked - on Alginate
Pyrex™ Glass
Petri Dish
2% w/v Alginate Solution
Large Kimwipe™
Soaked in 0.5M CuSO4 Solution
0.5M CuSO4
SolutionPolystyrene Fish Tank
9 cm
Thin Layer of
Baked - on Alginate
Pyrex™ Glass
Petri Dish
2% w/v Alginate Solution
Large Kimwipe™
Soaked in 0.5M CuSO4 Solution
0.5M CuSO4
SolutionPolystyrene Fish Tank
Figure 3-1. Raw-CCAG (RCCAG) classical descending technique synthesis scheme.
Time-lapse videoscopy
Time-lapse videos documenting RCCAG gel growth were made using a Panasonic
model PV-L658 Palmcorder, ATI Rage Fury Pro video capture card, and a Windows 98
PC running C3 Systems WinTLV digital time-lapse videography software.
Barium Stabilized Copper-Capillary Alginate Gel (BCCAG)
We chose barium for the ion-exchange process because it forms an extremely stable
complex with alginate under physiological conditions [45, 46]. Also, previous
experience showed that treatment with barium hydroxide did not grossly alter RCCAG
morphology. However, special precautions were needed because soluble barium is toxic,
and barium hydroxide reacts with carbon dioxide present in air.
Exchange-reactor design and setup
A Teflon™ reactor (~ 250 mL void volume) was used for the barium hydroxide
treatment of RCCAG (Figure 3-2). This minimized the potential for personal contact

18
with the toxic barium hydroxide solution and provided a relatively air-free processing
atmosphere. The reactor was then coupled with reservoirs, a small peristaltic pump,
silicone tubing as plumbing and an ultra-high purity (UHP) nitrogen gas bottle for the
complete setup.
A
B
Figure 3-2. Teflon™ exchange-reactor. A) Top-down view. B) Side view. A Buna-N rubber gasket was inserted into the thin grove, and a glass plate was clamped down on top of the reactor to form a sealed system. Barbed polypropylene screw-in connectors and Buna-N rubber gaskets were also inserted into the inlet-outlet ports.
Barium hydroxide processing
An RCCAG parent gel was cut into thin strips (~ 3 mm) parallel to the capillary
long axis with a stainless-steel kitchen knife. Three long strips were sealed in the
exchange-reactor and washed by flushing a total of 2.3 L of deionized (DI) water through

19
the reactor over 72 hours. The sealed reactor was then purged with UHP nitrogen and
filled (250 mL) with freshly prepared 0.5M Ba(OH)2 solution. The filled reactor was
then placed on an orbital shaker (btb- Back to Basics, Bellco Biotechnology, Vineland,
NJ) for 24 h at 75 RPM. The reactor was again purged with UHP nitrogen and refilled
with 200 mL of 0.5M Ba(OH)2 and shaken for an addition 24 h at 75 RPM on an orbital
shaker. The sealed reactor was again purged with UHP nitrogen, filled with DI water and
shaken for 24 h at 75 RPM; this DI water soak was repeated one additional time. A total
of 3 L of DI water were then flushed through the reactor over 72 hours. The exchange-
reactor was finally unsealed, and BCCAG samples were extracted and stored in DI water
at 4oC for further processing or experimentation.
Oligochitosan-Barium (OBCCAG) and Oligochitosan (OCCAG) Stabilized RCCAG
Chitosan, (a polysaccharide polymer composed of β-1,4' linked glucosamine and
N-acetylglucosamine residues) was chosen for PEC stabilization because much work has
been done producing and characterizing alginate-chitosan multilayer microspheres [40,
55]. Chitosan also appears to have excellent biocompatibility [56], and alginate
microspheres crosslinked with oligochitosan have also been previously reported [47].
Preparation of 2% w/v oligochitosan solution. 2g of oligochitosan were
dispersed in 80 mL of DI water in a 250-mL Erlenmeyer flask. The suspension was then
stirred vigorously until a clear, yellow-brown solution was obtained. DI water was then
added to the solution until the final solution volume was 100 mL yielding a 2% w/v
solution of oligochitosan. Solutions were either used immediately or stored for no more
than a week at 4oC.
Preparation of OCCAG/ OBCCAG. RCCAG samples (3-5) cut into rectangles
(~ 7 mm × 5 mm × 3 cm) were placed into 50 mL centrifuge tubes. Freshly prepared
20
oligochitosan solution (45 mL, 2% w/v) was then added to each and the tubes were then
placed on an orbital shaker for 17-19 hours. Next, the oligochitosan solution was poured
off and the samples were rinsed three times with small volumes (5-10 ml) of DI water.
DI water was then added (45 ml/tube) and the tubes were placed on an orbital shaker
overnight. The DI water was fully exchanged at least once over the next 8-12 hours.
Samples were then stored in a small volume of DI water at 4oC. The procedure to
produce OBCCAG was identical to the above except BCCAG was used as the starting
material instead of RCCAG.
OCCAG/ OBCCAG washing in cell culture medium. Samples were placed
singly in the wells of 6-well cell-culture plates. Three milliliters of cell culture (either
fibroblast or ES differentiation, see below) media containing serum were then added and
the plates were placed in a 37oC incubator overnight. The media was completely
exchanged and the plates were returned to the incubator overnight. After this point, the
scaffolds were used for cell-biology experiments.
Scaffold Characterization
All optical microscopy was conducted on samples just submerged in distilled water
(as this provided the clearest, most consistent images). To freeze-dry materials for SEM
analysis, samples were placed individually in 50 mL polypropylene centrifuge tubes with
3 mL of DI water. Samples were then flash frozen by placing the tubes in liquid nitrogen
for 5 minutes. The flash frozen samples were then freeze-dried (-40oC, 10-15 µm Hg) on
a Labconco lyophilizer (Kansas City, MO) for at least 48 hours.
Optical microscopy
Using a 1 cm inner-diameter stainless-steel cork bore (Precision Tool &
Engineering, Gainesville, FL), a plug the entire height of the parent RCCAG gel was

21
quickly punched out, starting from the bottom parent gel face. The sample plug was
gently pushed out of the bore, and the thin layer of the primary membrane was cut off
with a stainless steel-kitchen knife and aluminum miter box. The core was then
progressively sectioned into discs approximately 3 mm thick. Upper, middle and lower
samples were placed separately in Pyrex™ glass bowls (5 per bowl) and submerged in
100 mL of DI water. Each bowl was covered and stirred on an orbital shaker at 100 rpm
for 72 hours. The water in each bowl was completely changed every 12 hours. After
washing, three discs from upper, middle and lower core sections were observed with an
Olympus SZ stereomicroscope (Tokyo, Japan) equipped with a MiniVID digital camera
(LW Scientifc, Lawrenceville, GA). Optical micrographs were recorded and stored on a
Windows 98 PC using an ATI Rage Fury Pro video capture card running ATI Multimedia
Center software version 6.2. An image of a 25 mm reticle (0.010 mm gradations,
Klarmann Rulings, Inc., Manchester, NH) was also captured to scale the sample images.
Determination and comparison of average capillary diameter as a function of
parent gel thickness. Thirty (30) capillaries from each micrograph were measured using
NIH ImageJ freeware version 1.28u. That data was inputted into Microsoft Excel 97
spreadsheets and average capillary sizes and standard deviations were calculated using
internal Excel functions. ANOVA analysis was performed with Minitab Release 14.12.
Differences were judged significant for p ≤ 0.05.
Scanning electron microscopy
Freeze-dried samples of RCCAG, BCCAG and OCCAG produced previously were
mounted separately onto aluminum SEM stubs with double-sided carbon tabs (SPI
Supplies, West Chester, PA). The mounted specimens were then carbon coated (Ion
Equipment Corp., Santa Clara, CA) and stored until analyzed in a desiccator. All

22
samples were analyzed using a JEOL JSM-6400 SEM (JEOL USA, Peabody, MA)
equipped with an Oxford energy dispersive spectroscopy (EDS) system and a LINK ISIS
software package version 3.35 (Oxford Instruments USA, Concord MA). All samples
were analyzed at 20 KeV accelerating voltage to maintain consistency with the
standardless digital library. This accelerating voltage is more than sufficient to observe
all X-ray peaks of interest with EDS. Image processing was performed utilizing features
available in the LINK ISIS software package.
Percent Water Content Determination
Five small, previously washed samples from RCCAG, BCCAG and OCCAG each
were equilibrated in a minimum of distilled water in 50 ml conical centrifuge tubes for
one week. After equilibration, the samples were removed, blotted to dryness on a
Kimwipe™, placed in a pre-weighed 15 ml conical centrifuge tube, weighed and
recorded. The samples were then re-submerged in a minimum of distilled water and flash
frozen in liquid nitrogen and lyophilized for 48 hours. After lyophilization, the tubes
w/sample were re-weighed and recorded. The difference between the initial and final
weights was attributed solely to the loss of water during drying. ANOVA analysis was
performed with Minitab Release 14.12. Differences were judged significant for p ≤ 0.05.
Biological Assesment
All regular cell maintenance such as media changing, cell splitting, etc. was
performed solely by Dr. Takashi Hamazaki of the Terada group, Department of
Pathology, University of Florida. All Cell seeding, maintenance and documentation of
scaffold culture experiments were done jointly with Dr. Hamazaki. Fluorescence
microscopy was performed with an IX-70 Olympus/C Squared equipped with a
MagnaFire digital camera system and software package (Optronics). Confocal

23
microscopy was performed by Marda Jorgensen, Departement of Pathology- Stem Cell
and Regenerative Medicine Program, University of Florida using a Leica TCS SP2
AOBS Spectral confocal microscope equipped with laser point scanning (405-633 nm)
and proprietary software (Leica Microsystems Inc., Buffalo, New York).
Maintenace of mouse Swiss Albino embryonic fibroblasts expressing green-
fluorescing protein (GFP-3T3) cells. GFP-3T3 cells were maintained in tissue culture
dishes (6 cm, 2 X 10⁵ cells) in Dulbecco’s® Modified Eagle Media (DMEM, GIBCO
BRL, Grand Island, NY) containing 10% fetal bovine serum (FBS, Atlanta biologicals,
Norcross, GA), 2 mM L-glutamine, 100 units/ml penicillin, 100 µg/ml streptomycin, 25
mM HEPES (GIBCO BRL). Media (termed fibroblast media) was changed every two
days and the cells were split upon reaching ~ 2 X 10⁶, 80% confluence.
Maintenace of mouse embryonic stem cells expressing green-fluorescing
protein (GFP-mES). GFP-mES cells were maintained in an undifferentiated state on
gelatin-coated dishes (6 cm, 4 X10⁴ cells) in Knock-out DMEM (GIBCO BRL, Grand
Island, NY) containing 10% knockout serum replacement (KSR, GIBCO BRL), 1% FBS
(Atlanta biologicals, Norcross, GA), 2 mM L-glutamine, 100 units/ml penicillin, 100
µg/ml streptomycin, 25 mM HEPES (GIBCO BRL), 300 µM monothioglycerol (Sigma,
St. Louis, MO), and 1000 unit/ml recombinant mouse Leukemia inhibitory factor (LIF,
ESGRO) (Chemicon, Temecula, CA). Media (termed ES maintenace media) was
changed every two days and the cells were split upon reaching ~ 2 X 10⁶, 80%
confluence.

24
In Vitro Study: Swiss Albino Embryonic Mouse Fibroblasts Expressing Green Fluorescent Protein (GFP-3T3)
It was not known if CCAG-derived scaffold would be relatively non-toxic to cells
in in-vitro cell culture. Hence, two circular OCCAG scaffolds (~ 8 X 3 mm) were placed
singly into a six-well tissue culture plate (Nalge Nunc International, Rochester, NY).
GFP-3T3 cells were first dissociated by using 0.25% trypsin/EDTA (GIBCO BRL) and
then re-suspended in the GFP-3T3 culture media (see above). To seed the cells, a total of
200 µl of the cell suspension (1 X 10⁶ cells/ml) was applied to one end of the capillaries
while applying vacuum to the other capillary ends. Cell-scaffold combos were then
cultured for one week in fibroblast media. The combos were observed daily with the
fluorescence microscope and the media was changed every two days. Confocal
microscopy was performed on select samples at day 2 in culture.
In Vitro Study: Mouse Embryonic Stem Cells Expressing Green Fluorescent Protein (GFP-mES)
Undifferentiated ES cells were dissociated using 0.25% trypsin/EDTA (GIBCO
BRL). ES cells were suspended in Iscove's Modified Dulbecco's Medium (IMDM),
supplemented with 20% fetal bovine serum (Atlanta biologicals), 2 mM L-glutamine, 100
units/ml penicillin, 100 µg/ml streptomycin (GIBCO BRL), and 300 µM
monothioglycerol (Sigma). This media was termed “ES differentiation media”. To seed
ES cells into OCCAG scaffolds, a total 200 µl of the cell suspension (1x10⁶ cells/ml) was
applied from one end of the capillaries while suctioning the fluid from the other end of
the capillaries.
Evaluation of mES cell growth, survival and morphology vs. time
No previous data was available to inform one’s intuition about mES cell behavior
when seeded and cultured in CCAG-derived scaffolds. Therefore, 4 OCCAG scaffolds

25
cut into rectangular blocks were seeded, placed singly into a six-well culture plate (Nalge
Nunc International) and cultured in ES maintenance media for nine days. Cell-scaffold
combos were observed daily and the media was changed every two days. Fluorescence
micrographs were recorded at days 0, 6 and 9 and confocal microscopy was performed on
select samples at day 7 in culture.
Comparison of ES maintenance (LIF+) and ES differentiation (LIF-) media conditions
It was not known if mES cells seeded in OCCAG scaffolds and cultured under cell
differentiation conditions behaved differently in terms of cell survival and proliferation
than cells seeded and cultured under cell maintenance (undifferentiated) conditions. To
that end, we conducted a four day study using ES maintenance or ES differentiation
media. The four day end point was chosen because previous experience and reported
studies [57] indicated that mES cells are in the early phases of cell fate determination
when cultured in ES maintenance media, i.e. media lacking LIF.
Six OCCAG scaffolds cut into rectangular blocks (~ 10 X 5 X 3 mm) were seeded,
placed singly into a six-well culture plate (Nalge Nunc International) and cultured over
four days under one of three different media conditions:
• mES maintenance medium (LIF+) only • mES maintenance (LIF+) / mES differentiation (LIF-), switched at day 2 in culture. • mES differentiation (LIF-) only

26
CHAPTER 4 RESULTS AND DISCUSSION
Scaffold Synthesis and Processing
Scaffold synthesis was successful overall, albeit an underestimated challenge.
Early on it was discovered that RCCAG dissolved over the course of several hours (<24
h) in standard cell culture media likely due the chelation and/or ion-exchange of Cu2+.
An attempt to covalently crosslink RCCAG with ethylene diamine utilizing carbodiimide
chemistry was made, however, the attempt failed due again to the rapid chelation of Cu2+
by ethylene diamine. Ethylene diamine solution dissolved the RCCAG within a matter of
minutes. Other synthetic techniques to crosslink the raw material were avoided in
deference to the end-use as a biomaterial. These complications led to the successful
attempts to stabilize RCCAG via ion-exchange with Ba2+ ions and/or formation of a
polyelectrolyte complex with oligochitosan (below). Although the synthesis procedures
described in the Materials and Methods section of this text are far from optimized, they
were adequate to produce gram scale quantities of all the new scaffolding materials.
RCCAG
Production of this material was the most straightforward because it had already
been investigated. As previously reported, coating the petri dish with a thin film of baked
alginate proved necessary. However, the temporary use of a Kimwipe™ to aid in the
formation of a regular primary membrane was a new addition to the general RCCAG
synthesis method. Significant amounts of waste copper sulfate solution were also
produced and the raw material had to be washed extensively to rid it of excess copper

27
sulfate. The amount of waste produced makes the material less attractive for large scale
production.
RCCAG was a homogenous translucent sky blue due the Cu2+ ions crosslinking it
and was also the most durable of the materials produced in this work. It did not tear
easily and regained its original shape after compression. Cutting the material parallel to
the long capillary axis was much more difficult than cutting perpendicular to the long
axis. This anisotropy is presumably due the fact that the alginate chains are preferentially
oriented perpendicular to the long capillary axis [31, 48-49].
Growth videos
Successful video monitoring of the entire RCCAG synthesis process was achieved.
The use of time-lapse videoscopy (TLV, video 4-1) was a powerful technique yielding
not only kinetic data, but also clearly illustrated the fact that RCCAG “grows” via a self-
assembly process. The most fundamental reaction occurring is the binding of Cu2+ ions
by alginate molecules in solution; all other processes (chain contraction, formation of
convective tori) resulting in the material’s structure and anisotropic properties stem from
this action.
Growth kinetics
Kinetic data obtained from RCCAG growth TLVs are of particular engineering
interest. Figures 4-1 and 4-2 summarize our key kinetic findings. In a previous study,
Schuberth [31] puts forward the idea that gel growth follows the so-called square law
(equation 4-1and 4-2). It was confirmed in that study that RCCAG growth behavior is
approximated by the square law at least within the first hour of gel growth.
1)-(4 Dt2yπ
=

28
Where
D: Diffusion Coefficient (cm2/s) and
t: Diffusion Time (s)
y : Diffusion Path Length/Gel Thickness (cm)
Hence,
2)-(4 ty ∝
Our kinetic data do confirm that equation 4-2 reasonably approximates the very
beginning of gel growth assuming πD2 ≈ 0.02 cm/min. However at longer growth times
past this initial phase the square law model significantly under-predicts the gel thickness.
A power fitted model of the observed data suggests a value of 0.6 rather than 0.5 for the
value of the exponent. The 1st derivative plots also support this contention. The gel
growth rate is also apparently decreasingly settling within a range of 0.001 - 0.002
cm/min. It is unclear how this reported value of the RCCAG growth rate specifically
compares with other studies [31, 58], but Schuberth does report that growth rates are ca.
25% slow in gels lacking capillaries and asserts that an overlay of convection in the
capillaries could account for this difference.
Storage concerns
During the early phases of this project, it was decided to store the RCCAG in some
formation buffer (0.5M CuSO4) at 4oC in a commercial polymer container called
FoodKeepers™ by Anchor Hocking. At the time it was tacitly assumed that the
container was “resistant” and would not contaminate the RCCAG with soluble
degradation products. Later research into the exchange reactor material design however
indicated that CuSO4 solution could be caustic to a wide range of polymers over long

29
exposure of times. Unfortunately, details of the Foodkeepers™ polymer composition
were difficult to find since the brand has been discontinued for many years, but the dishes
are very rigid and heat resistant, perhaps similar to a phenolic or melamine type resin.
Hence, at the current time it is impossible to rule out the possibility that the storage
container contaminated the RCCAG with biologically active degradation products;
though it can be stated with confidence that this possibility is remote at best given the
extensive washing regime undertaken during production.
BCCAG
This material was the most challenging to produce. BCCAG was also the most
interesting from a materials perspective and proved to be quite stable in cell culture
media. However, BCCAG had the poorest handling qualities tending to crumble or
fracture readily. This limitation, coupled with its demanding synthesis, limited the study
of BCCAG as a scaffold to a few rough cell culture experiments (data not shown).
Colorimetric changes during barium hydroxide treatment
When RCCAG samples were initial submerged into 0.05M Ba(OH)2 solution they
floated due to a difference in density. However, within minutes the samples sank and this
sinking was accompanied by a color change of sample edges from sky blue to royal blue.
This color change uniformly proceeded into the core of the samples over the course of
many hours. Sample cores then began to blacken sometime between 12-24 h of
treatment, and this blackening was further enhanced during the washing of the newly
formed BCCAG in DI water.
The above colorimetric changes can be explained by the formation of different
copper compounds within RCCAG samples during barium hydroxide processing. The
initial color change from translucent sky blue to royal blue corresponded to the reaction

30
of Cu2+ ions with hydroxide ions to form copper hydroxide (Reaction 4.1) which is often
described as a pale blue gelatinous water insoluble precipitate.
Cu2+(aq) + 2OH-(aq) → Cu(OH)2(s) 4.1
Although the term “pale” seems inconsistent with the above description, concentration
and matrix effects presumably influence the apparent copper hydroxide color intensity.
The progressive blackening of the core was due to the progressive formation of
copper II oxide (Reaction 4.2).
Cu(OH)2(s) + Heat → CuO(s) + H2O(l) 4.2
Copper II oxide is often described as a black or golden brown insoluble precipitate
formed by heating copper hydroxide. The heat released by the formation of copper
hydroxide in the RCCAG possibly drove its own decomposition to copper II oxide within
the gel (Figure 4-7).
Exchange-reactor advantages and difficulties
The exchange reactor was a tremendous advantage during barium hydroxide
possessing. Barium hydroxide is caustic and toxic and readily absorbs carbon dioxide
from the air. The exchange reactor provided a means of exposing large amounts of
RCCAG to barium hydroxide solution under an atmosphere of UHP nitrogen, and a
means of flushing the solution directly to waste. The newly produced BCCAG could
then be extensively washed with water under nitrogen as well. What was at the onset a
tedious and precarious task of filling and draining flasks of toxic solutions was reduced to
filling appropriate reservoirs; the plumbing of the exchange-reactor minimized the human
interaction with toxic effluents. This system was far from perfect though.

31
The placement of the inlet and outlet ports complicated reactor filling and draining.
Also, the silicone tubing serving as plumbing had a tendency to split during long
pumping cycles resulting in a significant reactor leak. Finally, it was difficult to maintain
a low, consistent flow rate with the peristaltic pump used. Despite these short comings,
BCCAG was reproducibly produced in sufficient quantity for further study.
OBCCAG and OCCAG
Only OCCAG was successfully produced utilizing the synthesis protocols
described in this work. Fortunately, this material was well suited for use in biological
experiments (below) due to its optical clarity and ease/reproducibility of production.
OCCAG was inhomogeneously colored in cross-section, composed of a yellowed outer
surface with a blue-green core. This inhomogeneity is likely the result of differential
crosslinking of the exterior and core by the 2% w/v oligochitosan solution. Apparently, a
more densely crosslinked skin of alginate:oligochitosan PEC formed around samples of
OCCAG.
Overexposure or overreaction is a concern and possibility for any chemical
crosslinking procedure of polymeric materials and CCAGs are no exception. The
oligochitosan is a multifunctional crosslinker forming ionic rather than covalent bonds.
The electrostatic bonding between the RCCAG or BCCAG and oligochitosan happens
essentially instantaneously. Slightly to moderately overexposed rectangular samples
began to round at the corners and distort as the overcrosslinked PEC skin contracted on
the low modulus gel core. This skin was also darkly stained brown which negatively
impacted its optical qualities. It was also found in an early set of experiments that
RCCAG stiffened, turned dark brown and profoundly shrunk when severely overreacted

32
in an excess of 2% w/v oligochitosan solution (reaction times ≥ 24 hours). Syneresis of
the gel likely accompanied these profound changes.
A reaction time range of 17 to 19 hours was therefore used in this study to stabilize
both RCCAG and BCCAG with 2% w/v oligochitosan solution. This exposure time
resulted in no significant change in the materials’ original size and morphology, and the
materials were only slightly yellowed in color after the reaction. OBCCAG synthesis
however failed during the cell culture media wash.
Consequences of Media Wash
Media washing is technically the final step in scaffold processing because material
changes occur during the process. All of the copper present in the scaffolds as free ions
or otherwise appears to be removed with successive washes in media. This effectively
dissolved the water insoluble copper hydroxide and oxide particles present in BCCAG.
Free copper ions are also apparently leached or chelated serving to decolorize the
scaffold. The result is a translucent scaffold colored the same as the phenol red spiked
media itself. This result was great because it facilitated the use of advance microscopic
techniques to observe the cells in situ, alive and dynamic. The OCCAG results were
similar the BCCAG results, but OBCCAG collapsed and stiffened when washed in
media, reminiscent of the earlier overcrosslinked RCCAG and consequently was never
used in cell culture experiments.
Scaffold Characterization
A broader characterization regime was initially envisioned for the materials
developed in this project. In fact, XPS, XRD and TEM measurements were all attempted
but yielded poor and/or inconclusive results. Technical difficulties encountered in
sample preparation were essentially to blame for the poor results. As the project

33
progressed, timing and the high demand for scaffolds for the biological assessment
stunted further pursuit of XPS, XRD and TEM measurements. Also, at the time it was
not clear what measures were most germane and how best to design experiments aimed at
acquiring them.
Therefore, the characterization data presented below is not comprehensive;
however, the optical microscopy (OM), scanning electron microscopy (SEM) and the
small swelling studies reported here provide a solid foundation for future work. The OM
studies essentially report on RCCAG morphology; the SEM studies describe the
morphology and composition (via energy dispersive spectroscopy, EDS) of RCCAG,
BCCAG and OCCAG before cell culture media processing. The swelling study was an
attempt to elucidate possible differences in the materials’ equilibrium water contents
resulting from the different crosslinking/ stabilization methods.
Optical Microscopy
The Olympus SZ equipped with the MiniVID camera provided an effective and
comparatively inexpensive digital capture microscope system. The images captured with
this setup were more than adequate for obtaining quantitative measurements. This digital
stereomicroscope also gave a fair idea of surface topography.
RCCAG
Figure 4-3 and 4-4 show representative micrographs of RCCAG samples cut from a
parent gel. The average capillary diameter of three representative areas at each gel level
is given in figure 4-5. This graph also shows that the average capillary diameters for all
samples in the upper gel level group differed significantly from each other (p < 0.05);
only one sample was judged to have a significantly different average capillary diameter
in the middle and lower gel level groups.
34
The fact that at least one of the average capillary diameters within each group in
figure 4-5 differed from the others supports the idea that either the capillary diameters
within a given gel levels are not uniform or that there was significant systematic error
involved in sample sectioning. The latter is likely the case for this set of experiments. In
fact, the sectioning method described in the Materials and Methods chapter turned out to
be somewhat crude, yielding both imprecise and inaccurate results. Section thickness
was therefore variable, sometimes differing by a millimeter or more. It is also unclear if
the above data is comparable to previously conducted studies [31, 49].
Figure 4-6 presents calculated RCCAG metrics germane to tissue engineering
derived from the average capillary data. Because all of the upper gel level samples
differed significantly from each other, only the smallest average capillary diameter was
used to calculate the subsequent metrics. Middle and lower gel level metrics were
calculated from pooled capillary diameter data of samples that were judged statistically
similar by ANOVA (p ≥ 0.05). The error bars given for the average capillary diameters
are the standard deviations.
Despite the limitations discussed above, capillary diameter is undeniably a function
of gel thickness. Hence, it is tempting to conclude that the apparent differences in the
calculated metrics are significant and are also subsequently a function of gel thickness;
the story is less clear for the percent free space. The following trends are clear from the
graph: capillary density ↓ with ↑ gel thickness and the average surface area in a standard
disc ↓ with ↑ thickness.
Evidence of precipitates within BCCAG
Figure 4-7 and 4-8 are representative micrographs showing brown and shimmering
particles within BCCAG samples. The precipitate shown in figure 4-7 appears golden-

35
brown (presumably due to lighting) and is the same formation responsible for the
progressive blackening described in the scaffold synthesis section above. This datum
further supports the claim that copper II oxide has precipitated with the capillaries of
BCCAG due to processing in barium hydroxide solution. The shimmering particles are
believed to be insoluble barium sulfate and/or carbonate crystals formed within the walls
of BCCAG during synthesis.
Scanning Electron Microscopy/Energy Dispersive Spectroscopy (SEM/EDS) and X-ray Mapping
The SEM/EDS and X-ray mapping studies yielded a wealth of data concerning the
sample morphology, bulk composition and elemental distribution within samples Despite
the analysis not being optimized for imaging, high quality secondary (SEI) and
backscatter (BSE) images were still obtained. Relatively short collection times (ca. 20
min.) coupled with image processing functions like smoothing and contrast enhancement
provided informative X-ray maps with an economy of time.
Consequences of freeze-drying
Freeze-drying had several effects on the studied materials. RCCAG densified and
the once circular capillaries turned pentagonal or hexagonal. This is especially visible in
the BSE image in figure 4-9B. BCCAG became very fragile and powdered if handle too
much, but maintained circular capillaries (Figure 4-10A). OCCAG did not become
fragile but maintained circular capillaries (Figure 4-12A). All materials however tended
to flake into sheets perpendicular to the capillary long axis.
RCCAG Data
Figure 4-9 is a summary of representative RCCAG SEM/EDS and X-ray mapping
data. The secondary image (4-9A) shows irregularly shaped capillaries, but the

36
backscatter image (4-9B) shows that these shapes are likely artifacts of sample
preparation. The backscatter signal is more sensitive to mass-thickness than is the
secondary signal, and it appears that the irregularly shaped capillaries are really the result
of thin sheets or flaps of RCCAG that have fallen over the capillaries at some point in the
sample preparation. Hence, the densified hexagonal and pentagonal walls or RCCAG
beneath the thin sheets is highlighted in the BSE image. This morphology has been seen
previously in earlier experiments with RCCAG (data not shown).
EDS analysis shows that RCCAG is essentially composed of carbon, oxygen and
copper (Figure 4-9C). The carbon and oxygen are the sole components of the alginate
polymer and the copper is the crosslinker responsible for the capillary structure. Low
amounts of silicon and sulfur also appear in the representative spectrum and presumably
came from the alginate powder used to make the 2% w/v sodium alginate solution and
residual copper sulfate used in gel synthesis respectively (Ch. 3, Materials and Methods).
Caution should be exercised when attempting to assess the amounts of elements from any
EDS spectrum. Peaks of elements that are actually present in high concentrations
(particularly low Z elements) can appear smaller than peaks of elements present in small
concentrations. The correction matrix is complicated and the variables used are usually
poorly known for low atomic number elements leading to semi-quantitative data at best.
The X-ray map group (figure 4-9D) shows low levels of silicon within the RCCAG
walls; sulfur is also present to a lesser degree in the walls, but appears more concentrated
in discrete particles. Copper appears uniformly distributed over the whole map area and
it is not possible to discern the capillary structure in the copper map. This is due to the
large interaction volume of the X-ray signal (especially in a polymeric material) and the

37
relatively energetic nature of the copper Kα X-ray. The X-ray signal comes form “deep”
within the material (perhaps > 1 µm) and the Cu Kα is not significantly absorbed by
anything else in the sample resulting in a homogenous looking copper map.
BCCAG Data
BCCAG was the most complex material produced in this study. Figure 4-10 is a
representative summary of BCCAG SEM/EDS and X-ray mapping data. Figure 4-11 is a
higher magnification study highlighting copper-rich nano-particulate formations within
BCCAG. The SEI BCCAG image (figure 4-10A) shows that the capillaries have
remained circular and the material does not appear to have densified like RCCAG.
Excellent BSE images were obtained due to the material’s barium content (Figure 4-
10B).
The representative EDS spectrum (4-10C) indicates that BCCAG is mainly
composed of carbon, oxygen, copper and barium. Strontium also appears in the
spectrum, overlapping in the same energy range as silicon (Figure 4-9C). Silicon could
be present but masked by strontium that apparently came from the barium hydroxide
solution. The small aluminum peak is possibly due to scatter from the SEM mount.
Figure 4-10D, the BCCAG X-ray map group, is markedly different from the
RCCAG map group (figure 4-9D). Barium now appears homogenously distributed
throughout BCCAG, supplanting copper; strontium also appears uniformly distributed.
The majority of the copper signal is localized to the “bumpy” particles lining inner
capillary diameters. Figure 4-11A and C are higher magnification SEI images of the
copper-particles; figure 4-11B is the complementary BSE of 4-11A. 4-11E is an X-ray
map group of the same area as 4-11A taken to more clearly illustrate the distribution of
elements within BCCAG. Sulfur rich areas also appear in this map group which are

38
believed to correspond to the shimmering particles noted in BCCAG optical microscopy
above.
A complex series of physicochemical events occur during barium hydroxide
processing of RCCAG. Upon submersion in the barium hydroxide solution, copper
hydroxide begins to form in the outer surfaces and edges of the material. As the barium
and hydroxide ions diffuse into the RCCAG matrix and capillaries, Cu2+ ions react with
the OH- ions forming insoluble copper hydroxide at all material-solution interfaces. As
the reaction proceeds, Cu2+ ions at the interface are depleted, stimulating migration of
Cu2+ ions from within the material down their concentration gradient. Copper ions
migrating to the material-solution interface react with the essentially infinite sink of
solution hydroxide ions forming more insoluble copper hydroxide concentrated at the
interface. Heat produced from the formation reaction is not dissipated efficiently within
the RCCAG sample, and thus drives the dehydration of the newly formed copper
hydroxide to copper oxide over time.
The above ideas are not intended to apply to all copper within BCCAG.
Examination of the BCCAG X-ray map groups clearly shows copper within the BCCAG
matrix. However, a comparison of the RCCAG and BCCAG X-ray map groups also
shows a change in the distribution of copper and it is this change that the above theory
attempts to explain.
Concomitantly, barium ions exchange with copper ions and/or form new ionic
crosslinks within the gel, stabilizing its structure. This exchange presumably influences
the migration of Cu2+ ions to material-solution interfaces. Residual SO42- and dissolved
CO32- ions also react with diffusing Ba2+ ions forming insoluble salt crystals within the

39
RCCAG matrix (Figures 4-11D and 4-12). These crystals result in the “shimmering”
optical micrographs discussed above.
OCCAG Data
Figure 4-13 is a summary of the representative OCCAG SEM/EDS and X-ray
mapping. 4-13A shows that OCCAG has also retained circular capillaries, but the
material’s surface appears “hairy”. This surface character can be more easily seen in the
higher magnification SE image shown in figure 4-14. The striated layer structure of the
RCCAG has also been preserved. The OCCAG EDS spectrum (4-13C) appears similar to
the RCCAG EDS spectrum shown earlier with the addition of small amounts of chlorine.
Closer inspection of 4-13C shows a much higher carbon and oxygen intensity as well as a
reduced copper intensity in contrast to figure 4-9C, probably due to oligochitosan
processing.
The oligochitosan is a polymeric crosslinker composed mainly of carbon and
oxygen. Oligochitosan ionically crosslinks RCCAG (from the surface inwards) via a
positively charged amine functionality. Hence, oligochitosan processing results in a
carbonaceous film on the surface of OCCAG which would contribute to the higher
carbon and oxygen intensities, as well as damping the measured copper intensity. The
amine residues could also leach Cu2+ ions from the RCCAG, further contributing to the
drop in measured copper signal.
Summary of morphologic and compositional analysis
RCCAG has a smooth surface with pentagonal and hexagonal shaped capillaries
and a densified structure due to freeze-drying. The material is composed of mainly
carbon, oxygen and copper with low amounts of silicon and sulfur. All elements, with

40
the exception of sulfur, appear uniformly dispersed in RCCAG; sulfur appears
concentrated in particles.
BCCAG has circular capillaries and the structure does not appear to have changed
due to dehydration. This material is composed mainly of carbon, oxygen, barium and
copper with low amounts of strontium and sulfur. Barium and strontium appear
homogenously distributed throughout the material. Copper is concentrated in
nanoparticles located on the inner capillary surfaces giving a bumpy appearance and
sulfur appears as particles in and on BCCAG.
OCCAG has circular capillaries and the structure also does not appear to have
changed due to drying. Similarly to RCCAG, OCCAG is composed mainly of carbon,
oxygen and copper, however the relatively intensities of these elements are different.
Carbon and oxygen appear greater while copper appears lower presumably due to the
carbonaceous surface coating resulting from oligochitosan crosslinking. The copper
content of OCCAG may have also been depleted via complexation with the oligochitosan
in solution.
Equilibrium Water Weight Percent Analysis
Figure 4-15 shows the results of the small swelling study comparing the different
CCAG crosslinking methods. Although the graph suggests that RCCAG contains the
highest equilibrium water weight percent followed by OCCAG and then BCCAG, no
significant differences between the groups were indicated by ANOVA analysis (p ≥
0.05). The study should be repeated with larger sample sizes and a revised experimental
procedure. The procedure implemented for wet sample weight measurement in this
experiment was the largest source of systematic error.
41
Biologic Assessment
Initially, this work was motivated to aid peripheral nerve regeneration by
developing synthetic biomaterial mimics of the endoneurium. The requisite materials
were developed, but neuroregenerative testing was frustrated mainly due to the lack of a
motivated, expert collaborator. This was a blessing in disguise however, as expert stem
cell biologist collaborators (The Terada Group, Department of Pathology, University of
Florida) did enthusiastically participate in in vitro scaffold testing.
The main point of the biological experiments discussed below was to assess 1) if
cells could be seeded in and on the newly developed scaffolds and 2) if these seeded cells
could survive and proliferate over the course of several days. Initially it was hoped that
BCCAG, OBCCAG and OCCAG could all be tested, however the only reportable data
came only from OCCAG experiments. First we tried to seed and grow green fluorescent
mouse embryonic fibroblast (GFP-3T3) cells in OCCAG scaffolds, but obtained a limited
data set. Later we switched to a green fluorescent mouse embryonic stem cell line and
were able to conduct multiple experiments.
The results presented below show that cells, mouse embryonic stem cells (mES)
mainly, can be seeded into OCCAG scaffolds, and that these cells survive and proliferate
over the course of many days. Furthermore, mES cells form ordered cylindrical
structures when seeded and grown in OCCAG scaffolds. Hence, the claim that CCAG-
derived scaffolds can impose structural order on growing cells via architecture and
geometry is well supported.
Mouse Embryonic Fibroblasts (GFP-3T3)
GFP-3T3 cells were initially chosen because they are robust, highly proliferative
cells that were in good supply. Also, fibroblast migratory behavior has been reported on

42
previously [59] and it was hoped that this behavior would be observed for direct
comparison. Unfortunately, the GFP-3T3s available appeared to have the same diameter
as the capillaries (~ 25 µm) and were not easily seeded into the OCCAG scaffolds. This
significantly limited the possible experimental work. Figure 4-16 and video 4-2 are a
representative micrograph and confocal microscopy video from an early GFP-3T3 study
respectively.
The relative clarity and translucence of the OCCAG scaffold provided for
reasonably good fluorescent and confocal images. The confocal video shows the
morphology of GFP-3T3 cells up to ca. 100 µm deep (perpendicular to the capillary long
axis) in the scaffold after two days in culture. Cells within capillaries usually appear
deformed, taking on a pill-like shape. Multicellular aggregates appear clumped on the
outer surface of the OCCAG sample. This possibly indicates that OCCAG is not very
adhesive to cells as they prefer clump together rather than attach and spread on the
materials surface. Cells confined within the capillaries typically did not survive more
than 2-3 days and did not appear to proliferate. Large vacuous regions observed within
the GFP-3T3s were also taken as a sign of poor cell health. Given the above results, it
was decided to switch to a different GFP expressing cell line.
Mouse Embryonic Stem Cells (GFP-mES)
Mouse embryonic stem cells are ~12 µm in diameter, ca. half that of the GFP-3T3s
used above. It was therefore hoped that since the cells would no longer be squeezed into
capillaries, they would survive and proliferate better. GFP-mES were also in good
supply and the collaborating researchers were well published mES experts. This hope
was realized and the results are shown in Figures 4-17 – 4-20 and video 4-3.

43
Evaluation of cell Growth, survival and morphology vs. time
Figure 4-18 shows phase contrast and complementary fluorescence micrographs
documenting the survival, proliferation and morphology of GFP-mES cells cultured in
OCCAG scaffolds over nine days. Since the GFP-mES cells constitutively expressed
GFP, expression past 36 hours was taken as an indicator of cell viability. The cells
usually seeded as small groups lined up in the capillaries (Figure 4-17A, B).
At day 6, the cells had proliferated heartily and formed cylindrical structures within
a few OCCAG capillaries. The cells had proliferated so well in some cases that they had
escaped from the ends of capillaries and clumped into spherical structures (Figure 4-
17D). These “Papillon” cell structures were judged to resemble embryoid bodies, a
formation seen regularly in ES cell culture. Day 9 shows an extension of the behavior
observed at day 6 with more capillaries filled. A group of cellular bulges seen in the
central portion of the 4-17F toward the top possibly shows the expansion of cells out of
their initial capillary.
Although care was taken to use OCCAG with an average capillary diameter
between 20-30 µm (mid parent gel level) for this experiment, inspection of the
micrographs indicates that the gels used possessed capillaries with diameters > 35µm
(lower parent gel level). The mES cylindrical formations also appeared to have expanded
the capillary diameter to ~ 40-50 µm. Fortunately, this larger than expected capillary
diameter did not critically affect the present experiment, but better tracking of this
variable will be required in the future.
Confocal microscopy and video data
Figure 4-18 and video 4-3 are a representative confocal micrograph and confocal
microscopy video taken at day 7 of the samples in the nine day experiment above. The
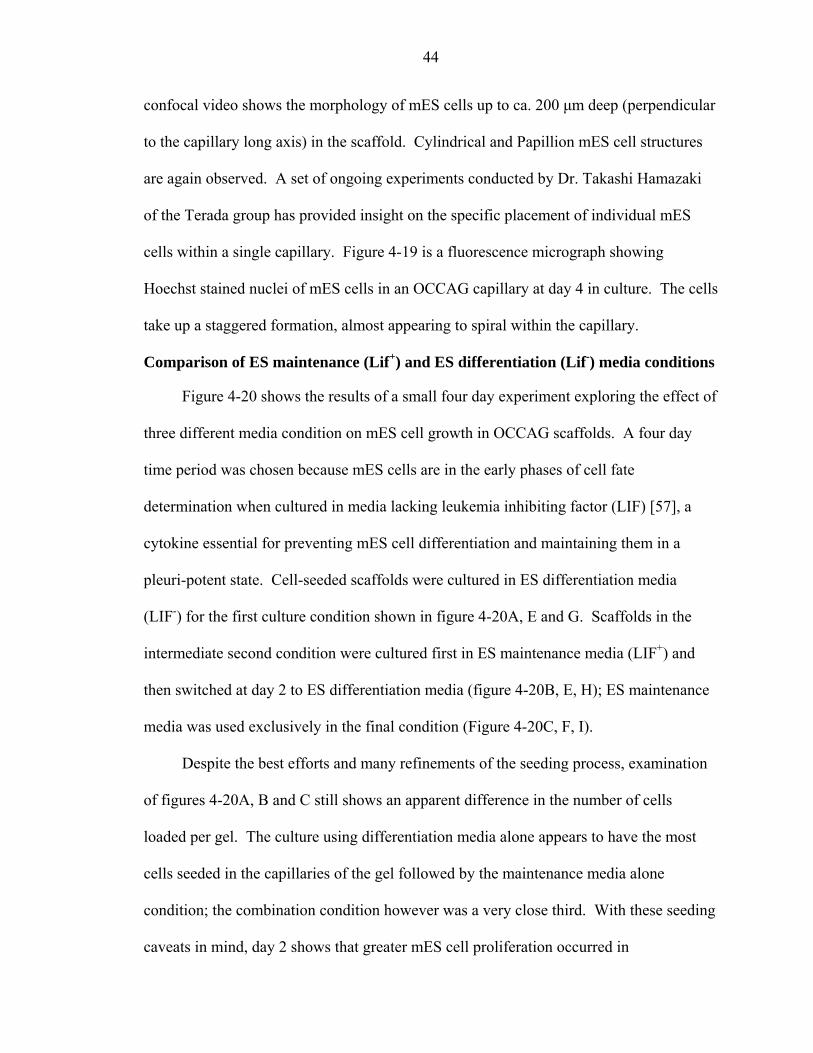
44
confocal video shows the morphology of mES cells up to ca. 200 µm deep (perpendicular
to the capillary long axis) in the scaffold. Cylindrical and Papillion mES cell structures
are again observed. A set of ongoing experiments conducted by Dr. Takashi Hamazaki
of the Terada group has provided insight on the specific placement of individual mES
cells within a single capillary. Figure 4-19 is a fluorescence micrograph showing
Hoechst stained nuclei of mES cells in an OCCAG capillary at day 4 in culture. The cells
take up a staggered formation, almost appearing to spiral within the capillary.
Comparison of ES maintenance (Lif+) and ES differentiation (Lif-) media conditions
Figure 4-20 shows the results of a small four day experiment exploring the effect of
three different media condition on mES cell growth in OCCAG scaffolds. A four day
time period was chosen because mES cells are in the early phases of cell fate
determination when cultured in media lacking leukemia inhibiting factor (LIF) [57], a
cytokine essential for preventing mES cell differentiation and maintaining them in a
pleuri-potent state. Cell-seeded scaffolds were cultured in ES differentiation media
(LIF-) for the first culture condition shown in figure 4-20A, E and G. Scaffolds in the
intermediate second condition were cultured first in ES maintenance media (LIF+) and
then switched at day 2 to ES differentiation media (figure 4-20B, E, H); ES maintenance
media was used exclusively in the final condition (Figure 4-20C, F, I).
Despite the best efforts and many refinements of the seeding process, examination
of figures 4-20A, B and C still shows an apparent difference in the number of cells
loaded per gel. The culture using differentiation media alone appears to have the most
cells seeded in the capillaries of the gel followed by the maintenance media alone
condition; the combination condition however was a very close third. With these seeding
caveats in mind, day 2 shows that greater mES cell proliferation occurred in
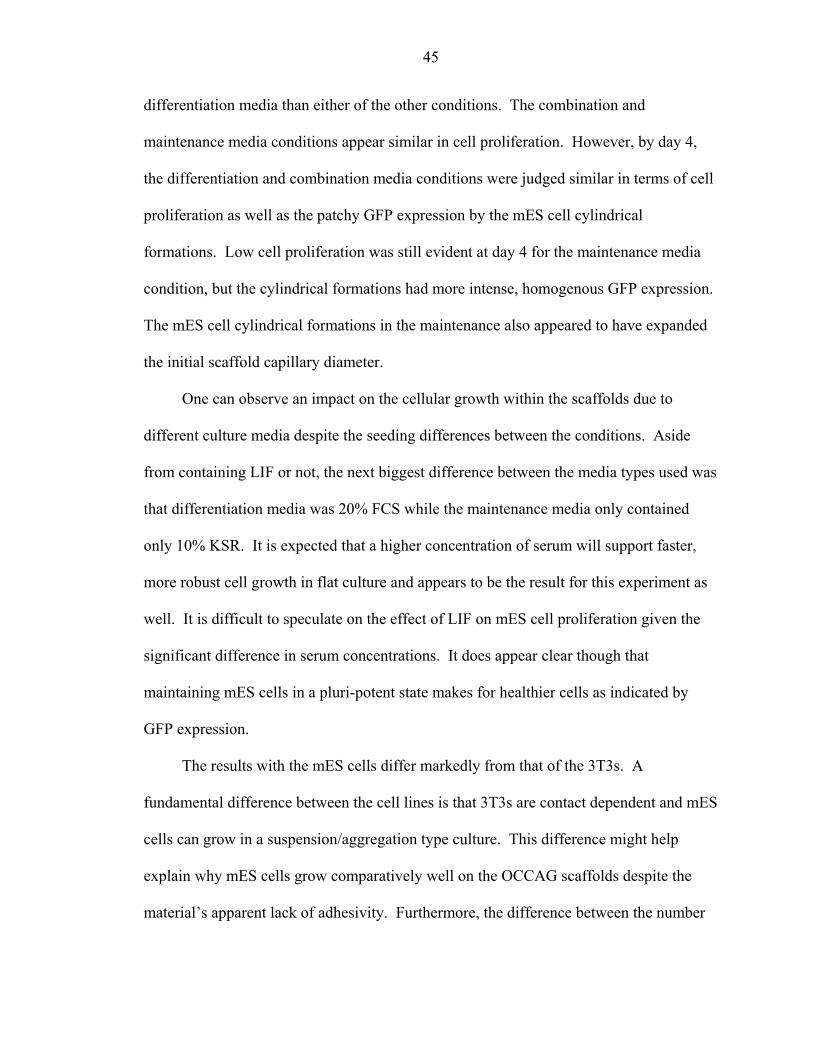
45
differentiation media than either of the other conditions. The combination and
maintenance media conditions appear similar in cell proliferation. However, by day 4,
the differentiation and combination media conditions were judged similar in terms of cell
proliferation as well as the patchy GFP expression by the mES cell cylindrical
formations. Low cell proliferation was still evident at day 4 for the maintenance media
condition, but the cylindrical formations had more intense, homogenous GFP expression.
The mES cell cylindrical formations in the maintenance also appeared to have expanded
the initial scaffold capillary diameter.
One can observe an impact on the cellular growth within the scaffolds due to
different culture media despite the seeding differences between the conditions. Aside
from containing LIF or not, the next biggest difference between the media types used was
that differentiation media was 20% FCS while the maintenance media only contained
only 10% KSR. It is expected that a higher concentration of serum will support faster,
more robust cell growth in flat culture and appears to be the result for this experiment as
well. It is difficult to speculate on the effect of LIF on mES cell proliferation given the
significant difference in serum concentrations. It does appear clear though that
maintaining mES cells in a pluri-potent state makes for healthier cells as indicated by
GFP expression.
The results with the mES cells differ markedly from that of the 3T3s. A
fundamental difference between the cell lines is that 3T3s are contact dependent and mES
cells can grow in a suspension/aggregation type culture. This difference might help
explain why mES cells grow comparatively well on the OCCAG scaffolds despite the
material’s apparent lack of adhesivity. Furthermore, the difference between the number

46
of seeded cells in figure 4-20C and the number of cylindrical cell formation seen in 4-20I
indicates that seeding in the OCCAG functions as some sort of a selective pressure. Only
the mES cells best suited for this environment survive and proliferate.
Video 4-1. Time-Lapse Video of RCCAG Growth. 0.5M CuSO4 and 2% w/v Na-
Alginate solutions were used in creation of the above gel. Note the enhanced contrast of the growing gel boundary with the alginate sol due to a subtle change in lighting appearing a third of the way through the video. (8,067 KB, RCCAG18HrTLV.AVI).
RCCAG Growth as a Function of Time
y = 0.0207x0.601
R2 = 0.9989
0.00
0.20
0.40
0.60
0.80
1.00
1.20
1.40
1.60
0 200 400 600 800 1000 1200Growth Time (min)
Gel
Thi
ckne
ss (c
m)
Observed Gel ThicknessSquare Law ModelPower Fitted Model
y=0.02x0.5
Figure 4-1. Plot of RCCAG growth as a function of time. *Error bars = ± 0.05cm, the error
associated with determining a single gel thickness.

47
RCCAG Growth Rate as a Function of Time
0
0.002
0.004
0.006
0.008
0.01
0.012
0 200 400 600 800 1000 1200
Time (Min)
Gro
wth
Rat
e (c
m/m
in)
1st Derivative of Growth Data1st Derivate of Square Law Model1st Derivative of Power Fitted Modely'=0.01x-0.5
y'=0.012x-0.4
Figure 4-2. First derivative plot of RCCAG growth data.
A B
Figure 4-3. Low magnification optical micrographs of representative RCCAG sample
discs. A) Sample plane perpendicular to long capillary axis, B) Sample plane containing capillary long axis.

48
A
B
C
Figure 4-4. Increased magnification optical micrographs of RCCAG at sections at
different parent gel levels. A) Upper gel section. B) Middle gel section. C) Lower gel section.
Average Capillary Diameter of Raw-CCAG vs. Parent Gel Thicknesses
19.5 21.223.1
26.7 27.230.0
31.2 32.834.2
0
5
10
15
20
25
30
35
40
Parent Gel Level
Ave
rage
Cap
illar
y D
iam
eter
( µm
)
UpperMiddleLower
* **
* *
Figure 4-5. Graph of RCCAG average capillary diameter vs. parent gel thickness. A “*”
indicates significant differences within gel level groups, p ≤ 0.05.
49
Calculated RCCAG Metrics vs. Parent Gel Thickness
12.0
5.0 3.2
29 2833*
19.5
*26.9
*33.4 36
58
26
0.0
10.0
20.0
30.0
40.0
50.0
60.0
70.0
Upper GelLevel
Middle GelLevel
Lower GelLevel
Avg. Capillary Diameter (µm)
Capillary Density (#Caps/10,000 µm2)
% Free Space Avg. SA in Std. Disc (cm2)
Figure 4-6. Graph of calculated RCCAG metrics vs. parent gel thickness. A “*” indicates
significant differences within gel level groups, p ≤ 0.05. SA = surface area, Std. Disc = 1 cm in diameter X 1 mm thick.
Figure 4-7. Optical micrograph of BCCAG showing brown precipitate. Scale bar = 100
µm.

50
Figure 4-8. Optical micrograph of BCCAG showing shimmering precipitate. Scale bar =
100 µm.

51
A B
C
D
Figure 4-9. Summary of RCCAG SEM/EDS and X-ray mapping data. A) Secondary
electron image, B) Backscatter electron image, C) Representative EDS spectrum, D) X-ray map group. Scale bar = 50 µm.

52
SrLa1*,2
A B
C
D
Figure 4-10. Summary of BCCAG SEM/EDS and X-ray mapping data. A) Secondary
electron image, B) Backscatter electron image, C) Representative EDS spectrum, D) X-ray map group. Scale bars = 50 µm.

53
A B
C D
E
Figure 4-11. Higher magnification BCCAG morphologic and compositional study. A) 4000X SEI image, B) Complementary BSE image to A (*note the charge wave distortion in the central region of this micrograph), C) 15000X SEI image of copper-rich nanoparticle formations D) Small combination false color image of X-ray map group, E) X-ray map group. Scale bar for C = 2 µm; all others = 5 µm. *Image C courtesy of Wayne A. Acree.

54
Figure 4-12. Large false color compositional map of a BCCAG. Green represents the
barium crosslinked alginate matrix. Voids are black, and the blue within the voids is the material behind the current imaging plane. The red-pink spots often with yellow borders are sulfur rich crystalline particles. The yellow “eyelash” formations seen mainly at the upper edge of the voids are copper rich nanoparticle aggregates. The yellow-orange streak present at the bottom of the image is a charging artifact, while the blue highlights in the upper portion of the image are a result of local specimen topography and tilt. Neither feature is indicative of sample composition.

55
A B
C
D
A
Figure 4-13. Summary of OCCAG SEM/EDS and X-ray mapping data. A) Secondary
electron image, B) Backscatter electron image, C) Representative EDS spectrum, D) X-ray map group. Scale bars = 50 µm.

56
Figure 4-14. A 4000X secondary electron image highlighting the “hairy” OCCAG
surface character.
Equilibrium Water Weight Percents of Crosslinked CCAG
94.0%
90.3%88.3%
75.0%
80.0%
85.0%
90.0%
95.0%
100.0%
CCAG Type
Wat
er W
eigh
t Pre
cent
RCCAGOCCAGBCCAG
Figure 4-15. Equilibrium water weight percents of different CCAG derivatives.

57
Figure 4-16. Confocal microscope image of live GFP-3T3 cells seeded within an
OCCAG scaffold at day 2 in culture. The capillary long axis is oriented top-bottom. Scale bar = 200 µm
Video 4-2. Confocal microscope video of live GFP-3T3 cells seeded within an OCCAG
scaffold at day 2 in culture. Reference figure 4-16 for scale (31,363 KB, GFP-3T3Confo.AVI).

58
A B
C D
E F
Figure 4-17. Phase contrast and complementary fluorescence microscope image series of GFP-mES cultured in OCCAG over nine days. A) Day 0 phase contrast image, B) Complementary day 0 GFP-filtered image, C) Day 6 phase contrast image, D) Complementary day 6 GFP-filtered image, E) Day 9 phase contrast image, F) Complementary day 9 GFP-filtered image. Scale bar = 100 µm for all images.

59
Figure 4-18. Confocal microscope image of live GFP-mES cells seeded within an
OCCAG scaffold at day 7 in culture. Scale bar = 200 µm
Video 4-3. Confocal microscope video of live GFP-mES cells seeded within an OCCAG
scaffold at day 7 in culture. Reference figure 4-18 for scale. (127,532 KB, GFP-mESConfo.AVI).

60
Figure 4-19. Hoechst stained nuclei of mES cells in an OCCAG capillary at day 4 in
culture. Scale bar = 75 µm. *Image courtesy of Dr. Takashi Hamazaki

61
A B C
D E F
G H I Figure 4-20. Growth of GFP-mES cells in OCCAG scaffolds cultured in maintenance
(M) or differentiation (D) media or a combination (M/D) over 4 days. A) Day 0D, B) Day 0M/D , C) Day 0M D) Day 2D, E) Day 2M/D, F) Day 2M, G) Day 4D, H) Day 4M/D, I) Day4M. Scale bar = 100 µm for all images.

62
CHAPTER 5 CONCLUSIONS
Introduction
This project developed and biologically assessed new biomaterial tissue scaffolds
derived from copper-capillary alginate gels. These scaffolds are related members of a
new family of biomaterials best thought of as modular tissue engineering tools. Though
many of the studies presented are in the early stages and much experimental work
remains, the project was overall successful and the potential for significant future
developments is high.
Scaffold Synthesis: The Agony and the Ecstasy
Time lapse videoscopy provided an excellent means of tracking RCCAG growth.
These videos clearly demonstrate the dynamic of raw gel formation. RCCAG growth did
however result in the production of significant quantities (liters) of copper sulfate
hazardous waste. Treatment with barium hydroxide or oligochitosan was sufficient to
crosslink RCCAG for experimental biology, however scaffold stabilization proved an
underestimated challenge. The flow-reactor did improve the BCCAG production process
but fell short of performing as initially envisioned. OCCAG in comparison was easier to
produce and yielded much smaller quantities of waste. OBCCAG was tricky to make
with overexposure to the oligochitosan solution ultimately resulting in scaffold collapse.
Hence, the synthesis protocols described in this work produce the new biomaterials, but
are not optimized.

63
Characterization: CCAG Scaffolds as Subtle Composites
Material colorimetric changes were happy accidents of the synthesis process. The
change from light blue to royal blue while processing the RCCAG in barium hydroxide
provided a crude means of monitoring the process. This change was likely the result of
copper hydroxide formation within the gel. RCCAG also turned a yellowish-brown after
soaking in oligochitosan solution for multiple hours, probably the result of the
oligochitosan:alginate complexation rather than formation of a copper salt. All scaffolds
clarified and become almost “invisible” when washed in cell culture media due to the loss
of copper.
Crystalline and golden brown-black gelatinous precipitates also formed during
barium hydroxide treatment. The gelatinous precipitate was probably copper II oxide
and the X-ray mapping data at least support that the particles were copper rich.
Following this logic, copper ions apparently migrated or diffused toward material-
solution interfaces, perhaps driven by the formation of copper hydroxide and copper II
oxide. Copper II oxide ultimately formed possibly due to the relatively poor thermal
conductivity at the core of the CCAG-derived material. The thermal energy released
during copper hydroxide formation may have thus been “trapped” and enough for the
formation of copper II oxide.
X-ray mapping and backscatter images support the idea that the crystalline or
“shimmering” precipitates are likely barium compounds perhaps barium sulfate or
carbonate. BCCAG was also more brittle than the other materials resulting in poor
handling properties. Barium crosslinked alginate spheres have been previously shown to
have a higher modulus than copper crosslinked counterparts [34]. The barium
crosslinked material tending to crumble or shatter hydrated or freeze-dried. This behavior

64
could also be due in part to the precipitates formed within the gel, degradation of the
alginate through base catalyzed hydrolysis or a combination of both.
X-ray maps also tell us the RCCAG and BCCAG are uniformly crosslinked by
their respective metal ions (at least at the scale of the interaction volume). Interestingly
silicon also appears uniformly distributed within the gels, presumably in the form of
silicon dioxide. The raw alginate material is likely the source of this contamination. The
silica could also be thought of as a filler, perhaps affecting mechanical properties. Cast
in this light, CCAG scaffolds are subtle composites and this perspective could provide
interesting avenues for future material exploitation.
Biological Assessment: Living with Success and Failure
This study clearly demonstrates that mouse embryonic stems cells can survive and
proliferate in OCCAG scaffolds for many days, and these cells form cylindrical structures
in the scaffolds. This is the first report of any (mammalian) cell type cultured in CCAG
materials. The formation of the mES cell cylindrical structures proves that CCAG-
derived scaffolds can guide in vitro cell growth. If the growth behavior of the mES cells
describes generally how cells grow in CCAG scaffolds, then the average capillary size
will likely need to be increased (perhaps to 100 µm) for Schwann cell/ peripheral nerve
regeneration studies. Furthermore, the use of GFP expressing cells coupled with the
CCAG structure and relative optical clarity of the scaffolds made possible confocal
microscopy studies. The use of confocal microscopy has become increasingly popular in
experimental cell biology and will undoubtedly continue to provide valuable insights in
future CCAG scaffold experiments.
Studies utilizing GFP-3T3 cells were not as successful however, probably due to
the size of these cells compared to that of the average scaffold capillary diameter. Also,

65
the 3T3 study clearly shows that the cells prefer to adhere to each other rather than the
scaffold indicating a need to adjust/improve material surface chemistry. Successful
experiments with fibroblasts in CCAG scaffolds will likely be critical for further
evaluation of these new biomaterials as much is known about fibroblast cell behavior in
other settings.

66
CHAPTER 6 FUTURE WORK
Introduction
The neuroregenerative potential of the new CCAG scaffolds remains to be
investigated. These investigations will likely be secondary priorities however, as the
intriguing results using mES cells have excited all involved. Hence, stem cell-scaffold
interaction studies will be the dominant future research direction. Unfortunately, so
much curiosity has been generated by the results of this work that defining a clear future
research path has been difficult.
Synthesis: Expanding the CCAG Scaffold Family
New additions to the CCAG scaffold family must be made in order to fully
evaluate the tissue engineering potential of these new biomaterials. Synthesizing
scaffolds with a different average capillary diameters and oligochitosan crosslink times is
the next logical step since adjusting these scaffold modules is straightforward. These
materials will be critical to future stem cell–CCAG scaffold interaction studies. Further
work could utilize derivitized oligochitosan crosslinkers, protein additives and diffusible
cues to make a host of CCAG-derived scaffolds. Production processes will also need to
be optimized to reduce intrinsic scaffold variability.
Scaffold Characterization: Quantitative Bulk and Surface Compositional Analysis
The qualitative characterization work performed here provided a wealth of
interesting data that will serve as a springboard for quantitative studies. Although EDS is
a powerful qualitative elemental characterization technique, it is a cumbersome means of

67
obtaining quantitative information. A more suitable means of obtaining quantitative bulk
elemental analysis of CCAG-derived biomaterials is laser ablative inductively coupled
plasma mass spectrometry (ICP-MS). This analysis would be particularly focused on
copper and its potential release from the scaffold since copper has been reported to have
in vivo angiogenic potential [60, 61]. X-ray photoelectron spectroscopy (XPS) and/or
Fourier transform infrared spectroscopy (FTIR) studies should also be conducted to
obtain quantitative surface composition data. Tallying nitrogen concentrations at the
surfaces of CCAG scaffolds provides a means of tracking oligochitosan and/or protein
treatments.
Biologic Assessment: Standardized Methods and Controls for Stem Cell Studies
A difficulty recognized early in the course of mES cell experiments was the lack of
established protocols for seeding precise numbers of cells. The development of the
vacuum seeding method was a large improvement, but it was still exceedingly difficult to
determine the number of cells actually seeded. Mouse ES cell behavior is, to some
degree, a function of cell culture density (unpublished observations); it will therefore be
important to solve this problem in order to draw firm conclusions about scaffold
influence on cell behavior(s).
Defining proper comparative controls is another area that requires attention for
further mES cell experiments. For example, is it fair to compare mES cell behavior in
flat culture to that of cells grown in CCAG scaffolds? Ongoing studies underway in the
Terada laboratory at the University of Florida, Department of Pathology comparing the
average cell fates present in the two conditions are mixed. There is simply too much
variability to draw a confident conclusion. The mES cell behavior is, after all
mysterious.

68
Given all of the above, some long range goals will be to demonstrate that stem cell
fate can be modulated via CCAG scaffold architecture, modulus and surface chemistry
and to quantify the interaction(s). A few recent stem cell-scaffold studies have claimed
as much [62-64], putting this goal within achievable range. CCAG-derived scaffolds
provide a unique and elegant means of controlling the cell-cell interactions felt to be
crucial to stem cell differentiation. The regular, adjustable capillary microstructure of
these novel scaffolds provides a robust model system not currently available for studying
cell-cell and cell-scaffold interactions. Tailoring the system to propagate adult stem cells
in vitro, especially hematopoietic stem cells, would be directly beneficial to patients
requiring bone marrow transplantation. Finally, in vivo studies using CCAG scaffolds
alone and loaded with various cells types need to be conducted pursuant to any attempt at
organoid synthesis.

69
APPENDIX : PUBLICATIONS, PRESENTATIONS AND PATENTS
1. Tollon, M.H., Hamazaki, T., Willenberg, B.J., Batich, C., Terada, N., Fabrication of Coated Polycaprolactone Scaffolds and Their Effects on Murine Embryonic Stem Cells. Materials Research Society Spring Conference Proceedings, 2005. K9.14.
2. Willenberg, B.J., A New Family of Tissue Engineering Scaffolds Derived From Copper-Capillary Alginate Gels: Synthesis and Characterization. FLAVS-FSM Annual Joint Symposium, 2005. Invited presentation.
3. Batich, C., Willenberg, B.J., Hamazaki, T., Terada, N., Novel tissue engineered scaffolds derived from copper capillary alginate gels. US patent application, 2005. Serial No. 11/074,285.

70
LIST OF REFERENCES
1. Evans, G.R.D., Peripheral nerve injury: A review and approach to tissue engineered constructs. Anatomical Record, 2001. 263(4): p. 396-404.
2. Neal, N., Military contributions to peripheral nerve injuries. Gray Matters: Newsletter of the National Capital Neurosurgery Program, 2000: p. 1-5.
3. Novak, C.B., Peripheral Nerve Injuries. 2002 Feb., eMedicine, www.emedicine.com/orthoped/topic537.htm.
4. Idan, S., Acute Nerve Injuries. 2002 June, eMedicine, www.emedicine.com/orthoped/topic2908.htm.
5. Kline, D., A. Hudson, and D. Kim, Chapter XXV: Graft Repair, in Atlas of Peripheral Nerve Surgery. 2001, WB Sanders Co.: Philadelphia. p. 183-187.
6. Meek, M.F. and J.H. Coert, Clinical use of nerve conduits in peripheral-nerve repair: Review of the literature. Journal of Reconstructive Microsurgery, 2002. 18(2): p. 97-109.
7. Hadlock, T., Elisseeff J., Langer R, Vacanti J., Cheney M., A tissue-engineered conduit for peripheral nerve repair. Archives of Otolaryngology-Head & Neck Surgery, 1998. 124(10): p. 1081-1086
8. Terzis, J.K., T.G. Skoulis, and P.N. Soucacos, Vascularized nerve grafts - A review. International Angiology, 1995. 14(3): p. 264-277.
9. Langer, R. and J.P. Vacanti, Tissue Engineering. Science, 1993. 260(5110): p. 920-926.
10. Ma, P.X., Scaffolds for tissue fabrication. Materials Today, 2004. 7(5): p. 30-40.
11. Sundback, C., Hadlock T., Cheney M., Vacanti J., Manufacture of porous polymer nerve conduits by a novel low- pressure injection molding process. Biomaterials, 2003. 24(5): p. 819-830.
12. Hadlock, T., Sundback C., Hunter D., Cheney M., Vacanti J.P., A polymer foam conduit seeded with Schwann cells promotes guided peripheral nerve regeneration. Tissue Engineering, 2000. 6(2): p. 119-127.
71
13. Ma, P.X. and R.Y. Zhang, Microtubular architecture of biodegradable polymer scaffolds. Journal of Biomedical Materials Research, 2001. 56(4): p. 469-477.
14. Carpenter, M.B., Ch 4: The Neuron and Ch 7: Segmental and Peripheral Innervation, in Human Neuroanatomy. 1979, The Williams & Wilkins Company: Baltimore, MD. p. 71-114 and 188-190.
15. Cajal, S.R., Chapter IX: Nerve Fibers, in Histology of the Nervous System- American Translation. 1995, Oxford University Press, Inc.: New York, NY. p. 209-235.
16. Ross, M., E. Reith, and L. Romrell, Ch 11: Nervous Tissue, in Histology: A Text and Atlas, K. Kist, Editor. 1989, Williams & Wilkins: Baltimore. p. 241-281.
17. Peters, A., S.L. Palay, and H. Webster, Ch. 12: Connective Tissue Sheaths of Peripheral Nerves, in The Fine Structure of the Nervous System - Neurons and Their Supporting Cells. 1991, Oxford University Press, Inc.: New York. p. 384-394.
18. Stoll, G., S. Jander, and R.R. Myers, Degeneration and regeneration of the peripheral nervous system: From Augustus Waller's observations to neuroinflammation. Journal of the Peripheral Nervous System, 2002. 7(1): p. 13-27.
19. Strauch, B., Rodriguez D.M., Diaz J., Yu H.L., Kaplan G., Weinstein D.E., Autologous schwann cells drive regeneration through a 6-cm autogenous venous nerve conduit. Journal of Reconstructive Microsurgery, 2001. 17(8): p. 589-595.
20. Mackinnon, S.E., Autologous schwann cells drive regeneration through a 6-cm autogenous venous nerve conduit - Invited discussion. Journal of Reconstructive Microsurgery, 2001. 17(8): p. 596-597.
21. DenDunnen, W.F.A., VanderLei B., Schakenraad J.M., Stokroos I., Blaauw E., Bartels H., Pennings A.J., Robinson P.H., Poly(DL-lactide-epsilon-caprolactone) nerve guides perform better than autologous nerve grafts. Microsurgery, 1996. 17(7): p. 348-357.
22. Suzuki, K., Suzuki Y., Tanihara M., Ohnishi K., Hashimoto T., Endo K., Nishimura Y., Reconstruction of rat peripheral nerve gap without sutures using freeze-dried alginate gel. Journal of Biomedical Materials Research, 1999. 49(4): p. 528-533.
23. Suzuki, Y., Tanihara M., Ohnishi K., Suzuki K., Endo K., Nishimura Y., Cat peripheral nerve regeneration across 50 mm gap repaired with a novel nerve guide composed of freeze-dried alginate gel. Neuroscience Letters, 1999. 259(2): p. 75-78.

72
24. Chen, Y.S., Hsieh C.L., Tsai C.C., Chen T.H., Cheng W.C., Hu C.L., Yao C.H., Peripheral nerve regeneration using silicone rubber chambers filled with collagen, laminin and fibronectin. Biomaterials, 2000. 21(15): p. 1541-1547.
25. Battiston, B., Tos P., Cushway T.R., Geuna S., Nerve repair by means of vein filled with muscle grafts I. Clinical results. Microsurgery, 2000. 20(1): p. 32-36.
26. Shen, Z.L., Berger A., Hierner R., Allmeling C., Ungewickell E., Walter G.F., A Schwann cell-seeded intrinsic framework and its satisfactory biocompatibility for a bioartificial nerve graft. Microsurgery, 2001. 21(1): p. 6-11.
27. Gulati, A.K., D.R. Rai, and A.M. Ali, The influence of cultured Schwann cells on regeneration through acellular basal lamina grafts. Brain Research, 1995. 705(1-2): p. 118-124.
28. Evans, G.R.D., Brandt K., Widmer M.S., Lu L., Meszlenyi R.K., Gupta P.K., Mikos A.G., Hodges J., Williams J., Gurlek A., Nabawi A., Lohman R., Patrick C.W., In vivo evaluation of poly(L-lactic acid) porous conduits for peripheral nerve regeneration. Biomaterials, 1999. 20(12): p. 1109-1115.
29. Mackinnon, S.E., Doolabh, V.B., Novak, C.B., Trulock, E.P., Clinical outcome following nerve allograft transplantation. Plastic and Reconstructive Surgery, 2001. 107(6): p. 1419-1429.
30. Rodriguez, F.J., Gomez N., Perego G., Navarro X., Highly permeable polylactide-caprolactone nerve guides enhance peripheral nerve regeneration through long gaps. Biomaterials, 1999. 20(16): p. 1489-1500.
31. Schuberth, R., Ionotropic Copper Alginates: Investigations into the formation of capillary gels and filtering properties of the primary membrane (translated). 1992, University of Regensburg: Regensburg.
32. ISP Alginates, Section 3: Algin-Manufacture and Structure, in Alginates: Products for Scientific Water Control. 2000, International Specialty Products: San Diego. p. 4-7.
33. Chaplin, M., Alginate http://www.sbu.ac.uk/water/hyalg.html. 04/27/03.
34. Ouwerx, C., Velings N., Mestdagh M.M., Axelos M.A.V., Physico-chemical properties and rheology of alginate gel beads formed with various divalent cations. Polymer Gels and Networks, 1998. 6(5): p. 393-408.
35. Blair, S.D., Jarvis P., Salmon M., McCollum C., Clinical-Trial of Calcium Alginate Hemostatic Swabs. British Journal of Surgery, 1990. 77(5): p. 568-570.

73
36. Rives, J.M., Pannier M., Castede J.C., Martinot V., Le Touze A., Romana M.C., Guitard J., Bohbot S., Ebel C., Calcium alginate versus paraffin gauze in the treatment of scalp graft donor sites. Wounds-a Compendium of Clinical Research and Practice, 1997. 9(6): p. 199-205.
37. Soon-Shiong, P., Treatment of type I diabetes using encapsulated islets. Advanced Drug Delivery Reviews, 1999. 35(2-3): p. 259-270.
38. Sandford, P.A. and P. Spoonshiong, Alginate Encapsulation - Update on 1st Human Clinical-Trial with Encapsulated Human Islets in a Type-I-Diabetic Patient with Sustained Islet Function 16 Months Post Encapsulated Islet Transplant. Abstracts of Papers of the American Chemical Society, 1995. 209: p. 44-CELL.
39. Yan, X.L., E. Khor, and L.Y. Lim, PEC films prepared from chitosan-alginate coacervates. Chemical & Pharmaceutical Bulletin, 2000. 48(7): p. 941-946.
40. Gaserod, O., A. Sannes, and G. Skjak-Braek, Microcapsules of alginate-chitosan. II. A study of capsule stability and permeability. Biomaterials, 1999. 20(8): p. 773-783.
41. Kuo, C.K. and P.X. Ma, Ionically crosslinked alginate hydrogels as scaffolds for tissue engineering: Part 1. Structure, gelation rate and mechanical properties. Biomaterials, 2001. 22(6): p. 511-521.
42. Suzuki, K., Suzuki Y., Ohnishi K., Endo K., Tanihara M., Nishimura Y., Regeneration of transected spinal cord in young adult rats using freeze-dried alginate gel. Neuroreport, 1999. 10(14): p. 2891-2894.
43. Suzuki, Y., Kataoka K., Kitada M., Wu S., Hashimoto T., Ohnishi K., Suzuki K., Ide C., Endo K., Nishimura Y., Tanihara M., Spinal cord regeneration through alginate, a polysaccharide from seaweed. European Journal of Neuroscience, 2000. 12: p. 287-287.
44. Palmieri, G., GiardinA.P., Desiderio B., Marzullo L., Giamberini M., Sannia G., A New Enzyme Immobilization Procedure Using Copper Alginate Gel - Application to a Fungal Phenol Oxidase. Enzyme and Microbial Technology, 1994. 16(2): p. 151-158.
45. Widerøe, H. and S. Danielsen, Evaluation of the use of Sr2+ in alginate immobilization of cells. Naturwissenschaften, 2001. 88: p. 224-228.
46. Duvivier-Kali, V.F., Omer A., Parent R.J., O'Neil J.J., Weir G.C., Complete Protection of Islets Against Allorection and Autoimmunity by a Simple Barium-Alginate Membrane. Diabetes, 2001. 50: p. 1698-1705.
47. Bartkowiak, A. and D. Hunkeler, New Microcapsules Based on Oligoelectrolyte Complexation. Annals of the New York Academy of Sciences, 1999. 875: p. 36-45.

74
48. Thumbs, J. and H.H. Kohler, Capillaries in alginate gel as an example of dissipative structure formation. Chemical Physics, 1996. 208(1): p. 9-24.
49. Thiele, H., Histolyse und Histogenese, Gewebe und ionotrope Gele, Prinzip einer Stukturbildung (translated). 1967, Frankfurt: Akademische Verlagsgesellschaft.
50. Hassan, R.M., A. Awad, and A. Hassan, Separation of Metal Alginate Ionotropic Gels to Polymembranes with Special Evidence on the Position of Chelation in Copper Alginate Complex. Journal of Polymer Science Part a-Polymer Chemistry, 1991. 29(11): p. 1645-1648.
51. Hassan, R.M., Elshatoury S.A., Mousa M.A., Hassan A., Kinetics and Mechanism of Sol-Gel Transformation for Poly- Electrolytes of Capillary Copper Alginate Ionotropic Membranes. European Polymer Journal, 1988. 24(12): p. 1173-1175.
52. Dittrich, R., G. Tomandl, and M. Mangler, Preparation of Al2O3, TiO2, and hydroxyapatite ceramics with pores similar to a honeycomb structure. Advanced Engineering Materials, 2002. 4(7): p. 487-490.
53. Weber, K. and G. Tamandl, Porous Al2O3-ceramics with uniform capillaries. Cfi-Ceramic Forum International, 1998. 75(8): p. 22-24.
54. Lee, Dong-Won and R. Baney, Detoxification of amitriptyline by oligochitosan derivatives. Biotechnology Letters, 2004. 26: p. 713–716.
55. Gaserod, O., O. Smidsrod, and G. Skjak-Braek, Microcapsules of alginate-chitosan - I - A quantitative study of the interaction between alginate and chitosan. Biomaterials, 1998. 19(20): p. 1815-1825.
56. VandeVord, P.J., Matthew H.W.T, DeSilva S.P., Mayton L., Wu B., Wooley P.H., Evaluation of the biocompatibility of a chitosan scaffold in mice. Journal of Biomedical Materials Research, 2002. 59(3): p. 585-590.
57. Hamazaki T, Oka M, Yamanaka S, Terada N. Aggregation of embryonic stem cells induces Nanog repression and primitive endoderm differentiation. Journal of Cell Science, 2004. 117(Pt 23): p. 5681-6.
58. Khairou, K.S., Al-Gethami W.M., Hassan R.M. Kinetics and mechanism of sol–gel transformation between sodium alginate polyelectrolyte and some heavy divalent metal ions with formation of capillary structure polymembranes ionotropic gels. Journal of Membrane Science, 2002. 209: p. 445–456.
59. Dunn, G.A. and J.P. Heath, New Hypothesis of Contact Guidance in Tissue-Cells. Experimental Cell Research, 1976. 101(1): p. 1-14.
60. Nasulewicza, A., Mazurb, A., Opolskia, A. Role of copper in tumour angiogenesis—clinical implications. Journal of Trace Elements in Medicine and Biology, 2004. 18: p. 1–8.
75
61. Giavaresi, G., Torricelli P., Fornasari P.M., Giardino R., Barbucci R., Leone G., Blood vessel formation after soft-tissue implantation of hyaluronan based hydrogel supplemented with copper ions. Biomaterials, 2005. 26: p. 3001–3008.
62. Dang, S.M., Gerecht-Nir S., Chen J., Itskovitz-Eldor J., Zandstra P.W., Controlled, Scalable Embryonic Stem Cell Differentiation Culture. Stem Cells, 2004. 22: p. 275-282.
63. Gerecht-Nir, S., Cohen S., Ziskind A., Itskovitz-Eldor J., Three-Dimensional Porous Alginate Scaffolds Provide a Conducive Environment for Generation of Well-Vascularized Embryoid Bodies From Human Embryonic Stem Cells. Biotechnology and Bioengineering, 2004. 88(3): p. 313-320.
64. Levenberg, S., Huang N.F., Lavik E., Rogers A.B., Itskovitz-Eldor J., Langer R., Differentiation of human embryonic stem cells on three-dimensional polymer scaffolds. Proceedings of the National Academy of Sciences of the USA, 2003. 100(22): p. 12741–12746.

76
BIOGRAPHICAL SKETCH
Bradley Jay Willenberg spent the first 13 years of his life growing up privileged in
Bloomfield Hills, Michigan. Here he spent much time in a garage-based laboratory
contemplating fire, disassembling toys, repairing bikes, experimenting with electrical
motors, staring at the sun with a telescope, and exploring the universe in a drop of
standing ground water. Brad had significant difficulty reading and writing and therefore
also spent considerable time deeply immersed. When he was 9 years old, he was
fortunately injected into a well-funded public middle school that was able to redress his
apparent lack of educational progress.
Brad spent his high school years attending three different schools in three different
states. After graduating from First Colonial High in Virginia Beach, Brad was granted
admission and attended college at the University of Florida. He graduated Phi Beta
Kappa with highest honors, receiving a bachelor’s degree in interdisciplinary studies
focused on biochemistry and molecular biology. Brad then worked for a little over a
year at a small biotech start-up in Alachua, Florida. He returned to the University of
Florida to pursue a doctorate in biomedical engineering. Over the course of his doctoral
work, Brad developed a promising family of biomaterial scaffolds that he hopes to
continue studying and developing. He has also worked as a materials analyst at the
Major Analytical Instrumentation Center (MAIC) since June 2003.

77
All of his life, Brad has shared a very deep connection with music. He is an
accomplished bass player and a budding singer and guitar player. Brad currently lives
with his family in Gainesville, FL.