Modified Equivalent Drop Test for Structural Corrugated … · Modified Equivalent Drop Test for...
13
J. Pac .Sci. Tech. Vol.21 No.4(2012) - 281 - Original Paper~~~~~~~~~~~~~~~~~~~~~~~~~~~~ Modified Equivalent Drop Test for Structural Corrugated Fiberboard Cushioning Chen ZHONG ∗ and Katsuhiko SAITO ** Previous studies have shown limitations of the conventional equivalent drop theory, and therefore, a friction equivalent drop theory was proposed. We prove that applying the friction equivalent drop theory to structural cushioning materials (SCM) using a corrugated sleeve as a test material can correct errors of equivalent tests. However, a full proof of this conjecture remains to be obtained. Therefore, further investigation is performed to obtain a robust conclusion for this new theory. In this study, we first consider the influence of stress. Shock and dynamic compression tests are carried out using different weight dummies. New data collection and data analysis methods are also proposed. The experimental results showed that there is a correction effect when we apply the friction equivalent drop theory to the corrugated sleeve. Finally, we evaluated quantitatively the correction effects. Keywords:packaging, transport, cushioning, corrugated fiberboard, equivalent drop 1. Introduction Dynamic compression and shock tests are two important test methods used to evaluate the cushioning performance of transport packaging. Theoretically, if the cushion is assumed to follow a linear mass–spring model, then the dynamic compression and shock tests yield the same results for equal free fall heights (Fig. 1(a)) 1), 2) . This result is known as the ‘conventional equivalent drop theory’ (conventional theory). Saito et al. 3), 4) proved that the conventional theory has limitations that cause experimental errors, and thus, they developed a damping equivalent drop theory (damping theory) by introducing a viscous damping model (Fig. 1(b)). m k F c c m k c m k SCM (a) (b) (c) Fig. 1. Three models. (a) Linear model, (b) Viscous damping model, (c) Friction model ∗ Ph.D. Candidate. Graduate School of Maritime Sciences, Kobe University, Fukaeminami, Higashinada, Kobe 658-0022, Japan ** Corresponding Author, Professor. Transport Packaging Laboratory, Kobe University, 5-1-1, Fukaeminami, Higashinada, Kobe 658-0022, Japan E-mail: [email protected], Tel: +81-78-431-6341
Transcript of Modified Equivalent Drop Test for Structural Corrugated … · Modified Equivalent Drop Test for...

J. Pac .Sci. Tech. Vol.21 No.4(2012)
- 281 -
Original Paper~~~~~~~~~~~~~~~~~~~~~~~~~~~~
Modified Equivalent Drop Test for Structural Corrugated Fiberboard Cushioning
Chen ZHONG∗ and Katsuhiko SAITO**
Previous studies have shown limitations of the conventional equivalent drop theory, and therefore, a
friction equivalent drop theory was proposed. We prove that applying the friction equivalent drop theory to structural cushioning materials (SCM) using a corrugated sleeve as a test material can correct errors of equivalent tests. However, a full proof of this conjecture remains to be obtained. Therefore, further investigation is performed to obtain a robust conclusion for this new theory. In this study, we first consider the influence of stress. Shock and dynamic compression tests are carried out using different weight dummies. New data collection and data analysis methods are also proposed. The experimental results showed that there is a correction effect when we apply the friction equivalent drop theory to the corrugated sleeve. Finally, we evaluated quantitatively the correction effects.
Keywords:packaging, transport, cushioning, corrugated fiberboard, equivalent drop 1. Introduction
Dynamic compression and shock tests are two important test methods used to evaluate the cushioning performance of transport packaging. Theoretically, if the cushion is assumed to follow a linear mass–spring model, then the dynamic compression and shock tests yield the same results for equal free fall heights (Fig. 1(a)) 1), 2). This result is known as the ‘conventional equivalent drop theory’ (conventional theory). Saito et al. 3), 4) proved that the conventional theory has limitations that cause experimental errors, and thus, they developed a damping equivalent drop theory (damping theory) by introducing a viscous damping model (Fig. 1(b)).
m
k Fcc
m
k c
m
kSCM
(a) (b) (c)
Fig. 1. Three models. (a) Linear model, (b) Viscous damping model, (c) Friction model
∗ Ph.D. Candidate. Graduate School of Maritime Sciences, Kobe University, Fukaeminami, Higashinada, Kobe
658-0022, Japan ** Corresponding Author, Professor. Transport Packaging Laboratory, Kobe University, 5-1-1, Fukaeminami, Higashinada, Kobe 658-0022, Japan
E-mail: [email protected], Tel: +81-78-431-6341

Modified Equivalent Drop Test for Structural Corrugated Fiberboard Cushioning
- 282 -
Earlier studies by Zhong et al. 5), 6) have shown that applying the damping theory using a quasi-linear cushion can improve the equivalent precision of tests. However, this theory is not applicable to SCM 7). Therefore, Zhong et al. 8), 9) proposed a friction model (Fig. 1(c)) and developed a ‘friction equivalent drop theory’ (friction theory). Under the friction theory, Aff max and Acs max (the peak response accelerations of the dynamic compression and shock tests, respectively) are expressed by Eqs. (1) and (2), and a correction condition is given by Eq. (3):
(1)
(2)
(3)
where ωn is the natural angular frequency, uff , ucs and µff are correcting coefficients, V is the impact velocity of the mass,Vc is the velocity change on the shock table, VF is the velocity related to friction and Vnew is the corrected impact velocity.
Zhong et al. 10) proved that the application of the friction theory using a corrugated sleeve as a test material could solve the aforementioned issue. However, this conclusion was based on only one material (corrugated fiberboard) and one design configuration (a corrugated sleeve with the same equivalent free-fall height and weight dummy). Therefore, to obtain a robust conclusion, it is necessary to consider other factors such as stress, test material and free fall height. The influence of these three factors can be investigated by varying the weight dummy, using pulp mould as the test material and changing the free fall height of the mass. In this study, we address the influence of stress.
2. Materials and Tests 2.1 Test equipment and materials
Test equipment: To perform the shock and dynamic compression tests, we used a shock machine (Yoshida Seiki
Co., Ltd.. JAPAN) and a dynamic compression tester (Yoshida Seiki Co., Ltd.. JAPAN), respectively. An acceleration analysis instrument, termed the ‘Shock Manager’ (Yoshida Seiki Co., Ltd.. JAPAN), was used to measure the response accelerations of the two tests.
Corrugated sleeve: A corrugated sleeve, created by folding by a corrugated fiberboard (‘A’ flute, LB210/MC120/LB
210), was used as test material (Fig. 2). Based on previous studies 8)-10) and considering the technical specifications of the test equipment 11), 12), its dimension was determined to be 180 ×180 × 80 mm.
Weight dummy: Based on the research of NAKAGAWA 13), we used nine weight dummies ranging between 4 kg
and 12 kg, in one kilogram increments. The length and width of the nine weight dummies were held constant (220 × 220 mm), but their thicknesses were different (Fig. 3).

J. Pac .Sci. Tech. Vol.21 No.4(2012)
- 283 -
12kg
4kg
Corrugated sleeve
Weight dummy
Fig. 2. Corrugated sleeve Fig. 3. Weight dummies with corrugated sleeves
2.2 Test method
Test flow: The flow of the test was as follows: 1. Perform tests (using weight dummies in the range of 4 –12 kg)
1-1. Shock test 1-2. Dynamic compression test (based on the conventional theory) 1-3. Correction of V (based on the data obtained in steps 1-1 and 1-2) 1-4. Dynamic compression test (based on Vnew obtained in step 1-3)
2. Process and analyse experimental data 3. Assess test results
Data collection: To compare the influence of stress, the free fall height H was set to 0.6 m and was held constant 7).
The equation Vth = was used to obtain the theoretical impact velocity of the mass Vth = 3.43 m/s. According to the conventional theory, Vc =Vth, which implies that Vc = 3.43 m/s.
In earlier studies 5), 6), 8)-10), the data were adopted only when V or Vc = 3.43 m/s for both tests. However, when the tests were carried out, a large number of data was measured with V or Vc ≠ 3.43 m/s. Therefore, in this study, to improve the accuracy of the test results, we used statistics to take full advantage of these data. Here, the effective impact velocity V and the effective velocity change Vc were redefined in the range of 3.43 ± 0.1 m/s.
According to the statistical theory, to ensure the reliability of the results, a test population must be larger than 30 samples 14). Therefore, in steps 1-1, 1-2 and 1-4, we collected 40 sets of data for each test.
Test method: Using weight dummies in the range of 4–12 kg, we performed the shock and dynamic
compression tests. For each weight dummy, the test method applied was as follows: First, we performed the shock test and recorded Vc and Acsmax. Second, based on the conventional
theory and using the impact pulse of the shock test in step 1-1, we carried out the dynamic compression test and recorded V and Aff max. Third, similar to previous studies 9), 10), we corrected V using the data recorded in steps 1-1 and 1-2. In certain cases, the resulting Vnew was out of the range of 3.43 ± 0.1 m/s. Fourth, if Vnew was not within the range 3.43 ± 0.1 m/s, the dynamic compression test was re-performed to measure the new peak response acceleration corresponding to the Vnew.

Modified Equivalent Drop Test for Structural Corrugated Fiberboard Cushioning
- 284 -
2.3 Friction The hysteresis loop of the friction model shown in Fig. 4 is based on a previous study 9). The area
enclosed by the hysteresis loop is called the loss energy. The loss energy En is expressed as (4) where c is the damping coefficient, Fc is the friction, and A is the displacement.
Forc
e
Displacement
kx
m
k Fcc
-A A
Fig. 4. Hysteresis loop of the friction model
By rearranging Eq. (4), we obtain
(5)
Furthermore, by substituting ωn = and c = 2 in Eq. (5), we obtain
(6)
where k is the spring constant. According to literature 15), 16), the hysteresis loops of the friction model are the complete nested hysteresis loops (Fig. 5). Thus, the term En /A in Eq. (6) is constant. Furthermore, because k is constant, from Eq. (6) we predict that if the increase in the weight dummy causes a large change in A, then Fc will decrease.
From the experimental data of the dynamic compression test obtained using weight dummies in the range of 4–12 kg, we can draw the hysteresis loops of the corrugated sleeve. Fig. 6 shows the hysteresis loops when using 4 kg, 8 kg and 12 kg weight dummies. Based on this figure we can make two observations. (1) The upper parts of the hysteresis loops are almost identical. The ratio En /A is almost the same for all dummy weights from 4 kg to 12 kg and is approximately equal to 2000 N. (2) The displacement values for the weight dummies are A4kg ≈ 7 mm, A8kg ≈ 16 mm and A12kg ≈ 23 mm. Hence, by increasing the weight dummies, parameter A also increases.
Strain
Stre
ss
Fig. 5. Complete nested hysteresis loops15), 16)

J. Pac .Sci. Tech. Vol.21 No.4(2012)
- 285 -
0 5 10 15 20 25
Forc
e (N
)
Displacement (mm)
0
1000
2000
3000
4000
4 kg
8 kg
12 kg
Fig. 6. Hysteresis loops of the corrugated sleeve for 4 kg, 8 kg and12 kg weight dummies
3 Difference in Peak Response Accelerations of the Two Tests Definition of difference in the peak response accelerations of the two tests
Difference in the peak response accelerations of the two tests (dGs) is an important indicator for our study. According to dGs, we can know the correction effect of the friction theory roughly. dGs is expressed as
dGs = . (7) Calculation of dGs
There are two types of Aff max (V ) corresponding to before and after the correction of V : Aff max (Vold ) and Aff max (Vnew ), respectively. Therefore, Eq. (7) has two cases: dGs = Acsmax (Vc ) − Aff max (Vold ) and dGs = Acsmax (Vc ) − Aff max (Vnew ).
An example of calculating dGs = Acsmax (Vc ) − Aff max (Vold ) is presented in Table 1. The experimental data is too large to show completely in the example, thus, only a port of data is shown in Table 1. First, the test results of both tests are listed in order of Vc or V. Second, values of Acsmax (Vc ) and Aff max (Vold ) corresponding to the same value of Vc or V are grouped together (blocks with same colour). Third, we calculate dGs by the formula Acsmax (Vc ) − Aff max (Vold ) using all the data in each group.
Table 1. Example of calculating dGs = Acsmax(Vc) ‒ Affmax(Vold). Weight dummy: 6 kg
An example of calculating dGs = Acsmax (Vc ) − Aff max (Vnew ) is presented in Table 2 (portion of data). First, based on the friction theory 10), we calculate Vnew using the data of the shock test (block

Modified Equivalent Drop Test for Structural Corrugated Fiberboard Cushioning
- 286 -
①). Second, the old test results (the results when Vnew is within the range 3.43 ± 0.1 m/s) and the new test results (the results when Vnew is outside the range 3.43 ± 0.1 m/s) of the dynamic compression test are listed in block ②. Third, Acs max (Vc ) corresponding to a special Vnew and Aff max (Vnew ) when V equals to this special Vnew are grouped together (blocks with the same colour) and are taken for permutation and combination (block ③). Finally, we calculate dGs by the formula Acsmax (Vc ) − Aff max (Vnew ) using all the data in a group (block ④).
Table 2. Example of calculating dGs = Acsmax(Vc) ‒ Affmax(Vnew). Weight dummy: 6 kg
4 Test Results
4.1 Probability distribution of dGs Using the statistical theory 14), if the friction theory can be applicable to SCM when stress varies,
the probability distribution of dGs after the correction should get even closer to 0. Based on the experimental data, the probability distribution of dGs is shown in Fig. 7. Averages
and standard deviations of dGs among weight dummies are also shown in right bottom of Fig. 7. By comparing the nine bar charts, the following conclusions are drawn. (1) When a light weight dummy is used, dGs is large before and after the correction. (2) dGs reduces gradually with respect to the increase in the weight dummy. (3) dGs with the highest probability after the correction is closer to 0 than before the correction. This behaviour is more prominent as the weight dummy becomes heavier. By comparing the data of deviations, we can know that both averages and standard deviations of dGs scatter between 0.78 and 3.18. Although averages and standard deviations of dGs when using 5, 9, 11 and 12 weight dummies are smaller than before the correction, these when using 4, 6, 7, 8 and 10 weight dummies are larger than before the correction. Therefore, it can be said that the friction theory has a little effect to deviation. Additionally, it must be pointed out that numbers of the bar for aggregating data are not the same among weight dummies due to the varied deviations under different weight dummies.
Based on the bar charts of the probability distribution of dGs, we can qualitatively conclude that the friction theory is applicable to SCM under different stresses. However, we cannot derive a specific value for the correction effect of the friction theory. In other words, we cannot evaluate quantitatively the effects of the friction theory only based on the bar charts. Therefore, in this study, we investigate a new evaluation method.

J. Pac .Sci. Tech. Vol.21 No.4(2012)
- 287 -
0.00
0.05
0.10
0.15
0.20
0 1 2 3 4 5 6 7 8 9 10 11 12 13 14 15 16 17
0.00
0.05
0.10
0.15
0.20
0.25
0 1 2 3 4 5 6 7 8‐3 ‐2 ‐1
0.00
0.05
0.10
0.15
0 1 2 3 4 5 6 7 8 9 10 11 12 13 14 15 16‐1
0.00
0.05
0.10
0.15
0.20
0 1 2 3 4 5 6 7 8 9 10‐3 ‐2 ‐1
0.00
0.05
0.10
0.15
0.20
0.25
0.30
0.35
0.40
0 1 2 3 4 5‐2 ‐1
0.00
0.05
0.10
0.15
0.20
0.25
0.30
0 1 2 3 4 5 6‐3 ‐2‐5 ‐4 ‐1
0.00
0.05
0.10
0.15
0.20
0.25
0.30
0.35
0.40
‐4 ‐3 ‐2 ‐1 0 1 2 3 4
0.00
0.05
0.10
0.15
0.20
0 1 2 3 4 6 85 7‐3 ‐2‐5 ‐4 ‐1
0.00
0.05
0.10
0.15
0.20
0.25
‐5 ‐4 ‐3 ‐2 ‐1 0 1 2 3 4 5
Before correctionAfter correction
Before correctionAfter correction
Before correctionAfter correction
Before correctionAfter correction
Before correctionAfter correction
Before correctionAfter correction
Before correctionAfter correction
Before correctionAfter correction
Before correctionAfter correction
(G)( )Acs cmax V ( )Aff max V
Prob
abilit
y4 kg
(G)( )Acs cmax V ( )Aff max V
Prob
abilit
y
5 kg
(G)( )Acs cmax V ( )Aff max V
Prob
abilit
y
6 kg
(G)( )Acs cmax V ( )Aff max V
Prob
abilit
y
7 kg
(G)( )Acs cmax V ( )Aff max V
Prob
abilit
y
8 kg
(G)( )Acs cmax V ( )Aff max V
Prob
abilit
y
9 kg
(G)( )Acs cmax V ( )Aff max V
Prob
abilit
y
10 kg
(G)( )Acs cmax V ( )Aff max V
Prob
abilit
y
12 kg
(G)( )Acs cmax V ( )Aff max V
Prob
abilit
y
11 kg
Beforecorrection
2.682.972.021.331.262.260.781.371.93
Aftercorrection
3.162.912.051.661.451.690.861.131.73
Beforecorrection
3.183.572.501.661.642.750.981.872.46
Aftercorrection
3.853.552.402.081.852.101.121.542.14
456789
101112
Weightdummy
(kg)
Average deviationof dGs (G)
Standard deviationof dGs (G)
Fig. 7. Probability distribution, average deviation and standard deviation of dGs among weight dummies

Modified Equivalent Drop Test for Structural Corrugated Fiberboard Cushioning
- 288 -
4.2 Evaluation of correction effect Data normalization:
Figure 8 shows examples of response accelerations of the shock and dynamic compression tests using 5 kg and 12 kg weight dummies. It can be seen that the peak response accelerations of the same test under different stresses considerably differ. In other words, the comparison basis of evaluating the correction effect varies. Therefore, the test results cannot be directly compared. To remove the influence of the different comparison basis, we need to perform data normalization.
Acc
eler
atio
n (G
)
Time (ms)0 5 10 15 20
Acc
eler
atio
n (G
)
Time (ms)
0
2010
30
4050
60
70
8090
0 5 10 15 200
2010
30
4050
60
70
8090
Tests using 5 kg weight dummy Tests using 12 kg weight dummy
Dynamic compression test(before correction)
Shock test
Dynamic compression test(after correction)
Dynamic compression test(before correction)
Shock test
Dynamic compression test(after correction)
Fig. 8. Response accelerations of the two tests using 5 kg and 12 kg weight dummies
To perform data normalization, we first need to determine the true value of the peak response acceleration. We measure two types of peak response accelerations, Acs max (Vc ) and Aff max (V ), and need to determine which of these types represent the true value of the peak response acceleration. According to the aforementioned test method, we know that when H = 0.6 m, Vth = 3.43 m/s. Therefore, the peak response acceleration of the dynamic compression test when V = 3.43 m/s, Aff max (V=3.43 ) must represent the true value. Actually, several Aff max (V=3.43 ) measurements were obtained during the dynamic compression test. Therefore, for data normalization, the average value of Aff max (V=3.43 ) must be calculated.
According to the analysis above, the data normalization equation Γ is defined as follows:
(8)
Considering two types of Aff max (V ), Eq. (8) is broken up into two equations, as shown in Eqs. (9) and (10):
(9)
(10)
Here, Acsmax (Vc ) is the peak response acceleration of the shock test when Vc is equal to a specific value (for example, Vc = 3.45 m/s). Furthermore, Aff max (Vold ) is the peak response acceleration of

J. Pac .Sci. Tech. Vol.21 No.4(2012)
- 289 -
the dynamic compression test based on the conventional theory when V is equal to the aforementioned Vc (i.e. V = 3.45 m/s). Similarly, Aff max (Vnew ) is the peak response acceleration of the dynamic compression test based on the friction theory when V = Vnew (Vnew is calculated whenVc = 3.45 m/s based on the friction theory, using the data obtained from the shock test).
Correction indicator Only considering the peak response acceleration of each test, Fig. 8 can be generalised to Fig. 9(a).
After data normalization, Fig. 9(a) changes to Fig. 9(b). Using parameter Γ we can compare the correction effect under different stresses. However, we cannot use Γbefore � Γafter to evaluate the correction effect, because according to Fig. 9(b), the error levels under different weight dummies differ widely.
We address this issue by proposing a new correction indicator ∆, defined as
(11)
By using the correction indicator ∆, Fig. 9(b) is changed to Fig. 9(c).
Shock testDynamic compression test (before correction)Dynamic compression test (after correction)Error of equivalent accuracy (before correction)Error of equivalent accuracy (after correction)
5 kg 12 kg Weight dummy
Pea
k re
spon
seac
cele
ratio
n
Weight dummy
Pea
k re
spon
seac
cele
ratio
n
5 kg 12 kg
5 kg 12 kg Weight dummy
Pea
k re
spon
seac
cele
ratio
n
(a) (b)
(c)
Fig. 9. Schematic representation of correction indicator
5 Discussions The experimental results are summarised in Table 3. Column ① lists the weights of the dummies
used. Column ② contains the average of Aff max (V=3.43 ). Column ③ shows the average of the friction under different stresses. The data in column ④ corresponds to the results obtained using the method presented in the section ‘Calculation of dGs’. The data presented in column ⑤ is the result of normalizing the data in columns ② and ④, Column ⑥ lists the correction indicator calculated by Eq. (11).
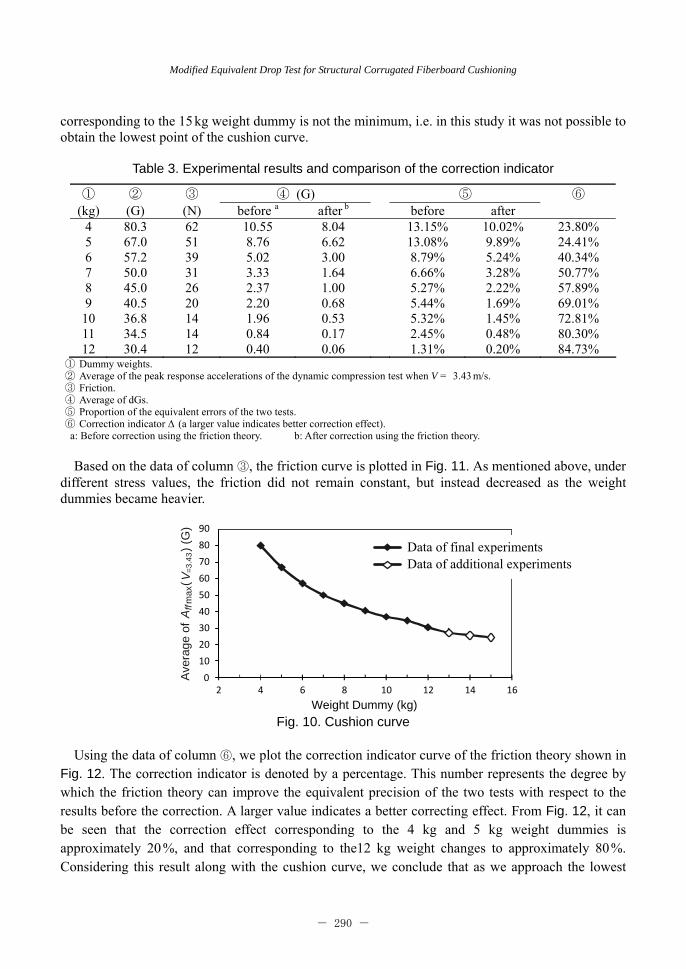
Using the data of column ②, we plot the cushion curve (solid points in Fig. 10). It is known that as the dummy weight increases, the peak response accelerations of the dynamic compression test decreases. Based on the equivalent drop theory, the same trend holds true for the shock test. To confirm the lowest point of the cushion curve, we performed additional experiments. In particular, we used a 15 kg weight dummy, as shown by hollow points in Fig. 10, which was within the technical specifications of our test equipment 11), 12). From Fig. 10, we can see that the point
Modified Equivalent Drop Test for Structural Corrugated Fiberboard Cushioning
- 290 -
corresponding to the 15 kg weight dummy is not the minimum, i.e. in this study it was not possible to obtain the lowest point of the cushion curve.
Table 3. Experimental results and comparison of the correction indicator
① ② ③ ④ (G) ⑤ ⑥ (kg) (G) (N) before a after b before after
4 80.3 62 10.55 8.04 13.15% 10.02% 23.80% 5 67.0 51 8.76 6.62 13.08% 9.89% 24.41% 6 57.2 39 5.02 3.00 8.79% 5.24% 40.34% 7 50.0 31 3.33 1.64 6.66% 3.28% 50.77% 8 45.0 26 2.37 1.00 5.27% 2.22% 57.89% 9 40.5 20 2.20 0.68 5.44% 1.69% 69.01%
10 36.8 14 1.96 0.53 5.32% 1.45% 72.81% 11 34.5 14 0.84 0.17 2.45% 0.48% 80.30% 12 30.4 12 0.40 0.06 1.31% 0.20% 84.73%
① Dummy weights. ② Average of the peak response accelerations of the dynamic compression test when V = 3.43 m/s. ③ Friction. ④ Average of dGs. ⑤ Proportion of the equivalent errors of the two tests. ⑥ Correction indicator ∆ (a larger value indicates better correction effect). a: Before correction using the friction theory. b: After correction using the friction theory.
Based on the data of column ③, the friction curve is plotted in Fig. 11. As mentioned above, under different stress values, the friction did not remain constant, but instead decreased as the weight dummies became heavier.
0
10
20
30
40
50
60
70
80
90
Weight Dummy (kg)2 4 6 8 10 12 14 16
(
)
(G)
Aff
=3.4
3m
axV
Aver
age
of
Data of additional experimentsData of final experiments
Fig. 10. Cushion curve
Using the data of column ⑥, we plot the correction indicator curve of the friction theory shown in Fig. 12. The correction indicator is denoted by a percentage. This number represents the degree by which the friction theory can improve the equivalent precision of the two tests with respect to the results before the correction. A larger value indicates a better correcting effect. From Fig. 12, it can be seen that the correction effect corresponding to the 4 kg and 5 kg weight dummies is approximately 20 %, and that corresponding to the12 kg weight changes to approximately 80 %. Considering this result along with the cushion curve, we conclude that as we approach the lowest

J. Pac .Sci. Tech. Vol.21 No.4(2012)
- 291 -
point of the cushion curve, the correction effect improves. Therefore, the correction effect becomes more apparent as the weight dummy increases.
There is a little correction effect when we use a light weight dummy. This result is attributed to the fact that the corrugated sleeve is constructed from nonlinear cushioning material. It should be pointed out that the correction effect of the area around the lowest point of the cushion curve is more significant than that of the left area, because the left area of the cushion curve is barely used 1).
Weight Dummy (kg)2 4 6 8 10 12 14
Ave
rage
of f
rictio
n (N
)
0
10
20
30
40
50
60
70
0
10
20
30
40
50
60
70
80
90
(
)
(G)
Aff
=3.4
3m
axV
Aver
age
of
( )Aff =3.43max VAverage of frictionAverage of
Fig. 11. Friction curve
Weight Dummy (kg)2 4 6 8 10 12 14
0
10
20
30
40
50
60
70
80
90
(
)
(G)
Aff
=3.4
3m
axV
Aver
age
of
( )Aff =3.43max VCorrection indicatorAverage of
0%
20%
40%
60%
80%
100%
Cor
rect
ion
indi
cato
r
Fig. 12. Correction indicator curve
6 Conclusions and Further Study To verify the feasibility of applying the friction equivalent drop theory to SCM, the influence of
stress was investigated in this study. A corrugated sleeve was used as a test material and weight dummies in the range of 4–12 kg were employed to calculate the stress. In addition, we investigated the effects of friction. Based on the hysteresis loop of the friction model, we predicted that friction decreases when stress increases and validated this prediction through test results. Moreover, we proposed new data analysis and results evaluation methods using statistics. The experimental results showed that although the equivalent errors of the two tests can be corrected by applying the friction equivalent drop theory, the correction effects were not the same under different stresses. The correction effect becomes more prominent as we approach the lowest point of the cushion curve.

Modified Equivalent Drop Test for Structural Corrugated Fiberboard Cushioning
- 292 -
Considering that packaging designers typically use the lowest point of the cushion curve to design transport packages, the results of our study have important practical significance.
The influence of the test material will be addressed in future studies. We will consider pulp mould as the test material because of its nonlinear cushioning characteristics and extensive use in transport packaging.
References [1] Katsuhiko SAITO and Kiyohide HASEGAWA, “Foundation and Applications of Transport
Package” (in Japanese), Saiwaishobo Inc., p11–p24, (2008). [2] Fanfu Li, Diana Twede, and James W. Goff, Packag. Technol. Sci., 6(4), p139–p146 (1993). [3] Katsuhiko SAITO and Kazuaki KAWAGUCHI, 23rd International Association of Packaging
Research Institutes Symposium, 3-5 September (2007). [4] Kazuaki KAWAGUCHI and Katsuhiko SAITO, J. Packag. Sci. & Technol., 17(1), p39–p45 (2008). [5] Katsuhiko SAITO and Chen ZHONG, 17th IAPRI World Conference on Packaging, p491–p495
(2009). [6] Chen ZHONG and Katsuhiko SAITO, J. Packag. Sci. & Technol., 19(2), p123–p135 (2010). [7] JIS Z 0240, “Structural Cushioning Materials for Packaging—Determination of Cushioning
Performance” , (2002). [8] Chen ZHONG and Katsuhiko SAITO, Journal of Applied Packaging Research, 4(4), p189–p201
(2010). [9] Chen ZHONG, Katsuhiko SAITO, and Kazuaki KAWAGUCHI, Journal of Applied Packaging
Research, 5(4), p197–p214 (2011). [10] Chen ZHONG, Katsuhiko SAITO, and Kazuaki KAWAGUCHI, Packag. Technol. & Sci., (2012). [11] Yoshida Seiki Co., Ltd., “Shock Machine User’s Guide” (in Japanese). ASQ-700 serial. [12] Yoshida Seiki Co., Ltd., “Dynamic Compression Tester User’s Guide” (in Japanese). ACST-200
serial. [13] Yukiomi NAKAGAWA, “Study on Packaging Design by Paper Cushioning Materials” (in Japanese).
Doctoral dissertation (2008). [14] Robert V. Hogg, Joseph W. McKean and Allen T. Craig, “Introduction to Mathematical Statistics”
(Sixth Edition), Pearson Education, p101–p107 (2005). [15] S. Bran, D. Ewins, and S. S Rao, “Encyclopedia of Vibration”, Academic Press, p629–p641 (2002).
Cyril M. Harris and Allan G. Piersol, “Harris' Shock and Vibration Handbook” (Fifth Edition), McGraw-Hill, p23.1–p23.26 (2002).
(Received 12April 2012)
(Accepted 16May 2012)

J. Pac .Sci. Tech. Vol.21 No.4(2012)
- 293 -
構造体段ボール緩衝材に対する改良等価落下試験
仲 晨、斎藤 勝彦 落下衝撃から包装内容品を保護するための緩衝材の性能は、動圧縮試験によって評価されるが、
複雑な形状の構造体緩衝材では、動圧縮試験ができないため、衝撃試験装置を用いた等価落下試
験で評価される。これまでの研究により、従来の等価落下試験における等価自由落下高さは精確
ではないことが指摘されている。その原因として、緩衝系に減衰の影響が無視できないことが挙
げられる。したがって、我々は減衰と摩擦の影響を考慮した理論に基づいた等価落下試験の方法
を提案し、段ボールから作られたスリーブを試験材料として、摩擦等価落下モデルによる等価落
下試験を行い、摩擦等価落下理論により両試験の等価度が上がることを実験的に確認した。また、
摩擦等価落下理論の有効性を十分に確認するためには、様々な要因を考慮しなければならないが、
これまでの実験的確認は限定的であったことから、本研究では、様々な静的応力条件下での等価
落下試験と動圧縮試験を行った。その結果、摩擦等価落下理論は構造体段ボール緩衝材に適用で
きること、及びその改善効果を定量的に示すことができた。 キーワード: 包装、輸送、緩衝、段ボール、等価落下