Modern Electronic Technology - ojs.s-p.sg
40
Transcript of Modern Electronic Technology - ojs.s-p.sg


Modern Electronic Technology
Aims and ScopeModern Electronic Technology (MET) is an open access, peer-reviewed scholarly journal which aims to publish original research articles, reviews and short communications that covers all area of electronic engineering technology. MET emphasizes on publishing high quality papers, as well as aims to provide a source of information and discussion platform for engineers, researchers, and electronic professionals worldwide.
Microelectronics
Nanoelectronics
Electronic Materials Technology
Structure and Nature of Semiconductor
Digital Technology
Automation System
Publishing Cycle
Quarterly
Journal Homepage
http://ojs.s-p.sg/index.php/met
Key Features
Open Access
High Academic Level Editorial Board
Easy and Fast Submissions
Double Blind Peer Review
Rapid Online Publication of Articles upon Acceptance
Outlet for Academic Institutions and Industry

CopyrightModern Electronic Technology is licensed under a Creative Commons-Non-Commercial 4.0 International Copyright (CC BY-NC4.0). Readers
shall have the right to copy and distribute articles in this journal in any form inany medium, and may also modify, convert or create on the basis of articles. In sharing and using articles in this journal, the user must indicate the author and source, and mark the changes made inarticles. Copyright © SYNERGY PUBLISHING PTE. LTD. All Rights Reserved.
Kanya Maha Vidyalaya, IndiaFuture Institute of Engineering & Management, IndiaZhejiang Ocean University, ChinaShanghai Maritime University, ChinaShanghai University, ChinaTongling University, ChinaInstitute of Cosmic Studies of Natural Resources, AzerbaijanUniversidade Federal do Pará, BrazilIslamic Azad University, IranMicro Systems Engineering GmbH, GermanyInje University, IndiaNanjing University of Information Science & Technology, ChinaHenan University, ChinaNingbo University, ChinaCollege of Engineering Guindy, IndiaUniversity of São Paulo, IndiaAnna University, IndiaUnitySC, ItalySilicon Institute of Technology, IndiaInstitute of Engineering and Technology, IndiaNational Institute of Technology Rourkela, IndiaSri Ranganathar Institute of Engineering and Technology, IndiaHassan II University of Casablanca, KoreaManipal University, IndiaJamia Millia Islamia, IndiaHebei University of Economics and Business, ChinaKocaeli University, TurkeyFukuoka Institute of Technology, JapanInstitute of Nanotechnolo-gies of Microelectronics of Russian Academy of Sciences, Russian FederationTabriz Branch, Islamic Azad University, IranHodeidah university & Universiti Teknologi Malaysia, MalaysiaK. H. College, Gargoti, IndiaGITAM University, IndiaOakland University, AucklandInstitute of Nuclear Sciences Vinca, ChinaSuez Canal University, Egypt Nehru Arts and Science College, IndiaRenewable Energy, ESTIAnnaba, AlgeriaIFPR: Federal Institute of Parana, BrazilOP Jindal University, Raigarh, IndiaUniversity of ValencienneUniversity of Valenciennes, France
Editor-in-ChiefAssociate Editor
Editorial Board Members
Sangeeta PrasherBiswajit GhoshYuliang LiuTianhao TangGuoqing XuSonglin ZhouE. A. KerimovJordan Del NeroMorteza Khoshvaght-AliabadiRainer DohleSandeep KumarJianhua ChangWeizhou HouHan JinR. K. MugelanNirav JoshiA. K. P. KovendanDario AlliataUmakanta NandaNeeraj Kumar MisraTrupa SarkarJ.ManikantanAyoub GounniLokesh GargRayees Ahmad ZargarJianke LiFarzin AsadiKei EguchiSergey Bulyarskiy
Nima Jafari Navimipour Waleed Al-RahmiSharadrao Anandrao Vanalakar K.R.V. SubramanianShital JoshiSnezana BoskovicAhmed M. NawarRanjith Kumar Rajamani Mourad HouabesBeatriz dos Santos PêsAshok K Srivastava Christophe DELEBARRE
Volume 5 Issue 1 · April 2021ISSN 2591-7110 (Print) ISSN 2591-7129 (Online)
Synergy Publishing Pte.Ltd.
E-Mail: [email protected] Website: www.s-p.sg
Address: 12 Eu Tong Sen Street,#07-169, Singapore 059819

CONTENTS
1 An Improved NID Steganography Method for Low Bitrate Speech on VoIP
Jin Liu Yiwen Zhang
5 Impact of Photovoltaics
Zhihan Zhang Qiaoyu Wang Demou Cao Kai Kang
10 Product Promotion Prediction Model Based on Evaluation Information
Qixiu Kang Jing Tang Yuming Wang
15 Design and Implementation of Mobile Intelligent Hidden Danger Inspection System
Hongtao Ma Hongsheng Guo Luyao Li
20 Investigation on the Application Value of Infrared Forehead Temperature Gun in Body Temperature
Screening of New Crown Epidemic
Kuanlong Shi Jiaxi Zhang Jiawen Wang
24 A Clustering Analysis Method for Massive Music Data
Yanping Xu Sen Xu

1
Modern Electronic Technology | Volume 05 | Issue 01 | April 2021
Distributed under creative commons license 4.0 DOI: https://doi.org/10.26549/met.v5i1.6167
Modern Electronic Technology
https://ojs.s-p.sg/index.php/met
An Improved NID Steganography Method for Low Bitrate Speech on VoIP
Jin Liu* Yiwen Zhang College of Computer Science and Technology, National Huaqiao University, Xiamen, Fujian, 361021, China
ARTICLE INFO ABSTRACT
Article historyReceived: 14 January 2021Revised: 21 February 2021Accepted: 9 April 2021Published Online: 16 April 2021
In the procedure of encoding process on low bitrate speech, fixed code-book division is an efficient and promising embedding method for steg-anography. An improved neighbor index division (NID) steganography method based on the high bitrate frame of G.723.1 codec (6.3kbit/s) is proposed, which employs the parity and low distortion of neighbor indi-ces for G.723.1 fixed codebooks. Differing from previously NID method which performs quantized index modulation (QIM) beforehand, the proposed method divides codeword indices into separate sub-codebooks according to the secret message bits dynamically in the original G.723.1 codec quantization period. Compared with existing NID method, our pro-posed method doesn’t need to divide the codebook before the encoding starts. The embedding and codebook dividing happen simultaneously, which utilizes the characteristics of specific secret message bits. The ex-periment results show that the proposed method has a much lower quality degradation for the decoding speech and still fulfills the low latency re-quirement for communication.
Keywords:Low Bitrate SpeechSteganographyVoice Over IPQIM
*Corresponding Author:Jin Liu,College of Computer Science and Technology, National Huaqiao University, Xiamen, Fujian, China;E-mail: [email protected].
1. Introduction
With the rapid growth of traffics on the Internet, es-pecially on cloud computing and Internet of Things, the opportunity of steganography on various covers has come, such as the speech flow for Internet telephone services. Voice over IP (VoIP) is one type of main service among them, which becomes an appropriate type of covert car-rier for secret communication [1]. Compared with other types of steganography covers, the low bit-rate speech in VoIP has many advantages. The first is the huge amount of flow it brings for communication, which always means more embedding capacities. And on the other hand is the instantaneity of it, which left limited analyzing time for a malicious listener[2]. From another point of view, the low bitrate feature makes the redundancy in speech covers
limited, which is the fundamental for steganography.Many steganography methods have been published for
low bitrate speech, which can be roughly divided into two groups. The first one takes advantage of the networking protocols underlying VoIP service, such as RTP/RTCP[3]. However, the restricted segment of the protocol headers makes this type of steganography vulnerable, and always has a low embedding capacity[4]. The other type exploits the huge amount of redundancies in the abundant speech payloads of VoIP packets. The commonly used speech codecs are SILK, ITU-T G.729, ITU-T G.723.1[5], IETF iLBC etc. Within this type of steganography, the embed-ding methods includes variant least significant bit (LSB)[6], speech bitrate switch[7] and quantized index modulation (QIM)[8]. This type of methods always bring less change

2
Modern Electronic Technology | Volume 05 | Issue 01 | April 2021
Distributed under creative commons license 4.0
to the flow feature, yet influence the receiving speech quality.
The QIM method in the second group employs the internal feature of speech codec, which divides the quan-tization codebook into separate groups (sub-codebooks). In the speech encoding procedure the groups in which the encoding algorithm searches for parameter quantiza-tion depends on the secret bits for transmission. For this reason the performance of the steganography methods largely lie on the codebook division approaches, which may influence the speech distortion after decoding and the embedding capacity of covert communication. Previ-ously proposed methods[8] often use offline algorithms to divide the codebooks beforehand, which low the amount of processing time for steganography. However, the of-fline algorithms always base on the average tested speech loss and introduced secret bits, the real time speech and current secret bits may differ from it. As a result, taking advantage of the individually introduced characteristics to each frame could reduce the distortion for the speeches. The rest of the paper is organized as follows.
In section 2, we briefly discuss the quantization proce-dure of G.723.1 speech codec and the existing neighbor index modulation (NID) steganography. The proposed improved NID steganography is given in section 3. Then section 4 gives the experiment and performance analysis of it. In the end, section 5 concludes the whole paper.
2. G.723.1 Speech and NID Steganography
G.723.1 is a speech encoding standard specifies in ITU-T Recommendation[9], which compresses the original PCM speech into 6.3kbit/s frames(low bitrate) and 6.3kbit/s frames(high bitrate). G.723.1 belongs to parameter based speech coding method, which encodes PCM speech into frames made up of fixed frame parameters. It is suitable for real time VoIP applications especially at bandwidth limited circumstances. QIM steganography mainly fo-cuses on the quantization stage of line spectral pair (LSP) coefficients which consists of three separate codebooks. Table 1 shows the three fixed codebooks for LSP quanti-zation, where the dimension value denote the number of values for each codeword (vector). Codebooki in Table 1. is made up of 256 codewords with an index ranging from 0 to 255.
Table 1. Fixed Codebooks of G.723.1 6.3kbit/s Frame
LSP Quantization Index Length(bits) Codewords Dimension
Codebook0 8 256 3
Codebook1 8 256 3
Codebook2 8 256 4
QIM based methods divide each codebook into sepa-rated sub-codebooks, which construct different redundant states for input speech on the LSP quantization procedure, thus secret bits could be embedded accordingly into the indices of sub-codebooks. Figure 1 gives a brief descrip-tion of the embedding procedure based on LSP quantiza-tion.
Figure 1. QIM and NID algorithm for G.723.1 codec
The key point for Fig.1 is the codebook division algo-rithm, which includes CNV[10], NID[8], etc. In NID steg-anography, the codebooks are divided according to the parity of the codeword indices. The codewords in each codebook are separated into n sub-codebooks offline be-fore the encoding starts, where n depends on the specific embedding capacity of each codebook needed for each cover communication session. That is, the secret bits are embedded based on the value of indices into which the LSP coefficients are quantized.
3. Improved NID Steganography Method
For both NID and CNV codebook dividing algorithms, the main principle is to separate the nearest indices into different sub-codebooks. However, the search process for all nearest neighbor indices in CNV[10] has a time com-plexity about O(nn), where n is the number of indices. It is a time-consuming process, so the codebook dividing for CNV method is always performed aforehand before the G.723.1 encoding starts. When it comes to NID method, the indices are separated inside or outside of the G.723.1 codec, because the codebook division operation has no relationships with the vector quantization process. NID is only responsible for separating adjacent indices into different sub-codebooks. For instance, if indexi is sup-posed to be classified into sub-codebooki, then its adjacent indexi-1 and indexi+1 must be put into the sub-codebook(s) differing from sub-codebooki.
As the NID method doesn’t take the quantization into account, the onsite secret bits will affect the LSP quanti-zation process, thus influence the restored speech quality on the receiver side. Instead, our proposed method uses original searching process, and searches more indices (l >=1) for steganography, which has at least two advan-tages. On one hand, the search is performed online, on the worst condition the second optimal index is used for steg-
DOI: https://doi.org/10.26549/met.v5i1.6167

3
Modern Electronic Technology | Volume 05 | Issue 01 | April 2021
Distributed under creative commons license 4.0
anography. So that the distortion will be reduced to the limit. On another hand, the additional information, such as the previously divided sub-codebooks, will not needed to be transferred to the receiver, which results flexible covert communication. For the proposed improved NID algo-rithm, we set l to 2. It means that the resulted number of indices for the search algorithm is two (vi and vi’), where vi is the optimal index for the search algorithm of G.723.1 and vi’ is the second optimal one. The main step for the search operation for LSB quantization is described as fol-lows.
For the input LSP coefficients pi and secret bit bi, if bi == 0 and vi mod 2 == 0 then return vi, else if bi == 1 and vi mod 2 == 1, return vi, else if bi == 1 and vi mod 2 == 0 and vi’ mod 2 == 1, return vi’, else if bi == 1 and vi mod 2 == 0 and vi’ mod 2 == 0, return vi - 1 or vi + 1 (use alter-native neighbor index). The embedding process is illus-trated in Figure 2, where all the three fixed codebooks of G.723.1 speech codec are used and the steganography bits are shown as examples of different cases. The key feature is that the steganography operation is performed within the original G.723.1 codec, additionally, one more optimal index is searched out compared with the primitive quanti-zation.
Figure 2. Improved NID Steganography
In the improved NID method, optimal and second op-timal indices are obtained by real time search operation, which utilizes the characteristics of each LSP parameter to be quantized. In this regard, the steganography opera-tion is optimized compared with the previously divided sub-codebook methods, which only take the average parameter features into account. The introduced time con-sumption is low as only 2 optimal indices are searched and the processing time for this operation takes up a low percentage in the G.723.1 encoding process. The time complexity for searching is O(n), and the second optimal index is get by simply excluding the optimal index when performing a second search operation or searching for two optimal indices in a single searching function. The first way is much easier on implementation, and the second way is more time efficiency. If the two optimal indices doesn’t fulfill the embedding requirements, then NID method is used. That is, use the adjacent index as the re-sult (steg codeword index).
4. Experiment and performance analysis
Because of the optimal searching for vertices of the proposed method, the speech quality after embedding out-performs previous QIM based method, such as NID and CNV. To demonstrate it, we adopt perceptual evaluation speech quality (PESQ)[11] criterion to evaluate the degrad-ed speech quality after steganography. PESQ is an ITU-T Recommendation for objectively evaluating speech qual-ity, which can be translated into Mean Opinion Score—Listening Quality Objective (MOS-LQO) ranged from 1.017 to 4.549. The sample datasets are collected from news reports and daily conversations, which include four categories: Male Mandarin (MM), Female Mandarin (FM), Male English (ME) and Female English (FE).
Table 2. Speech quality evaluation using PESQ
SamplesMOS-LQO
G.723.1 CNV NID Improved NID
MM 3.522 3.488 3.481 3.501
FM 3.405 3.329 3.326 3.358
ME 3.324 3.302 3.296 3.311
FE 3.265 3.237 3.233 3.242
Mean Value 3.379 3.339 3.334 3.353
Decrease (%) - 1.18 1.33 0.77
Table 2 gives the PESQ evaluation results of G.723.1, CNV, NID and our proposed improved NID. The G.723.1 column evaluates the speech degrading after the original G.723.1 encoding and decoding, where the input are the sample PCM speech and decoded speech after the decod-ing of received G.723.1 frames. We give the translated MOS-LQO value of them, which is more intuitive. The results show that the improved NID steganography has a better speech quality, which is only decreased with 0.77% compared with original G.723.1 speech. In addition, to fulfill the real time requirement for communication, we also tested the latency introduced by the proposed method. The additional latency introduced for MM, FM, ME and FE are less than 35 in average on an Intel Pentium E5200 processor with the 2.5 GHz frequency, which is much less than the G.723.1 encoding duration about 800. Moreover, compared with the 150ms end to end latency requirement for communication, the introduced latency by improved NID steganography is negligible.
5. Conclusion
An improved NID steganography method is proposed in this paper, which utilizes the inherent search process of G.723.1 quantization. The embedding operation is per-
DOI: https://doi.org/10.26549/met.v5i1.6167

4
Modern Electronic Technology | Volume 05 | Issue 01 | April 2021
Distributed under creative commons license 4.0
formed within the codec, so that it is almost the lowest distortion introduced for steganography among those QIM based methods. The experimental results show that this method outperforms previous CNV and NID methods, yet still fulfills the real time requirement of communication.
6. Acknowledgements
This work is supported in part by the First Batch of Youth Innovation Fund Projects in 2020 under Grant No.3502Z202006012 and the Experimental Teaching Re-form Project of National Huaqiao University under Grant No.SY2019L013.
References
[1] Peng J, Tang S. Covert Communication over VoIP Streaming Media with Dynamic Key Distribution and Authentication[J]. IEEE Transactions on Indus-trial Electronics, 2020.
[2] Yang H, Yang Z, Huang Y. Steganalysis of voip streams with cnn-lstm network[C]//Proceedings of the ACM Workshop on Information Hiding and Mul-timedia Security. 2019: 204-209.
[3] Azadmanesh M, Mahdavi M, Ghahfarokhi B S. A reliable and efficient micro-protocol for data trans-mission over an RTP-based covert channel[J]. Multi-media Systems, 2019: 1-18.
[4] Zhang X, Tan Y A, Liang C, et al. A covert channel over volte via adjusting silence periods[J]. IEEE Ac-cess, 2018, 6: 9292-9302.
[5] Kabal P. ITU-T G. 723.1 speech coder: A matlab im-plementation[J]. McGill Univ, 2004.
[6] Yang W, Tang S, Li M, et al. Markov bidirectional transfer matrix for detecting LSB speech steganogra-phy with low embedding rates[J]. Multimedia Tools and Applications, 2018, 77(14): 17937-17952.
[7] Liu J, Tian H, Zhou K. Frame-bitrate-change based steganography for voice-over-IP[J]. Journal of Cen-tral South University, 2014, 21(12): 4544-4552.
[8] Liu J, Tian H, Lu J, et al. Neighbor-index-division steganography based on QIM method for G. 723.1 speech streams[J]. Journal of Ambient Intelligence and Humanized Computing, 2016, 7(1): 139-147.
[9] ITU-T Rec. G.723.1. Dual rate speech coder for mul-timedia communications transmitting at 5.3 and 6.3 kbit/s[S], 2006.
[10] Tian H, Liu J, Li S. Improving security of quantiza-tion-index-modulation steganography in low bit-rate speech streams[J]. Multimedia systems, 2014, 20(2): 143-154.
[11] ITU-T Rec. P.862. Perceptual evaluation of speech quality (PESQ): an objective method for end-to-end speech quality assessment of narrow-band telephone networks and speech codecs[S]. 2001.
DOI: https://doi.org/10.26549/met.v5i1.6167

5
Modern Electronic Technology | Volume 05 | Issue 01 | April 2021
Distributed under creative commons license 4.0 DOI: https://doi.org/10.26549/met.v5i1.6315
Modern Electronic Technology
https://ojs.s-p.sg/index.php/met
Impact of Photovoltaics
Zhihan Zhang* Qiaoyu Wang Demou Cao Kai Kang Electrical and Computer Systems Engineering Department, Monash University, Melbourne, Victoria, Australia
ARTICLE INFO ABSTRACT
Article historyReceived: 26 February 2021Revised: 7 March 2021Accepted: 9 April 2021Published Online: 16 April 2021
Photovoltaics (PV) can convert sunlight into electricity by making use of the photovoltaic effect. Solar panels consist of photovoltaic cells made of semiconductor materials (such as silicon) to utilise the photovoltaic effect and convert sunlight into direct current (DC) electricity. Nowadays, PV has become the cheapest electrical power source with low price bids and low panel prices. The competitiveness makes it a potential path to miti-gate the global warming. In this paper, we investigate the relationship of PC array output with irradiance and temperature, the performance of PV array over 24 hours period, and the simulation of PV micro grid by MAT-LAB simulation.
Keywords:Photovoltaics ArrayIrradianceTemperatureMicrogrid Simulation
*Corresponding Author:Zhihan Zhang, Master of Professional Electrical Engineering, Electrical and Computer Systems Engineering Department, Monash University, Melbourne, Victoria, Australia;E-mail: [email protected].
1 Introduction
Nowadays, the demand of renewable energy increases along with innovation of technology and corresponding business. In Australia, the common application of solar energy is the residential solar panels installed on the roof-tops, which use photovoltaics to generate electricity in a clean and sustainable way. In this lab, we are going to investigate the effect of photovoltaics on residential micro grid.
In the first section. We use MATLAB Simulink to es-tablish PV Array models which is composed of PV array, one phase DC/AC converter, inverter control module and LCL filter. We put real world irradiance data from the Australian PV Institute into our model and observe the output of PV array, DC/AC inverter and LCL filter which suppresses high frequency harmonics generated by PWM switching frequency.
The next section is to investigate the PV performance. We obtain data of a 24shours cycle in the summer from APVI. These irradiance and temperature information is fed into our model and calculate the output power, then compare it with the residential daily consumption.
The final section is analysing the impact of PV in res-idential micro grid. The task is observing the PV supply in a 24-hours period, adjusting the output power of solar module and discover the upper limit to prevent exceed power in microgrid, simulation of power grid with curtail-ment and explore the effect of battery in micro grid[1-3].
2. The photovoltaic Array Model
2.1. Design of PV Model
The photovoltaic array model has four components: The PV array which has fourteen 250 W solar modules connected in series, DC/AC inverter with a single-phase
6
Modern Electronic Technology | Volume 05 | Issue 01 | April 2021
Distributed under creative commons license 4.0
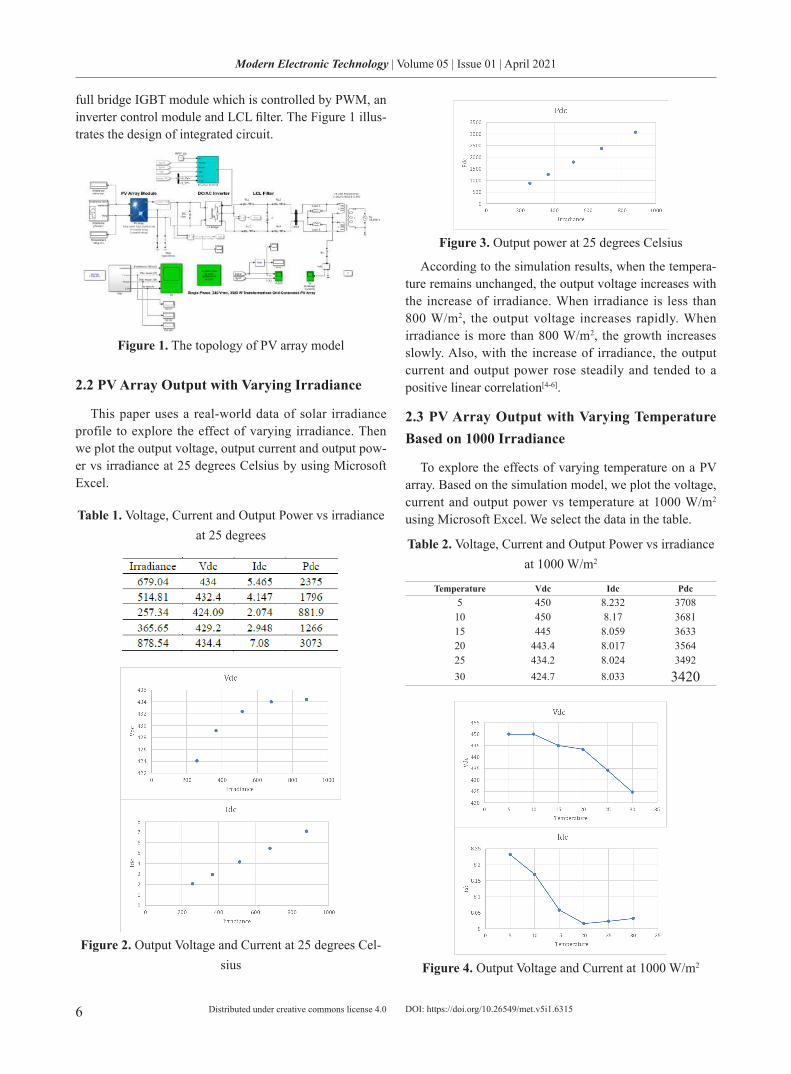
full bridge IGBT module which is controlled by PWM, an inverter control module and LCL filter. The Figure 1 illus-trates the design of integrated circuit.
Figure 1. The topology of PV array model
2.2 PV Array Output with Varying Irradiance
This paper uses a real-world data of solar irradiance profile to explore the effect of varying irradiance. Then we plot the output voltage, output current and output pow-er vs irradiance at 25 degrees Celsius by using Microsoft Excel.
Table 1. Voltage, Current and Output Power vs irradiance at 25 degrees
Figure 2. Output Voltage and Current at 25 degrees Cel-sius
Figure 3. Output power at 25 degrees Celsius
According to the simulation results, when the tempera-ture remains unchanged, the output voltage increases with the increase of irradiance. When irradiance is less than 800 W/m2, the output voltage increases rapidly. When irradiance is more than 800 W/m2, the growth increases slowly. Also, with the increase of irradiance, the output current and output power rose steadily and tended to a positive linear correlation[4-6].
2.3 PV Array Output with Varying Temperature Based on 1000 Irradiance
To explore the effects of varying temperature on a PV array. Based on the simulation model, we plot the voltage, current and output power vs temperature at 1000 W/m2 using Microsoft Excel. We select the data in the table.
Table 2. Voltage, Current and Output Power vs irradiance at 1000 W/m2
Temperature Vdc Idc Pdc 5 450 8.232 3708 10 450 8.17 3681 15 445 8.059 3633 20 443.4 8.017 3564 25 434.2 8.024 3492 30 424.7 8.033 3420
Figure 4. Output Voltage and Current at 1000 W/m2
DOI: https://doi.org/10.26549/met.v5i1.6315

7
Modern Electronic Technology | Volume 05 | Issue 01 | April 2021
Distributed under creative commons license 4.0
Figure 5. Output Power at 1000 W/m2
According to the simulation results, when the irradiance is fixed, the output voltage drops with the drop of tempera-ture. When the temperature over 20C, the output voltage drops rapidly. With the increase of irradiance, the output current and output power have a negative linear correlation.
3. Investigating PV Performance over 24 Hours
The section is to simulate the single-phase PV model to view the performance of the PV model over a 24-hour cy-cle. Also, we only investigate day-time changes. We select the data of the table 3.
Table 3. 24h Output Power vs irradiance
Timestamp Irradiance BOM Temperature (C) Pdc2020-01-01 06:00:00 +1000 14.37 12.8 45.882020-01-01 07:00:00 +1000 74.59 15.9 253.62020-01-01 08:00:00 +1000 239.35 19.5 838.22020-01-01 09:00:00 +1000 460.83 20.6 16342020-01-01 10:00:00 +1000 673.3 22.8 23772020-01-01 11:00:00 +1000 826.85 22.2 29262020-01-01 12:00:00 +1000 925.16 22.6 32662020-01-01 13:00:00 +1000 959.7 24 33672020-01-01 14:00:00 +1000 929.01 25.2 32452020-01-01 15:00:00 +1000 821.47 26.6 28552020-01-01 16:00:00 +1000 680.19 25 23792020-01-01 17:00:00 +1000 508.42 24.7 17752020-01-01 18:00:00 +1000 287.74 23.7 995.32020-01-01 19:00:00 +1000 94.18 22.2 314.12020-01-01 20:00:00 +1000 18.97 20.8 58.95
Figure 6. Output Power in one day time
From 6 a.m. to 8 p.m. PV generates power. PV gen-erates energy, which peaks at 1 o 'clock in the afternoon. Pdc mean is 1755.335 W in PV working time. Pdc mean is 1097.085 W.
Compared with a typical household energy consump-tion. It can be seen from the figure that a typical family has peak electricity consumption in two time periods. The first period is about 7 am to 9 am, when electricity use is quite high, and people are just getting up to study and go to work. The second time is around 6 pm to 10 pm, when people have dinner and bedtime activities at home. Between 10 pm and 7 am, people tend to be asleep and use less electricity. People usually study and work outside from 9 am to 6 pm, so households use less electricity. As a result, less electricity is used between 10 pm and 7 am and 9 pm and 6 pm[7-8].
Figure 7. The energy use of a typical household
4. 24 Hour Simulation of Microgrid
In this section, this paper simulates a residential mi-cro-grid consisting of multiple households and a PV array to observe the impact of the PV array on the residential micro-grid’s performance.
Figure 8. Simplified model of household microgrid
From the scopes, we find the relation that Power_PV = Power_Load + Power_ Secondary, which means the pow-er of the load is equal to the PV power plus the power of the secondary side.
DOI: https://doi.org/10.26549/met.v5i1.6315

8
Modern Electronic Technology | Volume 05 | Issue 01 | April 2021
Distributed under creative commons license 4.0
Figure 9. Secondary side, PV side and load side voltage
5. 24 Hour Simulation of Microgrid with Bat-tery Storage
In this section, we simulate the Micro-grid with Battery Storage to observe the performance, a battery model is added at original microgrid
Figure 10. Simplified model of household microgrid with battery
Figure 11. Secondary side, PV side and load side voltage
After the battery is added, the power of the secondary side is maintained at 0. If the battery is not added, the power of the secondary side is maintained at 0, and the upper limit of PV power is 800W. When the PV works normally, the PV power must be greater than 800W, and then the power of the secondary side cannot be guaranteed to be 0. When people's electricity consumption is less than
the upper limit of PV power generation, that is, excess electricity generation, the power on the secondary side will be greater than 0. Therefore, when the battery is add-ed, the PV generated power can be stored in the battery, thus reducing the PV power and keeping the power of the secondary side at 0. Improved energy efficiency. When people’s electricity consumption is greater than the upper limit of PV power generation, that is, the excess electricity consumption, the power on the secondary side will be less than 0. After the battery increased, the amount of pow-er generated before PV can be used, thus improving the power of the secondary side and keeping the power of the secondary side at 0, which improved the energy efficien-cy[9-15].
6. Conclusion
Photovoltaics effect of solar panel could generate elec-tricity by sunlight and support residential microgrid. The output power, voltage and current in PV array is affected by irradiance and temperature. With the increase of irradi-ance, output power of PV module increases rapidly. How-ever, temperature has a negative correlation with PV’s performance.
The performance of PV is constrained to sunlight. From our observation, PV works in the daytime and reach its peak performance at midday. By comparison to mean household energy consumption, the output of PV may not be sufficient in high-demand period like morn-ing and night especially at summer. After we investigate the impact of PV on residential micro grid, we found that the output power may exceed the threshold of micro grid especially in the afternoon when PV has peak perfor-mance. The feasible solution is to equip a battery storage in micro grid. It could maintain the secondary power to zero and avoid overvoltage phenomenon. Furthermore, it would provide energy when people’s electricity con-sumption surpasses the upper limit of PV power genera-tion.
References
[1] Bhandari, K. P. Energy payback time (EPBT) and energy return on energy invested (EROI) of solar photovoltaic systems: A systematic review and me-ta-analysis. Renewable and Sustainable Energy Re-views,2015:133-141.
[2] Carlo A D , Lamanna E , Nia N Y . Photovolta-ics[J]. The European Physical Journal Conferences, 2020(246):00005.
[3] Hashikura K , Namba K , Kojima A . Periodic Con-straint-tightening MPC for Switched PV Battery
DOI: https://doi.org/10.26549/met.v5i1.6315

9
Modern Electronic Technology | Volume 05 | Issue 01 | April 2021
Distributed under creative commons license 4.0
Operation[J]. IET Control Theory and Applications, 2018, 12(15):2010-2021.
[4] Jayalath, S. &. An LCL-Filter Design With Optimum Total Inductance and Capacitance. IEEE Transactions on Power Electronics, 2018,33(8), 6687-6698. .
[5] Koutroulis, E., Kolokotsa, D., Potirakis, A., et al. Methodology for optimal sizing of stand-alone pho-tovoltaic/wind-generator systems using genetic algo-rithms. Solar energy, 2006:1072-1088.
[6] L. Liu, W. M. Solutions for reducing facilities elec-tricity costs. Australian Ageing Agenda, 2017:39-40.
[7] Maammeur, H. H. Performance investigation of grid-connected PV systems for family farms: case study of North-West of Algeria. Renewable & Sus-tainable Energy Reviews, 2017:78.
[8] Mathews, I., Kantareddy, S. N., Buonassisi, T., et al. Technology and Market Perspective for Indoor Pho-tovoltaic Cells. 2019:1415-1426.
[9] Matteocci, F., Vesce, L., Kosasih, F. U., et al. Fab-rication and Morphological Characterization of High-Efficiency Blade-Coated Perovskite Solar Modules. ACS Applied Materials & Interfaces, 2019:25195–25204.
[10] Miller, W., Liu, L. A., Amin, Z., et al. Involving oc-cupants in net-zero-energy solar housing retrofits: An Australian sub-tropical case study. Solar Energy, 2018:390-404.
[11] Parrish P T. Photovoltaic Laboratory: Safety, Code-Compliance, and Commercial Off-the-Shelf Equipment[M]. Florida: Crc Press,2018.
[12] Pathak, M. J., Sanders, P. G., Pearce, J. M. Optimiz-ing limited solar roof access by exergy analysis of solar thermal, photovoltaic, and hybrid photovoltaic thermal systems. Applied Energy, 2014:115-124.
[13] Rasekh, N. &. LCL filter design and robust convert-er side current feedback control for grid-connected Proton Exchange Membrane Fuel Cell system. Inter-national Journal of Hydrogen Energy, 2020,45(23), 13055-13067.
[14] Sumathi S , Kumar L A, Surekha P . Solar PV and Wind Energy Conversion Systems[M]. Springer In-ternational Publishing, 2015.
[15] Teran, A. S., Wong, J., Lim, W., et al. AlGaAs Photo-voltaics for Indoor Energy Harvesting in mm-Scale Wireless Sensor Nodes. IEEE Transactions on Elec-tron Devices, 2015:2170-2175.
DOI: https://doi.org/10.26549/met.v5i1.6315

10
Modern Electronic Technology | Volume 05 | Issue 01 | April 2021
Distributed under creative commons license 4.0 DOI: https://doi.org/10.26549/met.v5i1.6373
Modern Electronic Technology
https://ojs.s-p.sg/index.php/met
Product Promotion Prediction Model Based on Evaluation Information
Qixiu Kang* Jing Tang Yuming Wang College of Artificial Intelligence, North China University of Science and Technology, Tangshan, Hebei, 063000, China
ARTICLE INFO ABSTRACT
Article historyReceived: 3 March 2021Revised: 10 March 2021Accepted: 9 April 2021Published Online: 16 April 2021
This paper mainly studies the impact of evaluation information on e-com-merce platform on the future of products. Through natural language pro-cessing and rating, an evaluation model based on user rating and evalua-tion is defined to measure product quality. Among them, evaluations are differentiated: review sentiment coefficient (R) and review length (L).The evaluation model is:. In order to predict the future reputation of products, based on the above evaluation model, time series is used to rank the prod-ucts studied. Each customer purchases the product through Markov chain model, so as to predict the probability of future word-of-mouth spread of the product. Use TOPSIS method to select monthly sales, stars and com-ment sentiment coefficient as indicators. The comprehensive measure-ment method based on text and score is determined to predict whether the product is successfully promoted.
Keywords:NLPMarkov chainsTOPSISProduct promotion
*Corresponding Author:Qixiu Kang, College of Artificial Intelligence, North China University of Science and Technology, Tangshan, Hebei, 063000, China; E-mail: [email protected].
1. Rating Evaluation Model
Based on the interactivity, anonymity and convenience of the Internet, more and more people are willing to share their review information on various websites. Compared with traditional offline reviews, online reviews have the characteristics of wide range, large amount of information, anonymity, and storage.[1] Online reviews can express personal opinions more conveniently. Taking Amazon as an example, it provides customers with an opportunity to rate and review purchases. Customers can use “star rat-ings” to indicate their level of satisfaction with a product. In addition, customers can submit “reviews” to express further opinions and information about the product. At the same time, other customers can submit “helpfulness ratings” based on these reviews to assist their own product purchasing decisions. Companies can analyze these data to gain insights into the markets operation and potential success of product design feature choice.
The important factors that affect the product are rating and comment, so these two factors should be considered when building the model. The higher the star rating, the better the product; the longer the comment, the higher the review sen-timent coefficient, and the higher the comment helpfulness.[2] It should be noted that reviews and star ratings should corre-spond to each other. But in real life, “five-star bad reviews” and “one-star black powder” and other situations appear fre-quently. So the data needs to be processed first, remove data that does not match star ratings with reviews.
The process of natural language processing is as fol-lows:
Figure 1. NLP flowchart

11
Modern Electronic Technology | Volume 05 | Issue 01 | April 2021
Distributed under creative commons license 4.0 DOI: https://doi.org/10.26549/met.v5i1.6373
Using the normalized star rating and review sentiment coefficient, the star rating and review rating are standard-ized as weights, and the normalized star ratings and review rating data were used to normalize star ratings and the weight is used to measure the quality of a certain product.
Figure 2. NLP flowchart
A research shows that customers usually tend to look at reviews rather than star ratings when purchasing products. So this article considers customer purchase psychology when setting weights. The product star weight is set to 30%, and the comment weight is set to 70%.[3-4]
Among them, the comment length weight is set to 30%, and the review sentiment coefficient weight is set to 70%. That is:
D=0.3×S+0.7×(0.3×L+0.7×R)
2. Product Reputation Development Trend Model
Every sales and review process of the product is an event. The comprehensive prediction of the event can not only obtain various possible results of the event, but also give the probability of each result. Therefore, Mar-kov prediction method is selected to predict the future time changes according to the current time situation and explore the development trend of product reputation in online market.[5]
2.1 State Division
According to the data measurement method determined above, the final score of the selected product can be ob-tained. [6] Since the final score of the selected product is between 0 and 1, the final score of the product is divided into five states. The criteria are as follows:
Table 1. Reputation status classification criteria
Status Level Condition value intervalS1 C- 0-0.2S2 C 0.2-0.4S3 B 0.4-0.6S4 A- 0.6-0.8S5 A 0.8-1
2.2 State Transition Probability and Transition Probability Matrix
There are five types of product reputation states: S1, S2, S3, S4, S5, but only one state can be realized at a time. So each state will have n-1 different turns and one self-turn.
The state transition probability matrix obtained accord-ing to the final score of the product status and the status level division criteria is as follows:
P =
13 /103 16 /103 24 /103 1/10316 /151 24 /151 51/151 2 /151
1/ 34 4 /17 4 /17 1/ 345 / 69 17 / 69 19 / 69 1/ 69
0 4 / 5 0 0
And Pij satisfies the condition:
0 1, ( , 1, 2, ,5)
∑
< < = …
j
5
=1
P i j
P i
ij
ij = = …1, ( 1,2, ,5)
2.3 Markov Forecast
Introduce state probability πj (k) here. State probability represents the probability of being in the state Sj at k times after k state transitions under the condition that the state is known at the initial time (k = 0). According to the nature of probability:
∑j
N
=1
π kij ( ) = 1
The state transition process from the initial state transi-tion to Sj can be regarded as first reaching state Sj (i = 1, 2, ..., 5) after (k-1) state transitions, and then reaching state Sj after another state transition. According to the aftereffects of the Markov process and the Bayes conditional probabil-ity formula we can get:
π k π k P jj i ij( ) = − = …∑i=
5
1( 1 , ( 1,2, ,5))
Record line vector . From formula 11, a recursive for-mula for successively calculating the state probability can be obtained.
π k π k P π P(
π π P π P(
)
2 1 (0)
= − =
)π π P= =(
(
1 (0))(=
…)
1 (0))
2
k
In the above formula, π (0) [0, 0,1 , 0, 0] = is the initial

12
Modern Electronic Technology | Volume 05 | Issue 01 | April 2021
Distributed under creative commons license 4.0
state probability vector.It can be known from the analysis that if the initial state
of an event at the 0-th moment is known, we can get the probability of being in various possible states at the k-th moment by using recursive formula. Thus, the state prob-ability prediction result of the event at the k-th moment is obtained.
2.4 Ultimate State Probability Predictio
The state probability obtained after infinite state tran-sitions is called the ultimate state probability, or the equi-librium state probability. If we record the ultimate state probability vector as π [π1, π2, π3, π4, π5]= :
π lim ,( 1,2, ,5)i i= = …k→∞
π k i( )
That is:
lim π (k) lim π (k 1 ) πk k→∞ →∞j j= + =
The above formula is substituted into the recurrence formula of Markov prediction model and given:
π πP=
In this way, we get the conditions that the ultimate state probability should satisfy:
0 1, ( 1,2, ,5)≤ ≤ = …π ii
∑i
π πP
=
5
1
π
=
i = 1
Let the probability of the ultimate state be π [π1, π2, π3, π4, π5]= to get:
(π π π π π π π π π π )1 2 3 4 5 1 2 3 4 5=
13 /103 16 /103 24 /103 49 /103 1/10316 /151 24 /151 51/151 58 /151 2 /151
1/ 34 4 /17 4 /17 8 /17 1/ 345 / 69 17 / 69 19 / 69 9 / 23 1/ 69
0 4 / 5 0 1/ 5 0
2.5 Result Analysis
Solving formula 16 gives that π1 = 364/3775, π2 = 188/985, π3 = 51/181, π4 = 835/2002, π5 = 43/3102
(a) pic1.
(b) pic2.
(c) pic3.
(d) pic4.
Figure 4. Probability prediction of future customer ratings
It can be seen from the figure 4 that the product reputa-tion is roughly in S4. According to the established model, the probability of each future product reputation in differ-ent states can be calculated.
3. TOPSIS model establishment
In order to better identify a potential successful or failed product, we have determined a comprehensive measurement method based on text and rating.C.L.Hwang and K.Yoon first proposed the TOPSIS in 1981. [7] The TOPSIS sorts according to how close a limited number
DOI: https://doi.org/10.26549/met.v5i1.6373

13
Modern Electronic Technology | Volume 05 | Issue 01 | April 2021
Distributed under creative commons license 4.0
of evaluation objects are to idealized targets, which is a relatively good evaluation of existing objects. The basic principle is to sort by detecting the distance between the evaluation object and the optimal solution and the worst solution. If the evaluation object is closest to the optimal solution and farthest from the worst solution, it is the best; otherwise it is not optimal.
3.1 Standardization of indicators
Select monthly sales (M), star rating (S), and review sentiment coefficient (R) as indicators.
Table 2. Indicator type
Monthly sales Star ratingReview Sentiment Coef-
ficient
Indicator type Very large Very large Very large
The monthly sales volume is standardized as the for-
mula: maxM .The star rating is standardized an the formu-
la: S 1max− .Generate a normalized matrix.
3.2 Calculate the Normalization Matrix
Assume the generated normalization matrix is:
3.3 Determine the Ideal Solution
Determine the positive ideal solution:
Z ( , ,·· · , )+ + + += Z Z Z1 2 m
= (max{ z , z , · · · , z } , max{ z , z , · · 11 21 n1 12 22 n2 1m 2m nm· , z } , · · · , max{ z , · , z ·· · z })
Determine the negative ideal solution:
Z ( , ,·· · , )− − − −= Z Z Z1 2 m
= max z , z , · · · , z ,max z , z , · · · , z , ·( { 11 21 n1 12 22 n2 1m 2m nm} { } · · ,max z , · , z ·· · z{ })
3.4 Calculate the Distance Scale
Define the distance between the i-th evaluation object and the minimum value as:
D Z zi j ij+ += −∑
j
m
=1
( )2
Define the distance between the i-th evaluation object and the minimum value as:
D Z zi j ij− −= −∑
j
m
=1
( )2
Thus, the unnormalized score of the i-th evaluation ob-ject is:
Si = D Di i+ −
D+
i−
It is clear that Si = D Di i+ −
D+
i−
The larger Si is, the small-
er Si = D Di i+ −
D+
i−
is, the closer to the maximum.
The TOPSIS evaluation method is authentic, intui-tive, and reliable which is a very classic and effective method in multi-objective decision analysis.[8] This paper combines the evaluation indicators and uses the TOPSIS method to sort the evaluation targets.
4. Conclusion
In terms of marketing strategy, this article starts with the data provided. Analyze past customer reviews through NLP algorithm to obtain quantitative indicators of product preference. At the same time, it is found that the above three are related to the practicality of customer reviews. The quality of reviews will affect future customers’ pur-chase intentions. Therefore, in order to promote product launches and successful promotion, it is necessary for companies to fully pay attention to customers’ star ratings, emotional index and product word length.
In order to promote the company’s product marketing, the concept of time is incorporated into the model. First, this article arranges the data of selected brands of hair dryers in chronological order. Then, use Markov to predict the word-of-mouth evaluation of future customer purchas-es, and obtain a dispersion distribution map of product word-of-mouth evaluation. Through analysis, we come to the following conclusion: In order to ensure long-term product reputation and promote product marketing, we need to consider the product score under time causality.
4.1 Strengths
The established model is closely related to the actual situation. And the proposed problem can be solved in combination with the actual situation, so that the model is closer to the reality which has strong promotion and gen-erality.
TOPSIS-based multi-objective decision analysis im-
DOI: https://doi.org/10.26549/met.v5i1.6373

14
Modern Electronic Technology | Volume 05 | Issue 01 | April 2021
Distributed under creative commons license 4.0
proves the scientificity, accuracy, and operability of the analysis.
4.2 Weaknesses
Markov prediction models require that all events be in-dependent. But in fact, customers may write the same type of review after seeing a series of star ratings. As a result, the accuracy of prediction is reduced.
5. References
[1] Li Zongwei. Research on the Model Construction of Online Reviews Affecting Consumers’ Purchase De-cisions [J]. Innovation, 2013, 5 (7): 55-58.
[2] Adam Lingreen, Lin Zhang, Baolong Ma. The impact of online user reviews on cameras sales[J]. European Journal of Marketing, 47(7):1115-1128.
[3] Lingreen A , Zhang L , Ma B , et al. The impact of online user reviews on cameras sales[J]. European
Journal of Marketing, 2013, 47(7):1115-1128.[4] Chrysanthos Dellarocas. The Digitization of Word
of Mouth: Promise and Challenges of On-line Feedback Mechanisms[J]. Management Science, 2003,49(10):1407-1424.
[5] Wang Junkui. Research on the usefulness of online reviews for e-commerce websites [D]. Xi’an: Xidian University, 2014.
[6] Chen Geheng .Text sentiment analysis based on po-larity transfer and bidirectional LSTM [J] .Informa-tion Technology, 2018, (2): 149-152.
[7] Tian Wuzi, Sun Ze, Sun Run, et al. Analysis of Urban Water Consumption Based on SPSS Multiple Linear Regression [J]. Journal of North China Institute of Science and Technology, 2019, 16 (02): 114-117.
[8] Gu Xiaohan. Research on the Performance Evalua-tion of Precision Poverty Alleviation Based on TOP-SIS [D]. Jiangxi: Jiangxi University of Finance and Economics, 2019.
DOI: https://doi.org/10.26549/met.v5i1.6373

15
Modern Electronic Technology | Volume 05 | Issue 01 | April 2021
Distributed under creative commons license 4.0 DOI: https://doi.org/10.26549/met.v5i1.6500
Modern Electronic Technology
https://ojs.s-p.sg/index.php/met
Design and Implementation of Mobile Intelligent Hidden Danger Inspection System
Hongtao Ma1 Hongsheng Guo2* Luyao Li2 1. China United Coalbed Methane Co., Ltd., Beijing, 100016, China2. School of Ocean and Spatial Information, China University of Petroleum (East China), Qingdao, Shandong, 266580, China
ARTICLE INFO ABSTRACT
Article historyReceived: 5 March 2021Revised: 12 March 2021Accepted: 9 April 2021Published Online: 16 April 2021
With the increasing development of Internet technology, computer In-ternet, intelligent terminal, cloud computing and other new technologies continue to emerge. All kinds of app based on mobile intelligent terminal are widely used because of its convenience and intelligence. However, for the safety of the coal industry, how to use these technologies based on mobile intelligent terminal to establish a set of efficient long-term mechanism of safety inspection and risk control is a necessary method to upgrade the safety management mode. Therefore, in order to meet the requirements of hidden danger investigation and management, this paper designs an intelligent hidden danger investigation and management sys-tem. Based on Ionic, the system constructs a cross platform mixed mode mobile app development framework. The paper shows that the system can realize the basic hidden danger investigation requirements.
Keywords:InternetSystem designMobile intelligent terminalHidden danger
*Corresponding Author:Hongsheng Guo, Male, a graduate student in China University of Petroleum (East China); Research direction: remote sensing data and its application;E-mail: [email protected] the other authors:Hongtao Ma, Female, a mid-level engineer of China United Coalbed Methane Co., Ltd.;Research direction: safety management. Luyao Li, Male, a graduate student at China University of Petroleum (East China);Research direction remote sensing data and its application.
1. Introduction
In recent years, accidents in the coal mine industry in my country have occurred every year. Even though the government and various units have issued relevant safety documents, there are still no actual actions in terms of specific safety hazards investigation and management [1-2], supervision is not in place, and management methods are backward. Such problems, and such post-accountability
handling methods, are likely to cause the relevant depart-ments to get lucky, and may even cause greater accidents in the future.
Recently, due to the maturity of modern high-tech such as information technology, the number of users of mobile applications is very large, and it has gradually penetrated into all aspects of the entire economy and society. All walks of life are using information technology to arm themselves. According to the existing problems of fire

16
Modern Electronic Technology | Volume 05 | Issue 01 | April 2021
Distributed under creative commons license 4.0
safety, Wu Qiming [3] and others designed the fire safety hazard reporting APP, but due to the difference between fire protection and coal mining industry, it cannot be used directly, and they proposed that the hidden hazard reporting mechanism is not convenient for supervision and rectification. . In order to improve the efficiency of coal mine safety management, Chen Qing [4] designed a set of closed-loop hidden danger management system to improve the degree of informatization of the coal mine in-dustry. However, in actual construction, using their meth-ods, even if there are hidden dangers in the investigation, there are still deficiencies in the supervision, control, and rectification of hidden dangers.
With the rapid development of computer technology, the use of modern high-tech to solve the above problems is the top priority of the safety management development of coal mine enterprises. Therefore, this paper proposes to build an Ionic-based mobile intelligent hidden danger investigation and control system[4]. The system integrates real-time entry and upload of hidden dangers, assign-ment of hidden dangers, supervision of hidden dangers, rectification, review, performance evaluation, etc., with closed-loop management as the construction idea, which greatly improves the efficiency of investigation and rec-tification of hidden danger investigation and control, and is also for managers. Provides rich views and big data functions.
2. System Development Technology
Ionic is a framework for smart component app devel-opment based on web technology using html5, css3 and javascript [5]. It is a cross-platform hybrid mobile app de-velopment framework called hybirdapp framework. Ionic greatly simplifies the APP development of the front-end [6]. Ionic focuses on UI interaction between feeling and ap-plications [7], which is irreplaceable by Phone Gap [8] and Cordova. This project uses the Ionic framework to devel-op this mobile smart security hidden danger APP from the web perspective [9]. The client side uses JQuery AJAX technology [10], and the server side uses MVC-based hier-archical design ideas and uses Java language [11] for writ-ing.
3. System Introduction
3.1 Setting up the Organization for the Investiga-tion of Hidden Dangers
The hidden danger investigation system [12] relies on the four levels of the head office, branch, contractor and work team. The head office can browse and manage the
hidden danger information submitted by all departments. A branch includes a security department and a business department. It can only manage the hidden dangers sub-mitted by its subordinate departments and can view the hidden danger information of other branches. The con-tractor belongs to the business department of a certain branch company, receives related hidden danger infor-mation and conveys the rectification of its work team. The work team receives the hidden danger information and submits it to the superior for acceptance after rectifi-cation. The network architecture at all levels is shown in Figure 1.
headquarters
branch office
Inspectors Supervisors
branch office
contractor
Figure 1. Network architecture
3.2 Business Process of Hidden Danger Investiga-tion
The basic business process of hidden danger investi-gation are as follows: All levels are basically closed-loop management of hidden dangers in accordance with inves-tigation, reporting, recording, governance, acceptance and review.
1) Investigation: General inspection personnel, safety department personnel and business department personnel shall carry out investigations one by one according to the contents of the hidden danger investigation, and if certain items have hidden safety hazards, they will be dealt with.
2) Reporting: When investigators consider that there are hidden dangers when dealing with hidden dangers, they will assign departments on the system or directly submit them to the work team for rectification.
3) Processing: The work team will deal with the hidden danger information after receiving it and submit it to the contractor for acceptance.
4) Acceptance: The contractor and inspectors check and accept hidden dangers. If they are unqualified, they will be rejected for rectification.
5) Audit: Relevant departments will review the hidden dangers after they have passed the inspection and rectifi-cation to eliminate the hidden danger information.
DOI: https://doi.org/10.26549/met.v5i1.6500

17
Modern Electronic Technology | Volume 05 | Issue 01 | April 2021
Distributed under creative commons license 4.0
3.3 Classification of Hidden Dangers
The hidden dangers [13] in specific construction can be roughly divided into the following four categories [14]: hidden dangers during rectification, repetitive hidden dan-gers, qualification hidden dangers and overdue rectifica-tion hidden dangers. According to the completion status of hidden dangers, it can be divided into hidden dangers that have been rectified and hidden dangers in rectification.
In principle, hidden dangers are submitted by ordinary inspectors, relevant personnel of the security department and relevant personnel of the business department. The rectification of hidden dangers shall be specifically im-plemented by the work team under the contractor, which shall be reported and checked and accepted in different grades, and the declaration, rectification and acceptance of hidden dangers shall be completed and recorded.
4. The Design of Each Module of the System Function
According to different permissions, the interface dis-play is also different, and the functional scope of each user is shown in Table 1.
4.1 Head Office and Branch Management Page-Home Page
The general manager, deputy general manager, director of the QHSE department and related employees of the head office, general manager and deputy general manager of the branch company can see this interface. The head office personnel automatically display all data, and the
branch personnel account automatically displays the rel-evant data of the branch company. Click on the relevant data in the pie chart or histogram to jump to the data de-tails page.
4.2 Headquarters and Branch Management Page-Contractor Situation
Headquarters and branches can view the ranking of contractors, and the points for this month are displayed by default. The contractor’s monthly initial points are 100 points, and points will be reduced according to hidden dangers found. The penalty value is linked to the risk lev-el, with 1 point for low risk, 3 points for medium risk, and 10 points for high risk.
4.3 Headquarters and Branch Management Pag-es-Inspection Personnel
Headquarters account to view the inspection status of all personnel, and branch account to view the status of branch inspection personnel. The personnel in this func-tion are divided into inspection personnel and supervisory personnel.
4.4 Inspector and Supervisor Interface
Inspectors and supervisors mainly inspect the operating points of the branch. Inspectors’ monthly initial points are 0 points, and points are added according to hidden dan-gers found. The bonus value is linked to the risk level.
Inspectors can click on the hidden hazards to be ac-cepted on the homepage to open the list of hidden hazards to be accepted. Click on a hidden hazard to be accepted to
Table 1. User range
Serial number interface interface brief description Main users
1Head office and branch management interface
It is mainly used to control safety hazard information at the company level and branch level. You can view the statistical
analysis of various data, contractors, operating points, inspec-tion personnel and specific hidden danger data. The head office account can view all data, and the branch account can view the
data of the branch.
General manager, deputy general manag-er, director of the QHSE department and
related employees of the head office, gen-eral manager and deputy general manager
of the branch.
2Inspector and supervisor
interface
Inspection personnel and supervisors are used for:1. Online inspection and submission of potential safety hazards
on mobile terminals;2. On-site acceptance and safety hazards;3. Maintenance work point information;
4. The director of the QHSE department and the director of the business department of the branch will assess the level of
hidden dangers.
Director of the QHSE Department of the branch, related employees, director of the business department, related employees
and supervisors.
3 Contractor interface Used by the contractor: on-site rectification of hidden dangers; Contractor account number.
4 Public interface Shared by all accounts. All accounts.
DOI: https://doi.org/10.26549/met.v5i1.6500
18
Modern Electronic Technology | Volume 05 | Issue 01 | April 2021
Distributed under creative commons license 4.0
open the site hidden hazard acceptance page. If the hidden danger acceptance fails to meet the standard, you can fill in the rectification requirements and rectification period again, add on-site photos, and submit again, and the con-tractor will receive the rectification agent again.
Inspectors and supervisors, special personnel are set up to maintain operating point information. The current con-tractor of the operating point is information that changes frequently and needs to be maintained in a timely manner.
Inspectors and supervisors can view the acceptance history of hidden dangers at the branch office. Inspectors and supervisors can view hidden dangers that have not been rectified after the expiry date. The overdue time is displayed in the list of hidden dangers that have not been rectified after the due date. The overdue time is in hours.
4.5 Contractor Interface
The main responsibilities of the contractor in the sys-tem:
1) Rectify the hidden dangers detected by the inspec-tors;
The list of hidden dangers to be rectified displays the main information of the hidden dangers and the rectifica-tion period.
When the rectification period is more than one day, it will be displayed in green, and when it is less than or equal to one day or overdue, it will be displayed in red. After the on-site rectification is completed, click the list to open the hidden danger details page, and click the rectifi-cation completed.
2) Perform regular inspections and punch cards for op-erating points.
The contractor can view the hidden dangers that have been checked and accepted.
3) The contractor needs to check in regularly for the work points within the work scope.
The clocking cycle is different for different job sites, and the clocking cycle is maintained in the job site main-tenance function.
4.6 Common Interface-Operating Point Informa-tion
Inspectors and supervisors mainly inspect the operating points of the branch. Click the plus sign to jump directly to the hidden danger investigation and report page of the operation point.
4.7 Common Interface-Knowledge Base Function
You can view and add knowledge base manual learning reference
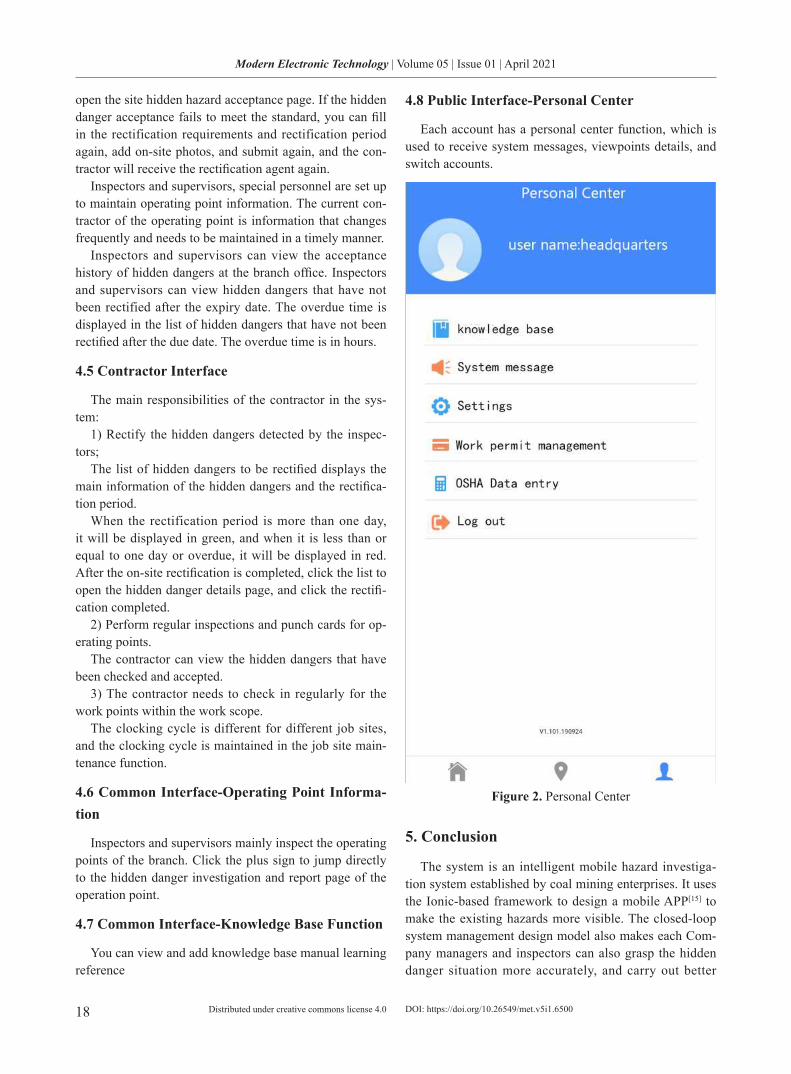
4.8 Public Interface-Personal Center
Each account has a personal center function, which is used to receive system messages, viewpoints details, and switch accounts.
Figure 2. Personal Center
5. Conclusion
The system is an intelligent mobile hazard investiga-tion system established by coal mining enterprises. It uses the Ionic-based framework to design a mobile APP[15] to make the existing hazards more visible. The closed-loop system management design model also makes each Com-pany managers and inspectors can also grasp the hidden danger situation more accurately, and carry out better
DOI: https://doi.org/10.26549/met.v5i1.6500

19
Modern Electronic Technology | Volume 05 | Issue 01 | April 2021
Distributed under creative commons license 4.0
rectification, review, etc. for hidden dangers. The system further improves the efficiency of hidden danger handling and effectively establishes a closed loop of hidden danger investigation and management in the coal mine industry mechanism.
References
[1] Wu Zhu, Cui Zhongwei, Zhao Yong, et al. Design and implementation of WebAPP for agricultural en-vironmental monitoring system[J]. Internet of Things Technology, 2020, 10(02): 29-32.
[2] Tang Kai. Investigation on investigation and preven-tion of hidden dangers of coal mine accidents and rectification measures[J].Contemporary Chemical Research, 2020(19):155-156.
[3] Wu Qiming, Liu Jinjun, Zhao Guoxing, et al. The design background and technical implementation of the fire safety hazard reporting app[J]. Fire Fighting Circle (Electronic Edition), 2020, 6(24): 43-44.
[4] Chen Qing, Chen Yunqi, Zhang Yi. Design and implementation of coal mine hidden danger man-agement system[J]. Henan Science and Technology, 2016(07): 52-55.
[5] Song Donghui, Zhou Zirong. APP architecture design based on the cultural heritage of Guilin Intangible Heritage Nuo [J]. Media Forum, 2021, 4(01): 105-107.
[6] Ma Qianli, Yu Yingxia. The front-end data interac-tion of APP based on Android[J]. Electronic Testing, 2020(24):63-64+104.
[7] Zhang Ying, Yang Liang, Shen Yanfang. APP inter-face design and mobile interactive experience design [J]. Modern Electronic Technology, 2020,43(23):
182-186.[8] Pang Tian Yin. Research and implementation of dig-
ital TV portal based on html5+phoneGap architec-ture[J]. China Cable TV, 2014(06): 700-703.
[9] Zhang Liechao, Hu Yingjiu. Design and implemen-tation of cloud application development model inte-grating Hybird Web APP application [J]. Journal of Wuhan Jiaotong Vocational College, 2019, 21(01): 92-97.
[10] Xu Jing. Application research of light application game software based on HTML5 and WebApp tech-nology in teaching in higher vocational colleges [J]. Digital Technology and Application, 2019, 37(06): 66-67.
[11] Mo Juncheng, Tian Xiuyun. Java-based online shop-ping platform system design [J]. Mechanical and Electrical Engineering Technology, 2021, 50(01): 103-105.
[12] Ma Haifeng, Xue Wenrui, Jiang Xingang, et al. De-velopment and application of a mobile Internet-based bridge quality and safety inspection system[J]. High-way Traffic Science and Technology (Application Technology Edition), 2020, 16(10):19-26.
[13] Xu Anhua, Zhang Wei, Zhao Tingsheng. Classifica-tion system of hidden dangers in construction site based on system thinking [J]. Shanxi Architecture, 2019, 45(22): 178-179.
[14] Lin Chuan, Wu Lefei, Dai Jiajia. Classification meth-od of coal mine safety hazards based on the weight of category keywords[J]. Journal of Guizhou University (Natural Science Edition), 2019, 36(06): 53-57+97.
[15] Lu Xin. Research on Web-based Rich Client Cross-platform Mobile Application Development Technology [D]. Kunming: Yunnan University, 2015.
DOI: https://doi.org/10.26549/met.v5i1.6500

20
Modern Electronic Technology | Volume 05 | Issue 01 | April 2021
Distributed under creative commons license 4.0 DOI: https://doi.org/10.26549/met.v5i1.6056
Modern Electronic Technology
https://ojs.s-p.sg/index.php/met
Investigation on the Application Value of Infrared Forehead Tempera-ture Gun in Body Temperature Screening of New Crown Epidemic
Kuanlong Shi* Jiaxi Zhang Jiawen Wang North China University of Science and Technology, Tangshan, Hebei, 063210, China
ARTICLE INFO ABSTRACT
Article historyReceived: 20 March 2021Revised: 27 March 2021Accepted: 9 April 2021Published Online: 16 April 2021
The outbreak of the novel coronavirus pneumonia has had a great impact on the life safety of our people and social production activities. There-fore, it is very important and meaningful to analyze the application value of infrared forehead thermometers in body temperature screening under the new crown pneumonia epidemic and propose improved measures for body temperature detection. This paper summarizes the questionnaire on the application value of infrared forehead thermometer in body tempera-ture screening and the results of staff interviews, and analyzes the princi-ple of infrared forehead thermometer temperature measurement to explain the factors that affect the accuracy of temperature measurement results. Finally, it is concluded that the reflected radiation of the environment and the temperature measurement distance affect the accuracy of the tempera-ture measurement results of the infrared forehead gun.
Keywords:New crown pneumonia epidemicBody temperature screeningInfrared forehead thermometer
*Corresponding Author:Male, Bachelor in North China University of Technology; Research direction: electronic information engineering;E-mail: [email protected].
1. Introduction
The outbreak of the novel coronavirus pneumonia virus has had a great impact on the life safety and social activi-ties of our people. In the prevention and control of the ep-idemic, body temperature monitoring is a vital part. Based on the body temperature observation of a large number of people, the overall prevention and control effect of the epidemic can be monitored. Therefore, evaluating the ef-fectiveness of prevention and control measures based on the temperature measurement of a large number of people is of great significance for epidemic research and response to future emergencies. In summary, accurate and efficient screening of the body temperature of a large number of floating populations is very necessary.
At present, infrared forehead thermometers are com-
monly used for body temperature screening [1]. Therefore, it is very important to study the accuracy of infrared fore-head thermometer measurement and how to make infrared forehead thermometer overcome external factors to per-form body temperature monitoring more effectively.
2. Research and Analysis
2.1 Research Objects
Select community residents and staff in Lianyungang City, Jiangsu Province and Handan City, Hebei Province to conduct a questionnaire survey; the primary health workers from related units in Lianyungang City, Jiangsu Province and Handan City, Hebei Province were selected for interviews and exchanges.
Inclusion criteria: Skilled in using the questionnaire

21
Modern Electronic Technology | Volume 05 | Issue 01 | April 2021
Distributed under creative commons license 4.0 DOI: https://doi.org/10.26549/met.v5i1.6056
platform; Consciousness, no diagnosis of mental illness; Age 15~75 years old.
2.2 Research Method
(1) Questionnaire survey method This questionnaire activity uses online electronic ques-
tionnaires, in which a total of 315 questionnaires are col-lected, of which 298 are valid questionnaires, with an ef-fective rate of 94.61%. Obtain more authentic and reliable data to ensure the truthfulness and validity of the survey results.
(2) On-site interview method Obtain the actual situation in the operation process by
communicating with the staff on duty and the staff, and make preparations for the subsequent optimization of the strategy in the operation specification.
2.3 Survey Results
(1) Questionnaire survey resultsAccording to the distributed questionnaire survey,
most of the temperature measuring instruments during the epidemic period were infrared thermometers, and other temperature measuring instruments were used less fre-quently. And found that most people are willing to accept the temperature detection of infrared forehead guns. The positive attitude of the people not only facilitates their own health monitoring, but also facilitates the operation and service of the entire society. In addition, nearly half of the respondents believe that infrared body temperature measurement is fast and low in cost, which are the advan-tages and characteristics of infrared forehead thermome-ters; some respondents pointed out problems such as large errors in the measurement results. Nearly 4/5 of the inter-viewees hope that the temperature measurement tool can be equipped with some temperature measurement APP to perform auxiliary monitoring of body temperature. Nearly half of the interviewees believed that they would undergo temperature checks about twice a day. Most of the inter-viewees said that the number of times they received the forehead temperature gun temperature measurement was irregular, which was related to the travel trajectory. It can be seen that under the background that the epidemic situ-ation in my country has stabilized, temperature testing is still being carried out in an orderly manner.
(2) Interview resultsCoordination of residents: Most residents actively
cooperate and support the temperature screening work, and the residents understand and support the temperature screening work.
The work of primary health personnel: The staff are ba-
sically responsible. The prevention and control of the new crown epidemic is a difficult task, and the work pressure of the staff on duty is relatively high. However, the staff insisted on taking up their posts and showed high profes-sionalism. In addition, the staff said that the temperature measurement gun will be inaccurate in temperature mea-surement, and the outdoor temperature will change from winter to summer. In the face of continuous low tempera-ture or outdoor high temperature measuring gun, the tem-perature measurement will be inaccurate, which will also affect the normal use of the infrared forehead temperature gun, which will cause a series of problems. The infrared thermometer itself and its irregular operation also bring a series of problems to the measurement of body tem-perature. In addition, the reserve of professional medical knowledge of grassroots personnel is generally insuffi-cient, and the on-duty personnel report that although non-health personnel have a strong awareness of protection, the actual protection behavior is insufficient.
3. Analysis of the Principle of Temperature Measurement
The factors that affect the measurement results of the infrared forehead thermometer mainly include the sur-rounding environment and the measurement distance. According to the temperature measurement principle of the infrared thermometer, it determines its temperature by receiving the radiation emitted from the surface of the measured object [2]. In actual measurement, the effective radiation received by the infrared thermometer includes three parts: the target’s own radiation, environmental re-flected radiation and atmospheric radiation.
3.1 The Influence of Target’s Own Radiation
From the literature [3], it is known that the infrared tem-perature measuring gun temperature measurement formula is:
(1)
Q indicates the energy density of infrared radiation re-ceived by the infrared forehead thermometer;
T T T Ts r u an n n n、 、 、 respectively indicate the measured
object, temperature sensor, surrounding environment and atmospheric temperature, the unit is K;
ε εs a、 respectively represent the emissivity of the mea-sured object and the emissivity of the atmosphere;
τa represents atmospheric transmittance; ρs represents

22
Modern Electronic Technology | Volume 05 | Issue 01 | April 2021
Distributed under creative commons license 4.0
the infrared reflectivity of the surface of the measured ob-ject.
The infrared radiation of other objects in the surround-ing environment will also be accepted by the thermal imager detector. When measuring non-metallic surfaces, it can be considered as ρ εs s= −1 .
ρ is a Stefan-Boltzmann constant with a value of 5.6693 10× ⋅ ⋅− − −8 2 4W m K .
The temperature of the object itself Ts can be derived from the above formula [4]:
(2)
It can be seen from the above formula that Ts is de-termined by factors such as environmental reflection emissivity, distance coefficient, surrounding environment, atmospheric temperature, environmental reflectivity and perspective rate. This paper focuses on analyzing the in-fluence of the surrounding environment and temperature measurement distance.
3.2 The Influence of Reflected Radiation from the Environment
It can be seen from the actual measurement analysis that the ambient temperature has a non-negligible effect on the measured target temperature. According to Kirch-hoff’s law: In thermal equilibrium, the absorption ratio of any object to blackbody input radiation is equal to the object’s emissivity at the same temperature. But the actual human body temperature measurement, input radiation is not black body radiation, and will not be in thermal equi-librium [5].
According to Stephen-Boltzmann’s law, the total radi-ant energy of a black body M λ To ( , ) is proportional to the fourth power of its thermodynamic temperature, namely:
(3)
is the Stephen-Boltzmann constant, and the value is 5.6693 10× ⋅ ⋅− − −8 2 4W m K .
In actual human body temperature measurement, the radiant energy of the human body at the same temperature is always less than the radiant energy of the black body. The human body can be regarded as a gray body at this time. The emissivity of the actual object is the ratio of the radiated energy of the actual object to the blackbody un-der the same temperature state. which is:
(4)
From (3) (4), the following equations can be derived:
(5)
According to Kirchhoff’s law, under thermal equilib-rium conditions, the ratio of any object’s own radiation to its absorption ratio to radiation from a black body is always equal to the radiation force of a black body at the same temperature. Which is:
(6)
You can get: ε α= .In the actual situation, the human body can be regarded
as a dusty surface. Considering the relationship between the emissivity and absorption ratio of gray body, it must have ε α= for the human body. That is, for the human body, whether the input radiation comes from a black body or whether it is in a thermal equilibrium condition, the absorption ratio is always equal to the emissivity at the same temperature. In reality, the human body is an opaque object, so the transmittance of the human body can be regarded as zero, and there is only radiation and reflection at this time. In the case of actual human body temperature measurement, there are: 1ρ εs s= − .
3.3 Influence of Distance Coefficient
As shown in the figure below, the distance coefficient (K=S/D) is the ratio of the distance S from the infrared thermometer to the target and the diameter D of the tem-perature measurement target. The distance coefficient has a great influence on the accuracy of infrared temperature measurement. The K value the larger the value, the higher the resolution [6]. The target object is too far away, the ra-diant energy received by the infrared temperature measur-ing gun is reduced, and the measured temperature is lower than the actual temperature of the target object.
Figure 1. Schematic diagram of measuring distance
DOI: https://doi.org/10.26549/met.v5i1.6056

23
Modern Electronic Technology | Volume 05 | Issue 01 | April 2021
Distributed under creative commons license 4.0
4. Conclusion
The most important thing in body temperature screen-ing is the accuracy of temperature measurement, but sometimes there are many influencing factors that lead to deviations in the temperature measurement results, which will cause unnecessary misunderstandings and waste of time for epidemic prevention personnel. In more serious cases, suspected patients may be missed, leading to the spread of the virus. So we put forward some suggestions on the use of infrared forehead thermometers.
4.1 Ambient Temperature and Measurement Lo-cation
In winter, especially in cold areas in the north, it is nec-essary to measure body temperature outdoors in most cas-es. Therefore, the temperature measuring gun has certain requirements for the ambient temperature, pay attention to the slow response of the temperature measurement and the error in the measured value. In addition, the forehead measurement error of the infrared forehead thermometer is relatively small.
4.2 Equipment Cleaning, Disinfection, Mainte-nance and Calibration
Dirt and other dirt may block the optical system of the instrument, thereby causing errors in temperature measurement [7]. Therefore, it is extremely important to arrange staff to check the infrared forehead thermometer regularly. Clean the infrared forehead thermometer reg-ularly. Cleaning method: First use compressed air to re-move large particles and dust, and then wipe with a cotton swab dipped in 95% ethanol. After use, cover the infrared forehead thermometer with the lens cap as soon as possi-ble, and put it in the carrying case for storage. Finally, the relevant factory departments should provide free moni-toring and calibration services, and send professionals to regularly calibrate and maintain the instrument to ensure the accuracy of the measurement [8].
4.3 Training of Measurement Personnel
Temperature measurement personnel are the most basic level of epidemic prevention personnel, and their sense of responsibility and operation methods can directly affect the measurement results. For example, some operators
have inaccurate measurement due to the distance and irregular operation during temperature measurement. In addition, there will be some surveying personnel who are careless, not pay enough attention to their work, and lack a sense of responsibility to make the survey mere formal-ity. Therefore, the training of temperature measurement personnel is very important and should be paid enough attention.
References
[1] Wang Hongjun, Bai Chengyu, Wang Jinghui, et al. Application of infrared thermometers in response to the new crown epidemic[J]. China Metrology, 2020(05): 17-20.
[2] Zhu Zhenyi. Optical temperature measurement tech-nology and analysis of physical principles[J]. Mathe-matics Learning and Research, 2019(16): 127.
[3] Ge Zexun. Research on Medical Infrared Thermome-ter and Its Key Technology[D]. Changchun: Changc-hun University of Science and Technology, 2019.
[4] Li Qiong, Zhao Yuhu, Rao Wenhao. The basic theory and experimental research of infrared thermometer detection during the epidemic period[J]. Journal of North China Institute of Science and Technology, 2020, 17(04): 67-73.
[5] Su Qingwen, Xie Jingtian, Xu Wenda. The influence of ambient temperature on the measurement results of infrared forehead thermometers[J]. Industrial Me-trology, 2020, 30(04): 4-6.
[6] Ji Biao. “Principle of infrared temperature mea-surement and its influencing factors”. Papers and abstracts of the 14th National Symposium on Infra-red Heating and Infrared Medicine Development. Ed. “Infrared Technology” Editorial Office, Chinese Academic Journal (CD-ROM Edition) Electronic Magazine. Editorial Office of “Infrared Technology”, Chinese Academic Journal (CD-ROM Edition) Elec-tronic Magazine, 2013:219-222.
[7] Jin Hui, Wang Xiaolan, Sun Jian. Analysis of in-fluencing factors and correction methods for the measurement accuracy of infrared thermometers [J]. Shanghai Metrology and Testing, 2019, 46(05): 34-38.
[8] Su Dongyue, Guo Lihua, Sun Jian,et al. Application and thinking of infrared temperature measurement technology[J]. China Medical Device Information, 2020, 26(11): 23-25.
DOI: https://doi.org/10.26549/met.v5i1.6056
24
Modern Electronic Technology | Volume 05 | Issue 01 | April 2021
Distributed under creative commons license 4.0 DOI: https://doi.org/10.26549/met.v5i1.6763
Modern Electronic Technology
https://ojs.s-p.sg/index.php/met
A Clustering Analysis Method for Massive Music Data
Yanping Xu* Sen Xu School of Information Engineering, Yancheng Institute of Technology, Yancheng, JiangSu, 224051, China
ARTICLE INFO ABSTRACT
Article historyReceived: 22 March 2021Revised: 29 March 2021Accepted: 9 April 2021Published Online: 16 April 2021
Clustering analysis plays a very important role in the field of data mining, image segmentation and pattern recognition. The method of cluster anal-ysis is introduced to analyze NetEYun music data. In addition, different types of music data are clustered to find the commonness among the same kind of music. A music data-oriented clustering analysis method is pro-posed: Firstly, the audio beat period is calculated by reading the audio file data, and the emotional features of the audio are extracted; Secondly, the audio beat period is calculated by Fourier transform. Finally, a clustering algorithm is designed to obtain the clustering results of music data.
Keywords:Spectral clustering algorithmK-meanMusic similarityAudio period extraction
*Corresponding Author:Yanping Xu,Female, graduate student, lecturer;Research direction: pattern recognition and artificial intelligence;E-mail: [email protected] the other author:Sen Xu,Male, Ph. D., Professor, Research direction: Pattern Recognition, Artificial Intelligence and Data Mining.
1. Introduction
In recent decades, the explosive growth of information is constantly generated from the network due to the amazing development speed of the Internet in China. However, in or-der to find useful information from the huge amount of infor-mation, simple statistics and computing can no longer meet the needs of the public and major companies. Data mining, machine learning and other fields have developed rapidly, and have become the main algorithm of big data companies. We can find out some characteristics in the massive data by setting certain rules and conditions. NetEyun Music already contains 35 million different songs and music. Besides, about 50 albums are released every week in the United States, with
an average of about 12 songs per album. How to quickly classify a large number of music and songs has become a dif-ficult problem. The results obtained from the classification of audio files by computer are more convenient for us to study the differences between different types of music. In addition, it is also convenient for us to directly recommend the same type of music to users.
Cluster analysis automatically divides the data ele-ments in an unsupervised environment. Besides, it finds out the scientific research method of hidden rules. The clustering process is the process of dividing the data into different clusters according to different characteristics and unused statistics. Generally speaking, the data elements should have greater similarity in each independent class.

25
Modern Electronic Technology | Volume 05 | Issue 01 | April 2021
Distributed under creative commons license 4.0 DOI: https://doi.org/10.26549/met.v5i1.6763
However, the elements between different clusters should have greater differences.
In view of the music data, this paper introduces the clustering analysis method, and calculates the emotional characteristics based on the audio content. In addition, it classifies the audio types according to the emotional characteristics of each audio so as to realize the automatic classification of massive music data.
A clustering analysis method for music data is proposed. Firstly, the audio beat period is calculated by reading the audio file data, and the emotional features of the audio are extracted; Secondly, the Fourier transform is used to calcu-late the audio beat period; finally, a clustering algorithm is designed to obtain the music data clustering results.
2. Music Melody
The melody of audio refers to a sequence composed of pitch length and intensity. The staff we usually see is an expression of music melody. In addition, a single part with certain logic is played on the basis of certain debug-ging and beat according to the pitch, length and intensity of the melody, which becomes a piece of music. Mono-phonic music can be composed of a single part of music as a whole, or it can be synthesized by multiple parts of music. Music as an art form of emotional expression, the main means of expressing emotion in music is the melody in music. It can also reflect people's inner feelings through melody. The soul and foundation of music is the melody in music. There are various expressive elements of music in the melody. However, the two essential elements of the melody are pitch and rhythm. Various uneven contours formed by the combination of pitch ups and downs in the process of continuous performance, which are called pitch lines. It can only be formed when continuous sounds of different pitches, different timbre and different lengths are combined with a variety of different rhythms of music.
The organic combination of tone, pitch and rhythm forms the melody of music. Music expresses an emotion through melodies. You must convert the emotional signal in music into another way of expression that can be rec-ognized by the computer if you want to use a computer to analyze and identify it. In this paper, MP3 file is used to extract audio features.
3. Audio Feature Extraction
3.1 Obtaining Music Beat Period by Autocorrela-tion Function
Fast Fourier transform (FFT) is used to process audio files. FFT is based on the discrete Fourier transform (DFT).
X x eN k n+ = ⋅∑N
n=
−
0
1− +i N k n N2 /π ( )
The symmetry property of DFT is derived, that is,
N k kX X+ =
Further, it is:X Xi N k k⋅ + =
DFT is divided into odd and even parts according to this property.
X x ek n= ⋅∑N
n=
−
0
1−i kn N2 /π
Only half of the operation is performed to get the val-ue of the whole spectrum for each Fourier transform. If Nbank 2 is even, each part can be divided into smaller parts by recursive operationfor each part. It is why the sampling value of most FFT is set to 2k. Generally speak-ing, the time complexity of FFT is O (nlogn), which great-ly improves the computing speed of DFT.
This paper uses 0 to shield the frequency of 0~20Hz and 12.5~22.5kHz where the sensitivity function is insufficient because the frequency between 20 and 12500 is standard-ized in the ISO226-2003 standard. Firstly, the audio file is divided into frames.Secondly, the frequency with the high-est amplitude of each frame of audio data is saved in a fre-quency sequence by Fourier transform.Finally, and the au-tocorrelation operation is done on the frequency sequence.
This paper uses the power sum of each frame as another reference sequence to do autocorrelation operation consid-ering that it takes a long time to do Fourier transform for each frame. Figure 1 and figure 2 are the comparison of two groups of experiments. The audio used in it is irreplaceable. From top to bottom, the frame length is 2s,1s~1/32s.
Figure 1. Autocorrelation function with the strongest frequency intensity as the main data

26
Modern Electronic Technology | Volume 05 | Issue 01 | April 2021
Distributed under creative commons license 4.0
Figure 2. Autocorrelation function with power as the main data
According to the experimental results, there is no great difference between the two methods. In addition, because the direct calculation of power is faster, this method is used to extract the beat period features. As a result, the change of frame length from 1 to 16 seconds has no effect on the calculation of the period. As a consequence, this paper takes 0.01 seconds as one frame when calculating the beat period.
3.2 Audio Feature Extraction
Considering the following algorithm in order to extract the periodic features of audio:
a) Taking the maximum value in a certain interval as the minimum value of the beat period.
b) Quadratic autocorrelation is used to enhance the cor-relation of the autocorrelation function.
We carefully observe the autocorrelation function of the above figure for a). As a result, it is found that the position of about 0.5 seconds is actually the second peak, and the first peak is about 0.25 seconds. How to judge which peak is a period has become a difficult problem. It is consid-ered that the threshold can be set, and the peak beyond the threshold is the position of the beat period. However, we find that the setting of the threshold has a great influence on the result after counting more than 300 audio files. A little higher than 0.01 will increase the beat cycle of about 60 audio.
The selection of interval has become the problem for b). According to the above figure, if the interval selection is [1600], the maximum value is 1, and the second largest value is 200. Considering that the part where the offset of the autocorrelation function is 0 is meaningless, the left side of the interval is set to 1. Besides, we cannot simply judge the position of the beat cycle.
We first observe the power autocorrelation function of 24 audio in figure 3 in order to better extract audio features.
Figure 3. Autocorrelation function of 24 songs
The properties of autocorrelation functions are ex-plained here. The above autocorrelation functions all use autocorr function, and the specific formula is different from the previous autocorrelation function. The formula is as follows:
R (k ) = ∑m
N
=1(x m x m k mean x( ) − ⋅ + −mean x
sum
( )
()x
(2 )( ) ( ))
In the formula, N is the length of the power sequence, mean (x) is the mean value of the power sequence, sum (x2) is the sum of squares of the power sequence, and the ratio is only for normalization. The purpose of subtracting the mean is to prevent the function value from fluctuating too much. However, it does not affect the calculation of the period. According to the formula, we can see that the autocorrelation function has attenuation. In other words, the larger the k value, the closer R (k) to 0. In addition, when the sequence is long enough, the multiple autocor-relation function will not affect the position of the peri-odic wave crest. Besides it also has a certain denoising function.
The proof that noise does not affect periodic signal de-tection:
The existing periodic signal s(m) and the periodic sig-nal w can be set as composite signal x=s+w, then the auto-correlation function is
R
= + + + + + + +m
(
∑
k
+
=−
∞
)
∞
= =
s m s m k s m w m k s m k w m w m w m k
m m
(
∑ ∑+ +
=− =−
∞ ∞
)
∞ ∞
x m x m k
(
( )
)
( +
(
)
) (
(s m w m s m k w m k
)
( )
(
+ + + +(
)
))(
(
(
) (
)
)
(
(
)
)
)
DOI: https://doi.org/10.26549/met.v5i1.6763

27
Modern Electronic Technology | Volume 05 | Issue 01 | April 2021
Distributed under creative commons license 4.0
In the formula, s and w are independent of each other, then R(k)=Rs(k)+2CsCw+Rw(k)
In the formula, only Rs(k) has periodicity, CsCw is the DC component, and Rw(k) is approximately zero when Rw(0) is 1 and K is other values.
As a consequence, the autocorrelation function is di-rectly used to detect the period in the case of a certain noise.
Li Zhijun and others [14] mentioned that the combination of AMDF and ACF can be used to make a large number of multiplication into addition operations to shorten the running time of individual autocorrelation functions when optimizing the autocorrelation function. AMDF is the average amplitude difference function, and its function is defined as:
( ) ( ) ( )1
0
1 N
nn
F k s n s n kN
−
=
= − −∑
This paper tests this point of view as follows:A. Whether the autocorr function uses loops to calcu-
late and valueAll the autocorrelation functions in this paper are cal-
culated by autocorr.This paper combines the audio power with the fol-
lowing functions according to the property that multiple autocorrelation does not affect the fundamental frequency period and the difference operation can make the non-sta-tionary time series more stable.
a) autocorr(diff(autocorr(w,8001)),1000);b) autocorr(autocorr(diff(w),8001),1000);c ) au toco r r ( au toco r r (d i f f ( au toco r r ( au toco r-
r(w,8001),8000)),7999),300).The following images are obtained, as shown in figure
4-figure 6:
Figure 4. Result diagram corresponding to function com-bination (a)
Figure 5. Result diagram corresponding to function com-bination (b)
Figure 6. Result diagram corresponding to function com-bination (c)
Compared with the above results, it can be found that the function obtained by using autocorr (autocorr (diff (autocorr (autocorr (w,8000), 8000)), 7999) is very close to the sinusoidal function, and then the Fourier transform is performed on the obtained sequence. In addition, the position of the highest peak is the position of the mini-mum period of the audio.
Four ordinary students were found to have the number of beats according to the rhythm of the music. After all, the acceptable rhythm is often between 1s and 0.4s. In this experiment, the experimental results of some songs are multiplied by 2 or 4 until the period falls into the ear recognizable range and put into the Max column in order to prove that the rhythm heard by the human ear is an inte-ger multiple of the fundamental frequency. Table 1 shows the comparison between the sample and the experiment.
DOI: https://doi.org/10.26549/met.v5i1.6763
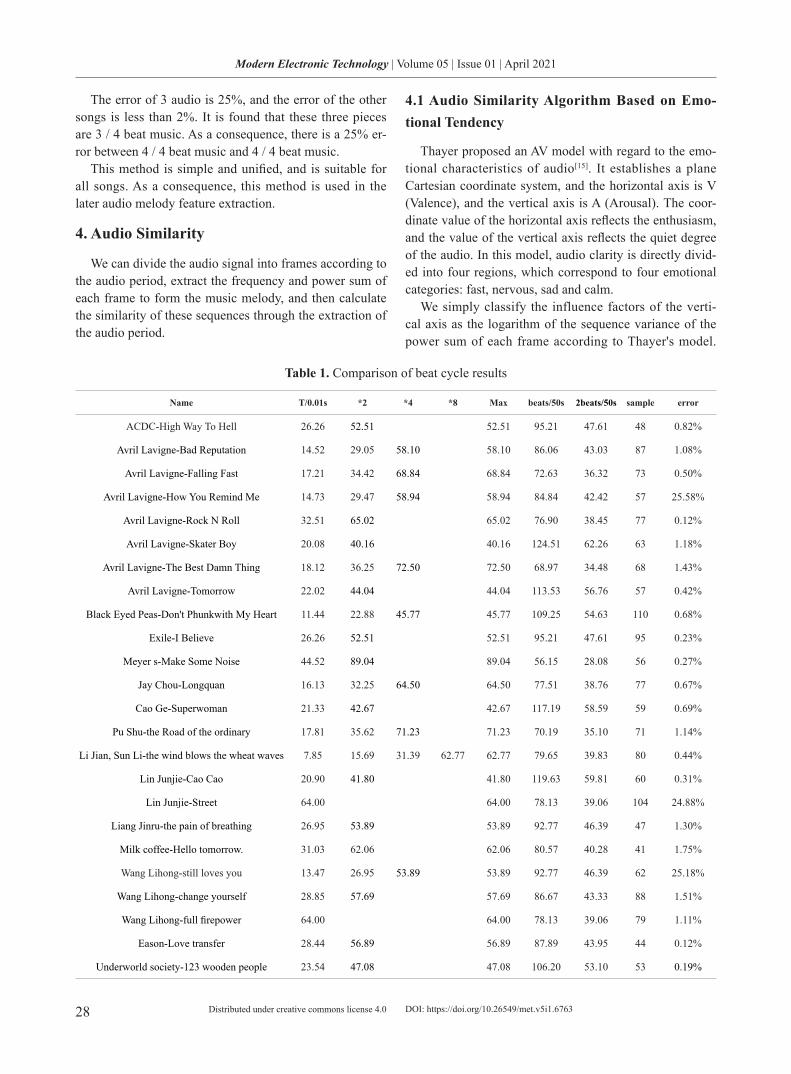
28
Modern Electronic Technology | Volume 05 | Issue 01 | April 2021
Distributed under creative commons license 4.0
The error of 3 audio is 25%, and the error of the other songs is less than 2%. It is found that these three pieces are 3 / 4 beat music. As a consequence, there is a 25% er-ror between 4 / 4 beat music and 4 / 4 beat music.
This method is simple and unified, and is suitable for all songs. As a consequence, this method is used in the later audio melody feature extraction.
4. Audio Similarity
We can divide the audio signal into frames according to the audio period, extract the frequency and power sum of each frame to form the music melody, and then calculate the similarity of these sequences through the extraction of the audio period.
4.1 Audio Similarity Algorithm Based on Emo-tional Tendency
Thayer proposed an AV model with regard to the emo-tional characteristics of audio[15]. It establishes a plane Cartesian coordinate system, and the horizontal axis is V (Valence), and the vertical axis is A (Arousal). The coor-dinate value of the horizontal axis reflects the enthusiasm, and the value of the vertical axis reflects the quiet degree of the audio. In this model, audio clarity is directly divid-ed into four regions, which correspond to four emotional categories: fast, nervous, sad and calm.
We simply classify the influence factors of the verti-cal axis as the logarithm of the sequence variance of the power sum of each frame according to Thayer's model.
Table 1. Comparison of beat cycle results
Name T/0.01s *2 *4 *8 Max beats/50s 2beats/50s sample error
ACDC-High Way To Hell 26.26 52.51 52.51 95.21 47.61 48 0.82%
Avril Lavigne-Bad Reputation 14.52 29.05 58.10 58.10 86.06 43.03 87 1.08%
Avril Lavigne-Falling Fast 17.21 34.42 68.84 68.84 72.63 36.32 73 0.50%
Avril Lavigne-How You Remind Me 14.73 29.47 58.94 58.94 84.84 42.42 57 25.58%
Avril Lavigne-Rock N Roll 32.51 65.02 65.02 76.90 38.45 77 0.12%
Avril Lavigne-Skater Boy 20.08 40.16 40.16 124.51 62.26 63 1.18%
Avril Lavigne-The Best Damn Thing 18.12 36.25 72.50 72.50 68.97 34.48 68 1.43%
Avril Lavigne-Tomorrow 22.02 44.04 44.04 113.53 56.76 57 0.42%
Black Eyed Peas-Don't Phunkwith My Heart 11.44 22.88 45.77 45.77 109.25 54.63 110 0.68%
Exile-I Believe 26.26 52.51 52.51 95.21 47.61 95 0.23%
Meyer s-Make Some Noise 44.52 89.04 89.04 56.15 28.08 56 0.27%
Jay Chou-Longquan 16.13 32.25 64.50 64.50 77.51 38.76 77 0.67%
Cao Ge-Superwoman 21.33 42.67 42.67 117.19 58.59 59 0.69%
Pu Shu-the Road of the ordinary 17.81 35.62 71.23 71.23 70.19 35.10 71 1.14%
Li Jian, Sun Li-the wind blows the wheat waves 7.85 15.69 31.39 62.77 62.77 79.65 39.83 80 0.44%
Lin Junjie-Cao Cao 20.90 41.80 41.80 119.63 59.81 60 0.31%
Lin Junjie-Street 64.00 64.00 78.13 39.06 104 24.88%
Liang Jinru-the pain of breathing 26.95 53.89 53.89 92.77 46.39 47 1.30%
Milk coffee-Hello tomorrow. 31.03 62.06 62.06 80.57 40.28 41 1.75%
Wang Lihong-still loves you 13.47 26.95 53.89 53.89 92.77 46.39 62 25.18%
Wang Lihong-change yourself 28.85 57.69 57.69 86.67 43.33 88 1.51%
Wang Lihong-full firepower 64.00 64.00 78.13 39.06 79 1.11%
Eason-Love transfer 28.44 56.89 56.89 87.89 43.95 44 0.12%
Underworld society-123 wooden people 23.54 47.08 47.08 106.20 53.10 53 0.19%
DOI: https://doi.org/10.26549/met.v5i1.6763
29
Modern Electronic Technology | Volume 05 | Issue 01 | April 2021
Distributed under creative commons license 4.0
In addition, the influence factors of the horizontal axis as the frequency sequence variance at the peak of the frame spectrum. That is:
A=log(var(w));V=var(fd);
In the formula, w is the power sum sequence of each frame and fd is the frequency sequence corresponding to the maximum value in the difference sequence of the spectrum of the two frames. Var is a function of variance. The reason why fd takes the difference as the main feature is that people are more sensitive to the changing frequen-cy than the constant frequency.For example, we often ig-nore the drumbeat in the background music and focus on the changing part of the song when we listen to music.
In the meanwhile, we add a Z axis, Z=log(mean(w)), that is, the average of power sum, as the third feature that affects audio. For each piece of music, we have a vector (a,v,z), based on which we draw a three-dimensional dis-tribution image of 496 pieces of music.
Next, we carry on the clustering analysis to these data points. In addition, the following briefly introduces the commonly used clustering algorithms.
4.2 K-means Clustering
The early idea of K-means clustering algorithm is put forward by Hugo Steinhaus [17]. This algorithm has become one of the most famous and commonly used clustering algorithms because the algorithm is simple to implement, low time complexity and space complexity, and satisfactory results can be obtained for many simple clustering problems.
First of all, the algorithm assumes that the mean of each cluster is fixed and known. As a result, the problem becomes to add a cluster for each sample x, so that the in-tra-class distance criterion is minimized. Besides, difficul-ty of the algorithm is how to find the mean of each cluster. After all, it is impossible to obtain the mean of each clus-ter before knowing which samples each cluster contains. In addition, the mean of the cluster can only be obtained according to all the samples in the cluster.
We first enter k initial values as the k class, and then put the data points into the nearest class at one time to get the mean value of each cluster. In addition, we input the data points again according to these averages. The clustering center does not change after many iterations. In this case, the clustering result is a better solution with the smallest intra-class distance criterion.
However, the disadvantage of K-means clustering is also obvious. The intra-class distance can not be guar-anteed to be the minimum for the final output results
though the K-means clustering algorithm has been proved to be convergent through limited steps. More-over, K-means clustering will also converge to the local minimum solution according to the different selection of initial values. In addition, it is often difficult to get better clustering results if the K setting deviates from the actual problem.
In view of these problems, we can also choose to opti-mize the K-means algorithm in advance. For example, the output of the initial value to select k points with the larg-est distance from each other, select the appropriate dis-tance function and so on according to the prior knowledge to select a better value of K.
4.3 Spectral Clustering Algorithm
Spectral clustering algorithm transforms the aggrega-tion of elements into a kind of graph segmentation, and divides the undirected graph of data elements into several optimal subgraphs, which is different from most clustering algorithms. As a result, it minimizes the cost of segmenta-tion. in order to achieve the purpose of clustering[2,3,9].
The basic steps of spectral clustering are:a) Inputting data; b) Normalized Laplace matrix; c) Calculating the smallest k eigenvalues and the corre-
sponding eigenvector; d) Clustering Eigenvectors (a small number of Eigen-
vectors) by k-means.The advantage of spectral clustering is that there is no
theoretical basis for the selection of feature vectors if we directly use the k-means algorithm for clustering analysis of undirected graphs. The introduction of Laplace ma-trix into spectral clustering adds physical meaning to the segmentation of graphs. In other words, for the dimen-sionality reduction of high-dimensional space, finding the eigenvector of Laplace matrix is equivalent to the dimen-sionality reduction of high-dimensional space.
4.4 Comparison of Clustering Results
We compare the type distribution map of the original file with the type distribution map of the original file for K-means and spectral clustering. The original audio type is the playlist type of NetEase Yun music. For example, all music on the playlist is set to the light music type if a playlist is named light music. In addition, if the playlist type is rock, all songs on the playlist are set to rock. Final-ly, each point is colored and drawn on a two-dimensional plane, which is a type distribution map. Figure 7 (a) shows the type distribution of 469 pieces of music, in which the positive triangle is rock, rap and other exciting music; The
DOI: https://doi.org/10.26549/met.v5i1.6763

30
Modern Electronic Technology | Volume 05 | Issue 01 | April 2021
Distributed under creative commons license 4.0
inverted triangle is electric sound and DJ audio; Circles represent light music and soothing music. Let's divide them into one category for the time being because of the characteristics of rock and sound. Figure 7 (b) is the result of clustering using K-means, K=2. Fig. 7 (c) is the cluster-ing result obtained by using spectral clustering, K=2.
Figure 7. (a) Real type distribution map (b) Clustering results of K-means (c) Clustering results of spectral clus-
tering
We find that the density of audio types is different in different regions though several groups of data are crossed in the experiment. Compared with the two clustering methods, the spectral clustering algorithm is closer to our actual situation.
The fitting results of the two clustering results and the real results are shown in tables 2 and 3, respectively.
Table 2. Obfuscation matrices obtained by different clus-tering algorithms
Clustering algorithm K mean Spectral clustering
Real category cluster1 cluster 2 cluster 1 cluster 2
Real category 1 228 114 34 308
Real category 2 0 154 150 4
It can be seen that the clustering effect of K-means al-gorithm is not ideal, and the clustering effect of spectral clustering is ideal.
5. Conclusion
A clustering analysis method for music data is pro-posed. Firstly, the audio beat period is calculated by read-ing the audio file data. Besides, the emotional features of the audio are extracted. Secondly, the Fourier transform is used to calculate the audio beat period. Finally, a cluster-ing algorithm is designed to obtain the clustering results of music data.
Acknowledgments
Thisre search was partially supported by the National Natural Science Foundation of China (grant 62076215) and the Talent Introduction Project of Yancheng Institute of Technology under Grant No. XKR2011019.
References
[1] Yang Shen,Shu Peng. An automatic detection al-gorithm of music speed and beat type[J].Digital Techmology & Applicaton,2009(08):39-41.
[2] Zheng Yangfan. Spectral Clustering Based on the Graph Theory Algorithms Research and Implementa-tion[D]. Master Thesis of South China University of Technology,2012.
[3] Jia Jianhua,Jiao Licheng. Mage Segmentation by Spectral Clustering Algorithm with Spatial Coher-ence Constraints[J].Journal of Infrared and Millime-ter Waves,2010(01):69-74.
[4] Liu Haomiao,Xu Congfu,He Jun. Study on in-telligent song recommendation based on fuzzy clustering[J].Computer Engineering and De-sign,2009(10):2423-2427.
[5] Chen Jie,Xu Jieping,Liu Xuan. Research on music similarity computation based on content[A]. The 7th Joint Conference on HHME [C]. 2011.
[6] Shi Dan. Research on Music Genre Similarity Detec-tion Algorithm[D]. Master Thesis of Dalian Univer-sity of Technology,2013.
[7] Kong Xu. Music Retrieval based on Audio Fomat
DOI: https://doi.org/10.26549/met.v5i1.6763

31
Modern Electronic Technology | Volume 05 | Issue 01 | April 2021
Distributed under creative commons license 4.0
Music Retrieval based on Spectrogram [D]. Master Thesis of Fudan University,2009.
[8] Chen Tingliang. Music Structure Analysis and Appli-cation[D]. Master Thesis of Harbin Institute of Tech-nology,2006.
[9] Ulrike von Luxburg. A Tutorial on Spectral Cluster-ing[J]. Statistics and Computing, 2007(4):395-416.
[10] Kong Xu, Guan Jihong. Audio Fomat Music Retriev-al based on Spectrogram Similarity[J].Computer En-gineering and Applications, 2009(13):136-141.
[11] Feng Yong. Music Spectrum Analysis and Spec-trum Analysis Software [J]. Music Communica-tion,2013(03):45-48.
[12] Xiang Kai. Music Style Classification based on Spec-trum Contrast Feature [J]. Microcomputer Applica-
tions,2005(03):51-53.[13] Shuang Zhiwei,Zhang Shilei,Qin Yong. Speech Con-
version Similarity Improvement based on Spectrum Curvature [A]. the 10th NCMMSC[C].2009
[14] Li Zhijun,Yin Xia. Improved Method of Speech Pitch Detection based on ACF and AMDF[J]. Audio Engi-neering,2011(01):50-52.
[15] Thayer,R.E. The biopsychology of mood and arous-al[M]. Oxford, New York.1989.
[16] HALL A V. Methods for demonstrating resemblance in taxonomy and ecology [J]. Nature, 1967(5):830-831
[17] STEINHAUS H.Sur la division des corps materiels en parties[J].Bull. Acad. Polon. Sci,1957(12): 801-804.
DOI: https://doi.org/10.26549/met.v5i1.6763

Modern Electronic TechnologyAuthor Guidelines
I. Manuscript Format ● Manuscripts should be in MS Word format. Authors are advised to download the document, Manuscript Submission Template, as
a template or for more details on preparing their submissions for consideration. ● Authors must ensure that the manuscripts are written in clear and comprehensible English. Manuscripts may be written in either
American or British English. Non-English words usage must be kept to a minimum and the font must be italicized (except for e.g. and i.e.).
●to ensure that the academic content of the paper is fully understood by its prospective readers.
II. Cover letter
the author has approved the submission of the article and that it has not been submitted to more than one journal simultaneously.
Researcher A is an employee of XXX. Researcher B has received grants from XXX.
Informed consent: Written informed consent was obtained from all subjects prior to the study.
Ethical approval: The ethics committee of XXXX has approved this study (REC number: XXXX).
Trial registration: Name of trial registry (Trial Registration Number)
Contribution: Researchers A and B researched literature and conceived the study. Researcher A was involved in protocol
A well-written cover letter would provide an opportunity to convince journal editors to consider the article for publication. The
Below is an example of the information that should ideally be included in your cover letter:1. The relevance of the study and its relevance to the journal2. The research question
4. Important conclusions that can be drawn from your research5. A self-written statement that the manuscript has yet to be published in any other journal and is not under consideration for publication in any journal other than the Journal.6. Any additional details that may encourage the editor to send your article for review.
III. TitleAuthors should avoid the usage of excessive uncommon jargon that may affect the target audience's understanding. Avoid titles that
speaking readers may be deemed to be unsuitable for a broad audience.
IV. List of AuthorsAuthors' names should be spelled out fully instead of only listing their initials with their respective affiliations included in the footnotes. It must be ensured that the authors of a particular manuscript are listed based on the extent of their contribution and the
contain the following core information: department, institution, city, state, postal code, and country. Only include the email of one
version of the manuscript before submitting it via the system.
V. AbstractAuthors should include an abstract which is a concise summary of a research paper that is fully self-contained and makes sense by itself. It should be info
abstract should be the range of 200-250 words, indented and single spaced. Ideally, an abstract should be the last thing that the author writes after completing his manuscript. Authors should also include 5-8 keywords after the abstract and avoid using the words that have already been used in the title of the manuscript.
VI. Section HeadingsAuthors must ensure that all section headings, subheadings and sub-subheadings are differentiated by font size. The bold font must be used for the major headings and subheadings, and italic font must be used for the sub-subheadings in parenthesis.Example:Main Headings: Bold, font size 14Headings: Bold, font size 12Sub headings: Bold and Italic, font size 12Sub-sub headings: Italic, font size 12
VII. IntroductionThe introduction of the paper should start with an explanation of why a particular research is being conducted and conclude with the selected research approach. Authors must ensure that a non-technical reader would be able to understand the introduction, including
readers if the authors provided a clear, one sentence purpose statement of the research. It would be advisable to keep the length of the introduction to approximately 1/2 page (1-2 paragraphs).
VIII. Materials and MethodsIn this section, authors are required to provide a detailed account of the procedure that was followed while conducting the research described in the report. This will help the readers to obtain a clear understanding of the research and also allow them to replicate the study in the future. Authors should ensure that every method used is described and include citations for the procedures that have been described previously. Avoid any kind of discussion in this section regarding the methods or results of any kind.
IX. EthicsEthics information, including IACUC permit numbers and/or IRB name, if applicable. This information should be included in a
X. ResultsThis section can be divided into subheadings. This section focuses on the results of the experiments performed.
XI. DiscussionIn this section, authors should state their interpretations and explain the implications of their results and make suggestions for future research. The discussion should be kept as short as possible while clearly and fully stating, supporting, explaining, and defending the author's answers and discussing other important and directly relevant issues. Authors should avoid discussing side issues as it may obscure the message.
XII. ConclusionAuthors should note that the conclusion is extremely important as it provides a closure for their paper. An effective conclusion
rewriting the abstract as the conclusion.
XIII. Funding
biological sources, writing assistance, administrative support, contributions from non-authors etc.
XIV. Appendixsection.
Any appendices should be included at the end of the main text of the paper, after the acknowledgments section (if any) but before the

XV. TextThe text of the manuscript should be in Microsoft Word or Latex. The length of the manuscript cannot be more than 50000 characters (inclusive of spaces) or approximately 7000 words.
XVI. Figures
images, graphs, charts and schematic diagrams. Figures submitted should avoid unnecessary decorative effects (e.g. 3D graphs) as
against a white background.
parenthesis (e.g. A, B, C, etc.)
optimal resolution. Optimal resolutions preferred are 300 dots per inch for RGB colored, 600 dots per inch for greyscale and 1200
submission system if necessary.The Editor-in-Chief and Publisher reserve the right to request from author(s) the high-resolution files and unprocessed data and
XVII. Tables, lists and equationsTables, lists and equations must be submitted together with the manuscript. Likewise, lists and equations should be properly aligned and its meaning made clear to readers. Tables created using Microsoft Word's table function are preferred. Tables in the manuscript
Vertical lines should not be used to separate columns. Leave some extra space between the columns instead. All tables should be based on three horizontal lines to separate the caption, header and body. A few additional horizontal lines MAY be included as needed. Any explanations essential to the understanding of the table should be given in footnotes at the bottom of the table. SI units should be used if necessary.
XVIII. Supplementary Information
is relevant to the manuscript but is non-essential to readers' understanding of the manuscript's main content. All supplementary
info'.
XIX. In-text citationsReference citations in the text should be numbered consecutively in superscript square brackets. Some examples:
● Negotiation research spans many disciplines[3,4]. ● This result was later contradicted by Becker and Seligman[5]. ● This effect has been widely studied[1-5,7].
Personal communications and unpublished works can only be used in the main text of the submission and are not to be placed in the
authors and year of such unpublished works or personal communications and the word ‘Unpublished' in parenthesis, E.g. (Smith J, 2000, Unpublished).
XX. ReferencesClick elines.pdf to view/download the complete Reference Guideline.

Synergy Publishing Pte. Ltd. (SP) is an international publisher of online, open access and scholarly peer-reviewed journals covering a wide range of academic disciplines including science, technology, medicine, engineering, education and social science. Reflecting the latest research from a broad sweep of subjects, our content is accessi-ble worldwide – both in print and online.
SP aims to provide an analytics as well as platform for information exchange and discussion that help organiza-tions and professionals in advancing society for the betterment of mankind. SP hopes to be indexed by well-known databases in order to expand its reach to the science community, and eventually grow to be a reputable publisher recognized by scholars and researchers around the world.
SP adopts the Open Journal Systems, see on http://ojs.s-p.sg
About the Publisher
Database Inclusion
China National KnowledgeInfrastructure
Asia & Pacific ScienceCitation Index Creative Commons
Google Scholar Crossref MyScienceWork