Models and Tools for Drawing Inferences from …Models and Tools for Drawing Inferences from Student...
30
Models and Tools for Drawing Inferences from Student Work Cathleen A. Kennedy Berkeley Evaluation & Assessment Research (BEAR) Center University of California, Berkeley Paper presented at the annual meeting of the American Education Research Association, Montreal, Canada, April 2005 This material is based on work supported by the National Science Foundation under grant REC-0129331 (PADI Implementation Grant). The findings and opinions expressed in this paper do not necessarily represent the views of the Foundation.
Transcript of Models and Tools for Drawing Inferences from …Models and Tools for Drawing Inferences from Student...
Models and Tools for Drawing Inferences from Student Work
Cathleen A. Kennedy
Berkeley Evaluation & Assessment Research (BEAR) Center University of California, Berkeley
Paper presented at the annual meeting of the American Education Research
Association, Montreal, Canada, April 2005
This material is based on work supported by the National Science Foundation under grant REC-0129331 (PADI Implementation Grant). The findings and opinions expressed in this paper do not necessarily represent the views of the Foundation.
Models and Tools for Drawing Inferences from Student Work Cathleen A. Kennedy April 14, 2005
Abstract
A key challenge in science assessment is drawing meaningful inferences from
student work on comprehensive problems. Not only must the inferences be accurate reflections of what students know and can do with that knowledge, but to be useful as a resource to improve learning outcomes, these inferences should inform teachers’ plans and students’ learning strategies. To implement measurement that goes beyond percent correct, assessment designers need to specify evaluation procedures and measurement models describing how student work is to be scored and how those scores are to be interpreted. These can be quite complex when individual responses are conditionally dependent and/or multivariate, as is often the case with complex, multi-step science assessment tasks. The technique developed by PADI researchers gathers intermediate data from such tasks, rather than just the final answer, and uses it to inform person measures on multiple dimensions. The PADI design system is flexible and can support a number of complex measurement models, presenting the assessment designer with an array of choices and decisions to make. We are currently exploring how tools might be developed to help developers select and design appropriate measurement models for their purposes.
The PADI project has chosen a particular family of measurement models to implement as an exemplar for the system: A multidimensional, Rasch-based item response model developed by Adams, Wilson and Wang (1997) known as the multidimensional random coefficients multinomial logit model (MRCMLM). A scoring engine servlet has been developed that assessment applications can call via HTTP (HyperText Transport Protocol) to generate proficiency estimates. This paper explains the PADI approach to assessment design and how the BEAR Scoring Engine accommodates a number of multidimensional measurement models. We then develop an example to illustrate design decisions that must be made to complete the chain of reasoning from (1) the inferences one wishes to draw, to (2) the evidence required to draw the inferences, to (3) the observations required to generate the evidence. When this chain of reasoning is complete, the inferences about what students know and are able to do can be interpreted in the context of the purpose of a coherent assessment system.
Models and Tools for Drawing Inferences from Student Work Cathleen A. Kennedy April 14, 2005
Introduction
A key challenge in science assessment is drawing meaningful inferences from
student work on comprehensive problems. Not only must the inferences be accurate
reflections of what students know and can do with that knowledge, but to be useful as a
resource to improve learning outcomes, these inferences should inform teachers’ plans
and students’ learning strategies. To implement measurement that goes beyond percent
correct, assessment designers need to specify evaluation procedures and measurement
models describing how student work is to be scored and how those scores are to be
interpreted. These can be quite complex when individual responses are conditionally
dependent and/or multivariate, as is often the case with comprehensive, multi-step
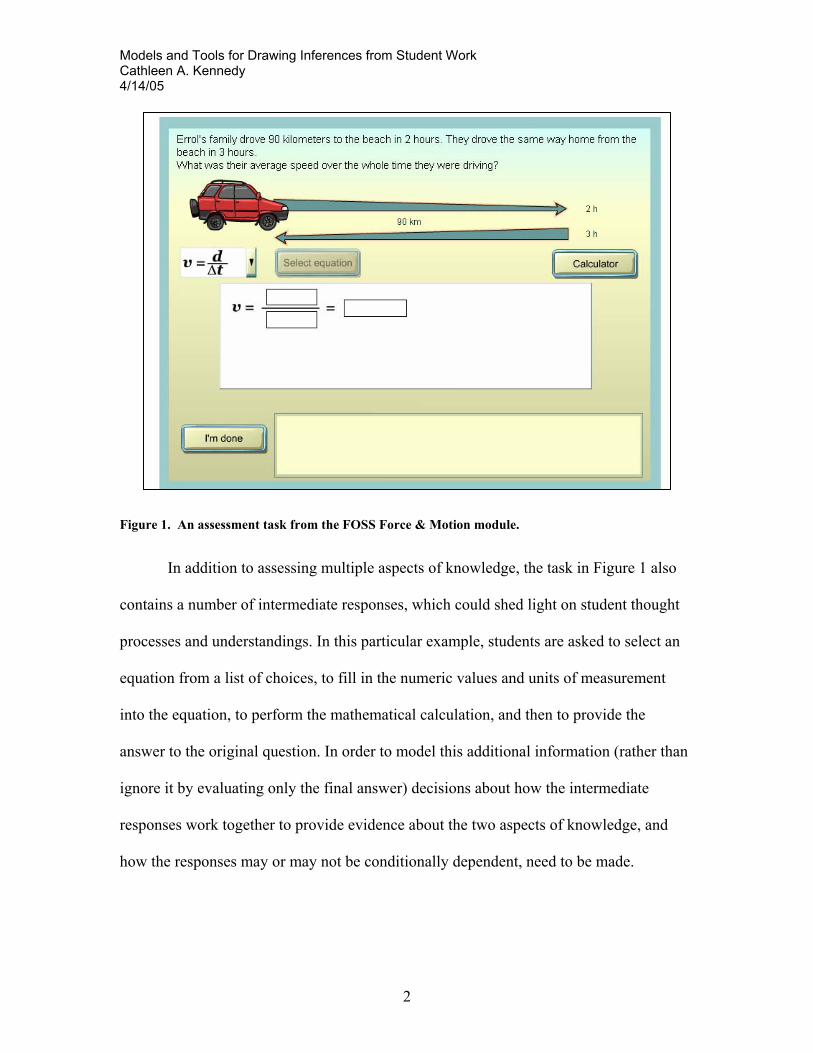
science assessment tasks. For example, the assessment task shown in Figure 1, from the
Full-Option Science System module on Force and Motion (UCB-LHS, 2005), is intended
to assess both knowledge about physics (in particular, about speed) and knowledge about
mathematics. This distinction between the two cognitive processes is deemed important
to help teachers and students differentiate between the underlying sources of incorrect
responses.
Models and Tools for Drawing Inferences from Student Work Cathleen A. Kennedy 4/14/05
2
Figure 1. An assessment task from the FOSS Force & Motion module.
In addition to assessing multiple aspects of knowledge, the task in Figure 1 also
contains a number of intermediate responses, which could shed light on student thought
processes and understandings. In this particular example, students are asked to select an
equation from a list of choices, to fill in the numeric values and units of measurement
into the equation, to perform the mathematical calculation, and then to provide the
answer to the original question. In order to model this additional information (rather than
ignore it by evaluating only the final answer) decisions about how the intermediate
responses work together to provide evidence about the two aspects of knowledge, and
how the responses may or may not be conditionally dependent, need to be made.
Models and Tools for Drawing Inferences from Student Work Cathleen A. Kennedy 4/14/05
3
In the Principled Assessment Designs for Inquiry (PADI) project environment,
we call assessment tasks “complex” when they are intended to measure multiple aspects
of knowledge, when responses are conditionally dependent, or both. The project includes
development of Design System software to design assessment tasks, and Scoring Engine
software to compute proficiency estimates. The project and these software components
are described more fully in subsequent sections of this paper. One goal of the project is to
allow assessment developers to design complex assessment tasks and to interpret student
work from these tasks in a consistent and useful manner. The assessment design
techniques developed by PADI researchers facilitates the use of intermediate data, as well
as final answers, to support a more complete evidentiary basis for inferring person
measures on multiple aspects of knowledge. The BEAR Scoring Engine was developed
as an example of how a variety of measurement models can be operationalized to
generate proficiency estimates from multivariate tasks. Because the PADI Design System
supports the design of complex measurement models, the assessment developer using the
system is presented with an array of choices and decisions to make. We are currently
exploring how new tools might be constructed to help developers select and design
appropriate measurement models for their purposes.
This paper explains the PADI approach to assessment design and how the BEAR
Scoring Engine accommodates a number of multidimensional measurement models. We
then develop an example to illustrate design decisions that must be made to complete the
chain of reasoning from (1) the inferences one wishes to draw, to (2) the evidence
required to draw the inferences, to (3) the observations required to generate the evidence.
When this chain of reasoning is complete, the inferences about what students know and
Models and Tools for Drawing Inferences from Student Work Cathleen A. Kennedy 4/14/05
4
are able to do can be interpreted in the context of the purpose of a coherent assessment
system.
Background
Advances in science education, cognitive science, measurement, and computer
technologies have matured to the point that powerful tools are emerging to support the
development of high-quality assessments in science inquiry. In 2001, the National
Research Council (NRC) Committee on the Foundations of Assessment published
Knowing What Students Know: The Science and Design of Educational Assessment
(2001) to integrate developments in our understanding of human learning with
innovations in assessment practice.
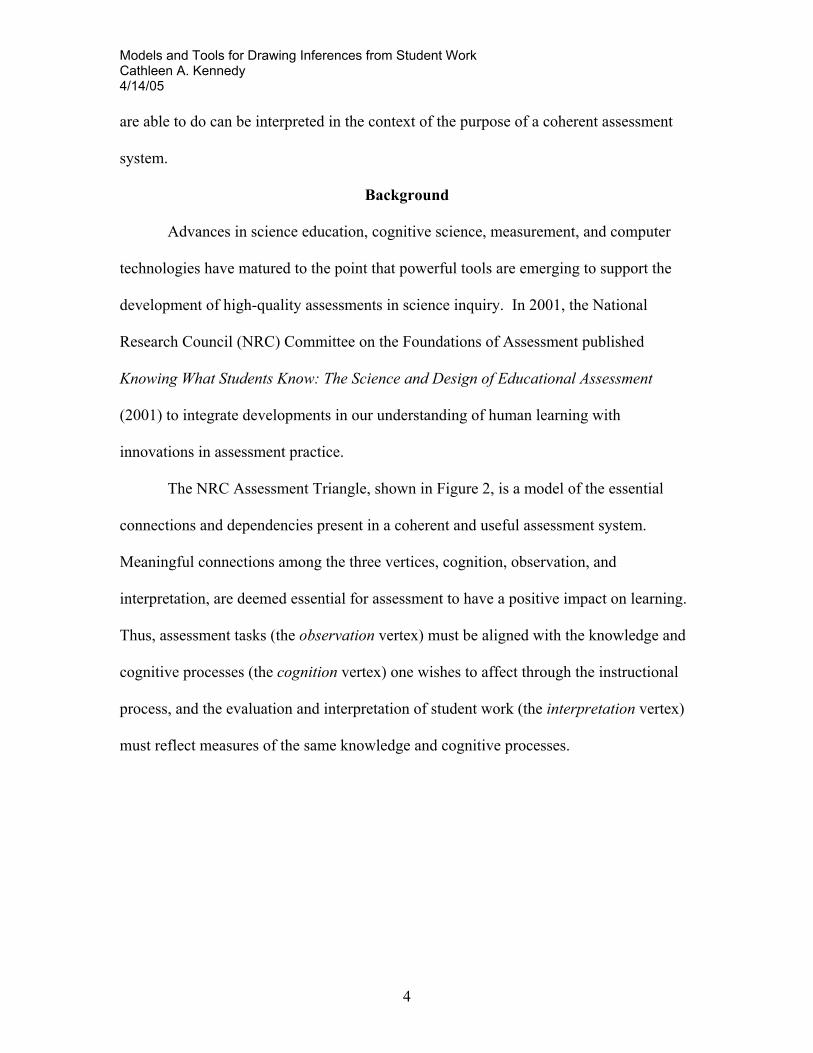
The NRC Assessment Triangle, shown in Figure 2, is a model of the essential
connections and dependencies present in a coherent and useful assessment system.
Meaningful connections among the three vertices, cognition, observation, and
interpretation, are deemed essential for assessment to have a positive impact on learning.
Thus, assessment tasks (the observation vertex) must be aligned with the knowledge and
cognitive processes (the cognition vertex) one wishes to affect through the instructional
process, and the evaluation and interpretation of student work (the interpretation vertex)
must reflect measures of the same knowledge and cognitive processes.
Models and Tools for Drawing Inferences from Student Work Cathleen A. Kennedy 4/14/05
5
The NSF-funded PADI project is developing technologies to facilitate the design
and development of assessment tasks that are consistent with the model of high-quality
assessment advanced by the NRC. The system takes advantage of advances in
educational measurement by anticipating the need for multidimensional item response
modeling (IRM) to draw inferences from the evidence generated from student responses.
The use of multidimensional IRM can enhance the interpretability of assessment
evidence by relating it to multiple learning goals. It can also improve the reliability and
validity of comparisons made over time and between student groups, particularly when
students do not complete the same assessment tasks, through the use of consistent scaling
at the task level (Rasch, 1960; Wright, 1993).
An assessment is comprised of a series of tasks that are administered to a
respondent to elicit evidence about his or her knowledge, skill, or ability. These targeted
cognitive processes are referred to as student model variables, and the collection of
variables for a given assessment purpose is referred to as a student model. A student
model variable can be represented as a continuum from having less of the knowledge,
skill, or ability to having more of it, and although a particular assessment may target a
Observation Interpretation
Cognition
Assessment Triangle
(Knowledge, Skills & Abilities)
Evaluation & Interpretation
Assessment Tasks
Figure 2. NRC assessment triangle with associated PADI terminology.
Models and Tools for Drawing Inferences from Student Work Cathleen A. Kennedy 4/14/05
6
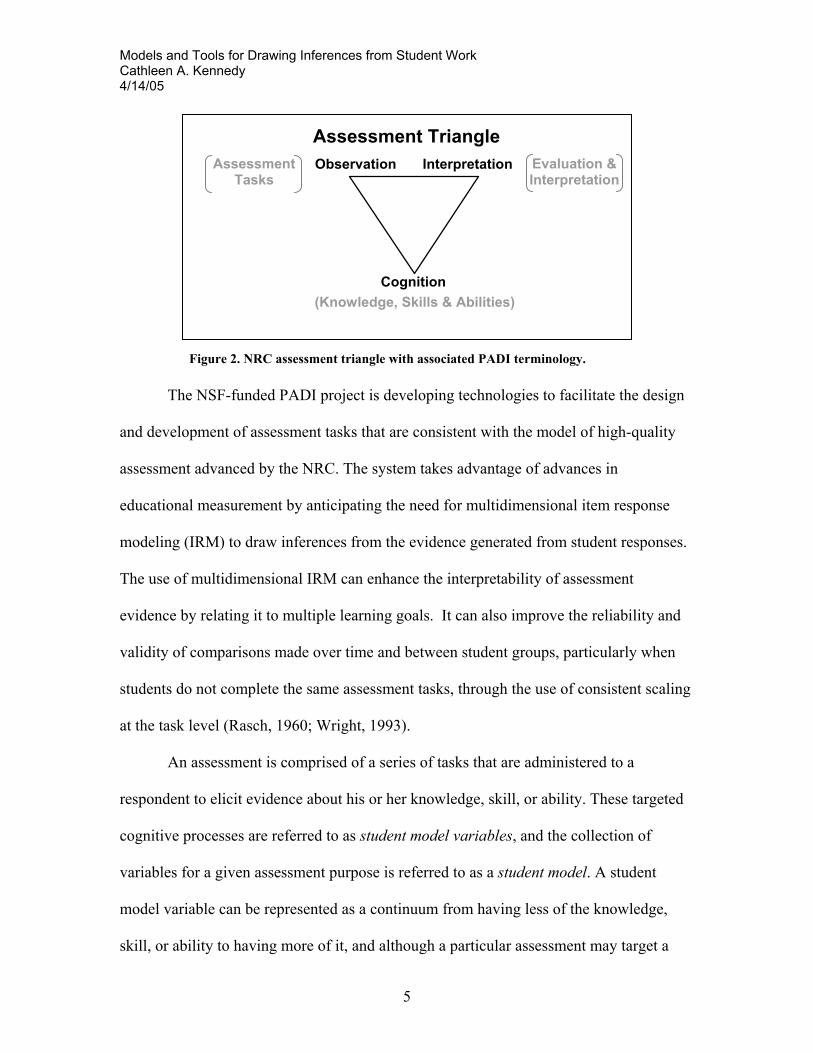
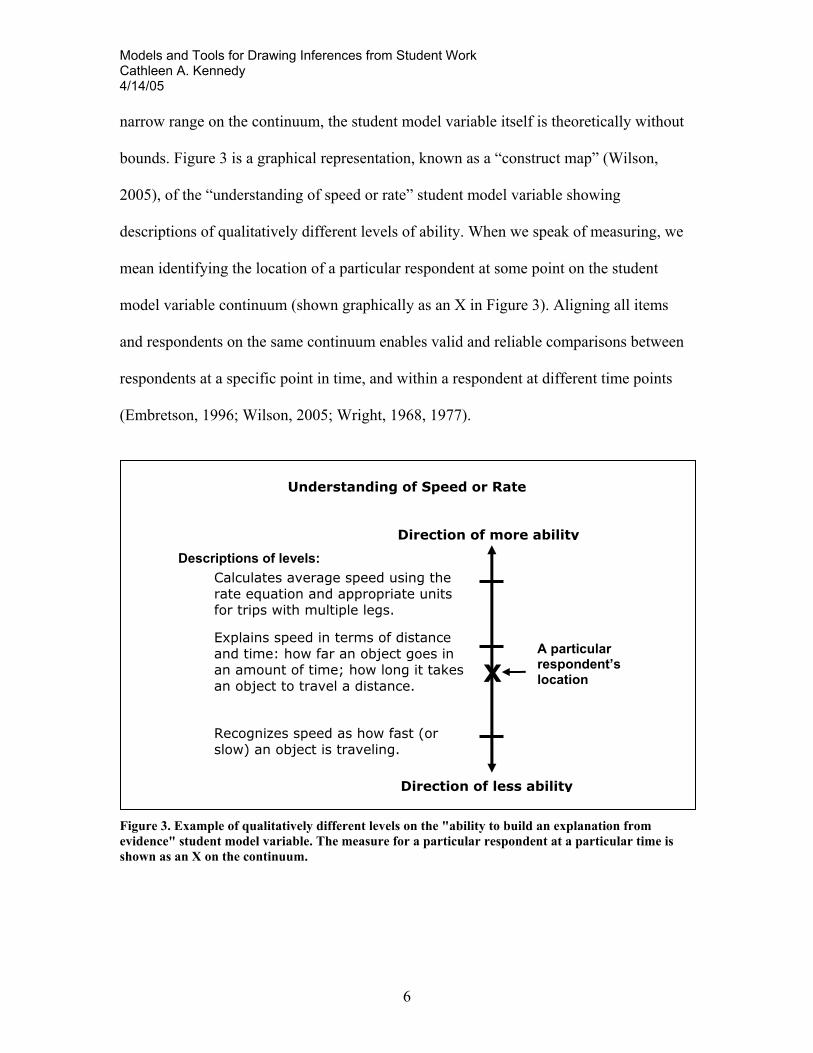
narrow range on the continuum, the student model variable itself is theoretically without
bounds. Figure 3 is a graphical representation, known as a “construct map” (Wilson,
2005), of the “understanding of speed or rate” student model variable showing
descriptions of qualitatively different levels of ability. When we speak of measuring, we
mean identifying the location of a particular respondent at some point on the student
model variable continuum (shown graphically as an X in Figure 3). Aligning all items
and respondents on the same continuum enables valid and reliable comparisons between
respondents at a specific point in time, and within a respondent at different time points
(Embretson, 1996; Wilson, 2005; Wright, 1968, 1977).
Figure 3. Example of qualitatively different levels on the "ability to build an explanation from evidence" student model variable. The measure for a particular respondent at a particular time is shown as an X on the continuum.
X
Recognizes speed as how fast (or slow) an object is traveling.
Explains speed in terms of distance and time: how far an object goes in an amount of time; how long it takes an object to travel a distance.
Calculates average speed using the rate equation and appropriate units for trips with multiple legs.
Understanding of Speed or Rate
Direction of more ability
Direction of less ability
A particular respondent’s location
Descriptions of levels:
Models and Tools for Drawing Inferences from Student Work Cathleen A. Kennedy 4/14/05
7
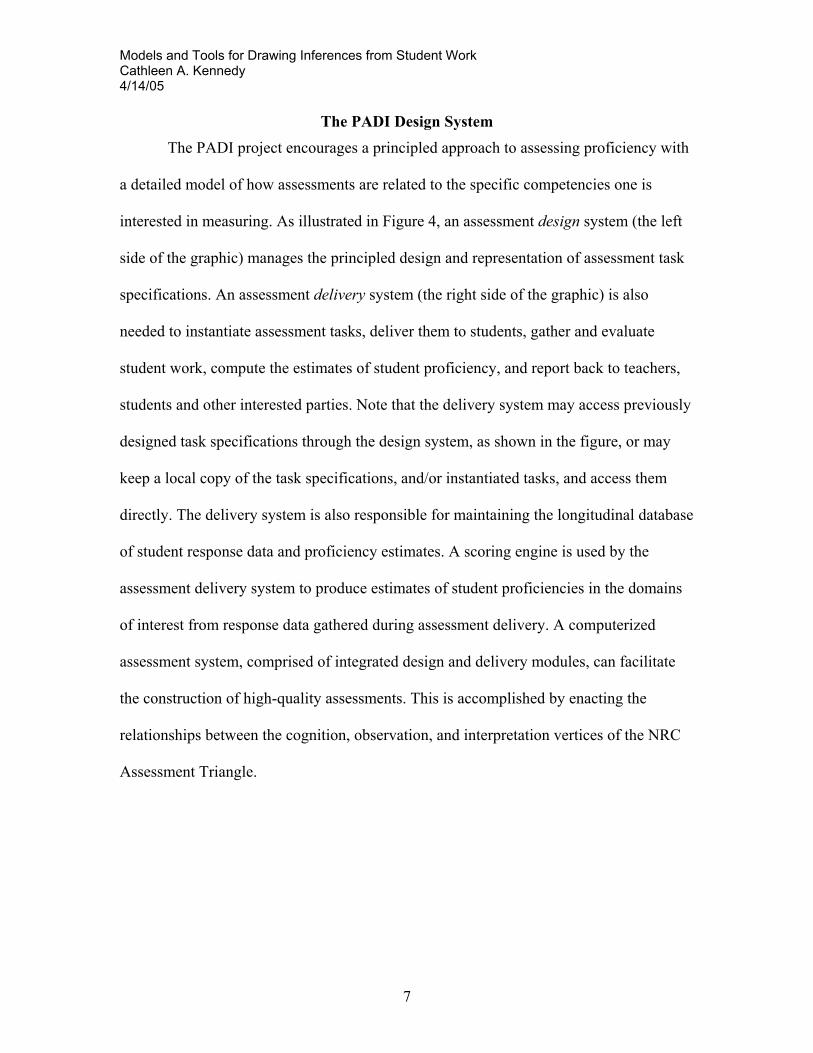
The PADI Design System The PADI project encourages a principled approach to assessing proficiency with
a detailed model of how assessments are related to the specific competencies one is
interested in measuring. As illustrated in Figure 4, an assessment design system (the left
side of the graphic) manages the principled design and representation of assessment task
specifications. An assessment delivery system (the right side of the graphic) is also
needed to instantiate assessment tasks, deliver them to students, gather and evaluate
student work, compute the estimates of student proficiency, and report back to teachers,
students and other interested parties. Note that the delivery system may access previously
designed task specifications through the design system, as shown in the figure, or may
keep a local copy of the task specifications, and/or instantiated tasks, and access them
directly. The delivery system is also responsible for maintaining the longitudinal database
of student response data and proficiency estimates. A scoring engine is used by the
assessment delivery system to produce estimates of student proficiencies in the domains
of interest from response data gathered during assessment delivery. A computerized
assessment system, comprised of integrated design and delivery modules, can facilitate
the construction of high-quality assessments. This is accomplished by enacting the
relationships between the cognition, observation, and interpretation vertices of the NRC
Assessment Triangle.

Models and Tools for Drawing Inferences from Student Work Cathleen A. Kennedy 4/14/05
8
An assessment delivery system, whether computerized or manual, is comprised of
four interrelated processes, as described in the Four Process Model developed by
Almond, Mislevy and Steinberg (2002), as illustrated in Figure 5: (1) Assessment tasks
are selected for delivery to the respondent, (2) the tasks are rendered and presented to the
respondent and respondent work products are collected, (3) the work products are
evaluated and categorized into evidence associated with the targeted student model
variables, and (4) the evidence is used to draw inferences about the student models of
individual respondents. In an integrated assessment system, both the design and delivery
modules access the same repository of assessment task specifications. These task
specifications define how tasks are to be generated and rendered to respondents, how
Design Phase Implementation Phase
Task Specifications
Repository
Assessment Design System
Student Database
Assessment Delivery System
Scoring Engine
Figure 4. Relationship of an assessment design system, delivery system, and scoring engine in an integrated assessment application. Shaded components are parts of the PADI System.

Models and Tools for Drawing Inferences from Student Work Cathleen A. Kennedy 4/14/05
9
work products are gathered and evaluated, and how inferences are to be drawn about
respondents’ knowledge, skill, or abilities.
A scoring engine is used to implement the interpretation model applied in the
inferential process (step 4). This “measurement model”, as we call it here, defines the
way evidence is used to produce estimates of each respondent’s locations on the student
model variables at the time of participating in the assessment. The assessment delivery
system evaluates student work prior to calling the scoring engine to produce proficiency
estimates. The evaluated response data and associated measurement models for each
assessment task (accessed from the task specification repository) are then sent to the
scoring engine, and the scoring engine computes and returns proficiency estimates for
each respondent. The assessment delivery system then produces summary feedback, or
may use intermediate proficiency estimates as input into the selection process for the next
task.
Activity Selection Process
Administrator
Presentation Process
Respondent
Task Level Response Evaluation
Process
Summary Feedback Evidence
Accumulation Process
Scoring Engine
Task Spec.
Repository
Figure 5. Four-process assessment delivery architecture with location of the scoring engine interface.
Models and Tools for Drawing Inferences from Student Work Cathleen A. Kennedy 4/14/05
10
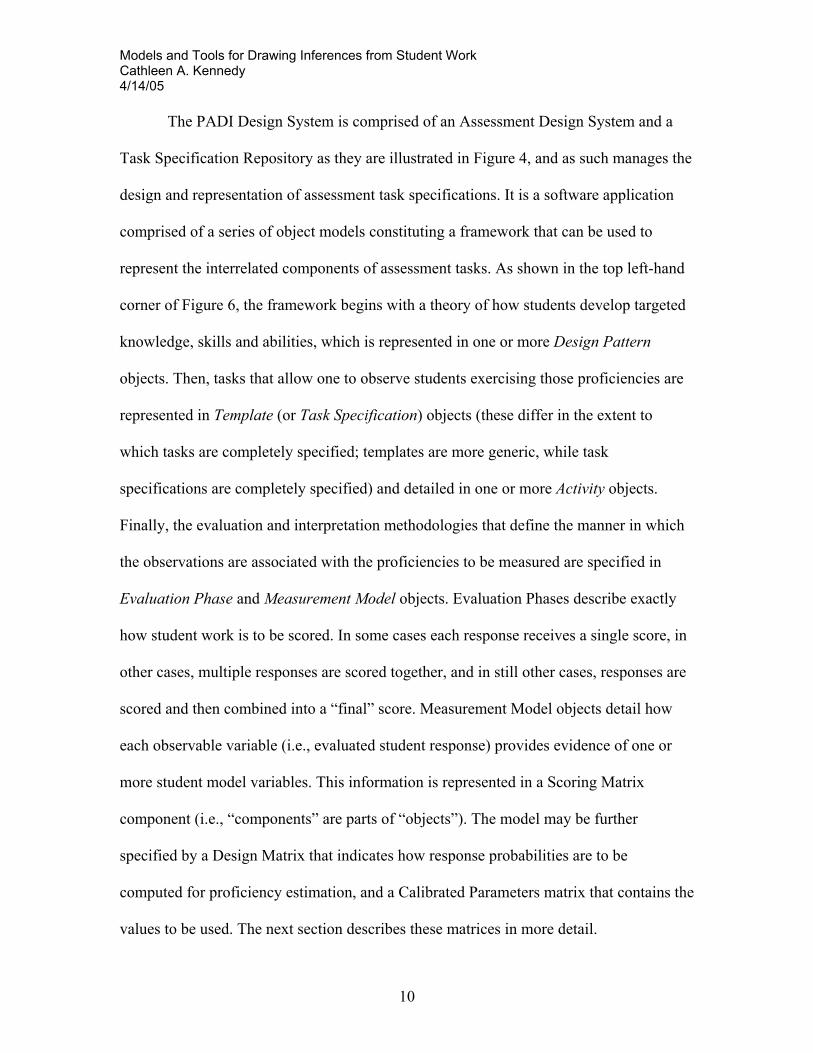
The PADI Design System is comprised of an Assessment Design System and a
Task Specification Repository as they are illustrated in Figure 4, and as such manages the
design and representation of assessment task specifications. It is a software application
comprised of a series of object models constituting a framework that can be used to
represent the interrelated components of assessment tasks. As shown in the top left-hand
corner of Figure 6, the framework begins with a theory of how students develop targeted
knowledge, skills and abilities, which is represented in one or more Design Pattern
objects. Then, tasks that allow one to observe students exercising those proficiencies are
represented in Template (or Task Specification) objects (these differ in the extent to
which tasks are completely specified; templates are more generic, while task
specifications are completely specified) and detailed in one or more Activity objects.
Finally, the evaluation and interpretation methodologies that define the manner in which
the observations are associated with the proficiencies to be measured are specified in
Evaluation Phase and Measurement Model objects. Evaluation Phases describe exactly
how student work is to be scored. In some cases each response receives a single score, in
other cases, multiple responses are scored together, and in still other cases, responses are
scored and then combined into a “final” score. Measurement Model objects detail how
each observable variable (i.e., evaluated student response) provides evidence of one or
more student model variables. This information is represented in a Scoring Matrix
component (i.e., “components” are parts of “objects”). The model may be further
specified by a Design Matrix that indicates how response probabilities are to be
computed for proficiency estimation, and a Calibrated Parameters matrix that contains the
values to be used. The next section describes these matrices in more detail.

Models and Tools for Drawing Inferences from Student Work Cathleen A. Kennedy 4/14/05
11
Figure 6. PADI design objects that operationalize the chain of reasoning from assessment purpose (represented in Design Patterns), to work products (represented in Activities), to evaluation (represented in Evaluation Phases) and interpretation (represented in Measurement Models).
Essentially, evaluation phases transform student work products into the
observations that comprise the evidence from which inferences about student knowledge
are drawn. Measurement models provide the details of precisely how those inferences are
to be calculated. An assessment delivery system manages the delivery of assessment
tasks to students and implements the evaluation phases. It then calls the scoring engine to
apply the measurement model definitions to transform observable variables into values
(locations) on the student model variables.
Design Pattern
Activity
Measurement Model(s) Evaluation Procedure(s) Work Product(s)
Evaluation Procedure
Evaluation Phase(s)
Student Model
Student Model Variables
Template (Task Spec)
Design Pattern(s) Student Model Activity(ies)
Evaluation Phase
Work Product Input Observable Var(s). Evaluation Action Output Observable Var.
Measurement Model
Student Model Var(s). Observable Variable Scoring Matrix Design Matrix Calibrated Parameters
Rationale KSAs Potential Work Products
Models and Tools for Drawing Inferences from Student Work Cathleen A. Kennedy 4/14/05
12
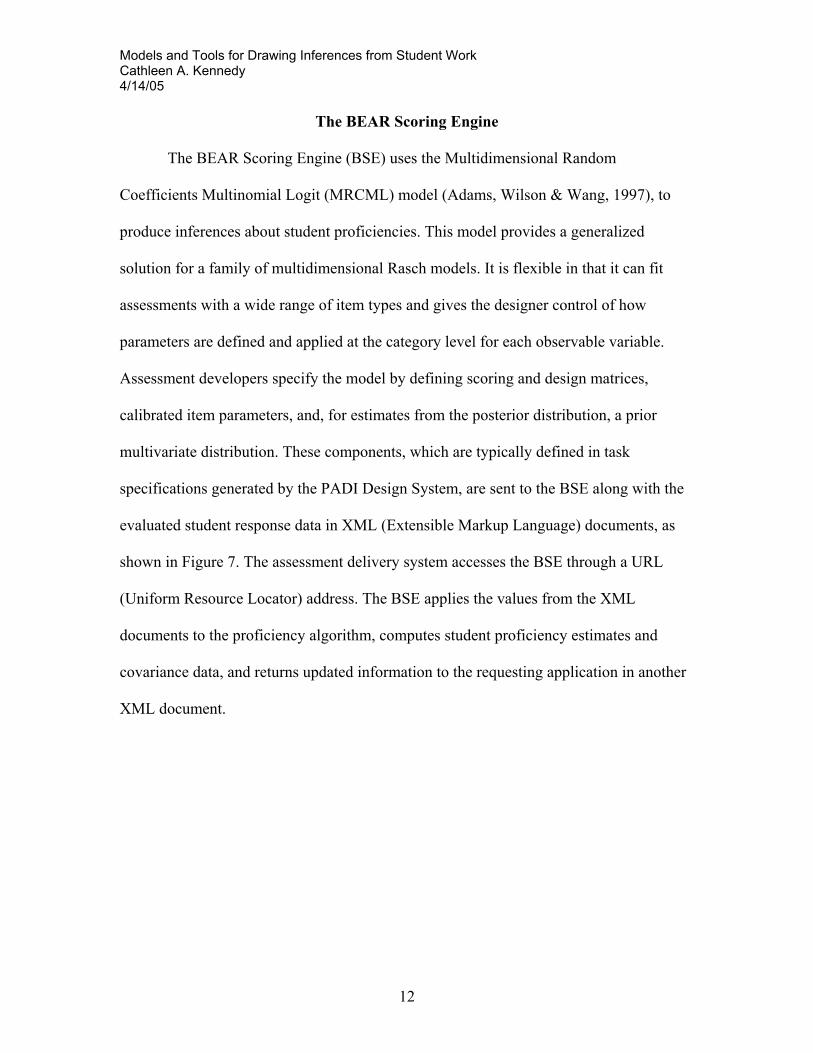
The BEAR Scoring Engine
The BEAR Scoring Engine (BSE) uses the Multidimensional Random
Coefficients Multinomial Logit (MRCML) model (Adams, Wilson & Wang, 1997), to
produce inferences about student proficiencies. This model provides a generalized
solution for a family of multidimensional Rasch models. It is flexible in that it can fit
assessments with a wide range of item types and gives the designer control of how
parameters are defined and applied at the category level for each observable variable.
Assessment developers specify the model by defining scoring and design matrices,
calibrated item parameters, and, for estimates from the posterior distribution, a prior
multivariate distribution. These components, which are typically defined in task
specifications generated by the PADI Design System, are sent to the BSE along with the
evaluated student response data in XML (Extensible Markup Language) documents, as
shown in Figure 7. The assessment delivery system accesses the BSE through a URL
(Uniform Resource Locator) address. The BSE applies the values from the XML
documents to the proficiency algorithm, computes student proficiency estimates and
covariance data, and returns updated information to the requesting application in another
XML document.

Models and Tools for Drawing Inferences from Student Work Cathleen A. Kennedy 4/14/05
13
The BSE estimates student proficiencies using two methods: expected a-posteriori
(EAP) and maximum likelihood estimation (ML). The EAP is a Bayesian estimation
procedure that uses both the student responses and the person distribution to calculate
student estimates of θ, while the ML approach uses only the student responses. The
assessment delivery system can request either EAP or ML estimates, and can also specify
a number of other estimation conditions that the BSE uses in executing the estimation
procedure, such as the integration method, the number of nodes, and convergence criteria.
Specifying these conditions allows an application to control the trade-off between
precision and response time for models with many student model variables or many
response categories for the observable variables.
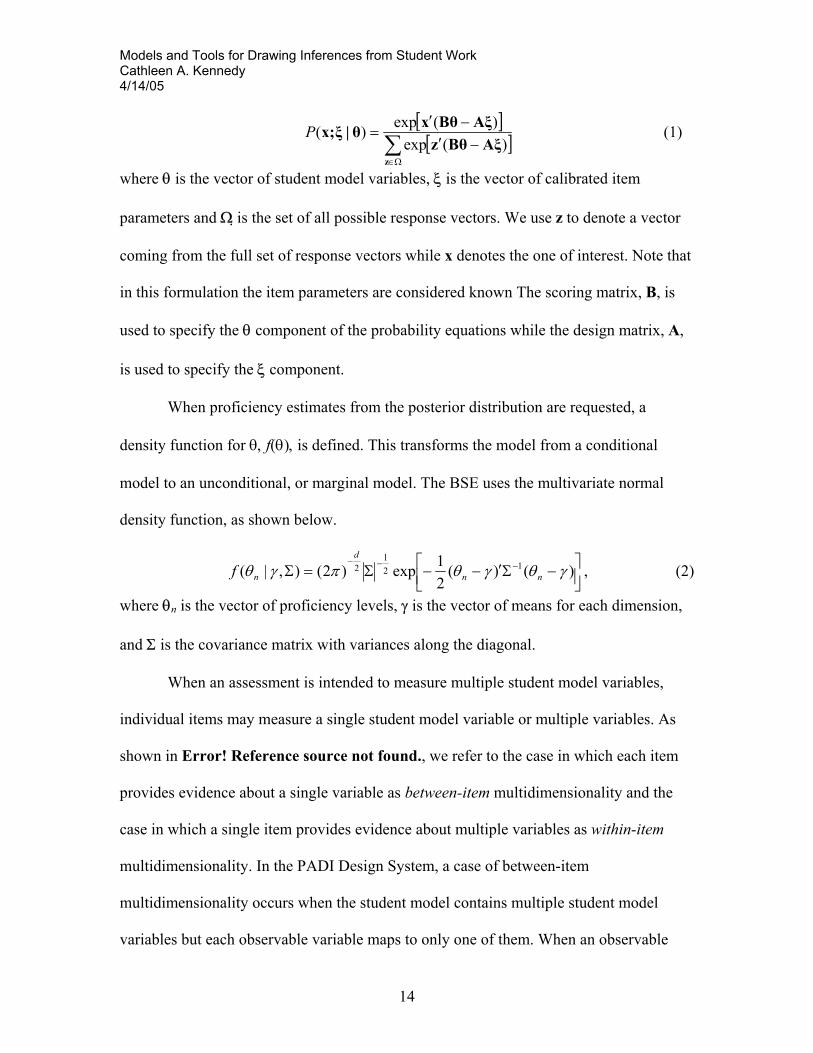
PADI measurement models describe response probability equations by defining a
scoring matrix to associate items to student model variables, a design matrix to associate
items to item parameters, and calibrated item parameters. The general MRCML
formulation for the probability of a response vector, x, is
BEAR Scoring Engine
Student Response Data
Scoring Matrix Design Matrix Item Parameters Prior Distribution
Proficiency Estimates Covariance Matrix
XML Input Documents (from Delivery system)
XML Output Document (to Delivery system)
Figure 7. Input and output XML documents to/from the BEAR Scoring Engine.
Models and Tools for Drawing Inferences from Student Work Cathleen A. Kennedy 4/14/05
14
[ ][ ]∑
Ω∈
−′−′
=
zAξBθz
AξBθxθ|ξx;)(exp
)(exp)(P (1)
where θ is the vector of student model variables, ξ is the vector of calibrated item
parameters and Ω is the set of all possible response vectors. We use z to denote a vector
coming from the full set of response vectors while x denotes the one of interest. Note that
in this formulation the item parameters are considered known The scoring matrix, B, is
used to specify the θ component of the probability equations while the design matrix, A,
is used to specify the ξ component.
When proficiency estimates from the posterior distribution are requested, a
density function for θ, f(θ), is defined. This transforms the model from a conditional
model to an unconditional, or marginal model. The BSE uses the multivariate normal
density function, as shown below.
−Σ′−−Σ=Σ −−−
)()(21exp)2(),|( 12
12 γθγθπγθ nn
d
nf , (2)
where θn is the vector of proficiency levels, γ is the vector of means for each dimension,
and Σ is the covariance matrix with variances along the diagonal.
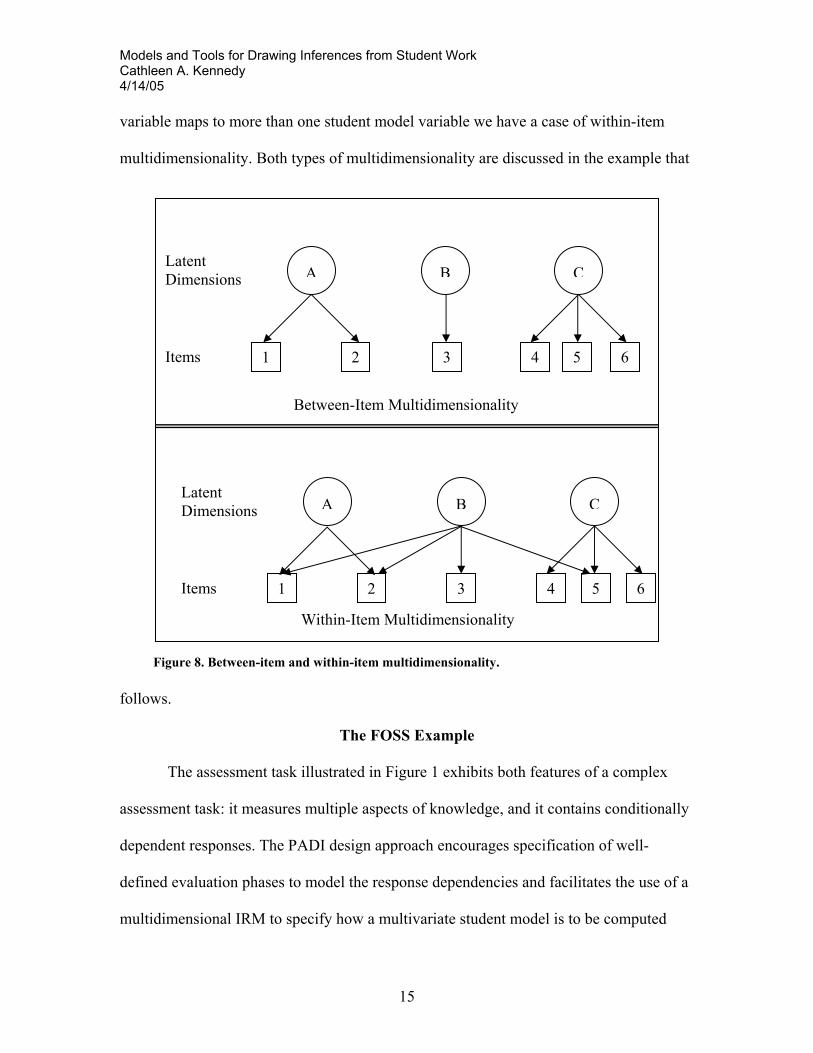
When an assessment is intended to measure multiple student model variables,
individual items may measure a single student model variable or multiple variables. As
shown in Error! Reference source not found., we refer to the case in which each item
provides evidence about a single variable as between-item multidimensionality and the
case in which a single item provides evidence about multiple variables as within-item
multidimensionality. In the PADI Design System, a case of between-item
multidimensionality occurs when the student model contains multiple student model
variables but each observable variable maps to only one of them. When an observable
Models and Tools for Drawing Inferences from Student Work Cathleen A. Kennedy 4/14/05
15
Within-Item Multidimensionality
variable maps to more than one student model variable we have a case of within-item
multidimensionality. Both types of multidimensionality are discussed in the example that
follows.
The FOSS Example
The assessment task illustrated in Figure 1 exhibits both features of a complex
assessment task: it measures multiple aspects of knowledge, and it contains conditionally
dependent responses. The PADI design approach encourages specification of well-
defined evaluation phases to model the response dependencies and facilitates the use of a
multidimensional IRM to specify how a multivariate student model is to be computed
A B CLatent Dimensions
Items 1 2 3 4 6
Between-Item Multidimensionality
5
A B CLatent Dimensions
Items 1 2 3 4 5 6
Figure 8. Between-item and within-item multidimensionality.

Models and Tools for Drawing Inferences from Student Work Cathleen A. Kennedy 4/14/05
16
from the response data. To design this task for representation in the PADI Design
System, the assessment designers began by determining the purpose of the assessment in
which the task would occur. This established the overall student model for the assessment
and for every task included in the assessment. Next, the structure of the evidence
contained in the task was established. This aligned individual parts of the task solution
with one or more of the student model variables contained in the student model. Once the
evidence was specified, the evaluation procedure for transforming student responses into
evidence of knowledge was determined. Finally, the measurement model was defined to
reflect the relationship of the evidence to the student model and to item parameters. This
formalized the inferential process so it could be instantiated in the MRCMLM
computations of the scoring engine. Each step of the design process is explained below
in more detail.
This approach is consistent with the principles and building blocks advanced by
the BEAR Assessment System (Kennedy, 2005a; Wilson, 2005; Wilson & Sloane, 2000).
These principles, and their accompanying building blocks are:
Assessment should be based on a developmental perspective of student learning;
this is associated with the progress variable building block (i.e., the student model
design).
What is taught and what is assessed must be clearly aligned; this is associated
with the items design building block (i.e., the evidence design).
Teachers are the managers and users of assessment data; this is associated with
the outcome space building block (i.e., the evaluation procedure design).
Models and Tools for Drawing Inferences from Student Work Cathleen A. Kennedy 4/14/05
17
Classroom assessment must uphold sound standards of validity and reliability;
this is associated with the measurement model building block.
Design the Student Model
Designers began the process of representing the task (from Figure 1) in PADI
Design System objects by establishing the purpose of the assessment system that the task
belongs to. The complete assessment includes other tasks dealing with Force and Motion,
including tasks involving distance and acceleration. Some assessments are conducted in
the classroom while others are part of an interactive online self-assessment program. The
assessment designers considered a number of options for the purpose of the assessment
and the level of detail. One approach is to produce an overall estimate of a student’s
knowledge about Force and Motion in general. Another is to produce individual estimates
of a student’s knowledge about distance, speed, acceleration, and the use of mathematics
to solve Force and Motion problems. Part of this decision process involves determining
who will use the assessment data, and for what purpose. The designers determined that
the formative assessment data would be used by students in an interactive self-assessment
environment, and by teachers who would gather information about student progress. The
decision was made to produce measures of students’ knowledge about distance, speed
and acceleration (DSA), as one measure, and of students’ knowledge about mathematics
(Math) as a second measure. Thus, after completing a series of assessment tasks, students
and teachers would receive two proficiency estimates, one for DSA and one for Math.
The decision was also made that each assessment task would produce evidence of both
student model variables, with some items focusing on distance, others on speed, and
others on acceleration.
Models and Tools for Drawing Inferences from Student Work Cathleen A. Kennedy 4/14/05
18
Design the Evidence
Once the student model was established, designers considered how the different
parts of the student work generated by this task provided evidence of the student model
variables. The student work was partitioned into five separate response opportunities:
(1) The equation choice;
(2) Filling in the numbers for the equation;
(3) Filling in the units for the numbers for the equation;
(4) Calculating the average speed; and
(5) Filling in the units for the average speed.
Although one might argue that each response required both DSA knowledge and
Math knowledge, the designers decided to initially adopt a simple model in which each
response provided evidence of only one student model variable. Response (4), calculating
the average speed, was considered evidence of Math knowledge, while the other
responses were considered evidence of DSA knowledge.
Design the Evaluation Procedure
Next, the designers considered how the responses would be scored. Again, to
simplify the procedure the designers decided that each response would be scored
dichotomously. Selecting the correct equation would receive a score of 1, while selecting
an incorrect equation would receive a score of 0.
Then, filling in the numbers of the equation, regardless of whether the equation
was correct or not, would be scored as correct or incorrect. In most cases, it was not
possible for students to fill in the equation with correct values when an incorrect equation
was selected because the values were not available in the prompt. However, some
Models and Tools for Drawing Inferences from Student Work Cathleen A. Kennedy 4/14/05
19
students might be able to enter the incorrect equation, do some math in their heads, and
enter correct values into the equation. In order to receive a score of 1, students had to
enter all the values correctly into the equation. For this particular task, students had to
multiply the distance traveled by two to enter a correct numerator, and to add the driving
times together to enter a correct denominator.
Next, the units the student entered in the equation were scored. If both the units
for the numerator and for the denominator were entered correctly, the response received a
score of 1, otherwise, it received a score of 0. The mathematical calculation was to be
evaluated next. A correct calculation, despite selecting an incorrect equation or entering
incorrect values, would receive a score of 1, while incorrect calculations would receive a
score of 0. Finally, the units entered with the answer would be evaluated. If they were
completely correct, the response would receive a score of 1, otherwise it would receive a
score of 0.
At this point, the designers considered how to handle the dependencies among the
responses. Only the DSA responses were dependent, since the mathematical calculation
was evaluated on its computational accuracy, regardless of whether the equation or the
values were correct. The designers decided to produce one DSA score from the four
DSA-related responses. Thus, the task would generate one DSA score and one Math
score. We refer to this procedure of combining several response scores into a single new
score as “item bundling” (Hoskens & deBoeck, 1997; Wang, Wilson & Cheng, 2000;
Wilson & Adams, 1995). Only the new “bundled” DSA score is used by the scoring
engine to produce proficiency estimates. This approach takes the conditional
Models and Tools for Drawing Inferences from Student Work Cathleen A. Kennedy 4/14/05
20
dependencies into account without violating the assumption of item independence
required by the MRCMLM implemented in the BEAR Scoring Engine.
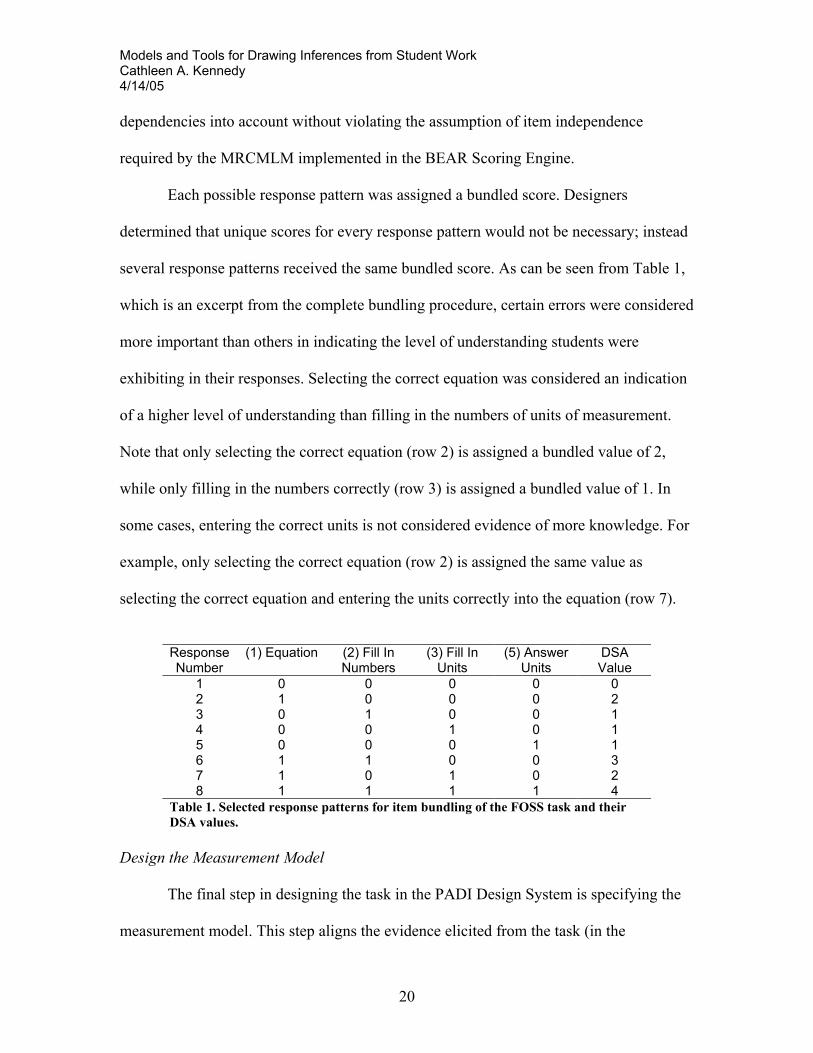
Each possible response pattern was assigned a bundled score. Designers
determined that unique scores for every response pattern would not be necessary; instead
several response patterns received the same bundled score. As can be seen from Table 1,
which is an excerpt from the complete bundling procedure, certain errors were considered
more important than others in indicating the level of understanding students were
exhibiting in their responses. Selecting the correct equation was considered an indication
of a higher level of understanding than filling in the numbers of units of measurement.
Note that only selecting the correct equation (row 2) is assigned a bundled value of 2,
while only filling in the numbers correctly (row 3) is assigned a bundled value of 1. In
some cases, entering the correct units is not considered evidence of more knowledge. For
example, only selecting the correct equation (row 2) is assigned the same value as
selecting the correct equation and entering the units correctly into the equation (row 7).
Response Number
(1) Equation (2) Fill In Numbers
(3) Fill In Units
(5) Answer Units
DSA Value
1 0 0 0 0 0 2 1 0 0 0 2 3 0 1 0 0 1 4 0 0 1 0 1 5 0 0 0 1 1 6 1 1 0 0 3 7 1 0 1 0 2 8 1 1 1 1 4
Table 1. Selected response patterns for item bundling of the FOSS task and their DSA values.
Design the Measurement Model
The final step in designing the task in the PADI Design System is specifying the
measurement model. This step aligns the evidence elicited from the task (in the

Models and Tools for Drawing Inferences from Student Work Cathleen A. Kennedy 4/14/05
21
evaluation procedure) with the student model and with item parameters so that
proficiency estimates can ultimately be computed by a scoring engine. A measurement
model is defined for a particular scoring engine. We note that the PADI Design System is
an extensible system, so users who wish to implement other scoring engines could do so
by modifying the structure of the measurement model, or in some cases, by ignoring
attributes that are not needed.
Designers who plan to implement the BEAR Scoring Engine must define a
scoring matrix, a design matrix, and a vector of calibrated parameters. In many cases, the
scoring and design matrices generated automatically by the PADI Design System may be
sufficient. In other cases, users can specify theses matrices. Describing general principles
for the construction of these matrices is beyond the scope of this paper. We refer the
reader to Constructing Measurement Models for MRCML Estimation: A Primer for Using
the BEAR Scoring Engine (Kennedy, 2005b) for more information.
The evaluation procedure described above produced two final observable
variables, the bundled DSA score and the Math score. Because these are the only values
that will be used by the BSE to compute proficiency estimates, these are the only ones
that require measurement models. Each observable variable that is to be transmitted to the
scoring engine requires an associated measurement model. One measurement model for
this task is associated with the DSA observable variable and another is associated with
the Math observable variable.
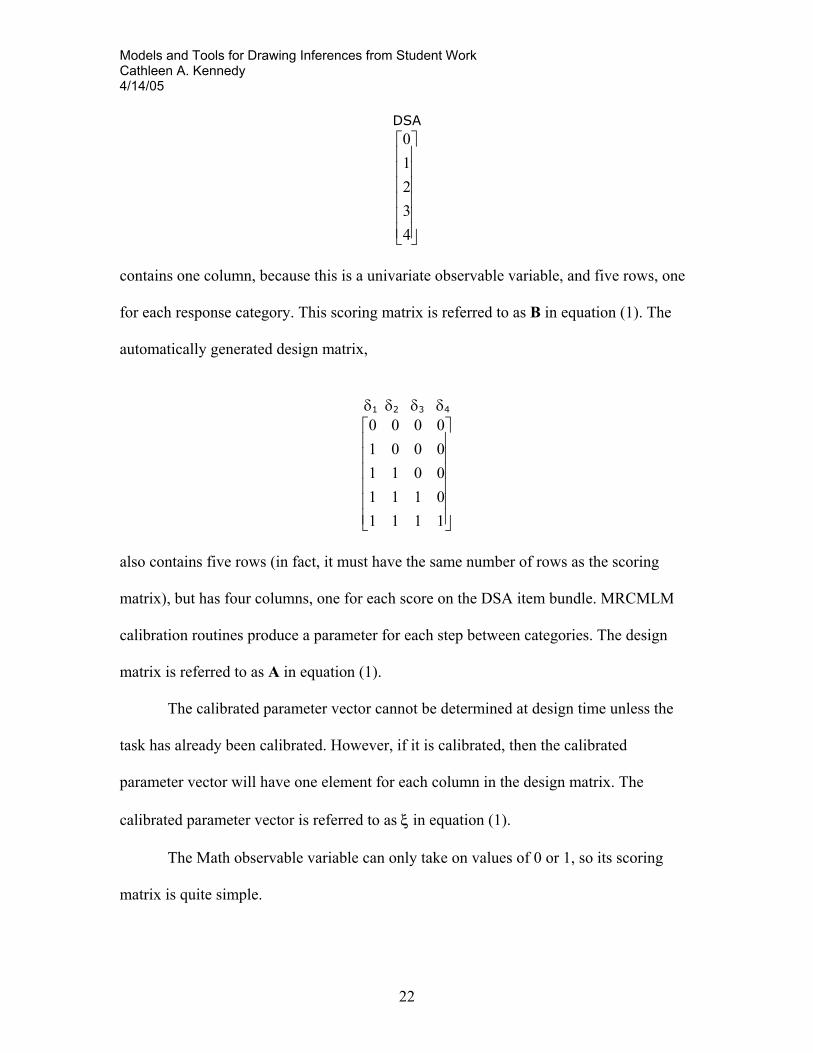
The DSA observable variable can be any integral value from 0 to 4, and this value
is only considered evidence of the DSA student model variable. The automatically
generated scoring matrix,
Models and Tools for Drawing Inferences from Student Work Cathleen A. Kennedy 4/14/05
22
DSA
43210
contains one column, because this is a univariate observable variable, and five rows, one
for each response category. This scoring matrix is referred to as B in equation (1). The
automatically generated design matrix,
δ1 δ2 δ3 δ4
11110111001100010000
also contains five rows (in fact, it must have the same number of rows as the scoring
matrix), but has four columns, one for each score on the DSA item bundle. MRCMLM
calibration routines produce a parameter for each step between categories. The design
matrix is referred to as A in equation (1).
The calibrated parameter vector cannot be determined at design time unless the
task has already been calibrated. However, if it is calibrated, then the calibrated
parameter vector will have one element for each column in the design matrix. The
calibrated parameter vector is referred to as ξ in equation (1).
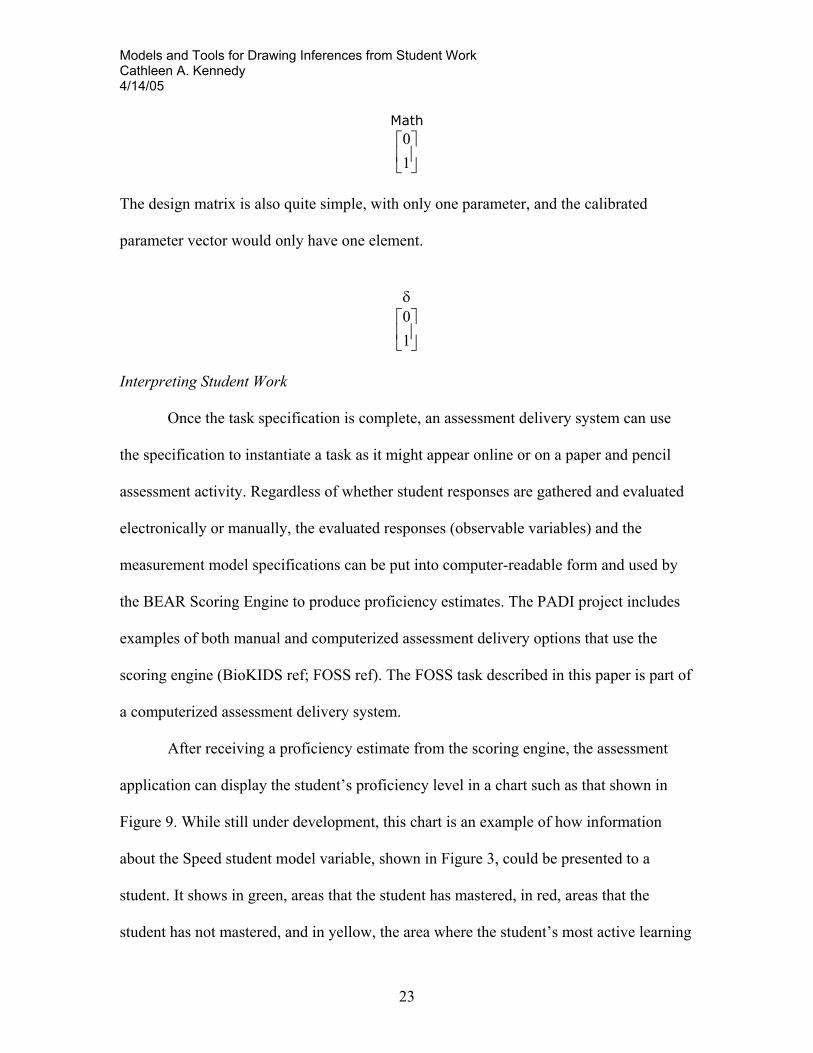
The Math observable variable can only take on values of 0 or 1, so its scoring
matrix is quite simple.
Models and Tools for Drawing Inferences from Student Work Cathleen A. Kennedy 4/14/05
23
Math
10
The design matrix is also quite simple, with only one parameter, and the calibrated
parameter vector would only have one element.
δ
10
Interpreting Student Work
Once the task specification is complete, an assessment delivery system can use
the specification to instantiate a task as it might appear online or on a paper and pencil
assessment activity. Regardless of whether student responses are gathered and evaluated
electronically or manually, the evaluated responses (observable variables) and the
measurement model specifications can be put into computer-readable form and used by
the BEAR Scoring Engine to produce proficiency estimates. The PADI project includes
examples of both manual and computerized assessment delivery options that use the
scoring engine (BioKIDS ref; FOSS ref). The FOSS task described in this paper is part of
a computerized assessment delivery system.
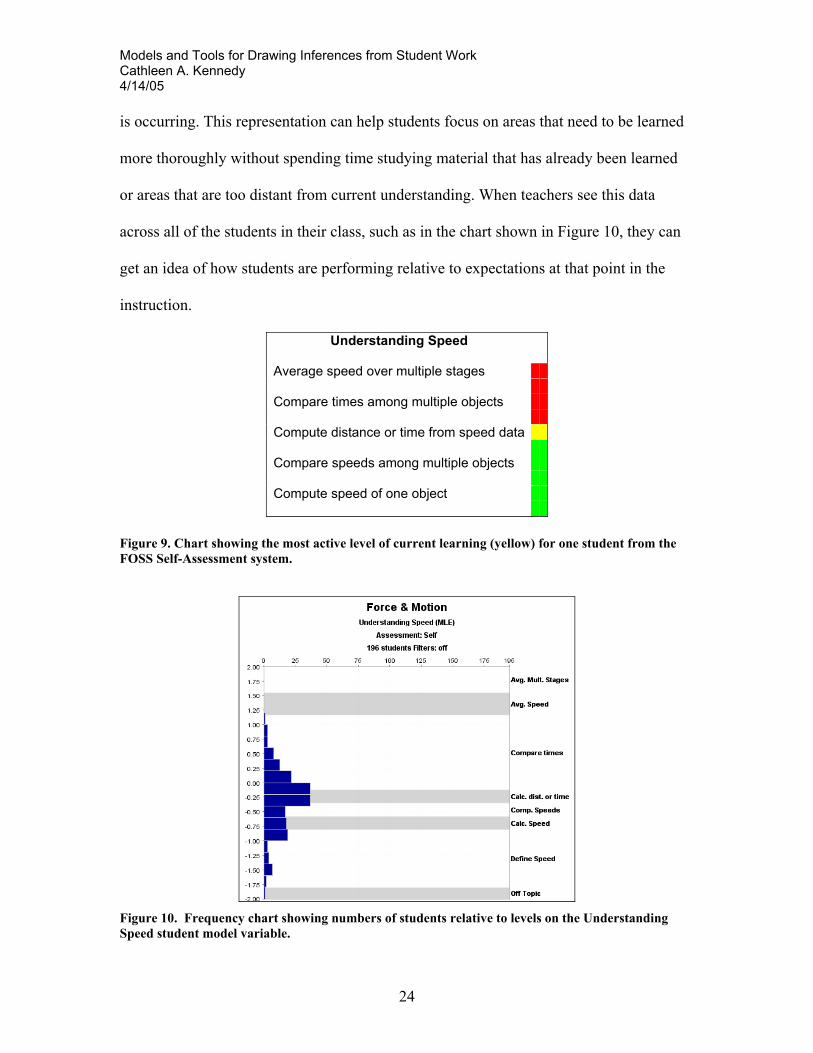
After receiving a proficiency estimate from the scoring engine, the assessment
application can display the student’s proficiency level in a chart such as that shown in
Figure 9. While still under development, this chart is an example of how information
about the Speed student model variable, shown in Figure 3, could be presented to a
student. It shows in green, areas that the student has mastered, in red, areas that the
student has not mastered, and in yellow, the area where the student’s most active learning
Models and Tools for Drawing Inferences from Student Work Cathleen A. Kennedy 4/14/05
24
is occurring. This representation can help students focus on areas that need to be learned
more thoroughly without spending time studying material that has already been learned
or areas that are too distant from current understanding. When teachers see this data
across all of the students in their class, such as in the chart shown in Figure 10, they can
get an idea of how students are performing relative to expectations at that point in the
instruction.
Understanding Speed
Average speed over multiple stages Compare times among multiple objects Compute distance or time from speed data Compare speeds among multiple objects Compute speed of one object
Figure 9. Chart showing the most active level of current learning (yellow) for one student from the FOSS Self-Assessment system.
Figure 10. Frequency chart showing numbers of students relative to levels on the Understanding Speed student model variable.
Models and Tools for Drawing Inferences from Student Work Cathleen A. Kennedy 4/14/05
25
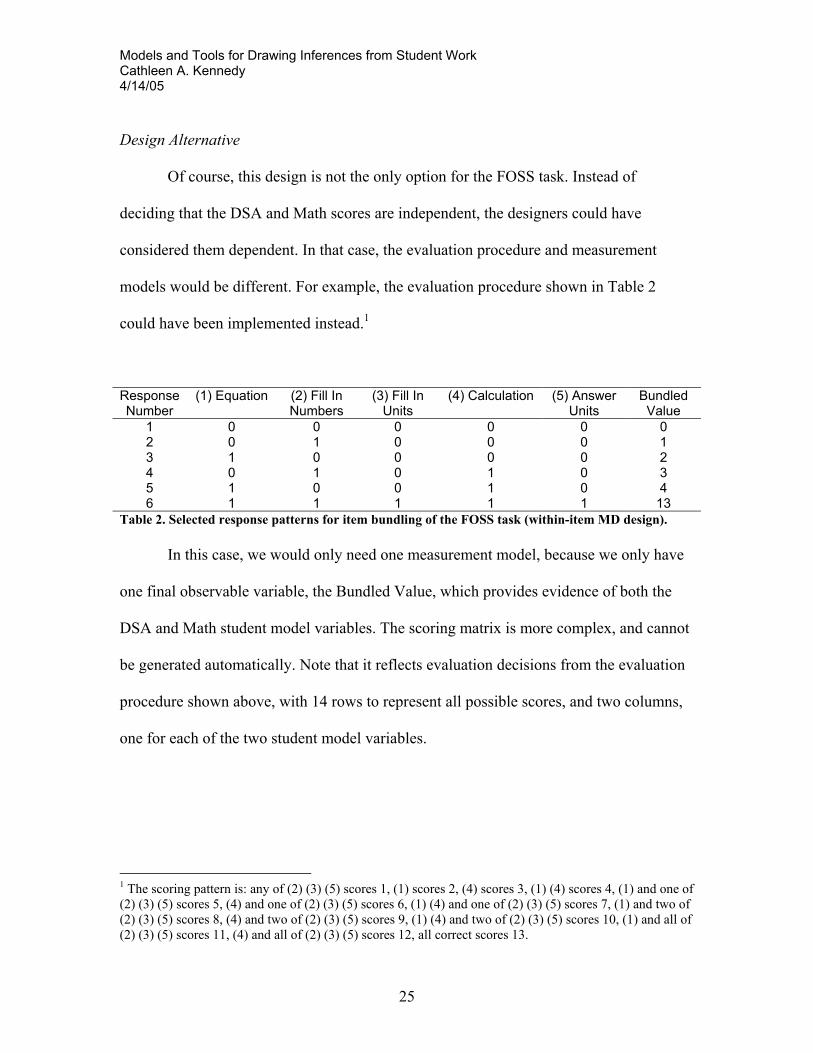
Design Alternative
Of course, this design is not the only option for the FOSS task. Instead of
deciding that the DSA and Math scores are independent, the designers could have
considered them dependent. In that case, the evaluation procedure and measurement
models would be different. For example, the evaluation procedure shown in Table 2
could have been implemented instead.1
Response Number
(1) Equation (2) Fill In Numbers
(3) Fill In Units
(4) Calculation (5) Answer Units
Bundled Value
1 0 0 0 0 0 0 2 0 1 0 0 0 1 3 1 0 0 0 0 2 4 0 1 0 1 0 3 5 1 0 0 1 0 4 6 1 1 1 1 1 13
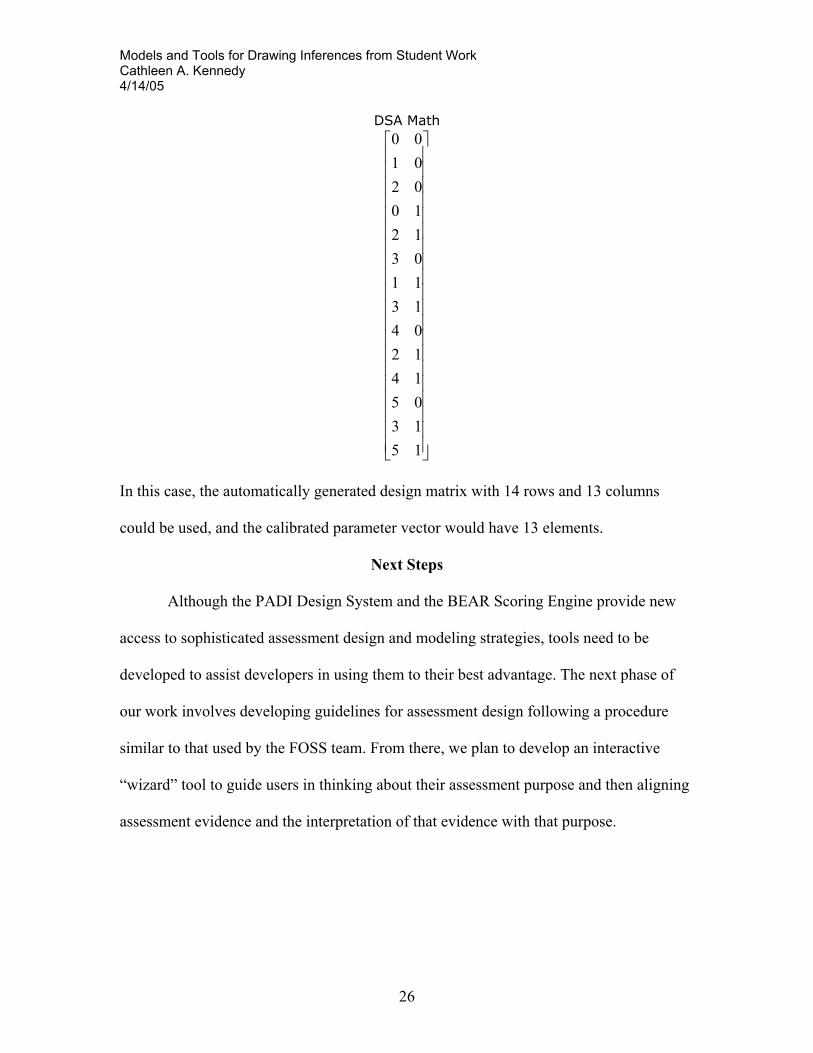
Table 2. Selected response patterns for item bundling of the FOSS task (within-item MD design). In this case, we would only need one measurement model, because we only have
one final observable variable, the Bundled Value, which provides evidence of both the
DSA and Math student model variables. The scoring matrix is more complex, and cannot
be generated automatically. Note that it reflects evaluation decisions from the evaluation
procedure shown above, with 14 rows to represent all possible scores, and two columns,
one for each of the two student model variables.
1 The scoring pattern is: any of (2) (3) (5) scores 1, (1) scores 2, (4) scores 3, (1) (4) scores 4, (1) and one of (2) (3) (5) scores 5, (4) and one of (2) (3) (5) scores 6, (1) (4) and one of (2) (3) (5) scores 7, (1) and two of (2) (3) (5) scores 8, (4) and two of (2) (3) (5) scores 9, (1) (4) and two of (2) (3) (5) scores 10, (1) and all of (2) (3) (5) scores 11, (4) and all of (2) (3) (5) scores 12, all correct scores 13.
Models and Tools for Drawing Inferences from Student Work Cathleen A. Kennedy 4/14/05
26
DSA Math
1513051412041311031210020100
In this case, the automatically generated design matrix with 14 rows and 13 columns
could be used, and the calibrated parameter vector would have 13 elements.
Next Steps
Although the PADI Design System and the BEAR Scoring Engine provide new
access to sophisticated assessment design and modeling strategies, tools need to be
developed to assist developers in using them to their best advantage. The next phase of
our work involves developing guidelines for assessment design following a procedure
similar to that used by the FOSS team. From there, we plan to develop an interactive
“wizard” tool to guide users in thinking about their assessment purpose and then aligning
assessment evidence and the interpretation of that evidence with that purpose.
Models and Tools for Drawing Inferences from Student Work Cathleen A. Kennedy 4/14/05
27
References
Adams, R., Wilson, M. & Wang, W. (1997). The multidimensional random coefficients
multinomial logit model. Applied Psychological Measurement, 21(1), 1-23. Almond, R.G., Steinberg, L.S., & Mislevy, R.J. (2002). A four-process architecture for
assessment delivery with connections to assessment design. Journal of Technology, Learning and Assessment, 1(5).
Embretson, S. E. (1996). The new rules of measurement. Psychological Assessment, (8)
4. p. 341-349. Hoskens, M., & De Boeck, P. (1997). A parameteric model for local dependence among
test items. Psychological methods, 2, 261-277. Kennedy, C. A. (2005a). The BEAR assessment system: A Brief summary for the
classroom context. BEAR Technical Report Series 2005-03-01. Berkeley, CA: Berkeley Evaluation & Assessment Research Center.
Kennedy, C. A. (2005b). Constructing Measurement Models for MRCML Estimation: A
Primer for Using the BEAR Scoring Engine. BEAR Technical Report Series 2005-04-02. Berkeley, CA: Berkeley Evaluation & Assessment Research Center.
National Research Council. (2001). Knowing What Students Know. Committee on the
foundations of assessment. J.W. Pellegrina, N. Chudowsky, R. Glaser (Eds.) Washington, D.C.:National Academy Press.
Rasch, G. (1960). Probabilistic models for some intelligence and attainment tests.
Copenhagen: Danish Institute for Educational Research. Wang, W., Wilson, M. & Cheng, Y. (2000). Local Dependence between Latent Traits
when Common Stimuli are Used. Paper presented at the International Objective Measurement Workshop, New Orleans, LA.
Wilson, M. (2005). Constructing Measures: An Item Response Modeling Approach.
Mahwah, NJ: Erlbaum. Wilson, M. (1992) The ordered partition model: An extension of the partial credit model.
Applied Psychological Measurement. 16 (3). 309-325. Wilson, M. & Adams R.J., (1995). Rasch models for item bundles. Psychometrika, 60,
181-198. Wilson, M. & Sloane, K. (2000). From principles to practice: An embedded assessment
system. Applied Measurement in Education, 13(2), 181-208.

Models and Tools for Drawing Inferences from Student Work Cathleen A. Kennedy 4/14/05
28
Wright, B. D. (1993). Equitable test equating. Rasch Measurement Transactions (7) 2. p.
298-9. Wright, B. D. (1977). Solving measurement problems with the Rasch model. Journal of
Educational Measurement 14. 97-116. Wright, B. D. (1968). Sample-free test calibration and person measurement. Pages 85-
101 in Proceedings of the 1967 Invitational Conference on Testing. Princeton, NJ: Educational Testing Service.
University of California at Berkeley, Lawrence Hall of Science. (2005). Full Option
Science System: FOSS Middle School Force and Motion Course. NH: Delta Education