Modelling the impact of temperature on microalgae productivity … · 2019. 9. 23. · biofuel...
23
Copyright is owned by the Author of the thesis. Permission is given for a copy to be downloaded by an individual for the purpose of research and private study only. The thesis may not be reproduced elsewhere without the permission of the Author.
Transcript of Modelling the impact of temperature on microalgae productivity … · 2019. 9. 23. · biofuel...

Copyright is owned by the Author of the thesis. Permission is given for a copy to be downloaded by an individual for the purpose of research and private study only. The thesis may not be reproduced elsewhere without the permission of the Author.

Modelling the impact of temperature on microalgae
productivity during outdoor cultivation
A thesis presented in partial fulfilment of the requirements for the degree of
Doctor of Philosophy
in Environmental Engineering
at Massey University, Palmerston North, New Zealand.
Quentin Béchet
2014

ii

iii
Abstract
Accurate predictions of algal productivity during outdoor cultivation are critically needed to
assess the economic feasibility and the environmental impacts of full-scale algal cultivation.
The literature shows that current estimations of full-scale productivities are mainly based on
experimental data obtained during lab-scale experiments conducted under conditions poorly
representative of outdoor conditions. In particular, the effect of temperature variations on
algal productivity is often neglected. The main objective of this thesis was to develop a model
able to predict algal productivity under the dynamic conditions of temperature and light
representative of full-scale cultivation. In a first step, models were developed to predict broth
temperature as a function of climatic, operational, and design parameters. The model
developed for open ponds could predict temperature at an accuracy of ±2.6oC when assessed
against experimental data collected in New Zealand over one year. The temperature model
developed for closed photobioreactors was accurate at ±4.3oC when compared to
experimental data collected in Singapore and New Zealand over a total of 6 months of
cultivation. This second temperature model was then applied at different climatic locations to
demonstrate that actively controlling temperature would seriously threaten the economics and
sustainability of full-scale cultivation in photobioreactors.
To quantify the impact of temperature variations on biomass productivity, a productivity
model was developed using Chlorella vulgaris as a representative commercial species. To
determine the best methodology, a review of more than 40 models described in the literature
revealed that an approach accounting for light gradients combined with an empirical function
of temperature for photosynthesis and first-order kinetics for respiration would offer the most
pragmatic compromise between accuracy and complexity. The model was parameterized
using short-term indoor experiments and subsequently validated using independent bench-
scale indoor (> 160 days) and pilot-scale outdoor (> 140 days) experiments, showing
prediction accuracies of ± 13%. The outdoor data set was obtained from 13 different
experiments performed in 4 different reactors operated under various regimes and climatic
conditions. The productivity model was found to be accurate enough to significantly refine
previous assessments of the economics and the environmental impacts of full-scale algal
cultivation.
iv
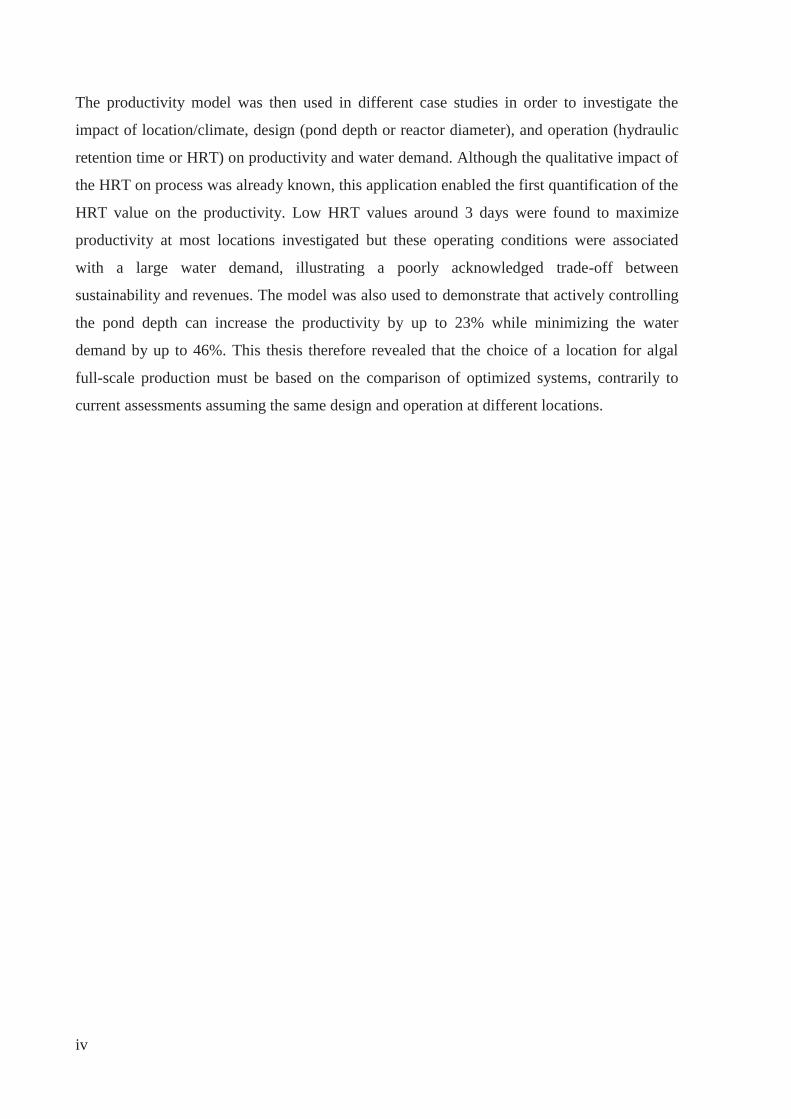
The productivity model was then used in different case studies in order to investigate the
impact of location/climate, design (pond depth or reactor diameter), and operation (hydraulic
retention time or HRT) on productivity and water demand. Although the qualitative impact of
the HRT on process was already known, this application enabled the first quantification of the
HRT value on the productivity. Low HRT values around 3 days were found to maximize
productivity at most locations investigated but these operating conditions were associated
with a large water demand, illustrating a poorly acknowledged trade-off between
sustainability and revenues. The model was also used to demonstrate that actively controlling
the pond depth can increase the productivity by up to 23% while minimizing the water
demand by up to 46%. This thesis therefore revealed that the choice of a location for algal
full-scale production must be based on the comparison of optimized systems, contrarily to
current assessments assuming the same design and operation at different locations.

v
Preface
In the 90s, the terrestrial plant Jatropha curcus was considered as a prime candidate for
biofuel production. For example, Foidl et al. (1996) concluded that “for developing countries
[…] Jatropha curcus seems to be a very promising energy plant. The plant can be grown on
very poor soil and gives a high yield of seeds”. Driven by these initial observations, the
cultivation of Jatropha was encouraged by India and China on a large scale. In 2008, Jatropha
was cultivated on 900,000 hectares of land (Kant and Wu, 2011). However, the actual
productivities were far below expectations, for reasons that Kant and Wu (2011) qualified as
“nothing out of the ordinary and [which] should have been anticipated”. Indeed, the initial
studies were carried under conditions that did not represent full-scale cultivation conditions.
In particular, even if Jatropha can survive in a dry environment, the seed production only
happens when the plant is cultivated in wet and warm conditions that are often not met on
marginal lands (Weyerhaeuser et al., 2007).
With the same objective to replace fossil fuels with sustainable fuels, microalgae received the
same enthusiasm than Jatropha two decades earlier. For example, Chisti (2008) claimed that
“biodiesel from microalgae seems to be the only renewable biofuel that has the potential to
completely displace petroleum-derived transport fuel without adversely affecting supply of
food and other crop products.” Similar claims were made by Leite et al. (2013): “The
production of biofuels using microalgae is promising since of all photosynthetic organisms
they have the highest growth rates, and they can be cultivated using non-arable land with
wastewater as a source of nutrients.” However, the assessments of the biofuel production from
microalgae are based on observations in indoor laboratories where algae were cultivated
under ideal conditions that do not represent full-scale conditions. Moving to full-scale algal
cultivation for biofuel production may therefore lead to reproduce the “extraordinary collapse
of Jatropha” denounced by Kant and Wu (2011). This is the main motivation for the work
undertaken in this thesis.

vi

vii
Acknowledgments
First, I want to sincerely thank my main supervisor Professor Benoit Guieysse for his great
supervision, his guidance, and his endless flow of ideas. Benoit’s humility and never-ending
enthusiasm have been a constant inspiration during all my PhD. I would also like to
acknowledge and thank my co-supervisor Professor Andy Shilton for his excellent advice, his
wise management and his patience, especially with regard to my English writing skills. I am
very thankful to Benoit and Andy for treating me as one of their peers in spite of my tendency
to constantly disagree with them.
Many thanks to all the staff at Massey; in particular, Ann-Marie Jackson was extremely
patient despite of the fact I was sometimes a “difficult child”. I will also always remember all
the working sessions with John Edwards who, among other things, taught me to properly use
a screwdriver. Many thanks also to Julia Good for her help which always came with a smile,
Judy Farrand-Collins, Anthony Wade, Bruce Collins, John Sykes, and all the team of the
SEAT workshop (Kerry Griffiths, Ian Thomas, and Clive Davis). A special attention goes to
Guillaume Guizard (LBE, Narbonne) who showed me the crucial importance of designing
properly experimental set-ups. I also would like to thank Glenda Rosoman, Fiona Falconer
and Linda Lowe for their extremely efficient and always friendly help with the administrative
aspects of my PhD.
I wish also to thank Oliver Fringer (Stanford University, California) and the National
Technological University of Singapore for contributing to preliminary work of this PhD. I
also would like to thank Filipa Lopes and Arsène Isembert for welcoming me to the reputed
LGPM laboratory of Ecole Centrale Paris in 2010. Many thanks also go to Olivier Bernard
who allowed me to enjoy the outstanding working conditions of the LOV laboratory (France)
in 2011. NIWA (Hamilton, New Zealand) and the LBE (Narbonne, France) must also be
acknowledged for their assistance for providing data for model validation.
I wish to thank Massey University for their financial support through the Massey University
Doctoral Scholarship.
Many thanks go to my PhD colleagues who shared with me the joys of the PhD thesis (in
particular Matthew Chung, Maxence Plouviez, Zane Norvill, and Roland Schaap). I will also
keep in my memory all the interns who came to share our enthusiasm for research. In

viii
particular I wish to thank Laura Etienne, Ivan Feurgard, Nicolas Dumont, Paul
Chambonnière, Alexandre Camuel, and Mégan Trémelot who accepted me as an
unexperienced supervisor.
I am very thankful to all my friends and my partner for their support during my PhD. Finally,
I could never express enough the gratitude to my mother and my father for their limitless trust
and their continuous support.

ix
Table of contents
Abstract iii
Preface v
Acknowledgments vii
List of illustrations xiii
List of Tables xvii
Structure of the thesis xix
List of Articles and contribution xxi
Thesis Introduction 1
Chapter 1: Literature review 5
1.1. Introduction 6
1.2. The effect of light and temperature on algal productivity at the cell level 8
1.2.1. The PI relationships 8
1.2.2. Effect of temperature on photosynthesis and respiration 10
1.3. Current modelling approaches to predict algal productivity 12
1.3.1. Predicting productivity at full-scale: challenges 12
1.3.2. Modelling algal productivity: state of the art 13
1.3.3. Modelling the effect of light on photosynthesis 15
1.3.4. Modelling light distribution in dense cultures 18
1.3.5. Modelling the effect of temperature on photosynthesis 19
1.3.6. Modelling day-time and night-time respiration 21
1.3.7. Conclusions on the modelling approach used in this thesis to predict algal
productivity at full-scale 22
1.4. Practical issues during model development 24
1.5. Conclusions on the modelling approach followed in this thesis 26
x
Chapter 2: Cultivation systems and methods 27
2.1. Cultivation systems 28
2.1.1. Open ponds 28
2.1.2. Closed photobioreactors 30
2.2. Cultivation conditions 32
2.3. Algae species 33
2.4. Algal productivity and experimental measurement 33
2.5. Simulations 34
Chapter 3: Temperature models 35
3.1. Introduction 36
3.2. Literature review on temperature models 37
3.2.1. Heat flows reaching open water bodies 37
3.2.2. Modelling free-surface evaporation 40
3.3. Temperature model in open ponds 42
3.3.1. Heat balance in open ponds 42
3.3.2. List of parameters 44
3.3.3. Accuracy of the temperature model for open ponds 45
3.3.4. Theoretical expressions against empirical expressions in the temperature model
for open ponds 48
3.4. Temperature models in closed photobioreactors 51
3.4.1. Heat balance in photobioreactors 51
3.4.2. List of variables and parameters 54
3.4.3. Accuracy of the temperature model for photobioreactors 56
3.4.4. Refinement of the temperature model for photobioreactors 59
3.4.5. Comparison of the original and refined versions of the temperature model for
photobioreactors 60
3.4.6. Temperature control in closed photobioreactors 61
Chapter 4: Productivity model 65
4.1. Introduction 66

xi
4.2. Mathematical expression of the productivity model 67
4.3. Determination of the model kinetic parameters 68
4.3.1. Experimental device used to determine kinetic parameters 68
4.3.2. Light distribution in the device vessels 70
4.3.3. Expressing the local rate of photosynthesis as a function of local light intensity 71
4.3.4. Values of the model parameters K and Pm at different temperatures 74
4.3.5. Rates of night-time and day-time respiration 77
4.3.6. Conversion from oxygen production rates to biomass productivities 79
4.3.7. Summary of equations of the productivity model 80
4.3.8. Application of the productivity model to full-scale cultivation systems 81
4.4. Application of the productivity model to full-scale cultivation systems: Scale-up 83
4.5. Productivity model validation using bench-scale indoor reactors 84
4.5.1. Bench-scale reactors used for productivity model validation 84
4.5.2. Comparison between predicted and measured productivities in the bench-scale
reactors 86
4.6. Validation of the productivity model in outdoor photobioreactors 90
4.6.1. Outdoor pilot-scale photobioreactors used for model validation 90
4.6.2. Comparison of predicted and measured productivities in the outdoor reactors 92
4.7. What level of accuracy is required to make the productivity model fit for the
purpose of assessing the economics and environmental impacts of full-scale algal
cultivation? 98
4.8. The need for temperature modelling for accurate productivity predictions 100
4.9. Conclusions 104
Chapter 5: Engineering applications 105
5.1. Introduction 106
5.2. Methodology followed in the case-studies 108
5.2.1. Calculation of the yearly water demand 108
5.2.2. Calculation of the yearly algal productivity 109
5.2.3. Specific assumptions for closed photobioreactors 110
5.2.4. Specific assumptions for open ponds 111

xii
5.3. Photobioreactors - optimization of full-scale algal cultivation 112
5.3.1. Impact of climatic conditions on productivity and water demand in closed
photobioreactors 112
5.3.2. Impact of the hydraulic retention time on productivity and water demand in
closed photobioreactors 113
5.3.3. Impact of reactor radius on peak temperatures 115
5.3.4. The need for temperature-tolerant species in the arid and Mediterranean locations
116
5.4. Open ponds: optimization of full-scale algal cultivation 117
5.4.1. Impact of location on productivity and water demand in open ponds 117
5.4.2. Impact of HRT on the productivity and water demand in open ponds 119
5.4.3. Influence of the depth on productivity and water demand in open ponds 120
5.4.4. Optimization of process by active control of the pond depth 122
5.5. Conclusions 126
Thesis conclusions 127
References 131
Appendix A: Modelling the light distribution and algal productivity in outdoor open ponds –
Calculation details 145
A.1. Introduction 146
A.2. Modelling the light distribution in outdoor open ponds 147
A.2.1. Direct radiation 147
A.3. Diffuse radiation 148
A.4. Total productivity in the pond 149
A.5. Numerical implementation 150
A.6. Verification of the equations 151
A.6.1. Light distribution 151
A.6.2. Conservation laws 151
A.6.3. Case of high K values 152
A.6.4. Evolution of the productivity with the extinction coefficient σ 153
A.6.5. Evolution of the productivity with X 154

xiii
List of illustrations
Figure 1.1: Typical PI relationship showing the light-limited (I < Ik), light-saturated (Ik < I <
Iinhib), and light-inhibited (I > Iinhib) regimes of microalgae light response – Extracted from
Article 1. ..................................................................................................................................... 8
Figure 1.2: Summary of the different categories of models (I: light intensity; T: temperature;
RD: rate of day-time respiration; μ: specific rate of photosynthesis; X: algal concentration; ζ:
proportionality constant; RN: rate of night-time maintenance; λ: maintenance coefficient) –
Extracted from Article 1. .......................................................................................................... 23
Figure 2.1: Open raceway ponds used for the validation of the temperature model – NIWA,
Hamilton, New Zealand. ........................................................................................................... 29
Figure 2.2: Key characteristics of open ponds. ....................................................................... 29
Figure 2.3: Quentin Béchet operating a vertical cylindrical photobioreactor used for model
validation. ................................................................................................................................. 31
Figure 2.4: Meteorological conditions at the five climatic locations used in the different case
studies in this thesis (yearly averages). .................................................................................... 34
Figure 3.1: Different heat flows reaching an open pond. ........................................................ 42
Figure 3.2: Specific inputs necessary for the prediction of temperature in an open pond. ..... 44
Figure 3.3: Predicted (blue line) and measured (red crosses) temperature profile in the high-
rate algal pond in Hamilton (New Zealand) over the month of January 2009 – Extracted from
Article 2. ................................................................................................................................... 46
Figure 3.4: Changes in heat fluxes (annual average) reaching the high rate algal pond. The
thick plain line represents the total heat flux. The value of each heat flux at time t was
computed as the average of the heat flux over the year at this time – Extracted from Article 2.
.................................................................................................................................................. 47
Figure 3.5: Different heat flows reaching the algae in an outdoor photobioreactor. ............... 51
Figure 3.6: Inputs of the temperature model for closed photobioreactors which are specific to
the location, the reactor geometry and the reactor operation. .................................................. 55
Figure 3.7: Left: Change in experimental (crosses) and predicted (plain line) temperatures
inside a closed photobioreactor on a typical day (August 22, 2008) during outdoor operation
in Singapore. Middle: Meteorological data on the same day. Right: Change in heat flows
reaching the photobioreactor on the same day (the bold line represents the total heat flow) –
Extracted from Article 3. .......................................................................................................... 57
xiv
Figure 3.8: Comparison of experimental and predicted temperatures inside a column
photobioreactor during outdoor cultivation in Singapore – Extracted from Article 3. ............ 58
Figure 3.9: Amount of energy and water equivalent necessary to maintain a closed
photobioreactor at or below 35oC. ........................................................................................... 62
Figure 4.1: Modelling approach to predict algal productivity ................................................ 65
Figure 4.2: A vessel of the device used for model development – Extracted from Article 4. 69
Figure 4.3: Relationship between the extinction coefficient σ and the algal concentration
(plain line). The dash-line represents the confidence interval on σ (see supplementary
information S2 of Article 4 for more details) – Extracted from Article 4. .............................. 71
Figure 4.4: Experimental (dots) and fitted oxygen productivities in the vessels used for model
parameterization (point-line: X = 0.19 kg/m3; plain line: X = 0.43 kg/m3; dash-line: X = 0.64
kg/m3). The error bars represent the levels of confidence at 95% on the measured rates of
photosynthesis and light intensity (see Supplementary Information S6 of Article 4 for details)
- Extracted from Article 4 ........................................................................................................ 73
Figure 4.5: Values of Pm, K, and λ at different temperatures. The error bars represent the 95%
confidence interval determined by Monte-Carlo simulations (see the supplementary
information S6 of Article 4 for details) - Extracted from Article 4. ........................................ 75
Figure 4.6: Pm values vs. K values at different temperatures. The error bars represent the 95%
confidence interval determined by Monte-Carlo simulations (see the supplementary
information S6 of Article 4 for details) – Extracted from Article 4. ........................................ 77
Figure 4.7: Rate of respiration after light exposure vs. rate of photosynthesis – Extracted from
Supplementary information S8 of Article 4. ............................................................................. 79
Figure 4.8: Variables and parameters necessary to determine the productivity in full-scale
open ponds (additional inputs necessary to determine the pond temperature as shown in
Figure 3.2). ............................................................................................................................... 82
Figure 4.9: Variables and parameters necessary to determine the productivity in full-scale
photobioreactors (additional inputs necessary to determine the reactor temperature as shown
in Figure 3.6). ........................................................................................................................... 82
Figure 4.10: Bench-scale reactor used for validation. The reactors were surrounded by 14
light bulbs each, and temperature was controlled by re-circulating water in the double jacket –
Extracted from Article 4. .......................................................................................................... 85
Figure 4.11: Cumulative productivity in the indoor bench-scale reactors operated under
different light intensities and temperatures (blue line: model prediction; blue dash-line:
prediction inaccuracy due to uncertainty of inputs; red crosses: experimental data). The

xv
shaded area represents the period of time when the reactors were operated as batch systems.
The higher cumulative productivities at 20oC are the consequence of the longer cultivation
time at this temperature – Extracted from Article 4. ................................................................ 88
Figure 4.12: Predicted and measured cumulative productivities over the entire experiment.
The higher cumulative productivities at 20oC are the consequence of the longer cultivation
time at this temperature – Extracted from Supplementary information S9 of Article 5. .......... 89
Figure 4.13: Four pilot-scale photobioreactors used for the outdoor validation of the model
(winter 2012) – Extracted from Article 5. ................................................................................ 91
Figure 4.14: Experiment 1 - Cumulative production in the outdoor reactor in fall 2011 (red-
crossed line: experimental data; blue plain line: prediction; blue dash-lines: upper and lower
boundaries of the confidence intervals of the prediction). The grey shaded area represents the
period of time over which the reactor was operated in batch regime – Extracted from Article
5. ............................................................................................................................................... 94
Figure 4.15: Experiment 2 - Cumulative production in the outdoor reactors in summer 2012
(red-crossed line: experimental data; blue plain line: prediction; blue dash-lines: upper and
lower boundaries of the confidence intervals of the prediction). ............................................. 95
Figure 4.16: Experiment 3 - Cumulative production in the outdoor reactors in fall 2012 (red-
crossed line: experimental data; blue plain line: prediction; blue dash-lines: upper and lower
boundaries of the confidence intervals of the prediction). ....................................................... 96
Figure 4.17: Experiment 4 - Cumulated production in the outdoor reactors in winter 2012.
red-crossed line: experimental data; blue plain line: prediction; blue dash-lines: upper and
lower boundaries of the confidence intervals of the prediction. The grey shaded area
represents the period of time over which the reactors were operated in batch regime –
Extracted from Article 5. .......................................................................................................... 97
Figure 4.18: Predicted productivities with temperature control and no temperature control in
closed photobioreactors. The numbers on the blue bars are the number of days per year where
temperature is higher than 42oC in the case of temperature-control. ..................................... 103
Figure 5.1: Different water flows during the operation of an algal cultivation systems (R:
recycling ratio; Qev: evaporation rate (m3/s); Qout: outflow rate (m3/s); Qleaks: leaks rate (m3/s).
................................................................................................................................................ 108
Figure 5.2: Productivity, water demand, and temperature risk factor in photobioreactors at
different climatic locations. .................................................................................................... 112
Figure 5.3: Variation of the productivity in full-scale photobioreactors and associated water
demand with the hydraulic retention time .............................................................................. 114
xvi
Figure 5.4: Effect of the reactor radius on the risk of overheating (“TRF”: Temperature risk
factor, defined in Section 5.2.2). ............................................................................................ 116
Figure 5.5: Productivity, water demand, and temperature risk factor in open ponds at different
climatic locations. .................................................................................................................. 117
Figure 5.6: Correlation between the yearly productivity of open ponds vs. the solar irradiance
(the temperature of a pond located in Hilo, Hawaii was predicted to remain above 10oC all
year long). .............................................................................................................................. 118
Figure 5.7: Influence of the HRT on the productivity and water demand in open ponds. .... 120
Figure 5.8: Productivity and water demand at different climatic locations as a function of
depth. ...................................................................................................................................... 121
Figure 5.9: Occurrence of hot temperature events as a function of the depth ...................... 122
Figure 5.10: Optimized pond depth following the optimization scheme described in
Section 5.4.4 ........................................................................................................................... 123
Figure 5.11: Water demand and productivity during optimized and non-optimized process 125
xvii
List of Tables
Table I.1: Characteristics of recent assessments of full-scale algal cultivation for biofuel
productions. ................................................................................................................................ 2
Table 1.1: Experimental conditions used during algae cultivation performed to generate data
sets used for model development and/or validation (table adapted from Article 1). ................ 14
Table 3.1: Characteristics of models predicting the temperature in systems similar to algal
ponds (Theo.: Theoretically modelled; Emp.: Expression derived from an empirical study:
NA: Not applicable, Neg.: Neglected; From Hs means that the solar heat flux is calculated
from on-site solar irradiance data) – Table extracted from Article 2. ...................................... 39
Table 3.2: Formulas of water evaporation from free water surfaces (Symbols are defined at
the end of the table) – Extracted from Article 2. ...................................................................... 41
Table 3.3: Equations used to express each heat flow in the temperature model for open ponds
– Formulas extracted from Article 2. ....................................................................................... 43
Table 3.4: Accuracy of temperature prediction and water evaporation (annual average) using
models constructed by replacing selected heat flows with alternative expressions used in prior
models – Extracted from Article 2. ........................................................................................... 49
Table 3.5: Expression of the different heat flows reaching the closed photobioreactor –
Formulas were extracted from Article 3................................................................................... 53
Table 3.6: Overall accuracy of temperature predictions by the ‘original’ and ‘refined’
versions of the model (N: Number of data points). .................................................................. 60
Table 4.1: Mathematical formulas of the local rate of photosynthesis (Ploc, in kg O2/m3-s) as a
function of the local light intensity (Iloc, in W/m2), the extinction coefficient σX, and the algal
concentration X (kg/m3). Pm (kg O2/kg-s) represents the maximum specific rate of
photosynthesis and K/σX (W/m2) represents the half-saturating light intensity (the extinction
coefficient σX was determined from Equation 4.4) – Extracted from Article 4. ....................... 72
Table 4.2: Summary of equations in the productivity model .................................................. 80
Table 4.3: Comparison of cultivation conditions in the device used for model development,
the indoor reactors and the outdoor reactors used for model validation. ................................. 83
Table 4.4: Characteristics of the outdoor experiments used for model validation (TC:
temperature-control) – Extracted from Article 5. ..................................................................... 91

xviii
Table 4.5: Error on productivities calculated by dividing the difference between the predicted
and the measured cumulative productivities over the entire period of cultivation. “TC”
indicates temperature control. .................................................................................................. 93
Table 4.6: Characteristics of recent assessments of full-scale algae cultivation for biofuel
productions – Extracted from Article 5. ................................................................................. 101

xix
Structure of the thesis
This thesis is based on six scientific articles attached as appendix at the end of this thesis (four
of which have been published). The content of these articles supports the conclusions
provided in this thesis. To avoid redundancy (especially the description of materials and
methods) or discussion of information not strictly relevant to this thesis (e.g. water footprint
in Article 6), the chapters were organized and written based on the articles rather than from
the articles. Key results and findings are referred to corresponding articles wherever relevant.

xx

xxi
List of Articles and contribution
Article 1: Béchet Q, Shilton A, Guieysse B. 2013. Modelling the effects of light and
temperature on algae growth: State of the art and critical assessment for productivity
prediction during outdoor cultivation. Biotechnology Advances 31(8): 1648-1663. (2012
Impact factor: 9.599; Number of citations1: 5)
Contribution to the article: Q Béchet was the main contributor to the review. In particular, the
classification of productivity models was originally proposed by Q Béchet.
Article 2: Béchet Q, Shilton A, Park JBK, Craggs RJ, Guieysse B. 2011. Universal
temperature model for shallow algal ponds provides improved accuracy. Environmental
Science & Technology 45(8): 3702-3709. (2012 Impact factor: 5.257; Number of citations:
15)
Contribution to the article: Q Béchet was the main contributor to the article. He constructed
and numerically implemented the temperature model. The experimental data used for model
validation were provided by the New Zealand National Institute for Water and Atmospheric
Research (NIWA).
Article 3: Béchet Q, Shilton A, Fringer OB, Muñoz R, Guieysse B. 2010. Mechanistic
modeling of broth temperature in outdoor photobioreactors. Environmental Science &
Technology 44 (6): 2197-2203. (2012 Impact factor: 5.257; Number of citations: 25)
Contribution to the article: Q Béchet was the main contributor to the article. He constructed
and numerically implemented the temperature model. He also collected the experimental data
used for model validation.
Article 4: Béchet Q, Chambonnière P, Shilton A, Guizard G, Guieysse B. Algal productivity
modeling: a step toward accurate assessments of full-scale algal cultivation (submitted).
1 According to Google Scholar Citations on the 02/07/2014
xxii
Contribution to the article: Q Béchet supervised the student P Chambonnière who performed
most of the experimental work for model parameterization and the associated data analysis. Q
Béchet did the experimental work for model validation and associated simulations. He also
wrote most of the article.
Article 5: Béchet Q, Shilton A, Guieysse B. Full-scale validation of a model of algal
productivity (submitted).
Contribution to the article: Q Béchet was the main contributor of the article. He carried the
experimental work and analyzed the results (including the numerical implementation of the
model). He also wrote most of this article.
Article 6: Guieysse B, Béchet Q, Shilton A. 2013. Variability and uncertainty in water
demand and water footprint assessments of fresh algae cultivation based on case studies from
five climatic regions. Bioresource Technology 128: 317–323. (2012 Impact factor: 4.750;
Number of citations: 10)
Contribution to the article: Q Béchet performed the calculations of water demand and water
footprint of algal cultivation in open ponds by using the code he developed for Article 2.
Note: Even if Article 6 discusses the water footprint of algal cultivation, this metric will not
be discussed in this thesis as its relevance is uncertain (see the discussion section of Article 6
for further details). In this thesis, only the water demand will be considered to discuss the
environmental impacts of full-scale cultivation.