Modelling Risk and Safety Systems of Deep Offshore...
16
OTC 14181 Modelling Risk and Safety Systems of Deep Offshore FPSO/Pipeline System K.E, Abhulimen, Chemical Engineering & Polymer, Lagos State University, A.A, Susu, Chemical Engineering, University of Lagos Copyright 2002, Offshore Technology Conference This paper was prepared for presentation at the Offshore Technology Conference held in Houston, Texas, 6-9 May 2002. This paper was selected for presentation by the OTC Program Committee following review of information contained in an abstract submitted by the author(s). Contents of the paper, as presented, have not been reviewed by the offshore Technology Conference and are subject to correction by the author(s). The material, as presented, does not necessary reflect any position of the Offshore Technology Conference or its officers. Electronic reproduction, distribution, or storage of any part of this paper for commercial purpose, without the written consent of the Offshore Technology Conference is prohibited. Permission to reproduce in print is restricted to an abstract of not more than 300 words; illustrations may not be copied. The abstract must contain conspicuous acknowledgement of where and by whom the paper was presented. Abstract This paper presents a model that captures the risk and safety systems of a deep offshore FPSO/Pipeline system. The overall risk and safety function of the FPSO/Pipeline system was hierarchically determined as a universal set of sub risk systems, using a modified fault tree analysis and FMECA (Failure Mode Effect Critical Analysis) to establish the cause of failure and evaluate its potential. The transient state behaviour of the risk and safety systems of the FPSO/Pipeline system was modelled using the markov chain process. The results of simulation of a typical FPSO-Pipeline sub system, shows that a model suitable for analysing the risks and safety behaviour of complex multifunctional FPSO/Pipeline system has been developed. The inclusion of a weighting function in the model to assign a relative importance of a risk or safety event in several interacting risk systems represents an important deviation from other benchmarks. The concept of weighting function relies on the experience of the user to assign different weights to different risks or safety in a given environment. This allows the possibility of evaluating the impact of different risks on the reliability of multifunctional systems Introduction There are many methodologies proposed for reliability, risk and safety analysis for most, if not all process industries known today. Among the most popular ones, are quantitative risk analysis, probabilistic safety analysis, and worst-case methodology for risk assessment and optimal risk analysis. The optimal risk analysis (ORA) appears to be the most suitable, as it is fast, less expensive to implement, less time consuming and more precise than alternative analysis (1, 2). ANSI/ISA S84.01-1996 is the consensus standard for process safety in the U.S, deemed to meet the OSHA 1910.119 PSM regulation (3). Three methodologies are proposed in the TR84.02 report to be published by ISA (4). They are simplified equations, Fault Tree Analysis, and markov modelling to implement the safety performance requirements of the standard, for the SIS. The standard requires that the average probability failure on demand (PFD avg ) be used in this analysis (5,6). Khan, F.I, and S.A Abassi (1) have presented a critical review of these methodologies. While the benefits of these methods have been well demonstrated in many publications, it appears that the development of a model that captures the intrinsic behaviour of the risk and safety systems of typical complex multifunctional system like the FPSO/Pipeline system have not been sufficiently researched. The problems are normally associated with complexity of the interacting components and process hazards that could lead to failure (7). Our paper therefore, presents a model that incorporates the use of a weighting function to capture the complex risk and safety behaviour of the interacting components of the subsystem of typical FPSO/Pipeline system. A common misconception is to assume that a system prone to fewer risks is safe. Risk is not the possibility of danger, as presented in most publications. It is rather an integral part of any system or process, which could be present or absent. A probability model is most time use to express the risk of failure. This method is justified for risk whose causes cannot be ascertain or quantified. Otherwise, a deterministic model with the boundary conditions well defined should be a better measure for risk or safety analysis. Our definition of risk and safety seems therefore necessary at this point. Risk is the presence of danger that has a potential to undermine the integrity of a system (process or a facility). Safety is not the absence of danger, but the presence of immunity that has the potential to contain the risk of failure of a system (process or facility). These definitions are further supported, because it is common knowledge that potentially risky process or asset can be considered safe, if the necessary safety systems are installed to forestall failure. For example, a pipeline known to fail under certain operating corrosion conditions
Transcript of Modelling Risk and Safety Systems of Deep Offshore...

OTC 14181 Modelling Risk and Safety Systems of Deep Offshore FPSO/Pipeline System K.E, Abhulimen, Chemical Engineering & Polymer, Lagos State University, A.A, Susu, Chemical Engineering, University of Lagos Copyright 2002, Offshore Technology Conference This paper was prepared for presentation at the Offshore Technology Conference held in Houston, Texas, 6-9 May 2002. This paper was selected for presentation by the OTC Program Committee following review of information contained in an abstract submitted by the author(s). Contents of the paper, as presented, have not been reviewed by the offshore Technology Conference and are subject to correction by the author(s). The material, as presented, does not necessary reflect any position of the Offshore Technology Conference or its officers. Electronic reproduction, distribution, or storage of any part of this paper for commercial purpose, without the written consent of the Offshore Technology Conference is prohibited. Permission to reproduce in print is restricted to an abstract of not more than 300 words; illustrations may not be copied. The abstract must contain conspicuous acknowledgement of where and by whom the paper was presented.
Abstract This paper presents a model that captures the risk and safety systems of a deep offshore FPSO/Pipeline system. The overall risk and safety function of the FPSO/Pipeline system was hierarchically determined as a universal set of sub risk systems, using a modified fault tree analysis and FMECA (Failure Mode Effect Critical Analysis) to establish the cause of failure and evaluate its potential. The transient state behaviour of the risk and safety systems of the FPSO/Pipeline system was modelled using the markov chain process. The results of simulation of a typical FPSO-Pipeline sub system, shows that a model suitable for analysing the risks and safety behaviour of complex multifunctional FPSO/Pipeline system has been developed. The inclusion of a weighting function in the model to assign a relative importance of a risk or safety event in several interacting risk systems represents an important deviation from other benchmarks. The concept of weighting function relies on the experience of the user to assign different weights to different risks or safety in a given environment. This allows the possibility of evaluating the impact of different risks on the reliability of multifunctional systems Introduction There are many methodologies proposed for reliability, risk and safety analysis for most, if not all process industries known today. Among the most popular ones, are quantitative risk analysis, probabilistic safety analysis, and worst-case methodology for risk assessment and optimal risk analysis. The optimal risk analysis (ORA) appears to be the most suitable, as it is fast, less expensive to implement, less time consuming and more precise than alternative analysis (1, 2). ANSI/ISA S84.01-1996 is the consensus standard for process
safety in the U.S, deemed to meet the OSHA 1910.119 PSM regulation (3).
Three methodologies are proposed in the TR84.02 report to be published by ISA (4). They are simplified equations, Fault Tree Analysis, and markov modelling to implement the safety performance requirements of the standard, for the SIS. The standard requires that the average probability failure on demand (PFDavg) be used in this analysis (5,6). Khan, F.I, and S.A Abassi (1) have presented a critical review of these methodologies. While the benefits of these methods have been well demonstrated in many publications, it appears that the development of a model that captures the intrinsic behaviour of the risk and safety systems of typical complex multifunctional system like the FPSO/Pipeline system have not been sufficiently researched. The problems are normally associated with complexity of the interacting components and process hazards that could lead to failure (7).
Our paper therefore, presents a model that incorporates the use of a weighting function to capture the complex risk and safety behaviour of the interacting components of the subsystem of typical FPSO/Pipeline system. A common misconception is to assume that a system prone to fewer risks is safe.
Risk is not the possibility of danger, as presented in most publications. It is rather an integral part of any system or process, which could be present or absent. A probability model is most time use to express the risk of failure. This method is justified for risk whose causes cannot be ascertain or quantified. Otherwise, a deterministic model with the boundary conditions well defined should be a better measure for risk or safety analysis.
Our definition of risk and safety seems therefore necessary at this point. Risk is the presence of danger that has a potential to undermine the integrity of a system (process or a facility). Safety is not the absence of danger, but the presence of immunity that has the potential to contain the risk of failure of a system (process or facility). These definitions are further supported, because it is common knowledge that potentially risky process or asset can be considered safe, if the necessary safety systems are installed to forestall failure. For example, a pipeline known to fail under certain operating corrosion conditions

K. ABHULIMEN AND A.SUSU OTC 14181
2
would have reliability, if necessary corrosion protection measures like use of cathodic protection system and metallurgical corrosion resistant material were put in place. Hence, a new measure to analyse the risk and safety of a system is proposed. Risk should be seen in the context of the safety systems installed to protect it, while safety of a system should be defined in the boundaries of the risk of failure of the safety systems that are installed to safeguard the system. These represent an important deviation from current benchmarks. The model has been applied to analyse the risk and safety potential of flow line/riser system in a deepwater environment. The results of simulation showed that a new benchmark model has been develop suitable for analysing the impact of different risks on the reliability of multifunctional systems. Failure Modes And Effect Analysis On FPSO/Pipeline System A detail study of a FMECA on a typical FPSO/Pipeline system is outside the scope of this paper, but a table showing the major failure modes of a riser-flow line system in deep water environment is presented in Table A-1 Development of the Fault Tree Model of FPSO/Pipeline system A hierarchical structure that captures the risk and safety events of all sub systems (process, facility, utility, safety devices etc) on the studied multifunctional FPSO/Pipeline system can be represented in a visual Fault Tree format. The FMECA analysis of the FPSO/Pipeline systems allows the identification of all systems and their failure modes and effects, which provides the input variable to construct the fault tree diagram. In this paper, we considered the following top event scenarios.
• The risk of failure of the FPSO/Pipeline system during it’s operational life • The safety of the FPSO/Pipeline system to meet the design HSE requirements and asset value during it’s operational life
Any of the chosen top event scenarios implies a different hierarchical fault tree analysis. A rigorous and systematic approach to construct a comprehensive fault tree requires the following step (8) • System definition • Fault tree construction • Qualitative Evaluation • Quantitative evaluation
The only modification to the fault tree model presented in this paper is the assignment of a weighting function to each risk or safety events as the tree progresses hierarchical to the top event. The output event of two or more logical input events for an OR-gate would have their output event as the sum of the linear combinations, of the product of the weighting function and the corresponding input risk event, in n -risk events sequence. Where, n is the number of input events i.e.
in
iii XY ∑ω= (1)
Whereas for the And –gate, the output event is the product sum of all the input risk raised to the power of their corresponding weighting function. i.e.
∏==
ωn
1ii
ii XY (2)
System Definition The FPSO/Pipeline system is subdivided into two classifications in order to capture explicitly the risk events common in each class • The process, that makes the production of oil and gas possible. • The FPSO/Pipeline facility, which makes the process available.
The facility can be further classified into the following sub systems presented below, that is:
• The Flow line and Riser system • The Hull Marine System • The Top side production facility The main processes of a typical FPSO/Pipeline system are: • The flow transport process of oil, gas and water • The separation process of oil, gas and water • The storage/ offloading process This classification, allows the analysis of risks and safety system common to each class. Fault Tree Construction Model Different top event scenario implies different analysis and trade off. In this paper, we propose the inclusion of a weighting function that allows the assignment of the relative contribution of a particular risk event in a sequence of n-risk events. Once the basic events are identified, the fault tree is progressed hierarchically to achieve the top event qualitatively and quantitatively. The Risk of Failure of the FPSO/Pipeline System during It’s Operation Life The risk of failure of the FPSO/Pipeline system to meet its design targets of operation exists if either the process or the facility fails. Failure caused by human error is introduced as a

OTC 14181 MODELLING RISK AND SAFETY SYSTEMS OF DEEP OFFSHORE FPSO/PIPELINE SYSTEM 3
basic event in the fault tree analysis. A procedure to construct the hierarchical fault tree, for typical FPSO/Pipeline system is presented. in flowchart FigureA-2. Each subsystem is analysed for possible event failure modes and outcome. The Safety of the FPSO/Pipeline System to meet its design targets during it’s service life The top event in a safety fault tree analysis is defined as: Safety of FPSO/Pipeline system to meet its design HSE targets during its service life. This constrains analysis to the following sub systems. • Safety of FPSO/Pipeline facility • Safety of the FPSO/Pipeline Process • Safety of Operators on FPSO system • Safety of FPSO/Pipeline environment. The construction of the fault tree treats the basic events the reliability of the safety-input systems designed to protect the facility. It is an And-gate all the way, since safety is a requirement, not an option. Mathematical Modelling of Risk and Safety systems of FPSO/Pipeline system. Risk and Safety Modelling A detail mathematical treatment is presented to quantify the magnitude of risk and safety systems. The risk that a system or process would fail at a particular time, is given by the probability distribution model. Based on the new concept of weighting function presented in this paper, the risk and safety model can be rewritten for any system thus: For a series system (OR gate), the risk objective function is
( ) ( ) ( ) ( ) in21in21 r11r1.r1r11r ωωωω −∏−=−−−−=
(3) For parallel system (AND gate), the risk objective function is
( ) ii
nn
22
11 rrxxrxrr ωωωω ∏== .... (4)
ir can be found from the probability distribution function suitable to describe the risk variable Also for a series system (OR- gate), the safety objective function is
( ) ( )sii
snn
2s2
1s1 ssxxsss ωωωω ∏== ...... (5)
For a parallel system (and gate), the safety objective
function is ( ) ( ) ( ) ( ) si
is11nns1..2
2s1s1s11s i ω−∏−=ω−ω−ω−−=
(6)
is is found from the reliability function suitable to describe the safety function.
The availability of the system is given by equation 7 for a series system (OR gate),
( ) ( ) aii
nan
2a2
1a1 AAxxAAA ωωωω ∏== ......
(7) Whereas for a parallel system (And gate), the availability objective function is given by equation 8
( ) ( ) ( )( ) ai
i
ann
2a2
1a1
A11
A1A1A11Aω
ωωω
−∏−=
−−−−= ..
(8) ωi, ωsi, ωai, which are the weighting function for risk, safety and availability respectively, measures the relative contribution an event variable i, would have on the outcome event in several n -events . It is defined mathematically as:
∫ γΨ=ωt
oi dtt )( (9)
The weighting function can be determined empirically from user’s experience of system of the risk events potential. The analytical treatment is a subject for future research. Once a relationship between the risk variable and its effect on the outcome is known, the weighting function can be defined. The boundary condition of the weighting function is such that:
1t
odt)t(i =γΨ=ω ∫ (10)
This boundary condition is valid whenever the event is the only event or contributes equally with the other risk events to the top event. Also another boundary condition exist such that:
0t
odt)t(i =γΨ=ω ∫ (11)
This boundary condition exist whenever the risk event is absent from the system.
The risk of a system or process can be defined by equation 12 below:
duuftrr
t
i )()(0∫= (12)
K. ABHULIMEN AND A.SUSU OTC 14181
4
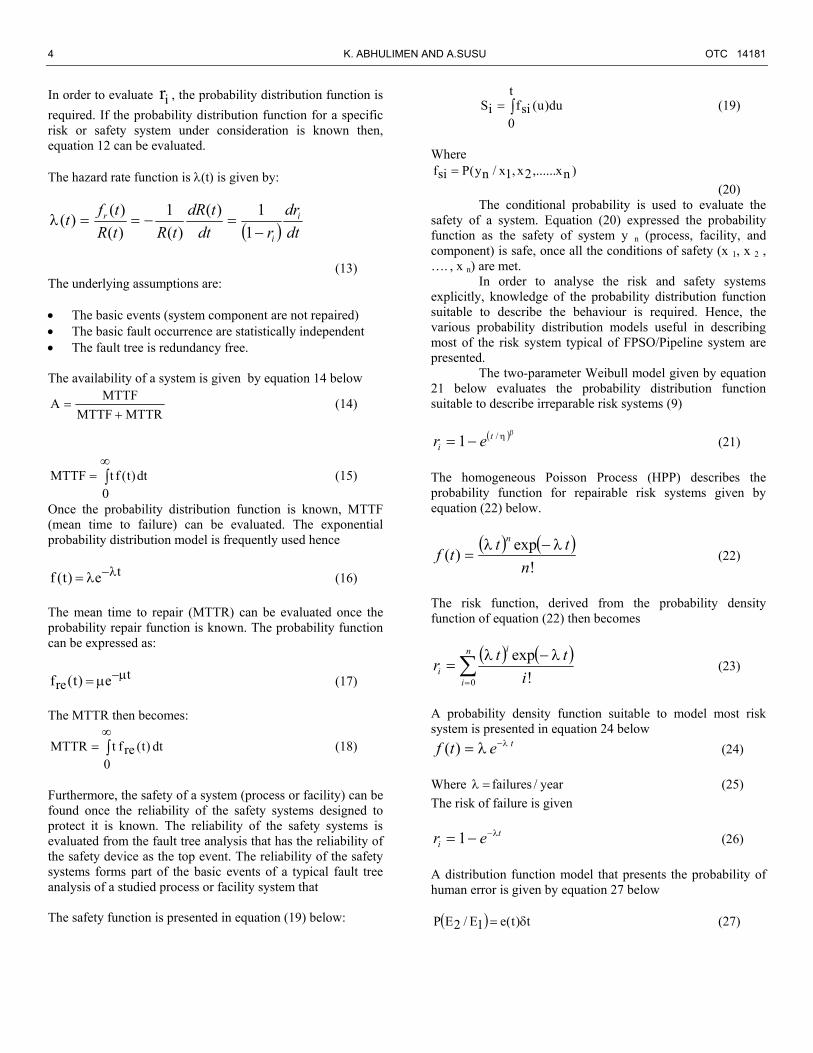
In order to evaluate ir , the probability distribution function is required. If the probability distribution function for a specific risk or safety system under consideration is known then, equation 12 can be evaluated. The hazard rate function is λ(t) is given by:
( ) dtdr
rdttdR
tRtRtft i
i
r
−=−==
11)(
)(1
)()()(λ
(13) The underlying assumptions are: • The basic events (system component are not repaired) • The basic fault occurrence are statistically independent • The fault tree is redundancy free. The availability of a system is given by equation 14 below
MTTRMTTFMTTFA
+= (14)
∫∞
=0
dt)t(ftMTTF (15)
Once the probability distribution function is known, MTTF (mean time to failure) can be evaluated. The exponential probability distribution model is frequently used hence
te)t(f λ−λ= (16) The mean time to repair (MTTR) can be evaluated once the probability repair function is known. The probability function can be expressed as:
tre e)t(f µ−µ= (17)
The MTTR then becomes:
∫∞
=0
dt)t(reftMTTR (18)
Furthermore, the safety of a system (process or facility) can be found once the reliability of the safety systems designed to protect it is known. The reliability of the safety systems is evaluated from the fault tree analysis that has the reliability of the safety device as the top event. The reliability of the safety systems forms part of the basic events of a typical fault tree analysis of a studied process or facility system that The safety function is presented in equation (19) below:
∫=t
0du)u(sifiS (19)
Where
)nx,......2x,1x/ny(Psif = (20)
The conditional probability is used to evaluate the safety of a system. Equation (20) expressed the probability function as the safety of system y n (process, facility, and component) is safe, once all the conditions of safety (x 1, x 2 , …. , x n) are met.
In order to analyse the risk and safety systems explicitly, knowledge of the probability distribution function suitable to describe the behaviour is required. Hence, the various probability distribution models useful in describing most of the risk system typical of FPSO/Pipeline system are presented.
The two-parameter Weibull model given by equation 21 below evaluates the probability distribution function suitable to describe irreparable risk systems (9)
( )βη/1 ti er −= (21)
The homogeneous Poisson Process (HPP) describes the probability function for repairable risk systems given by equation (22) below.
( ) ( )!
exp)(n
tttfn λλ −
= (22)
The risk function, derived from the probability density function of equation (22) then becomes
( ) ( )∑=
−=
n
i
i
i ittr
0 !exp λλ
(23)
A probability density function suitable to model most risk system is presented in equation 24 below
tetf λλ −=)( (24) Where year/failures=λ (25) The risk of failure is given
ti er λ−−= 1 (26)
A distribution function model that presents the probability of human error is given by equation 27 below
( ) t)t(e1E/2EP δ= (27)

OTC 14181 MODELLING RISK AND SAFETY SYSTEMS OF DEEP OFFSHORE FPSO/PIPELINE SYSTEM 5
tdte
hi
tt
er∫
−= 0
)(
1 (28) In active parallel network where there are there are at least r of n total units running to guarantee the top event to happen, the availability, risk, safety or probability function is given by the binomial distribution function The reliability function of the system is given thus:
rn)1R1(nm
rm1rRrCn
n/rR −−=
== ∑
(29) The risk of failure of the system, where at least r units must ensure its reliability is given thus.
( )n/rR1n/rr −= (30) The safety of the system where at least r units must ensure its reliability is given by equation
( ) rnyS1yrS
nn
rnrCn
n/rS −−=
== ∑ (31)
( )nny xxxyPS ,.....,/ 21= (32) S y is the probability that a system y n would be safe once x1, x2…x n conditions for safety are met We propose a new concept useful in analysing safety or risk systems. It is looking risk in the context of safety and vice-versa. Hence we define the new measure for risk, i.e risk and safety potential by equation (35) and (36) below:
systemssafetyofyreliabilitfailuresystemofrisk
potentialrisk = (35)
systemssafetyoffailureofRisksystemofsafetypotentialsafety = (36)
Markov chain Theory For Transient State Risk And Safety Systems At this point it is necessary to present the theory of the markov chain process used to capture the transient state behaviour of repairable and irreparable, risk and safety systems of the FPSO/Pipeline system The state equations can be written using the frequency balancing approach (10). Hence
dttdPtptPtP i
ij
jiij
ijj)()()()(
0=′=− ∑∑
=
λλ (38)
If equilibrium holds, equation 39 results 0)( =′ tpi . (39) Therefore equation 38 reduces to
0)()()(0
=′=− ∑∑=
tptPtP ij
jiij
ijj λλ (40)
Any (n-1) equation together with the total probability equation given in equation 41 below can be solved to obtain the solution to the system of equations
10
=∑=
n
iip (41)
The equivalent transition rate, replaces the transition rate for large complex transition system which under equilibrium is define by equation 42 below
∑ ∑ ∑− +
−
+
∈ ∈∈
− =Xi Xj
Xii
jiiXX
e
Pp λ
λ (42)
The FPSO/Pipeline system under study exhibits several levels of failure or safety. The risk or safety systems are defined in terms of subsets +X , which contained a specific number of system states. The subset defines an event or particular mode of failure at various modes all suitable defining elements of +X . The probability of X + is:
∑+∈
+ =Xi
iPP (43)
Method of Solution and Application of Model to FPSO/Pipeline system The markov chain process was used to model the transient risk and safety behaviour of a FPSO/Pipeline system. Let’s suppose that six possible states exist for FPSO/Pipeline system • Normal operating state (reliable) • Failed state by common causes of Type 1 • Failed state by common cases of Type 2 • Failed beyond repair by catastrophic or undetected causes that cannot be repaired in the short time • Failed state because safety systems failure • Normal operating state without safety protection The underlying assumptions used to evolve the transition tree are that the repaired system is as good as new and that failures are statistically independent. Also we further assume that the repair and failure rates are constant.
Let common causes of type 1, be failure modes common to surface facilities, production topsides and hull. e.g. (mechanical and structural related failures, design flaws,

K. ABHULIMEN AND A.SUSU OTC 14181
6
leaks, corrosion , relief valve failures, operational hazards, fire) and common causes of type 2 be failure modes that affect sub sea systems e.g. (flow lines and risers, hydrates, corrosion, underwater sea current, dynamic loading on risers, corrosion, design flaws, leakage, wax formation, safety valve malfunction, etc)
Three major processes are identified for an FPSO -Pipeline system. • The flow process in flow line and riser systems • The storage process in hull marine system • The topside separation process
The major production facilities that make the process available are: • The riser and flow line system • The topside production facilities • The hull marine system
A generic markov matrix system that captures the interacting systems and components of the FPSO/Pipeline system would be cumbersome. Hence an analysis that treats each subsystems of FPSO-Pipeline system separately simplifies the complexity. The final generic transition matrix of the FPSO-Pipeline system can now be obtained as either the product sum of each subsystem raised to the weighting function for an And-gate. For an Or-gate sum of the product of the weighting function and each subsystem is utilised.
Flow Line and Riser Systems A hypothetical case is presented for typical FPSO-Pipeline riser and flow line production systems. The flow line and adjacent riser exist as series system, while the other n-1 remaining riser /flow line system as parallel system since they must be operated exclusively. Figure 1 shows the system configuration.
Figure 1 Typical riser-flowline system configuration
The possible transition states for the above system are presented below: • Failed state by common causes type 2 (repairable) • Failed state when safety systems fail • Failed state due to catastrophic or undetected causes • Failed state due inductive chain effect, i.e. failure in flow line leading to failure in riser Let’s take a hypothetical case where, there are no catastrophic, undetected, or inductive failures. The possible states for a flow line-riser configuration is: • NIN2. Transition state with flow line and adjacent riser in normal operating state • CIN2 Flow line failed by common causes, adjacent riser normal transition state • P1N2: Flow line failed by safety system causes, and riser normal operating state • NIC1 Flow line at normal operating state adjacent riser failed by common causes • N1P1 Flow line normal state and riser failed by safety system causes • CIP1 Flow line failed by common causes, riser failed by safety considerations
The transition diagram is presented in Figure 2 below : Figure 2: Transient diagram for FPSO –Riser- Flow line System
λ1
λ3
µ
µ 3
λ2 µ 2
PNIN2
PCIP1
λ5 PNIP1
PNIC1
PP1N2
PC1N2
PN1N2
n
Riser n
flowline
1Riser
2
flowline
2
Riser
1flowline

OTC 14181 MODELLING RISK AND SAFETY SYSTEMS OF DEEP OFFSHORE FPSO/PIPELINE SYSTEM 7
The transition matrix for a single flow line-riser system is given by equation 44
( )( )
( )( )
( )( )
µ+λ−µ+λ−
µ+λ−µ+λ−
µ+λ−µ−µ−µ−µ−µ−λ++λ+λ+
6s00006
05s0005
004s004
0003s03
00002s2
54326.21s6
1P1PC1P1NP1C1̀NP2N1CP2N1PP2N1NP
=
000001
(44)
The solution to the above matrix system of equations is solved by cramer’s rule and inverse transform is presented in equation45 –48
∆
−=
tae2N1NP
1 (45)
∆
µ−−
µ−λ
=
tetae21a
2
2N1PP
21
(46)
∆
µ−−−
µ−λ
=
tetae31a
3
2N1CP
31
(47)
∆
µ−−−
µ−λ
=
tetae41a
4
1C1NP
41
(48)
∆
µ−−−
µ−λ
=
tetae51a
5
1P1NP
55
(49)
∆
µ−−−
µ−λ
=
tetae61a
6
1P1CP
66
(50)
Where
( )
µ−−−
µ−
λµ+
µ−−−
µ−
λµ+
µ−−−
µ−
λµ+
µ−−−
µ−
λµ+
µ−−−
µ−
λµ
−=∆
tetae61a
66
tetae51a
55
tetae41a
44
tetae31a
33
tetae21a
22
1(
61
51
41
31
21
(51)
and
6543211a λ+λ+λ+λ+λ+λ= (52) • PN1 N2 = Probability that the flow line and connecting
riser would be in the normal transition state with the associated repair ( )1µ and hazard rate ( )1λ .
• PC1 N2 = Probability that the flow line would be in a failed state caused by common causes and connecting riser be in the normal operating state with the associated repair ( )2µ and hazard rate ( )2λ .
• PN1C1 = Probability that the flow line would be in normal state and connecting riser be in the failed due to common cause with the associated repair ( )3µ and hazard rate ( )3λ .
• PN1C1 = Probability that the flow line would be in a normal state and connecting riser be in the failed sate due to common causes, associated repair ( )4µ and hazard rate ( )4λ .
• PN1 P1 = Probability that the flow line would be in a normal transition state and the riser in the failed state due to safety systems failure
• PC1P1 = Probability that the flow line and riser would be in failed state due to common cause and safety systems failure respectively with the associated repair ( )6µ and hazard rate ( )6λ .
The solution of equation (44) gives the transition states for common failures type 2 and failure because of unprotect ion by safety devices Hull marine systems The hull marine system consists of the cargo oil storage, which must be placed, in series with a deep well-submerged hydraulically driven pump. The individual cargo-pump and the remaining (n-1) cargo-pump systems must exist in parallel, since they must be operated independently. Hence the block diagram presented in Figure 3 applies.

K. ABHULIMEN AND A.SUSU OTC 14181
8
Figure 5: System configuration of hull marine system The following transition states are assumed • Normal operating conditions • Failure by common causes type 2 • Failure by system not protected by safety devices • Failure by catastrophic events or undetected risk Once the transition states have been identified, the markov chain process can be applied to evolve a transition tree from where the transition matrix can be obtained. Topside Production facilities. The main topside production facilities is the separation system which consist of the following facilities • FWKO 3 phase separation • Degassing separator • Electrostatic Unit • Gas compression facilities • Dry oil tank • Wet oil tank • Heat Exchangers Units Again, once the transition states is identified for each of the units, the transition system by markov chain process can be obtained. Analysis /Presentation of results
A computer program was developed to simulate a set of random results. By Monte Carlo simulation, these results can be fitted into a real data. A detailed flowchart is presented in Figure A-2. The risk and safety potential of a typical 10-riser –flow line production system evaluated by the computer program, is presented in Figures A-4 to A-10.The hazard rates for the transition states were obtained from data set for assume repair rates of 1321 =µ=µ=µ and ( )332211 =µ<=µ<=µ for 80% availability.
Once the repair and hazard rates for the transition states are known, the probability transition states (PN1N2, PN1C1, and PN1P1) can be evaluated.
Figure A-4 to Figure A-7 shows the probability density function for the three-state system. N1N2 represents (flow line –normal state, riser-normal state), while N1C1, represents (Flow line- normal state, riser -failed state due to common causes e.g. hydrate formation, corrosion, mechanical failures, etc.). N1P1 represents (Flow line -normal state, riser - failed state, due safety system unreliability).
Three weighting data sets classifications are used in the analysis of the safety and risk potential of the studied riser-flow line system. They are ( )16...21 =ω=ω=ω , ( )3.032.021.01 =ω<=ω<=ω ( )4.035.026.01 =ω>=ω>=ω . These data sets are the constant, increasing and decreasing weighting data set respectively. The classification assigns
1P1N3and,1C1N2,2N1N1 =ω=ω=ω , and 1P1N3and,1C1N2,2N1N1 =µ=µ=µ transition states
respectively. The plots of Figure A-4 shows that for increasing
repair rate and a constant weight data set, the probability of the riser-flow line system to exist in the normal transition state decreases to a minimum value. Whereas the probability for the riser-flow line system to exist in the failed transition state of type (N1C1), increases to a maximum value up to two years and then decreases for the remaining operations years. This shows that when the same weights can be assigned to the transition states, the possibility to exist in the failed state is higher than the possibility to exist in the normal state.
However a different trend exist in Figure A-5, where, the probability function for all transition states decreases to a minimum value within two years of operations for increasing weighting data sets and repair rate. It can also be observed from the plots that the failed Transition State of type N1C1, has a higher transition probability than the other two states. The normal Transition State, (N1N2) have the least probability function during operational years. This trend can be explained by the concepts of the weighing function presented in this paper. Since the weight distribution from the data sets, assigns the least weight to the normal transition state event, the possibility of having the least probability value is high.
However Figure A-6 shows that for a decreasing data set and increasing repair rate, the probability function decreases uniformly to a minimum value after four years, with the normal Transition State having the highest probability within the first two years of operation. This again can be explained by the weighting function concept, where the weight distribution, assigns a bigger weight to the normal transition state (N1N2). This invariably makes the normal state have a greater probability of existence within the first two years.
Figure A-7 shows that the risk potential is below the critical limit of 1 for very high safety reliability of 80%. As the reliability of the safety systems fall, the risk of exceeding the critical limit becomes high. This is the undesirable limit
However FigureA-8 shows that for a decreasing weight data set, the risk potential exist below the critical limit of 1 for all safety systems reliability. This is so because the
2Pump
2oargC
nPump
noargC
1Pump
1oargC

OTC 14181 MODELLING RISK AND SAFETY SYSTEMS OF DEEP OFFSHORE FPSO/PIPELINE SYSTEM 9
weight distribution assigns a bigger weight to normal distribution state than the other states.
Hence a change of weights assigned to each event changes the way the risk is viewed. This explains the behaviour of complex risk systems, where a change in operating environment alters the risk potential, like hydrates forming in deep offshore flow lines and no hydrates forming on onshore flow lines.
Figure A-9 shows that the safety potential exceeds the critical limit of 1 when reliability is very high.. Figure A- 10 shows that all safety potential for all safety reliability exceed the critical point. Conclusions A new model for analysing risk and safety systems based on the weighting function concept has been presented. The model allows the flexibility to handle complex interacting risk or safety behaviour of multifunctional systems. It has been applied to model the risk and safety potential of flow line/riser system in a deepwater environment. The concept of weighting function relies on the experience of the user to assign different weights to different risks or safety in a given environment. This allows the possibility of evaluating the impact of different risks on the reliability of multifunctional systems Acknowledgement
The author would like to acknowledge the research support given to him by NAPIMS and SNEPCO. He also acknowledges the almighty God who inspired this research and reveals the findings documented in this paper
Nomenclature A = Availability ANSI Ei = Input Event FPSO = Floating Production, Stoage and
Offloading fre = Probability density function for risk fse = Probability density function for safety HSE = Health Safety and Environment NAPIMS = National Petroleum Investment
And Management Services Services MTTF = Mean Time to Failure MTTR = Mean Time to Repair N = Number of variables Pi = Probability that an event would happen Re = Reliability SNEPCO =Shell Nigeria Exploration and
Production Company t = Time (s) si = Safety Variable ri = risk variable
Greek Symbols ωi = Weighting function ωsi = Weighting function safety ωai = Weighting function availability β = Shape parameter in weibull model λI = Hazard rates ( s-1) µ = repair rates ( s-1) ψ = Weighting function parameter References (1) Khan F.L, and S.A Abassi , “ Techniques for RISKS
Analysis of chemical process,” J. of loss Prevention in Proc.Ind.11 (2),P.91(1981)
(2) Khan, F.L and S.A Abassi,” Risk Assessment in
Chemical Process Industries: Advanced Techniques,” Discovery publishing house, New Delhi. India,
P.393 (1998) (3) “Application of Safety Instrumented Systems for Process Industries,” ANSI/ISA-s84.01-1996, ISA, Research Triangle Park, NC (Feb 1996) (4) “Safety Instrumented Systems (SIS)- Safety Integrity
Level (SIL) evaluation Techniques, Part1: Introduction, Part 2: Simplified Equations Part3: Fault TREE analysis, Part4: Markov Analysis, Part 5: Markov Logic Solver,” ISA, research Triangle Park,NC (in press)
(5) Beckman,L., “Determining the required safety
Integrity level for your process,” ISA Trans., 37, pp. 105-11 (1998)
(6) Ford, K.A., and A.E Summers, “ Are your Instrumented Safety Systems up to Standard?,” Chem. Eng. Progress, 94 (11).PP 55-58 (Nov 1998)
(7) Lees,F.P.,” Loss Prevention in the CPI,”
Butterworths, London, PP.26-28 (1996) (8) Dhillon B.S and Singh Chanan., Engineering
Reliability: New Techniques and Applications John Whiley and Sons, New York (1981)
(9) Davidson J., Reliability of Mechanical Systems
published by ImechE( (1988) (10) Singh, C. and Billinton R., system Reliability
Modelling and Evaluation, Hutchinson Educational, London (1977)

K. ABHULIMEN AND A.SUSU OTC 14181
10
Figure A1: FPSO with Flowlines, Risers and Subsea

OTC 14181 MODELLING RISK AND SAFETY SYSTEMS OF DEEP OFFSHORE FPSO/PIPELINE SYSTEM 11
Figure A2. Hierarchical Fault Tree Analysis of Risk and Safety Systems
Identify the System under Investigation FPSO/PIPELINE SYSTEM
Identify the basic sub system andtheir sub components of thecomplex system FPSO /Pipeline system -The Processes (Basic) • Flow process • Separation processes
• Storage/offloading -The facility (Basic) • The flow line /Riser • The topside production
facilities
• The hull Marine system
Identify the interrelation betweenthe basic sub system and their subcomponents of the complex system
Do an FMECA analysis aroundeach system to identify the basic orsecondary failure events of thesystem.
Specify the event tree and theiroutcome in relation to the risk of thesystem to fail or the reliability of thesafety systems to function
Assigned a weighting function toeach basic or secondary eventmode from either empirical oranalytical considerations
Define the logical gate -And gate -Or gate -Conditional gate -Undetermined
The Intermediate Event say A isgiven by
n
1ii
iEA=
ω=
n
1iiA
=ω=ω
Or Gate
And Gate
Conditional gate
The Intermediate event say C isgiven by
in
1iiEC ∑ω=
=
∑ω=ω=
n
0iiA
The Intermediate Event say B whenone the event mode is present as acondition is given by
ii
n
1i
ii
E
EEB
I ω=
ω
=/
Sequentially progress until the Top Event is achieved. The Overall risk objective function of the FPSO/Pipeline system is the obtained as a combination of the risk variable of all sub systems and their weighting function of all the event sequence in the Fault

K.E., ABHULIMEN, AA.,SUSU OTC 14181
12
Figure A-3: Computer Flowchart for Risk and Safety Analysis for FPSO-Pipeline system
Define the system for which a safety or risk analysis is intended FPSO-Pipeline (Riser-flowline) system
Specify the possible Transition States of the system and the necessary assumptions e.g Risers-Flow line must have 10 production lines Operated the same way
Assume the repair rates for each of the transition states. If the availability of the system is define we can find the hazard rate
iaA1
i µ
−=λ
Develop the transition tree based on the configuration. For case study we develop the transition tree for a riser-flowline system and assume it applied to the other n-1 Riser-flow line system. The transition system for the riser-flow line as a unit would be the sum in parallel
With the knowledge of the transition tree structure ,the probability of all the transition states can be evaluated , once the repair rates and hazard rates are evaluated, from the transition matrix set of equations
Use the simplex method to solve the integral useful in finding the risk or reliability from the probability density function of all transition states Get the risk or safety objective function. Once this are known. The risk for the n-riser-flowline system can be evaluated
Use Monte Carlo simulation to fit the data available with the parameters in the model. A weighting function is assigned to each transition state to specify its relative importance in a sequence of transition states
A program is run to generate a set of profile for each transition states. The risk and safety potential are evaluated
Re
Risk of the System
liabilty of Safety SystemsRisk Potential =
Safety of the System
Safety PotentialRisk of Safety Systems failure
=
Is Risk Potential greater than 1
yes No
Risk Management System is good
Risk Management System is poor
Is Safety Potential greater than 1
Safety Management System is good
yes
Safety Management System is good
No
END

OTC 14181 MODELLING RISK AND SAFETY SYSTEMS OF DEEP OFFSHORE FPSO/PIPELINE SYSTEM 13
FigureA- 4:Probability density function of flowline and riser at different transition states for availability of 80% and at assumed increasing repair rate for constant weighting data set
1.00E-115.00E-04
1.00E-031.50E-03
2.00E-032.50E-033.00E-03
3.50E-034.00E-03
4.50E-035.00E-03
0 2 4 6 8 10 12
Operating life (years)
Prob
abili
ty d
ensi
ty fu
nctio
n a
t di
ffere
nt tr
ansi
tion
stat
es
PNIN2
PN1C1
PNIP1
Figure A6: Probability de ns ity function for cons tant re pair rate of 1 at de cre as ing w e ighting function for 10-Ris e r /flow line s ys te m at availability of 80%
0
0.02
0.04
0.06
0.08
0.1
0.12
0.14
0.16
0.18
0 2 4 6 8 10 12ope rating life in ye ars
Prob
abili
ty d
ensi
ty fu
nctio
n fo
r nor
mal
tr
ansi
tion
stat
e
PNIN2
PNIC1
PN1P1
Figure A-5 Probability de ns ity function for incre s ing re pair rate and w e ighting data s e t
-2.00E-03
0.00E+00
2.00E-03
4.00E-03
6.00E-03
8.00E-03
1.00E-02
1.20E-02
1.40E-02
1.60E-02
1.80E-02
0 2 4 6 8 10 12
Ope rating life in ye ars
Prob
abili
ty d
ensi
ty fu
nctio
n at
diff
eren
t tr
ansi
tion
stat
es
PN1PN2
PN1C1
PN1P1

K.E., ABHULIMEN, AA.,SUSU OTC 14181
14
Figure A-7 Ris k Pote ntial fo r a 10-Ris e r /flow line s ys te m s for incre as ing re pair r ate and w e ighting data s e t fo r norm al trans ition s tate
0
0.5
1
1.5
2
2.5
3
3.5
4
0 2 4 6 8 10 12
ope rating ye ars
Ris
k Po
tent
ial f
or ri
ser/
flow
line
syst
em a
t nor
mal
tran
sitio
n st
ate
Critical Limit
Saf ety Sys tems Rel = 0.2
Saf ety Sys tems Rel = 0.5
Saf ety Sys tems Rel =0.8
Fig u r e A - 8 . R is k P o t e n t ia l f o r 1 0 - Ris e r /f lo w lin e s y s t e m s f o r a s s s u m e r e p a ir in c r e a s in g r e p a ir r a t e a n d d e c r e a s in g w e ig t h in g d a t a s e t f o r s y s t e m a v a ila b ilit y o f 8 0 a t n o r m a l t r a n s it io n s t a t e
-0 .2
0
0 .2
0 .4
0 .6
0 .8
1
1 .2
0 2 4 6 8 1 0 1 2
O p e r a tio n s life in ye a r s
Ris
k Po
tent
ial f
or ri
ser-
flow
line
syst
em
C ri tic a l P o in tS a fe ty S ys te m s R e l= 0 .2S a fe ty S ys te m s R e l = 0 .5S a fe ty S ys te m s R e l = 0 .8
Figur e A-9 Safe ty Pote ntial o f 10- Ris e r /Flow line Syte m at as s um e d incr e as inr e pair r ate for w e igting function data s e t fo r nor m al tr ans ition s tate at availab ility o f 80%
0
1
2
3
4
5
6
0 2 4 6 8 10 12
Ope rations life (ye ar s )
Safe
ty P
oten
tial
Critical State
Saf ety Sys tems Rel =0.2
Saf ety Sys tems Rel =0.5
Saf ety Sys tems Rel = 0.8

OTC 14181 MODELLING RISK AND SAFETY SYSTEMS OF DEEP OFFSHORE FPSO/PIPELINE SYSTEM 15
TABLE A-1 FAILURE MODES AND EFFECT ANALYA\ SIS OF FPSO/PIPELINE SYSTEM
RISK ANALYSIS / RISK SYSTEMS
S/N
System
System classification
Risk Type
Failure Mode
Possible Causes
Possible Symptoms
Effect Of Failure
A FLOWLINES AND RISER SYSTEMS A1 A2
Risers Flowline
A riser provides the flow paths between the flow line on the sea bed and FPSO. A flow line connects the eub sea wells with the risers.
Process Risk -Gas leaks -Over pressure -H2S cracking -Rapid decompression
Corrosion SSSV valves Faulty Presence Of H2S and conditions
Pressure drop Cracks /fatigue on pipeline
Explosions Gas loss Loss in Integrity of pipelines
Mechanical Risk
Topside leakage Riser impact -H2 cracking -Topside leakage
Operational Risk
-Process system failure
1 Export Risers Connects to gas export pipeline
Human Risk -Inexperience operators Design oversight -Operational negligence by schedule officers -management oversight
Lack of Training Poor attitude
Accidents
Figure A-10:Safety Potential of 10 Riser-flowline system at normal transition state for increasing repair and decreasing weighting function for system availabilty of 80%
0
1
2
3
4
5
6
0 2 4 6 8 10 12operations life in years
Safe
ty P
oten
tial
Critical State
Safety Systems Rel =0.2
Safety Systems Rel = 0.5
Safety Systems Rel = 0.8

K.E., ABHULIMEN, AA.,SUSU OTC 14181
16
TABLE A-1 FAILURE MODES AND EFFECT ANALYA\ SIS OF FPSO/PIPELINE SYSTEM CONTINUED
Process Risk -Wax -Hydrates -Surges -Scaling -H2S corrosion -Co2 Corrosion
Operations a <Pour Temp <Cloud Temp presence of Barium sulphate -Presence of corrosion environment -C02 -H2S
-Flow Assurance related problems -Blockage of pipe Loss of Line Integrity
Mechanical Risk
-Dynamic loading of FPSO and Sea water currents -SCC (Stress Corrosion Cracking) -Bending Load at interfaces -Leaks
Movement Of FPSO -H2S -Operating conditions
Loss of pipe Integrity Failure of Process
Operational Risk -Pigging operations -Depressurisation blowouts
2 Sub sea Flow line/ Risers Production lines
Provides flow path(s) between production flow line on sea bed to FPSO
Human Risk
-Design oversight -Operational negligence by schedule officers -management oversight
Accidents Process and Facility failure
Process Risk
-Corrosive wet gas -SSC -CO2 corrosion -Gas leak
H2S present
-Loss in Pipeline integrity -Leaks
Mechanical Risk
Snag load Umbilical/ Riser fail
3 Subsea Gas Injection Risers
Operational Risk
Process Risk
-Surges -Scaling -Co2 Corrosion -O2 corrosion
Co2 O2 present
Loss in pipeline integrity -Leaks
Mechanical Risk’
-Dynamic loading of FPSO and Sea water currents -SCC (Stress Corrosion Cracking) -Bending Load at interfactes -Leaks
Mechanical Failures Buckling Stress Riser failure
Operational Risk
4 Sub sea Water Injection Risers
Human Risk
-Design oversight -Operational Negligence by shedule officers -management oversight