
Modelling New Zealand mortgage interest rates · In this note we examine the determinants of...
14
Modelling New Zealand mortgage interest rates AN 2012/10 Enzo Cassino 1 November 2012 Reserve Bank of New Zealand Analytical Note series ISSN 2230-5505 Reserve Bank of New Zealand PO Box 2498 Wellington NEW ZEALAND www.rbnz.govt.nz The Analytical Note series encompasses a range of types of background papers prepared by Reserve Bank staff. Unless otherwise stated, views expressed are those of the authors only, and do not necessarily represent the views of the Reserve Bank. 1 The author is now on secondment to The Treasury, but this work was undertaken at the Reserve Bank.
Transcript of Modelling New Zealand mortgage interest rates · In this note we examine the determinants of...

Modelling New Zealand mortgage interest rates
AN 2012/10
Enzo Cassino1
November 2012
Reserve Bank of New Zealand Analytical Note series ISSN 2230-5505
Reserve Bank of New Zealand
PO Box 2498 Wellington
NEW ZEALAND
www.rbnz.govt.nz
The Analytical Note series encompasses a range of types of background papers prepared by Reserve Bank staff. Unless otherwise stated, views expressed are those of the authors only, and do not necessarily represent the views of the Reserve Bank.
1 The author is now on secondment to The Treasury, but this work was undertaken at the Reserve Bank.

Reserve Bank of New Zealand Analytical Note Series 2 _____________________________________________________________
NON-TECHNICAL SUMMARY
We model what determines mortgage interest rates in New Zealand, and examine how
changes in the OCR are transmitted through the wholesale cost of funds (the swaps market in
particular) to mortgage rates. Mortgage rates are modelled as a mark-up over banks’ marginal
funding cost, which, in turn, is measured by rates on interest rate swaps, credit default swap
(CDS) spreads for the major Australian banks (as a proxy for banks’ wholesale funding cost
margin over swap rates), and term deposit rates.
To the extent that our measures adequately capture banks’ marginal funding costs, the results
suggest that banks frequently diverge from a simple marginal cost-pricing model. Marginal cost
pricing of mortgages appears to hold only in the long run. Floating mortgage rates and short-
term fixed rates are closest to having full pass-through of marginal cost in the long run. Long-
term fixed mortgage rates are more ‘sticky’. Term deposit rates only affect mortgage rates in
the short term. Changes in the Official Cash Rate (OCR) affect the slopes of the swap and
mortgage curves, altering short-term rates relative to long-term rates. This is consistent with
the monetary policy transmission found in other empirical studies.
Further work could be carried out to better measure banks’ marginal cost of funding. This could
then be used to explore variation in the relationship between funding costs and mortgage rates
over time. It would also be useful to test whether the relationship is asymmetric, that is,
whether the impact of increases in funding costs on mortgage rates is different from the impact
of decreases in funding costs.
Reserve Bank of New Zealand Analytical Note Series 3 _____________________________________________________________
INTRODUCTION2
In this note we examine the determinants of mortgage rates in New Zealand, modeling
mortgage interest rates as a mark-up over banks’ marginal funding costs. We also examine the
relationship between changes in the OCR and changes in swaps and mortgage curves.
Despite the importance of these relationships in the monetary policy transmission process,
there has been little empirical work done on this topic in New Zealand since Eckhold (1994).
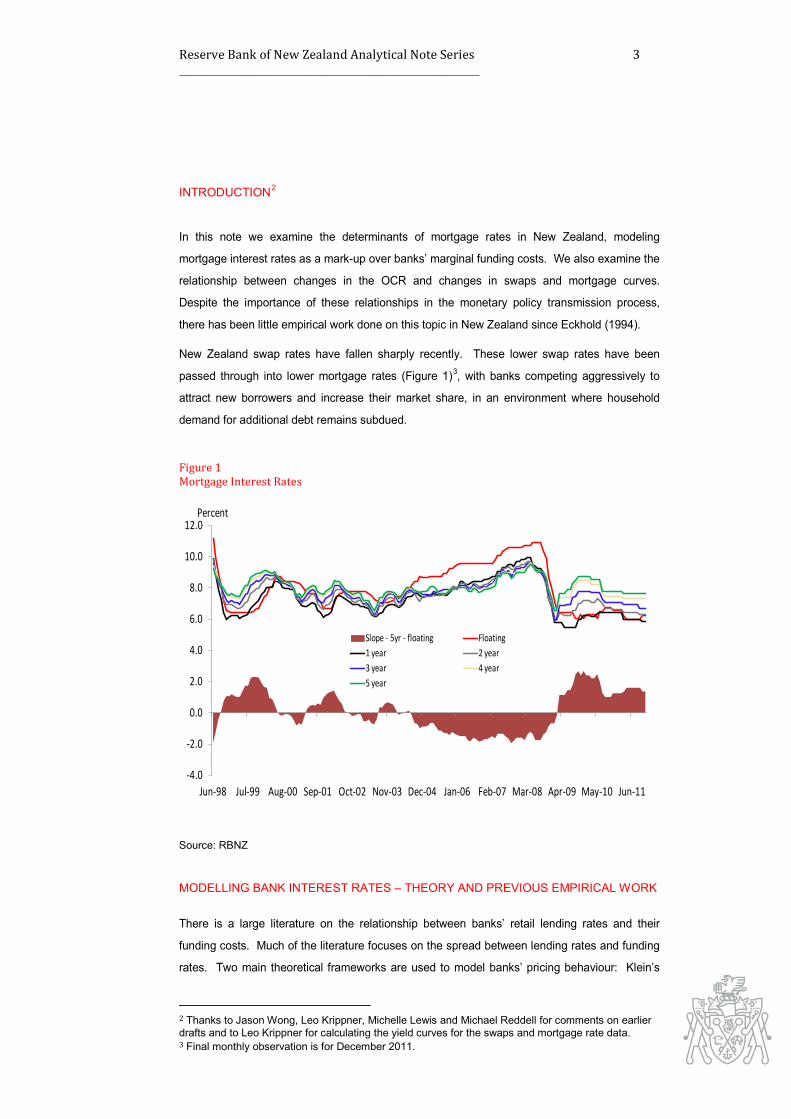
New Zealand swap rates have fallen sharply recently. These lower swap rates have been
passed through into lower mortgage rates (Figure 1)3, with banks competing aggressively to
attract new borrowers and increase their market share, in an environment where household
demand for additional debt remains subdued.
Figure 1 Mortgage Interest Rates
Source: RBNZ
MODELLING BANK INTEREST RATES – THEORY AND PREVIOUS EMPIRICAL WORK
There is a large literature on the relationship between banks’ retail lending rates and their
funding costs. Much of the literature focuses on the spread between lending rates and funding
rates. Two main theoretical frameworks are used to model banks’ pricing behaviour: Klein’s
2 Thanks to Jason Wong, Leo Krippner, Michelle Lewis and Michael Reddell for comments on earlier drafts and to Leo Krippner for calculating the yield curves for the swaps and mortgage rate data. 3 Final monthly observation is for December 2011.
-4.0
-2.0
0.0
2.0
4.0
6.0
8.0
10.0
12.0
Jun-98 Jul-99 Aug-00 Sep-01 Oct-02 Nov-03 Dec-04 Jan-06 Feb-07 Mar-08 Apr-09 May-10 Jun-11
Slope - 5yr - floating Floating1 year 2 year3 year 4 year5 year
Percent
Reserve Bank of New Zealand Analytical Note Series 4 _____________________________________________________________
(1971) model assumes banks set lending rates as a mark-up over interbank market interest
rates, where the mark-up is a function of market power. If the market is perfectly competitive,
banks would fully pass-through changes in market rates into lending rates. The Klein model
can be expanded to allow for features such as imperfect competition and asymmetric
information, which would reduce the degree of pass-through.
An alternative framework is used by Ho and Saunders (1981), which treats banks as risk-
averse dealers who act as intermediaries between lenders and borrowers, setting interest rates
on loans and deposits jointly to match the maturities of loans and deposits. The arrival of loan
demands and deposit supplies is random and exogenous, and the only way for banks to
influence the balance is by adjusting lending and deposit rates. In Ho and Saunders’ model,
the margin between lending and funding rates depends on the degree of bank market power,
the degree of risk aversion, interest rate volatility and transaction size.
Both Klein’s and Ho and Saunders’ models have been used extensively as frameworks for
empirical analysis of banks’ interest rate margins.4 A general result in the literature is that bank
interest rates are sticky in the short term. However, the degree of pass-through of funding
costs varies widely across countries, institutions and products.5 Recent empirical work has
examined the impact of the Global Financial Crisis (GFC) on banks’ margin setting. For
example, Mannasoo (2012) suggests wider lending margins after the GFC in 2008 were driven
primarily by banks’ increased risk aversion, with increased interest rate volatility making a
smaller contribution. There has been little work done on modelling bank margins or interest
rates using New Zealand data. An exception is Eckhold (1994), who modelled the first
mortgage interest rate as a mark-up over bank funding costs.
MODELLING MORTGAGE RATES BY MATURITY We can model the relationship between mortgage rates and funding costs in several ways. In
this section we examine the relationship at each individual maturity, while in the next section we
model the relationship between the overall wholesale interest rate curve and the mortgage rate
curve.
We assume the mortgage rate fixed for i years is a constant margin over the marginal funding
cost at that maturity,
𝑀𝑂𝑅𝑇𝑖𝑡 = 𝛽1 + 𝛽𝑀𝐶𝑖𝑡 ,
where
4 See, for example, Saunders and Schumacher (2000), Maudos and Fernandez de Guevara (2004), Gropp et al (2007), Banerjee et al (2012). 5 Cecchin (2011)
Reserve Bank of New Zealand Analytical Note Series 5 _____________________________________________________________
MORTi = i-year fixed mortgage rate (or floating mortgage rate) for new customers,6
MCi = marginal cost of i-year fixed rate mortgage funding.
If movements in marginal funding costs are fully passed through into mortgage rates, then β
should equal one, and the coefficient β1 represents the spread between mortgage rate and the
marginal cost.
This is a simplification of banks’ actual pricing behaviour, but the framework is widely used in
the empirical literature. In reality, banks tend to smooth through the recent changes in the
marginal cost of funds, rather than passing it fully through into customers’ borrowing rates. This
reduces the costs of frequently re-setting prices and for each bank reduces the risk of losing
mortgage market share if they pay higher funding costs in an environment where costs are
elevated.
The marginal cost of funds for banks is difficult to measure. We proxy it as a combination of
wholesale funding costs and retail funding costs, which are themselves difficult to measure.7
The cost of wholesale funding is usually quoted as a spread over the market mid-swap rate.
There are no consistent time series for these spreads, but since it should in principle reflect the
credit risk on the banks’ borrowing, it should be correlated with credit default swap (CDS)
spreads for the banks. CDS contracts are not available for the New Zealand banks, so we take
the average of CDS spreads for their Australian parent institutions. Because liquidity in the
CDS market is concentrated at the five year horizon, the five year spread is used to proxy credit
risk at all maturities. In practice, credit risk is likely to be higher at longer maturities, but the
movements in the spreads are generally correlated. CDS spreads were broadly stable until the
GFC started in 2008 and then rose sharply.8 Since then, they have stayed at elevated levels,
fluctuating as investor risk preferences have changed.
To allow for some price smoothing behaviour by banks, we assume the relationship between
mortgage rates and marginal funding cost holds in the long run, but that there can be
divergences in the short run. To reflect this, the model is expressed as an error correction
model, as follows:9
∆MORTit=α1 �MORTit-1-β1-β2SWAPit-1-β3CDSt-1-β4TDit-1�+α2∆MORTit-1+dynamics,
where
SWAPi = i-year swap rate (3-month bank bill for floating mortgage),
CDS = Average 5-year CDS rate on four largest Australian banks,
TDi = i-year term deposit rate (3-month rate for floating mortgage) (month-end rate).
6 The mortgage rates collected are ‘carded’ rates, so they do not take account of any discounting offered to customers in the branches. 7 For a more detailed discussion of bank funding costs, see Wong (2012). 8 See Data Appendix 9 Unit root tests confirmed the levels of all the variables are non-stationary, and first differences are stationary.

Reserve Bank of New Zealand Analytical Note Series 6 _____________________________________________________________
The coefficient α1 represents the speed that mortgage rates adjust to the long-run marginal cost
relationship. The model is estimated using monthly data for each mortgage rate maturity by
non-linear least squares for August 2001-December 2011. The main results are summarized in
Table 1 below.
Table 1 Single equation estimation results (Dependent variables: Change in mortgage rate)
Fixed
period of mortgage
Error correction
term (α1)
Half life (months)*
Swap rate
(β2)
CDS
(β3)
Lagged mortgage
rate change (α2)
Adjusted R-squared
Floating -0.14 (-3.36)
5.0
0.93 (14.84)
0.10 (4.21)
-0.15 (-1.76)
0.66
1 year -0.11 (-3.42)
6.3 0.80 (9.14)
0.10 (2.73)
0.11 (1.65)
0.61
2 year -0.16 (-3.26)
4.3 0.77 (9.13)
0.10 (3.97)
0.20 (3.20)
0.57
3 year -0.17 (-3.55)
4.1 0.78 (7.67)
0.10 (4.29)
0.18 (2.89)
0.55
4 year -0.13 (-3.20)
5.3 0.75 (5.30)
0.10 (3.82)
0.25 (3.92)
0.55
5 year -0.13 (-3.16)
5.3 0.76 (4.40)
0.20 (3.71)
0.21 (3.29)
0.52
t-statistics in parentheses *The half-life is the number months it takes for 50% of the convergence to equilibrium.
The estimation reveals several interesting results. First, term deposit rates were statistically
insignificant in determining mortgage rates in the long run at all maturities, although changes in
term deposit rates did have some effect in the short run.10 A similar result was found by
Eckhold (1994). Most term deposits are for terms less than one year, so the lack of impact on
longer-term mortgage rates is not surprising. Even for shorter term mortgage rates, the lack of
role for term deposit rates is consistent with the dominance of wholesale market funding for
New Zealand banks over much of the sample period. But it could also be that deposit rates are
priced off wholesale market rates; to the extent that was so there would be less of an
independent channel on mortgage rates. More recently, as banks have focused on increasing
their share of core retail funding, and reducing their exposure to short-term wholesale funding,
we would expect term deposit rates to play a more important role in the marginal cost of
funding.11 Future work could try to capture this with time-varying estimation.
10 Given the lack of statistically significant results, the estimated coefficients for term deposit rates are not shown in the table. 11 Retail deposits are now the largest source of funding for New Zealand banks, see Wong (2012).
Reserve Bank of New Zealand Analytical Note Series 7 _____________________________________________________________
Second, the speed of adjustment (α1) at all horizons to the long-run equilibrium is relatively slow,
suggesting banks often diverge from a simple marginal-cost pricing model. The half-life of the time
taken to converge to the long-run equilibrium is around four-six months.12 As discussed above, this is
consistent with banks’ actual pricing behaviour, which smooths through some of the volatility in funding
costs when setting retail lending rates.
Third, the long-run pass-through of wholesale market rates into mortgage rates, measured by the
coefficient on swap rates, is closest to full pass-through on floating rates and shorter-term fixed rates.13
In addition, the coefficient on the lagged dependent variable indicates there is more persistence in long-
term fixed rates rather than floating rates and short-term fixed rates.
Another key issue is whether, and if so how much, the relationship between mortgage rates and funding
costs changed following the GFC. A simple method to try to capture this is to include a dummy variable
for the post-GFC period. This dummy was not statistically significant, possibly because the structural
break is captured by the widening in banks’ CDS spreads after the crisis. Future work using more
sophisticated techniques could test for changes in the relationship.
MODELLING THE MORTGAGE CURVE
In addition to modelling the mortgage rates individually at each maturity, we can model the
whole curve jointly, and examine the relationship between the mortgage curve and the swaps
market curve. The impact of changes in the OCR on wholesale and retail interest rates can
also be examined to understand the monetary policy transmission mechanism. We use the
Nelson and Siegel method to fit yield curves to swaps and mortgage markets. This model is
widely used in the finance literature, as it has a simple structure which can be estimated with a
relatively small number of observations. Nelson and Siegel’s method allows us to decompose
each curve into level, slope and curvature factors,14
𝑅(𝑡,𝑚) = 𝐿𝑒𝑣𝑒𝑙 𝑓𝑎𝑐𝑡𝑜𝑟 + 𝑆𝑙𝑜𝑝𝑒 𝑓𝑎𝑐𝑡𝑜𝑟 + 𝐶𝑢𝑟𝑣𝑎𝑡𝑢𝑟𝑒 𝑓𝑎𝑐𝑡𝑜𝑟,
where
R(t,m) = the zero-coupon continuously compounding interest rate at maturity m at time t.
For simplicity, in our analysis, we use a model which decomposes the curve into just level and
slope factors. These factors explain most of the variation in the curve. In addition, previous
work has shown there is no clear relationship between the curvature component and macro
economic variables.15
12 The half-life is calculated as ln(0.5)/α1 13 However the hypothesis that the coefficient is statistically insignificant from one is rejected even at short maturities. 14 For a simple description of the Nelson and Siegel method, see the Box in Krippner (2010). 15 See, for example, Diebold, Rudebusch and Aruoba (2006).

Reserve Bank of New Zealand Analytical Note Series 8 _____________________________________________________________
Intuitively, the level and slope components can be thought of as smoother ways to represent
the first and second principal components on the term structure.16
Figure 2 below shows that the level factors of the swap and mortgage curves have generally
been closely correlated over the sample period.17 However, since 2008, the level factors of the
various curves have diverged, reflecting the wider spreads over swap rates that banks have
had to pay for funding since the start of the GFC. There is no clear correlation between the
level factors and changes in the OCR, apart from during the sharp easing phase during 2008.
Figure 2 Level factors and the Official Cash Rate
Source: RBNZ calculations Figure 3 shows that the slope factors of the swaps and mortgage curves are even more closely
correlated than the level factors, and appear to be more closely linked with movements in the
OCR. Movements in the swap slope appear to slightly lead movements in the mortgage slope,
consistent with the view that mortgage rates reflect past movements in funding costs.
16 Principal components are used to explain the co-movement between of time series by reducing the number of series to a smaller number of common factors. In this example, the components would be calculated directly over time and across interest rates with different terms to maturity. In contrast, the Nelson-Siegel components are calculated across maturities, at a point in time, but the level and slope components are made consistent by being based on fixed unit functions. 17 A positive slope factor represents a negatively-sloped yield curve, and vice versa.
0123456789
0.00
0.02
0.04
0.06
0.08
0.10
0.12
Jun-98 Sep-99 Dec-00 Mar-02 Jun-03 Sep-04 Dec-05 Mar-07 Jun-08 Sep-09 Dec-10
Mortgage (LHS)Swaps (LHS)OCR (RHS)
Percent

Reserve Bank of New Zealand Analytical Note Series 9 _____________________________________________________________
Figure 3 Slope factors and the Official Cash Rate
Source: RBNZ calculations
The next step is to model the relationship between the OCR and the factors driving the swaps
and mortgage market. To allow for interaction between the OCR and the interest rate markets
we estimate a five-variable vector auto-regression (VAR) model over the sample period July
1997-December 2011.18 Because the data are non-stationary we first-difference each variable
in the model. To identify the structural shocks, we do a Cholesky decomposition, with the
ordering (OCR, swap level, swap slope, mortgage level, mortgage slope), where the OCR is the
most exogenous variable and the mortgage slope is the most endogenous. Impulse responses
for the impact of a positive shock to the OCR are plotted in Table 2, with confidence intervals
around each response.19 To check the results for robustness, we also estimated the model in
levels. The findings were unchanged from the differenced model discussed below.
18 Two lags are used in the model, based on minimizing the Schwarz criterion. 19 Extending the model to three factors to capture the curvature of the curve produces broadly similar results.
0
1
2
3
4
5
6
7
8
9
-0.05
-0.04
-0.03
-0.02
-0.01
0.00
0.01
0.02
0.03
Jun-98 Sep-99 Dec-00 Mar-02 Jun-03 Sep-04 Dec-05 Mar-07 Jun-08 Sep-09 Dec-10
Mortgage (LHS)Swaps (LHS)
OCR (RHS)
Percent

Reserve Bank of New Zealand Analytical Note Series 10 _____________________________________________________________
Figure 4 Impulse Response Results Responses to one standard deviation shock to OCR ± 2 standard errors
Figure 5 Impulse Response Results Responses to one standard deviation shock to swap slope ± 2 standard errors
The impulse responses illustrate several results. A shock to the OCR (Figure 4) does not have
a statistically significant impact on the level factor of the swaps and mortgage curve (second
and fourth chart), as the confidence interval includes zero. However, the OCR shock does
have a statistically significant impact on the slope factor of the swaps and mortgage curves
(third and fifth chart), as the confidence intervals do not include zero. This finding is consistent
with previous empirical work, which finds monetary policy shocks are transmitted through
changes in the slope of the yield curve.20 Wu (2003) argues the reason for the impact on the
slope is because a positive monetary policy shock temporarily increases short nominal interest
20 See, for example, Wu(2002) and Wu(2003).
-.05
.00
.05
.10
.15
.20
2 4 6 8 10
Response of DOCR to DOCR
- .001
.000
.001
.002
.003
.004
2 4 6 8 10
Response of DSLEVEL to DOCR
- .004
-.003
-.002
-.001
.000
.001
.002
2 4 6 8 10
Response of DSSLOPE to DOCR
- .001
.000
.001
.002
.003
2 4 6 8 10
Response of DMLEVEL to DOCR
-
- .003
-.002
-.001
.000
.001
.002
2 4 6 8 10
Response of DMSLOPE to DOCR
- .05
.00
.05
.10
.15
.20
2 4 6 8 10
Response of DOCR to DSSLOPE
- .001
.000
.001
.002
.003
.004
2 4 6 8 10
Response of DSLEVEL to DSSLOPE
- .004
-.003
-.002
-.001
.000
.001
.002
2 4 6 8 10
Response of DSSLOPE to DSSLOPE
- .001
.000
.001
.002
.003
2 4 6 8 10
Response of DMLEVEL to DSSLOPE
- .003
-.002
-.001
.000
.001
.002
2 4 6 8 10
Response of DMSLOPE to DSSLOPE

Reserve Bank of New Zealand Analytical Note Series 11 _____________________________________________________________
rates. Since long rates embed expectations of future short term rates, they move by less than
short rates, changing the slope of the curve.
Figure 5 shows the impact of a shock to the slope of the swaps curve. This can be interpreted
as the response of New Zealand markets to news, rather than a change in monetary policy
settings. By construction, a shock to the swaps curve slope does not affect the OCR and the
level factor of the swaps curve in the first period. But, a shock to the slope of the swaps curve
does affect the slope of the mortgage curve (last chart). It also affects the OCR in subsequent
periods (first chart). This confirms the existence of a feedback channel from the data that
influence the swaps market to policy settings, and probably also reflects the forward-looking
nature of the swaps market, which responds to foreign and domestic shocks and prices in
future movements to the OCR. Krippner and Thorsrud (2009) show the slope of the New
Zealand yield curve can be used to forecast GDP growth.
CONCLUSION
This work has been a preliminary empirical analysis of mortgage rates in New Zealand. We
have examined the key drivers of mortgage rates and the relationship between monetary policy
changes and changes in the mortgage curve, through wholesale interest rates. There is
significant scope for further work. A useful first step would be to derive better estimates of the
marginal cost of funding paid by New Zealand banks. It would be useful to examine variation in
the relationship between mortgage rates and funding costs over time, especially comparing the
nature of the relationship before and after the GFC. It would also be interesting to test for
asymmetries in the relationship between mortgage rates and funding costs – i.e. do banks pass
on increased funding costs more than decreased costs to borrowers. Another possible
extension would be to model the spreads between lending and funding rates directly, using one
of the theoretical frameworks discussed above, as applied in many overseas studies.
REFERENCES
Banerjee, A. Bystrov,V. and Mizen, P. (2012). "How do Anticipated Changes to short-term
Market Rates influence Banks' Retail Interest Rates? Evidence from the Four Major Euro Area
Economies". Banque de France Working Paper N. 361 .
Cecchin, I. (2011). "Mortgage Rate Pass-through in Switzerland". SNB Working Paper 2011-08.
Diebold, F., Rudebusch, G. and S. Aruoba (2006) "The Macroeconomy and the Yield Curve: A
Dynamic Latent Factor Approach", Journal of Econometrics, Vol.131 pp.309-338
Reserve Bank of New Zealand Analytical Note Series 12 _____________________________________________________________
Eckhold, K. (1994). "The Behaviour of Mortgage Interest Rates in New Zealand". Reserve Bank
of New Zealand Bulletin , 57 (4), pp. 341-345.
Gropp, R. Sorensen C. and Lichtenberger, J. (2007). "The Dynamics of Bank Spreads and
Financial Structure". ECB Working Paper 714 .
Ho,T. and Saunders, A. (1981). "The Determinants of Bank Interest Margins: Theory and
Empirical Evidence". Journal of Financial and Quantitative Analysis , 16 (4), 581-600.
Klein, M. (1971). "A Theory of the Banking Firm". Journal of Money, Credit and Banking , 3 (2
Part 1), 205-218.
Krippner, L. (2010). "Connecting the Dots: A Yield Curve Perspective on New Zealand's
Interest Rates". Reserve Bank of New Zealand Bulletin , 73 (3), pp. 5-19.
Krippner, L. and Thorsrud, L. (2009). "Forecasting New Zealand's economic growth using yield
curve information". Discussion Paper 2009/18 . Reserve Bank of New Zealand.
Mannasoo, K. (2012). "Determinants of Bank Interest Rate Spreads in Estonia". Working Paper
1/2012 . Bank of Estonia.
Maudos, J. and Fernandez de Guevara, J. (2004). "Factors Explaining the Interest Margin in
the Banking Sectors of the European Union". Journal of Banking and Finance , 28, 2259-2281.
Saunders, A and Schumacher, L. (2000) "The Determinants of Bank Interest Margins: An
International Study", Journal of International Money and Finance, 19, 813-832
Wong, J. (2012) "Bank Funding - The Change in Composition and Pricing", Reserve Bank of
New Zealand Bulletin, 75(2), pp.15-24
Wu, T. (2002). "Monetary Policy and the Slope Factor in Empirical Term Structure Estimations".
Working Paper 2002-07 , Federal Reserve Bank of San Francisco.
Wu, T. (2003). "What Makes the Yield Curve Move?" Economic Letter 2003-15, Federal
Reserve Bank of San Francisco.

Reserve Bank of New Zealand Analytical Note Series 13 _____________________________________________________________
DATA APPENDIX Figure 4 Wholesale interest rates
Source: Bloomberg Figure 5 5-year credit default swaps on four largest Australian banks
Source: Bloomberg
-4
-2
0
2
4
6
8
10
12
Feb-98 Mar-99 Apr-00 May-01 Jun-02 Jul-03 Aug-04 Sep-05 Oct-06 Nov-07 Dec-08 Jan-10 Feb-11
Slope 5yr - 3m Bank Bill 3 monthSwap 1 yr Swap 2 yrSwap 3 yr Swap 4 yrSwap 5 yr
Percent
0
50
100
150
200
250
Feb-03 Oct-03 Jun-04 Feb-05 Oct-05 Jun-06 Feb-07 Oct-07 Jun-08 Feb-09 Oct-09 Jun-10 Feb-11 Oct-11
ANZ NAB WESTPAC CBA Average
Basis Points
Reserve Bank of New Zealand Analytical Note Series 14 _____________________________________________________________
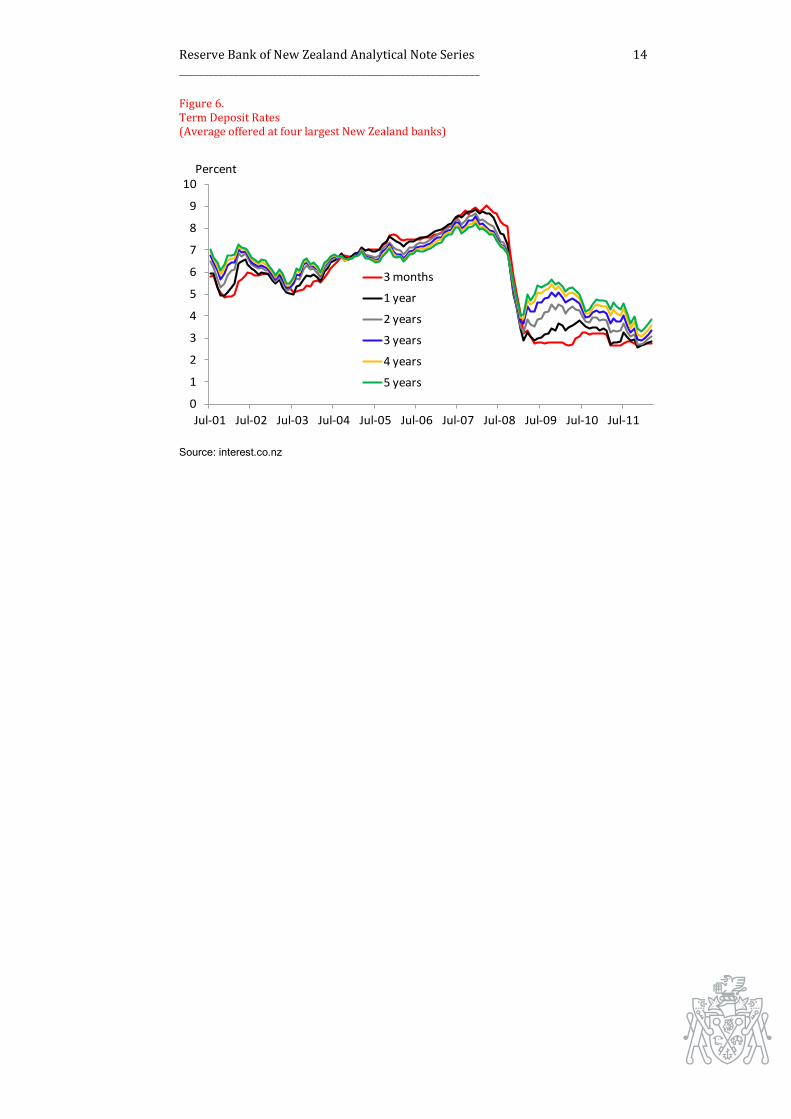
Figure 6. Term Deposit Rates (Average offered at four largest New Zealand banks)
Source: interest.co.nz
0
1
2
3
4
5
6
7
8
9
10
Jul-01 Jul-02 Jul-03 Jul-04 Jul-05 Jul-06 Jul-07 Jul-08 Jul-09 Jul-10 Jul-11
3 months
1 year
2 years
3 years
4 years
5 years
Percent


![The Distribution Of Mortgage Rates - RBA · The Distribution of Mortgage Rates Michelle Bergmann and Michael Tran[*] Photo: Simon Bradfield – Getty Images Abstract Mortgage interest](https://static.fdocuments.us/doc/165x107/5ee093a0ad6a402d666bbd5c/the-distribution-of-mortgage-rates-rba-the-distribution-of-mortgage-rates-michelle.jpg)


