6.i. Modelling environmental processes: kinetic and equilibrium (quasi-thermodynamic) modelling
Modelling heterogeneity and memory effects on the kinetic roughening of silica films grown bychemical vapor deposition
Fernando Ojeda,1, ∗ Rodolfo Cuerno,2, † Roberto Salvarezza,3, ‡ Fernando Agullo-Rueda,1, § and Luis Vazquez1, ¶
1Instituto de Ciencia de Materiales de Madrid (CSIC), Cantoblanco, E-28049 Madrid, Spain2Departamento de Matematicas & GISC, Universidad Carlos III de Madrid,
Avenida de la Universidad 30, E-28911 Leganes, Spain3INIFTA, Sucursal 4, Casilla de Correo 16, (1900) La Plata, Argentina
(Dated: April 11, 2003)
We present discrete and continuum models to describe previous experiments on growth of chemical vapordeposited silica films at 611 K and 723 K [F. Ojeda et al., Phys. Rev. Lett. 84, 3125 (2000)]. Silica filmsdeposited at 723 K show larger surface roughness already from the early stages of growth, a fact that was notexplained by a previously proposed phenomenological stochastic equation for the interface height. This largersurface roughness and the concomitant development of higher local slopes seem to be correlated with the Kardar-Parisi-Zhang asymptotic scaling observed for the high temperature conditions. Here we explain these featureson the basis of surface heterogeneity and short-range memory effects, which are assessed for our experimentalsystem through spectroscopic measurements. By incorporating these effects into a random deposition modeland related Langevin equations with correlated noise, we are able to account for the full set of experimentalobservations.
PACS numbers: 68.35.Ct, 81.15.Gh, 64.60.Ht, 05.10.Gg
I. INTRODUCTION
Low Pressure Chemical Vapor Deposition (LPCVD) is oneof the most frequently used techniques for thin film productionin several industrial applications.1 Silicon dioxide films havebeen extensively used in very large scale integrated (VLSI)devices. Knowledge and eventual control of the morphologyof silica films produced by CVD become very important asdevice dimensions are being continuously reduced. In partic-ular, this control becomes critical when conformal growth (i.e.good step coverage) is required. In typical LPCVD processes,the precursor species arrive at the growing interface followingrandom walk trajectories through the stagnant layer. This factimplies that protrusions at the interface tend to receive moreincoming particles than depressions,2–5 giving place to shad-owing effects among the various surface features. These ef-fects usually lead to unstable interfaces characterized by largesurface roughness. On the other hand, it is known4,6 that con-formal growth is promoted for those systems displaying lowsurface reaction kinetics (low sticking probability, in the lan-guage of Monte Carlo models of CVD6). Specifically, it isaccepted that the mechanism inducing conformal growth isreemission of the precursor (i.e. depositing) species due toa low sticking probability. For micrometer structures ontowhich conformal growth is required, much is currently knownon the interplay between effects such as shadowing and lowsticking probability. However, when considering conformalgrowth on submicron features, much less is known on the rel-ative balance between these mechanisms, and there is not suf-ficient control yet on growth conditions at these length scales.Therefore, due to the ever shrinking dimensions of technolog-ical devices, detailed study of CVD silica film morphology atsubmicron scales becomes necessary.
During the last decade or so the study of thin film growth
dynamics has attracted very large interest.7,8 Many of thesestudies, both theoretical and experimental, have been per-formed within the framework of the dynamic scaling Ansatz.9
Briefly, this is a statement on the time and scale invarianceof the film surface roughness or surface width, which is de-fined as σ(t) = [(1/L2)〈
∑
r(h(r, t) − h(t))2〉]1/2, where
h(r, t) describes the value of the surface height at time t aboveposition r on a substrate plane of lateral dimension L. Inwhat follows an over line will denote spatial average acrossa given sample and the brackets 〈·〉 will stand for averagesover different samples. For many surfaces evolving undernon-equilibrium conditions, it is observed7,8 that the rough-ness increases with deposition time as σ ∼ tβ , with β beingtermed the growth exponent. Surface features across the sub-strate plane, as measured by the characteristic lateral correla-tion length, ξ, also coarsen with time as ξ ∼ t1/z, with z anindependent dynamic exponent. Once ξ becomes larger thanL, the roughness saturates into a stationary value that scalesas σ ∼ Lα, with α = zβ being the roughness exponent.
Scanning probe microscopies, in particular Atomic ForceMicroscopy (AFM), are rather well adapted to quantitativelyanalyze the surface morphology. AFM allows measurement ofthe surface roughness over a wide range of length scales. Thisis important as it allows the assessment of the scale invari-ance of the surface features, and even distinguishing differ-ent scaling regimes with the corresponding crossover regions,which may exist for a given system. Thus, from the AFMdata it is possible to obtain the values of the three scalingexponents independently and compare them with those pre-dicted by the different growth models.7,8 We have followedthis procedure recently10 for experiments of CVD silica filmgrowth on Si(100) from silane/oxygen gas mixtures at two de-position temperatures, namely T = 611 K and 723 K, andkeeping a constant deposition rate of 20 nm/s. Under these
2
conditions the system presents high and low sticking proba-bilities, respectively, as has been reported in Ref. 12. Namely,an increase in temperature from 573 K to 723 K was experi-mentally observed to induce a decrease in the average stickingprobability, s, from s = 0.5 down to s = 0.08. Summarizingour previous results in Ref. 10, we found that the film surfacemorphology resulted from the competition between stabiliz-ing effects, such as surface diffusion and lateral growth, whichis the fingerprint of Kardar-Parisi-Zhang (KPZ)13 scaling be-havior, and unstabilizing effects, originating in shadowing ef-fects and the random arrival of the incoming particles. Forthe low temperature films the surface roughness increases un-boundedly, within the temporal window considered, due to theshadowing effects. On the contrary, for the high temperaturefilms the system eventually stabilizes into a state displayingthe asymptotic properties of the KPZ universality class. Infact, the surface roughness for T = 723 K approached sat-uration for very long deposition times. The physical originof the asymptotic KPZ stabilization for the high temperaturesilica films thus seems to be in the low sticking probability:under low sticking conditions, the shadowing effects charac-teristic of the CVD processes are counterbalanced by a moreeven redistribution of the incoming particles across the filmsurface through re-emission processes. As the correspond-ing observed scaling behavior is KPZ, these processes actu-ally promote lateral growth. All these effects are accountedfor in the following continuum stochastic model we proposedphenomenologically in Ref. 10 to describe the low pressureCVD experiments
∂h
∂t= v − K∇4h + ε
θ
θ+
λ
2(∇h)2 + η(x, t), (1a)
〈η(x, t)η(x′, t′)〉 = 2Dδ(x − x′)δ(t − t′). (1b)
In Eq. (1a) the lhs represents the local velocity of the growinginterface. The first term on the rhs is the average growth ratefor a flat interface; the second term represents relaxation bysurface diffusion due to curvature gradients14, the third termrepresents geometric shadowing effects,15,16 θ being the lo-cal exposure angle and θ the spatial average of θ, and thefourth nonlinear term accounts for growth along the local nor-mal direction13 (lateral growth). The term η(x, t) in (1) is azero-average Gaussian white noise which represents micro-scopic fluctuations in the attachment-detachment events at thegrowing surface. The parameters K, ε, λ, and D are positiveconstants.10
Simulations of model (1) for a one-dimensional substrate—the asymptotic properties of two-dimensional substrates areprohibitive for numerical simulations due to the computa-tional requirements of the shadowing term16— reproducedqualitatively the observed behavior for both deposition tem-peratures, assuming that the KPZ coefficient, λ, was larger at723 K. There is, however, one important point that remainedunaccounted for by model (1); namely, the films grown un-der low sticking conditions (high temperature) were rougher,i.e. the numerical value of σ was larger, than those depositedunder high sticking conditions (low temperature). We shouldemphasize that this difference occurs already from the verybeginning of the deposition experiments. This counterintu-
itive feature —the films produced under a more stable dy-namics are rougher— cannot be explained by model (1) sincethe second and fourth terms in Eq. (1a), having stabilizingeffects, are actually more important under the high tempera-ture deposition conditions.10 Specifically, the fourth derivativeterm describes surface diffusion, which operates on relativelyshort length scales. Therefore, its influence on the surfacemorphology should be more clearly appreciated in the earlystages of growth. This would cause the low temperature filmsto be rougher than the high temperature set, at least at shortgrowth times. However, our observations contradict this ex-pectation, justifying our previous statement that surface diffu-sion cannot be held responsible for the larger roughness at ahigher temperature. Another physical mechanism that mightcorrelate with the different roughness values for the two tem-perature conditions is the difference in their grain nucleationrates. However, for our system this influence is likely to beovercome by by the low sticking probability effects at hightemperatures. Even if the grain nucleation rate were smallerat high T (which is doubtful since the flux of species is higherin order to achieve the same growth rate, common for bothtemperature conditions), the lower sticking probability is ex-pected to counteract the potential excess roughness inducedby this effect.
In this paper we provide an explanation for the observed be-havior of the roughness that, beyond accounting for the samescaling properties as model (1), is able to reproduce the largervalue of σ for the more stable growth condition. The originof this feature is traced back to chemical heterogeneity at thesurface of the growing film, which we assess by spectroscopicmeasurements. In brief, the existence of surface species atwhich growth is more efficient than others, combined withmemory effects which occur during silica CVD growth, en-hances surface roughness. This non-uniformity among sur-face sites is stronger at high temperatures.
We first study the chemical and morphological propertiesof the surface —the latter as measured by AFM— in Sects. II,III. After this, we devote Sects. IV, V to propose a general-ized model which is able to reproduce the full set of observa-tions. Specifically, in Sec. IV we demonstrate by means of thesimplest discrete growth model [namely, random deposition7
(RD)] how surface heterogeneity coupled to memory effectsdoes lead to enhanced roughness. Based on results in this sec-tion we then generalize in Sec. V the continuum model (1) inorder to account for these effects. We will show that a contin-uum equation like (1), but in which the noise has short rangetemporal correlations17 —rather than being white as in Eq.(1b)— accounts for the increased roughness maintaining thesame observed scaling behavior. Physically, the correlationsof the noise arise from the coexistence of memory effects andsurface heterogeneity during silica CVD growth.18,19 It is im-portant to stress that these new findings do not invalidate ourprevious results concerning the CVD silica growth evolution,rather they contribute to a more detailed understanding of sucha complex growth process.

3
II. EXPERIMENTAL
Amorphous SiO2 films were grown at a temperature T =723 K (low sticking condition) and T = 611 K (high stick-ing condition) on Si(100) substrates in a hot wall, horizontal,low pressure tubular CVD reactor. The precursor gases weresilane (diluted at 2% in nitrogen, 99.999% purity) and oxy-gen (99,9992% purity), with an oxygen/silane ratio equal to20 and a total gas flow rate, Rg, of 50 and 250 sccm, respec-tively. The chamber pressure was 1.4 Torr. The film thicknessincreased linearly with deposition time at a constant growthrate of 20 nm/min for both temperature conditions. Filmswere deposited in the range 5 min ≤ t ≤ 2 days in order to beable to observe the asymptotic growth behavior. It should benoted that due to the many processes occurring in the CVD ex-periment a precision better than 1 min in deposition time is un-reachable with our experimental setup. The surface morphol-ogy was characterized by AFM (Nanoscope III from DigitalInstruments, CA) operating in tapping mode at ambient con-ditions over length scales ranging from 50 nm up to 50 µm.Silicon cantilevers were employed. Films were also character-ized by infrared (IR) and Raman spectroscopies. UnpolarizedRaman spectra were taken with a Renishaw Ramascope 2000microspectrometer and an Ar+ laser (514.5 nm) for excitation.
III. MORPHOLOGICAL AND CHEMICALCHARACTERIZATION
Fig. 1 shows 500 × 500 nm2 AFM images of our silicafilms grown for 20 min at 611 K [Fig. 1(a)] and 723 K [Fig.1(b)]. The deposit is formed by small rounded grains 30-60nm in size. Indeed, these images indicate that the surface filmroughness, σ, is larger for the high temperature set alreadyat short deposition times. This difference persists up to verylong deposition times, as can be appreciated in Figs. 1(c) and1(d), that show 14 × 14 µm2 AFM images taken after 2 daysof deposition. The differences between the film morpholo-gies obtained for the two temperature conditions are clear, inparticular the protrusions of µm size appearing only for the611 K set of films. However, the 723 K films still have largerroughness values than the 611 K sets.
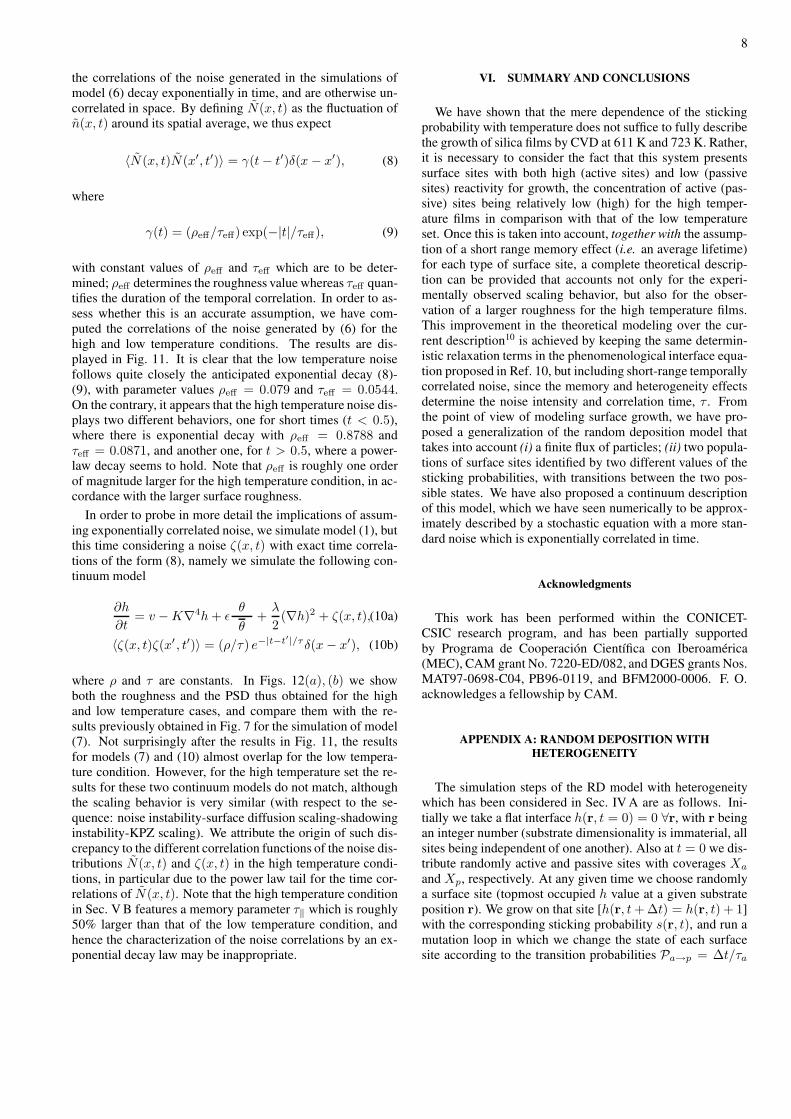
Figs. 2(a)-(c) show results for the main morphologicalcharacterization of the high and low temperature films. First,the plot of σ as a function of time [Fig. 2(a)] shows quantita-tively that the surface roughness is larger for the 723 K films(low sticking set) than for the 611 K ones within the wholetemporal window studied. This effect is also observed in Fig.2(b), which displays the power spectral density (PSD) of thesurface morphology for films deposited after 2 days for bothtemperature conditions. The PSD is defined as
PSD(k, t) =4π2
L2〈h(k, t)h(−k, t)〉, (2)
where h(k, t) is the 2D Fourier transform of h(r, t) − h(t)and k is the wave-vector of modulus k = |k|. For a roughsurface the PSD function behaves generically as7,8 PSD(k) ∼
k−2α−2, hence from a logarithmic plot of the PSD vs k onecan extract the value of the roughness exponent at the corre-sponding length scales. Fig. 2(b) thus shows the scaling be-havior at long times for the two temperature conditions. Filmsdeposited at 611 K [lower panel of Fig. 2(b)] display an ini-tial scaling region dominated by surface diffusion relaxationprocesses (α ' 1) with an asymptotic unstable (α ' 0.7)scaling behavior dominated by shadowing effects.10 On theother hand, films grown at 723 K [upper panel of Fig. 2(b)]display also an initial scaling region due to surface diffusioneffects followed by an unstable regime. However, the asymp-totic regime results into KPZ scaling behavior (α ' 0.4,β ' 0.25). It is worth mentioning that the identification of thevarious growth regimes in Ref. 10 was done after obtainingthe three (α, β, and 1/z) scaling exponents independently.11
We have also analyzed the average slope across the filmsurface, m, for both sets as deposition proceeds. Specifically,the surface slope was computed at different sites on the AFMscan for each sample from linear fits by least squares overa fixed window size, `, and was then spatially averaged inorder to obtain the average slope m. Fig. 2(c) shows theevolution of m with time for ` = 200 nm. It can be seenthat m is also always larger for the high temperature con-dition already from the early stages of growth. In principle,the observed difference in surface slope is directly related tothat in surface roughness, since surface diffusion effects arequite similar at both temperatures. Moreover, the larger sur-face slope observed for the high temperature set appears to becorrelated with the KPZ behavior observed in the long tem-poral and spatial scales corresponding to this set of films10.Note that actually the KPZ non-linearity is an increasing func-tion of m. These phenomena seem reminiscent of the stabi-lization by a KPZ non-linearity of dynamical instabilities oc-curring in the Kuramoto-Sivashinsky equation and its noisygeneralizations20,21. In any case, it seems that the elucidationof the origin of the increased surface roughness, and accord-ingly of the surface slope, is important in order to provide afull description of our system.
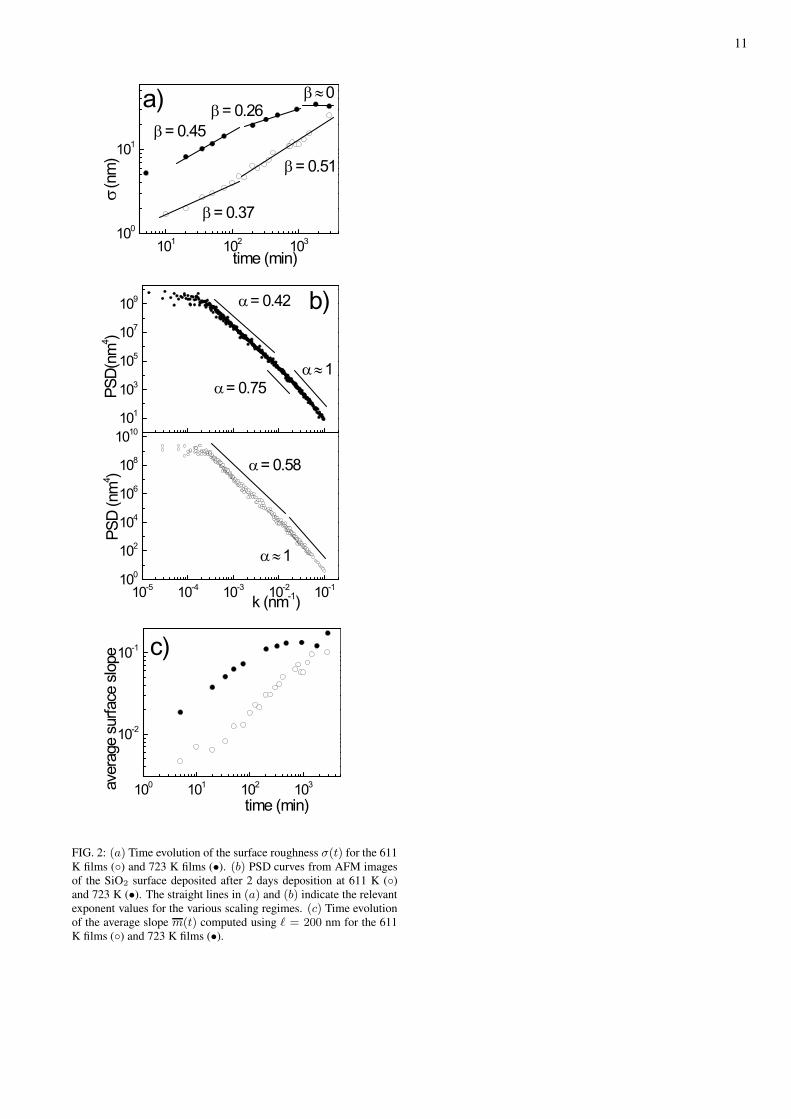
In order to provide a complete characterization of the filmmorphology beyond the mean and the variance of the surfaceheight, we have computed various moments of the height-difference distribution, namely the values of the function
Cq(r, t) = 〈|h(r1, t) − h(r2, t)|q〉, (3)
for different values of q, where r = |r1 −r2|. For multi-affinesurfaces, each of this moments scales as Cq(r) ∼ rqαq with anexponent αq which is different for each value of q.7 It is onlyfor truly self-affine surfaces that α ≡ αq has a constant valueindependent of q, and thus Cq(r) ∼ rqα. In Fig. 3 we showthe results obtained for the q-th root of the functions (3) (q =1, 2, 3, 4) for the films deposited at both temperatures, at timest = 35 min. [Fig. 3(a)] and t = 2 days [Fig. 3(b)]. Note that,once taken the q-th root, the different moments are parallelto one another in these logarithmic plots, meaning that ourexperimental surfaces are truly self-affine objects in the sensedefined above. This is an important consistency check for ourmorphological analysis, to be considered again later when weconsider theoretical models of our experimental system.

4
As stated before, a mechanism which is potentially respon-sible for the morphological differences between the two tem-perature conditions studied is the variation with temperatureof the sticking probability, s. In order to further investigatethe implications of this change we have analyzed the filmstructure by means of IR and Raman spectroscopies. Phys-ically, s can be related both to the surface coverage and thechemical activity of reactive sites at the growing film surface.For our system these sites are mainly associated with hydro-genated groups, such as SiOH and SiH, and with strainedsiloxane (SiOSi) groups, rather than with the less reactiverelaxed siloxane groups.22–24 However, the activity of thesereactive sites is different. For instance, the SiH bond weak-ness makes it a preferentially reactive site for film growth ascompared with SiOH groups. Consequently, it is necessary tostudy the relative concentrations of the various reactive siteson both sets of films. We have quantified the concentrationof SiH and SiOH groups by IR spectroscopy (see Fig. 2 ofRef. 25) for both sets of films. The most important resultis that concerning the SiH content, which is at least one or-der of magnitude higher for the 611 K films than for the 723K samples. Besides, for the film grown at low temperature,the Raman spectrum [Fig. 4] shows a clear peak, R2, whichhas been related to the concentration of highly strained two-membered siloxane rings.26 These sites are expected to havea reactivity 10 times that of the SiOH groups under typicalCVD conditions.27 The present data allow us to conclude thatthe films grown at 611 K feature a higher content of strained(SiH, strained siloxane) groups than the 723 K set. Thus, thesefilms should have a higher internal stress than the high tem-perature films, which is consistent with the higher refractionindex of the former.25 If the internal stress were relevant tothe morphological features a higher value would induce largerroughness, thus the films grown at 611 K should be rougherthan those produced at 723 K, contrary to what is observed.Hence, internal stress can be overlooked as a main physicalmechanism in order to account for the behavior observed inour system.
In Table I we summarize our measurements by IR andRaman spectroscopies for the ratios of the relative concen-trations of the different reactive sites between both sets ofsamples.25 It is clear that the relative concentrations of thevarious reactive sites is always higher for the low tempera-ture films than for the high temperature ones, in agreementwith the reported12 values of the average sticking probabil-ity. From these data it is evident that both sets of films haveboth active and passive (namely, less active) sites, and thatthe high temperature set presents a lower concentration of ac-tive sites than the low temperature set. On the other hand, ithas been recently reported18,19 for silica CVD films depositedfrom TEOS/ozone precursors, that there exist memory effectsduring growth which influence the final film morphology, inparticular the film surface roughness. These memory effectsare related to the existence of surface sites of different activ-ities for deposition, and to the persistence in time of the ac-tivity properties for a given site on the substrate plane. Thus,the growth mode becomes site-dependent. In the experimentsof Refs. 18,19, the surface distribution of active sites was
strongly linked to the type of initial substrate. For a systemwith an initially high concentration of active sites the grow-ing film obtained was quite smooth, whereas when islands ofactive sites existed a finger-like, unstable, growth mode de-veloped. For the latter system the memory effects have a highdegree of persistence, both in space (because of the formationof islands of active sites) and in time. This long persistencefinally causes development of finger-like structures. However,for the former system, the main cause for the film smoothnessis the high and homogeneous concentration of active sites. Itis worth mentioning that in the SiH4/O2 CVD system, mem-ory effects are consistent with the chemical nature of the de-position process. In such a process, hydrogenated SiOmHn
species, which are formed in the gas phase, are expected tobe the predominant precursors. Once deposited, these specieswould lead to renewed active sites, such as ≡SiH, and wouldbe eventually converted into passive sites through different de-hydrogenation/passivation mechanisms.28
Summarizing our experimental data, it seems that our sys-tem could be described as an heterogeneous surface, beingcomposed by two types of sites, active and passive, with dif-ferent sticking probabilities. At 611 K and 723 K the concen-trations of these species are quite different, leading to differ-ent values of the average sticking probability, s, in agreementwith previous reports.12 Thus, a complete theoretical modelshould incorporate these facts, as well as the memory effectsmentioned above, in order to account not only for the differ-ent surface scaling behaviors obtained at the two temperaturevalues considered, but also for the different film roughnessesobtained.
IV. DISCRETE MODEL
In this section we take a first step in the formulation of ageneralized model which reproduces the experimental obser-vations. We thus now consider the simplest discrete growthmodel which incorporates surface heterogeneity and memoryeffects. At this point, it is necessary to stress that our aim isnot to develop a fully atomistic model accounting for the var-ious growth processes pertinent to the above effects. Rather,we wish to describe our system statistically, in terms of distri-butions of active and passive sites, which may actually changewith growth time.
As seen above, our silica films feature both active and pas-sive surface sites. Thus, it is reasonable to assume that mem-ory effects analogous to those in Refs. 18,19 may also playan important role in CVD silica growth from silane precur-sors. However, memory effects of long persistence combinedwith formation of permanent islands of active sites should bediscarded since we do not observe finger-like voided struc-tures. Hence, and although we have found for our experimen-tal system that there are active sites with varying reactivities,we can assume, within the simplest approximation, that thereare only two types of sites, namely, active sites, with localsticking probability sa, and passive sites with sticking prob-ability sp ≤ sa. Sites are distributed across the surface withsurface coverages Xa and Xp = 1 − Xa, respectively. Both

5
types of sites have relatively short average lifetimes for ex-change of site state (active to passive, or viceversa), τa andτp, respectively. On average, for t > τj a surface site oftype j = a, or p has lost the memory of its previous state.Moreover, in principle the values of Xa and Xp change withdeposition temperature, as observed by IR and Raman spec-troscopies. The average sticking probability, s, is given in thismodel by s = saXa + spXp. For such a system the timeevolution of the surface coverages is provided e.g. by
dXa
dt= −
Xa
τa+
Xp
τp, (4)
whose solution is of the form Xa(t) = τ‖/τp +const. exp(−t/τ‖), where τ‖, defined as
τ‖ =
[
1
τa+
1
τp
]−1
(5)
is thus the natural time scale in the system.29 As a conse-quence, a stationary state is eventually reached for t & 5τ‖, inwhich Xaτp = Xpτa.
A. Monte Carlo simulations of random deposition withheterogeneity
We will next incorporate the above approximate descrip-tion of memory effects and surface heterogeneity into a sim-ple discrete dynamical model amenable to Monte Carlo typenumerical simulations. Specifically, we simulate a randomdeposition7 process with average deposition flux F , and pop-ulations of active and passive sites as in the previous para-graph, with sticking probabilities sa and sp, and surface cov-erages Xa and Xp = 1 − Xa. Thus the average growth rateis v = ΩFs = ΩF (saXa + spXp), where Ω is the volumeof the aggregating units, that will be set to unity in what fol-lows. As described above, the memory effect is accounted forby including lifetimes τa and τp for the a → p and p → astate changes of surface sites, respectively. The specific im-plementation of these model features is provided in AppendixA. It is important to recall that for standard homogeneous RD7
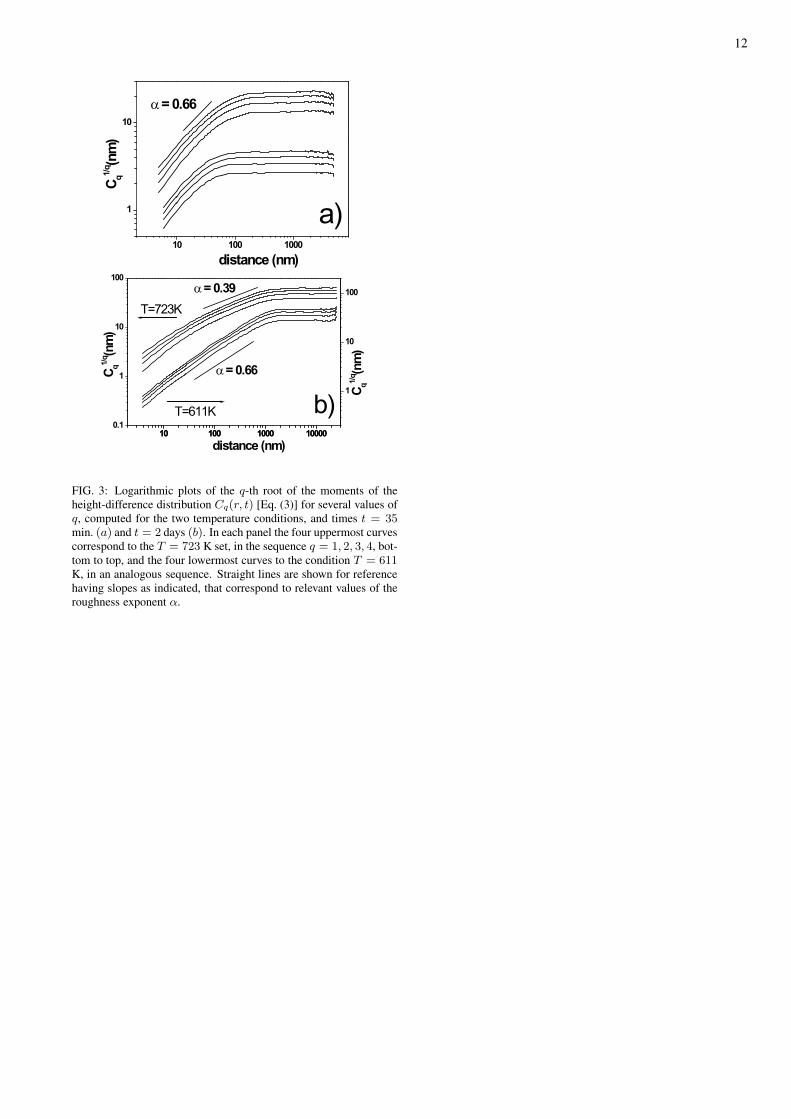
the scaling behavior of the surface roughness is as σ ∼ t1/2.Fig. 5(a) shows the time evolution of the roughness for a sys-tem with τ‖ = 0.05 (τa = τp = 0.1) and s = 0.5 for twoconfigurations, namely, homogeneous (sa = sp = 0.5 andXa = Xp = 0.5) and heterogeneous (sa = 0.8; sp = 0.2,and Xa = Xp = 0.5), and for different values of the flux F(i.e. different growth rates v). As it is clear from the figure,the numerical value of σ increases for larger F values, but thetemporal scaling behavior (i.e. the slope of the curve) is in-dependent of the flux. Moreover, the difference in roughnessbetween the homogeneous and the heterogeneous configura-tions increases for increasing F . That is, the heterogeneousconfiguration presents the same scaling behavior as the ho-mogeneous one but with an increased roughness at all times,this effect being more pronounced the larger the product Fτ‖is. The physical interpretation is clear. When the effective
lifetime, τ‖, of an arbitrary surface site is shorter than the av-erage time between two successive arrivals of incoming par-ticles at this site, which is proportional to 1/F , the site haseffectively lost memory, and deposition takes place on a tem-porally uncorrelated surface. As a consequence, under theseconditions there is practically no difference between deposi-tion on a homogeneous and a heterogeneous surface. How-ever, when τ‖ > 1/F the surface site does keep memory of itsactive or passive state during two consecutive arrivals of par-ticles. Fig. 5(b) shows the change of the roughness with depo-sition time for fixed flux and average sticking coefficient forthe homogeneous and heterogeneous configurations. For thelatter, three different cases are shown, corresponding to threedifferent values τ‖ = 0.005, 0.05, and 0.5. It is clear that forshort lifetimes the system behavior (i.e. scaling and numeri-cal roughness) is the same for both configurations. However,for long enough lifetimes the roughness value of the heteroge-neous configuration is clearly larger than that of the homoge-neous configuration without an appreciable change in the scal-ing behavior. From these simulations we can derive importantpreliminary results. First, it is necessary to have different ac-tive species (with different local sticking probabilities) in or-der to obtain an increase in the roughness. The memory effectby itself is not enough to cause an enhanced roughness. Thisis clear from Fig. 5, as the lowest roughness values are alwaysobtained for the homogeneous configuration. Thus, two ef-fects, namely the short-range memory effect and the existenceof different species with different sticking coefficients, are re-quired to develop an increased roughness without changingthe scaling behavior.
V. CONTINUUM MODELS
The results obtained in the previous section, even thoughcorresponding to a very simple model, already provide us withvaluable insight into the mechanisms which underlie the be-havior of the roughness in our experimental system. In thissection we exploit this insight in order to formulate a con-tinuum model which will ultimately incorporate relaxationmechanisms on the surface (and thus, as a difference to RD,correlations among different surface sites). This will allow usto account not only for the difference between the numericalvalues of the roughness for different temperature conditions,but also for the complex scaling behavior observed in Fig. 2,clearly well beyond description by the simple RD model.
A. Continuous time without surface relaxation
In order to formulate a continuum analog of model (1) thattakes into account heterogeneity and memory effects, we startby putting forward a continuum version of the discrete RDmodel simulated in the previous section. To this end, we con-
6
sider the following stochastic continuum model
∂h
∂t= F s(x) + n(x, t), (6a)
〈n(x, t)n(x′, t′)〉 = F s(x) δ(x − x′)δ(t − t′). (6b)
In the homogeneous case [s(x) = const. ∀x] this equationis well known7 to provide a correct description of the stan-dard RD model. Note that in our generalized heterogeneouscase the sticking probability s(x) is a site-dependent quan-tity. Moreover, as in the standard RD case for which the noisestrictly follows a Poisson distribution, we have taken the vari-ance of the Gaussian noise n(x, t) in (6) equal to the localgrowth rate F s(x).
Similarly to Ref. 30, we now perform a numerical inte-gration of model (6) by a standard Euler scheme17 with theadditional mutation loop as in Appendix A at each time step(length δt), in which we reset the state (active/passive) of eachsurface site according to the corresponding transition prob-abilities. Results of these simulations are shown in Fig. 6.Active sites have been taken with local sticking probabilitysa = 1 and passive sites with sticking probability sp = 0.01.The lifetime of active sites, τa, has been fixed to 0.1. Wehave simulated two system configurations resembling thoseof our films of 611 K (s = 0.4) and 723 K (s = 0.08). Here,the value of the average sticking probability employed for thelow temperature set has been taken from a linear interpolationfrom experimental data avaliable for our system.12 In orderto reproduce the experimental constraint that the growth ratebe equal for the two temperature conditions, different valuesof F have been chosen so that v = ΩF s is the same. Itshould be noted that F is not directly accessible in experi-mental CVD systems, being determined by many other com-plex factors, such as reactivity of the gas mixture, precur-sor diffusivity through the stagnant layer, or residence timeof the precursor species in the reactor.25 However, the totalgas flow rate, Rg , allows indirect control over these, so thatthe actual growth rate (i.e. v = ΩFs) has the same valuefor both temperatures, as stated in Sec. II. Thus, in partic-ular F and Rg do not have the same physical meaning. Onthe other hand, the values of Xa for both temperature con-ditions have been chosen according to the lower concentra-tion of active sites found in the high temperature set. Thischoice fixes the ratio Xa(611 K)/Xa(723 K) = 5.7 and, ac-cordingly, Xp(723 K)/Xp(611 K) = 1.56. These parame-ters imply that the corresponding memory effects last for ' 9monolayers and ' 6 monolayers for the 733 K and 611 Kfilms, respectively. Fig. 6 shows that both systems present thesame scaling behavior (namely, that of standard RD) but theroughness increases for the high temperature system. More-over, the ratio σ(723 K)/σ(611 K) = 3.3 is of the same or-der of magnitude as that observed experimentally (see Fig. 2).Thus, in principle, the above choice of the parameters seemsconsistent with our experimental observations.
B. Continuous time with surface relaxation
The simulations performed for the continuum model (6) inthe previous section are important because they allow us togenerate independent realizations of a stochastic perturbationn(x, t) [defined as the whole rhs of Eq. (6a) for each value of xand t] which features correlations induced by the heterogene-ity and memory effects. The next step we will take is to finallyadd correlations among different surface sites —thus far takenas independent— by means of appropriate deterministic sur-face relaxation mechanisms. For this we can rely on our pre-vious work,10 as expressed in the deterministic terms alreadypresent in Eq. (1a), whose physical interpretation has been al-ready discussed. Thus, we propose the following stochasticequation for our CVD silica films
∂h
∂t= −K∇4h + ε
θ
θ+
λ
2(∇h)2 + n(x, t). (7)
We stress that the noise term n(x, t) is defined as the rhs ofEq. (6a) as generated in those simulations, so that we do nothave an analytic expression for its correlations. In particular,n(x, t) does not have in principle zero average. A more com-plete statistical characterization of n(x, t) is presented belowin Sec. V C.
Results of our simulations of Eq. (7) are shown in Fig. 7(a)-(c) for parameters values L = 512, K = 1, ε = 1, andδt = 0.01. Three simulations are shown, one including thelow temperature noise and λ = 0.01 (dashed line), and twoother for the high temperature noise for λ = 0.01 (solid line)and λ = 0.04 (dotted line). Note that the numerical values ofthe exponents α and β depend on dimensionality, and thus dif-fer in the experiments and in our numerical simulations. How-ever, the qualitative type of scaling is the same.11 Namely, forthe three parameter choices in Fig. 7(a) an unstable regionwith β & 0.5 is observed for very short times. This zone cor-responds to the temporal range characteristic of the memoryeffects (i.e. t ≤ τ‖). For the low temperature system we findafter this transient a time regime within which β ' 0.39. Thisvalue is close to that expected for a growth process determined—on a one dimensional substrate— by linear surface diffusionrelaxation effects.7,8 Finally, for long times the behavior of theroughness for low temperature is described by β & 0.5, indi-cating unstable growth due to the shadowing term included in(7). For the high temperature system two simulations are pre-sented for two different values of λ. If λ = 0.01 (solid line)we observe that after the initial transient t ≤ τ‖ a long timeregion appears with β ' 0.4. For longer times σ seems toreach the asymptotic KPZ behavior (namely, β = 0.33). Thiseffect is more evident in the simulation with λ = 0.04 (dottedline). In this case, initially for t & τ‖ an unstable region dueto the shadowing term dominates growth, but is followed forvery long times by KPZ scaling. Two important facts need tobe stressed. First, except for t ≤ τ‖ the scaling behavior of (7)is similar for both temperature conditions to that found exper-imentally (see Fig. 2) and previously reported. In this respect,Eq. (7) retrieves the experimentally correct scaling behavioralready accounted for by model (1). Second, the numericalvalue of the roughness increases for the high temperature set

7
(independently of the λ value) with respect to the low tem-perature set, as is observed experimentally (Fig. 2) but Eq. (1)does not predict.10
In order to completely characterize the surface morpholo-gies predicted by Eq. (7), Fig. 7(b) shows the PSD curvesobtained from the simulation of (7) for the same three setsof conditions as in Fig. 7(a).11 For the low temperature set(dashed line) two scaling regions are found. For large kvalues, α ' 1.5, which again implies that at these lengthscales surface diffusion relaxation processes are prevalent.7,8
For smaller k values α ' 1, which corresponds to the unsta-ble region observed in Fig. 7(a). For the high temperature set(both values of λ) the linear surface diffusion region is alsoobserved for larger k values. For smaller k a short intermedi-ate region characterized by α ' 0.8 is also observed, but foreven smaller k values (i.e. larger length scales) the value ob-tained, α ' 0.5, is close to the one dimensional KPZ behavior.Essentially, the same behavior found in Fig. 7(a) is observed,but now the initial surface diffusion region is more clearly ob-served. Again larger roughness is obtained for the high tem-perature set. One detail worth mentioning is that the transientregion associated with surface diffusion is smaller for the hightemperature set than for the low temperature one. This factwas also observed experimentally, but a clear account was notfound until now. The surface diffusion transient could not beclearly seen in the experimental plots of σ(t) for both tem-peratures, rather only the unstable and KPZ (for T = 723K) regions could be seen. However, all three regimes wereobserved in the PSD curves, in agreement with the presentsimulation results. An additional experimental feature whichagain is well accounted for by Eq. (7) is the time evolutionof the average slope. Results are shown in Fig. 7(c) for m asobtained in simulations of Eq. (7) for the high (λ = 0.04) andlow (λ = 0.01) temperature conditions. This plot comparesfavorably with the experimental results in Fig. 2. Additionally,and in parallel with our analysis of the experimental data, wehave verified the self-affine character of the simulated surfaceprofiles. The results shown in Fig. 8 effectively correspond toa truly self-affine interface in which there is only one indepen-dent roughness exponent, again in qualitative agreement withthe experimental results.
We can finally compare the results of the simulation of (7)for the high and low temperature conditions with the experi-mental data in terms of the actual surface morphologies. Fig.9 shows the evolution of the surface profiles obtained afterthe simulations of (7) employing the high [Fig. 9(a)] and low[Fig. 9(b)] temperature conditions together with the experi-mental profile evolution for both temperatures [Figs. 9(c) and(d)]. Note that whereas in the simulated profiles the time evo-lution of the position of a given point can be easily followed,this is not the case in the experimental profiles, because eachAFM snapshot corresponds to a different sample. Note more-over that the experimental profiles correspond to 14 µm widescans of the type of Figs. 1(c), (d), rather than 500 nm widescans like those in Figs. 1(a), (b). For the low temperatureconditions the simulated profiles are characterized by devel-opment of protrusions [indicated by dashed lines in Fig. 9(a)].With time, these protrusions persist, growing both vertically
and laterally, leading to highly asymmetric profiles. The be-havior is quite different for the high temperature conditions[Fig. 9(b)]. Under these conditions large protrusions can ap-pear (dashed lines) but they grow laterally rather than verti-cally and eventually disappear, in agreement with the higherrelevance of the KPZ term in Eq. (7). Figs. 9(c) and (d) showthe experimental profile evolution for 611 K and 723 K sets.For the low temperature films large, cauliflower-like10 protru-sions develop, which are asymmetric along the growth direc-tion. These features grow both laterally and vertically withdeposition time, alike to those observed in the simulated pro-files [see Fig. 9(a)], in particular for the longest depositionand simulation times. On the contrary, for the high temper-ature set the surface profile does not show large protrusions,but rather tends to saturation.
In Fig. 7(a) it was observed that for the initial stages ofgrowth, t ≤ τ‖, before the surface diffusion mechanism op-erates, an unstable region develops. This initial region is notshown in the surface profiles of Fig. 9(a). Hence, it is inter-esting to show [Fig. 10(a)] the surface profiles for the veryearly stages of growth when memory effects are predominant.Fig. 10(a) shows that for the high temperature conditions, inwhich t ≤ τ‖ = 0.093, needle-like structures develop. Thisfast vertical growth is due to the memory effect of the active(i.e. growing) surface sites. However, for t > τ‖ when the sur-face sites have already lost memory, surface features begin togrow also laterally. In Fig. 10(b) we plot the evolution of thesurface roughness during the very first stages of growth, forthe high temperature conditions. Clearly, for the time rangein which the surface sites have memory of their state (t ≤ τ‖)a large instability (β ' 0.9) develops, which is reduced fort > τ‖. The shortest deposition time in our experimental sys-tem was 5 minutes. Since we have not detected this initialunstable regime, it is reasonable to conclude that the mem-ory effect for our system lasts less than 5 minutes. It is worthmentioning that a memory of 9 and 6 monolayers was set forthe high and low temperature conditions in our simulations.These magnitudes led to σ(723K) ' 3σ(611K), which is inthe same range as the ratio found experimentally. These mag-nitudes of the memory effect would lead, for the actual v = 20nm/min, to average lifetimes clearly shorter than 1 minute, inqualitative agreement with the experimental results.
C. Exponentially time correlated noise with surface relaxation
The analysis in the previous section consisted in the nu-merical simulation of our former Eq. (1a), but including thenoise obtained from the simulation of Eq. (6), rather than thesimple noise (1b) previously considered.10 This procedure hasenabled us to account for the whole set of morphological ob-servations both at high and low temperatures. A natural stepnow is trying to characterize the noise correlations existing inmodel (6), and, if possible, to account for them through an ap-propriate generalization of the continuum model (1a). Giventhat our model of heterogeneity involves populations of ac-tive and passive sites that decay according to exponential lawscharacterized by average lifetimes, a natural guess is17 that
8
the correlations of the noise generated in the simulations ofmodel (6) decay exponentially in time, and are otherwise un-correlated in space. By defining N(x, t) as the fluctuation ofn(x, t) around its spatial average, we thus expect
〈N (x, t)N(x′, t′)〉 = γ(t − t′)δ(x − x′), (8)
where
γ(t) = (ρeff/τeff) exp(−|t|/τeff), (9)
with constant values of ρeff and τeff which are to be deter-mined; ρeff determines the roughness value whereas τeff quan-tifies the duration of the temporal correlation. In order to as-sess whether this is an accurate assumption, we have com-puted the correlations of the noise generated by (6) for thehigh and low temperature conditions. The results are dis-played in Fig. 11. It is clear that the low temperature noisefollows quite closely the anticipated exponential decay (8)-(9), with parameter values ρeff = 0.079 and τeff = 0.0544.On the contrary, it appears that the high temperature noise dis-plays two different behaviors, one for short times (t < 0.5),where there is exponential decay with ρeff = 0.8788 andτeff = 0.0871, and another one, for t > 0.5, where a power-law decay seems to hold. Note that ρeff is roughly one orderof magnitude larger for the high temperature condition, in ac-cordance with the larger surface roughness.
In order to probe in more detail the implications of assum-ing exponentially correlated noise, we simulate model (1), butthis time considering a noise ζ(x, t) with exact time correla-tions of the form (8), namely we simulate the following con-tinuum model
∂h
∂t= v − K∇4h + ε
θ
θ+
λ
2(∇h)2 + ζ(x, t),(10a)
〈ζ(x, t)ζ(x′ , t′)〉 = (ρ/τ) e−|t−t′|/τδ(x − x′), (10b)
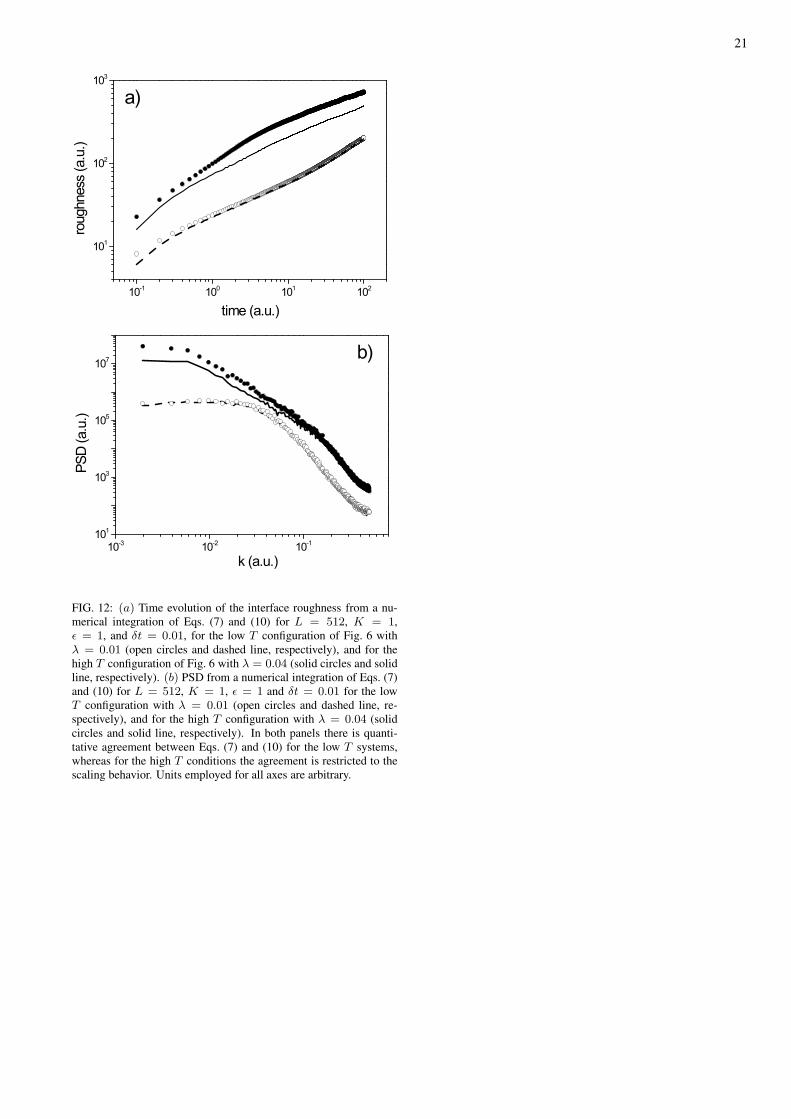
where ρ and τ are constants. In Figs. 12(a), (b) we showboth the roughness and the PSD thus obtained for the highand low temperature cases, and compare them with the re-sults previously obtained in Fig. 7 for the simulation of model(7). Not surprisingly after the results in Fig. 11, the resultsfor models (7) and (10) almost overlap for the low tempera-ture condition. However, for the high temperature set the re-sults for these two continuum models do not match, althoughthe scaling behavior is very similar (with respect to the se-quence: noise instability-surface diffusion scaling-shadowinginstability-KPZ scaling). We attribute the origin of such dis-crepancy to the different correlation functions of the noise dis-tributions N(x, t) and ζ(x, t) in the high temperature condi-tions, in particular due to the power law tail for the time cor-relations of N(x, t). Note that the high temperature conditionin Sec. V B features a memory parameter τ‖ which is roughly50% larger than that of the low temperature condition, andhence the characterization of the noise correlations by an ex-ponential decay law may be inappropriate.
VI. SUMMARY AND CONCLUSIONS
We have shown that the mere dependence of the stickingprobability with temperature does not suffice to fully describethe growth of silica films by CVD at 611 K and 723 K. Rather,it is necessary to consider the fact that this system presentssurface sites with both high (active sites) and low (passivesites) reactivity for growth, the concentration of active (pas-sive) sites being relatively low (high) for the high temper-ature films in comparison with that of the low temperatureset. Once this is taken into account, together with the assump-tion of a short range memory effect (i.e. an average lifetime)for each type of surface site, a complete theoretical descrip-tion can be provided that accounts not only for the experi-mentally observed scaling behavior, but also for the obser-vation of a larger roughness for the high temperature films.This improvement in the theoretical modeling over the cur-rent description10 is achieved by keeping the same determin-istic relaxation terms in the phenomenological interface equa-tion proposed in Ref. 10, but including short-range temporallycorrelated noise, since the memory and heterogeneity effectsdetermine the noise intensity and correlation time, τ . Fromthe point of view of modeling surface growth, we have pro-posed a generalization of the random deposition model thattakes into account (i) a finite flux of particles; (ii) two popula-tions of surface sites identified by two different values of thesticking probabilities, with transitions between the two pos-sible states. We have also proposed a continuum descriptionof this model, which we have seen numerically to be approx-imately described by a stochastic equation with a more stan-dard noise which is exponentially correlated in time.
Acknowledgments
This work has been performed within the CONICET-CSIC research program, and has been partially supportedby Programa de Cooperacion Cientıfica con Iberoamerica(MEC), CAM grant No. 7220-ED/082, and DGES grants Nos.MAT97-0698-C04, PB96-0119, and BFM2000-0006. F. O.acknowledges a fellowship by CAM.
APPENDIX A: RANDOM DEPOSITION WITHHETEROGENEITY
The simulation steps of the RD model with heterogeneitywhich has been considered in Sec. IV A are as follows. Ini-tially we take a flat interface h(r, t = 0) = 0 ∀r, with r beingan integer number (substrate dimensionality is immaterial, allsites being independent of one another). Also at t = 0 we dis-tribute randomly active and passive sites with coverages Xa
and Xp, respectively. At any given time we choose randomlya surface site (topmost occupied h value at a given substrateposition r). We grow on that site [h(r, t + ∆t) = h(r, t) + 1]with the corresponding sticking probability s(r, t), and run amutation loop in which we change the state of each surfacesite according to the transition probabilities Pa→p = ∆t/τa

9
and Pp→a = ∆t/τp. Here, ∆t = 1/(N0F ) with F the flux and N0 the total number of surface sites.
∗ Electronic address: [email protected]; Present addressTECNATOM, S.A., Avenida Montes de Oca 1, E-28709 San Se-bastian de los Reyes, Spain
† Electronic address: [email protected]‡ Electronic address: [email protected]§ Electronic address: [email protected]¶ Electronic address: [email protected] K.F. Jensen and W. Kern, in Thin Film Processes II, edited by J.
L. Vossen and W. Kern (Academic, Boston, 1991).2 C.H.J. Van den Brekel and A.K. Jansen, J. Cryst. Growth 43, 364
(1977).3 B.J. Palmer and R.G. Gordon, Thin Solid Films 158, 313 (1988).4 G.S. Bales, A.C. Redfield, and A. Zangwill, Phys. Rev. Lett. 62,
776 (1989).5 G.S. Bales and A. Zangwill, Phys. Rev. Lett. 63, 692 (1989); J.
Vac. Sci. Technol. A 9, 145 (1991).6 M.J. Cooke and G. Harris, J. Vac. Sci. Tech. A 7, 3217 (1989).7 A.-L. Barabasi and H.E. Stanley, Fractal Concepts in Surface
Growth (Cambridge University Press, Cambridge, 1995).8 J. Krug, Adv. Phys. 46, 139 (1997).9 F. Family and T. Vicsek, J. Phys. A 18, L75 (1985).
10 F. Ojeda, R. Cuerno, R. Salvarezza and L. Vazquez, Phys. Rev.Lett. 84, 3125 (2000).
11 Note that both in the experimental and theoretical results, the ex-istence of crossover effects implies ranges for the various scalingbehaviors that are shorter than desirable in order to obtain the crit-ical exponents with high accuracy. It is mostly due to the agree-ment between experiments and models that we can attribute thevarious intermediate scaling regions to specific physical mecha-nisms and their representation as different terms in the continuuminterface equations.
12 K. Watanabe and H. Komiyama, J. Electrochem. Soc. 137, 1222(1990).
13 M. Kardar, G. Parisi, and Y.-C. Zhang, Phys. Rev. Lett. 56, 889(1986).
14 W.W. Mullins, J. Appl. Phys. 28, 333 (1957).15 R.P.U. Karunasiri, R. Bruinsma, and J. Rudnick, Phys. Rev. Lett.
62, 788 (1989)16 J.H. Yao, C. Roland, and H. Guo, Phys. Rev. A 45, 3903 (1992);
J.H. Yao and H. Guo, Phys. Rev. E 47, 1007 (1993).17 J. Garcıa-Ojalvo and J.M. Sancho, Noise in Spatially Extended
Systems (Springer, New York, 1999).18 K. Tsukamoto, D. Cheng, H. Komiyama, Y. Nishimoto, N. Toku-
masu and K. Maeda, Jpn. J. Appl. Phys. 38, L68 (1999).19 D. Cheng, K. Tsukamoto, H. Komiyama, Y. Nishimoto, N. Toku-
masu and K. Maeda, J. Appl. Phys. 85, 7140 (1999).20 K. Sneppen, J. Krug, M.H. Jensen, C. Jayaprakash, and T. Bohr,
Phys. Rev. A 46, R7351 (1992).21 R. Cuerno and A.-L. Barabasi, Phys. Rev. Lett. 74, 4746 (1995);
S. Park, B. Kahng, H. Jeong, and A.-L. Barabasi, ibid. 83, 3486(1999).
22 R. K. Iler, The chemistry of silica (J. Wiley & Sons, New York,1979).
23 T.A. Michalske and B.C. Bunker, J. Appl. Phys. 56, 2686 (1984).24 Q. Sun, J.Z. Yu, L. Zhou, Z.Q. Li, Z. Tang, K. Ohno, and Y. Kawa-
zoe, Europhys. Lett. 43, 47 (1998).25 F. Ojeda, I. Montero, F. Abel, J.M. Albella, Chem. Mater. 13, 3986
(2001); F. Ojeda, Ph. D. thesis, Universidad Autonoma de Madrid,
1999 (in Spanish).26 C.J. Brinker, D.R. Tallant, E.P. Roth, and C.S. Ashley, J. Non-
Cryst. Solids 82, 117 (1986).27 M.E. Bartram and H.K. Moffat, J. Vac. Sci. Technol. A 14, 872
(1996).28 F. Ojeda, F. Abel, and J.M. Albella, J. Phys. Chem. B 106, 6258
(2002).29 W. Horsthemke and R. Lefever, Noise Induced Transitions
(Springer, New York, 1984).30 C. Lam, L.M. Sander and D.E. Wolf, Phys. Rev. A 46, R6128
(1992).
Site Concentration ratio [723 K]/[611 K] Spectroscopy
[SiH] > 11 IR[SiOHSi] 1.15 IR
[R3] 1.34 Raman[R2] > 5 Raman
TABLE I: Ratio of the concentration of the different reactive sitesbetween the high and low temperature films, as measured by IR andRaman spectroscopies. R2 and R3 correspond to two and three mem-bered siloxane rings, respectively.

10
FIG. 1: 500 × 500 nm2 AFM images of amorphous SiO2 films de-posited for 20 minutes at 611 K (a) and 723 K (b). The bar indicates80 nm. Panels (c) and (d) are 14 × 14 µm2 AFM images taken after2 days deposition for T = 611 K and T = 723 K, respectively. Inthese two panels, the bar indicates 1 µm.
11
FIG. 2: (a) Time evolution of the surface roughness σ(t) for the 611K films () and 723 K films (•). (b) PSD curves from AFM imagesof the SiO2 surface deposited after 2 days deposition at 611 K ()and 723 K (•). The straight lines in (a) and (b) indicate the relevantexponent values for the various scaling regimes. (c) Time evolutionof the average slope m(t) computed using ` = 200 nm for the 611K films () and 723 K films (•).
12
FIG. 3: Logarithmic plots of the q-th root of the moments of theheight-difference distribution Cq(r, t) [Eq. (3)] for several values ofq, computed for the two temperature conditions, and times t = 35min. (a) and t = 2 days (b). In each panel the four uppermost curvescorrespond to the T = 723 K set, in the sequence q = 1, 2, 3, 4, bot-tom to top, and the four lowermost curves to the condition T = 611K, in an analogous sequence. Straight lines are shown for referencehaving slopes as indicated, that correspond to relevant values of theroughness exponent α.

13
FIG. 4: Raman spectra of 1.0 µm-thick amorphous SiO2 films de-posited at 611 K (top curve) and 723 K (bottom curve). Four peakshave been marked: three of them correspond to two, three and four-membered siloxane rings, R2 at 876 cm−1, R3 at 605 cm−1, and R4
at 502 cm−1, respectively; the remaining one at 519 cm−1 corre-sponds to the silicon substrate.
14
FIG. 5: Monte Carlo simulations of the time evolution of the rough-ness for a RD system with s = 0.5 for two interface configurations,namely, homogeneous (sa = sp = 0.5 and Xa = Xp = 0.5) andheterogeneous (sa = 0.8; sp = 0.2 and Xa = Xp = 0.5). In(a) we fix τ‖ = 0.05 (τa = τp = 0.1), while different values ofdeposition flux F are considered for the homogeneous (solid lines)and heterogeneous (dashed lines) configurations, as indicated. Notethat the scaling behavior is similar for both configurations, but theheterogeneous one shows larger roughness as F increases. In panel(b), we fix F = 10. The homogeneous configuration (solid line) isfor τ‖ = 0.05 and for the heterogeneous configuration three differ-ent cases are shown, namely τ‖ = 0.005 (
), τ‖ = 0.05 (•), and
τ‖ = 0.5 (). All units employed are arbitrary.

15
FIG. 6: Time evolution of the roughness for model (6) with τa =0.1, sa = 1.0 and sp = 0.01. Two configurations are considered,resembling those corresponding to the low temperature condition (:F = 248.1; s = 0.4, Xa = 0.403, and τ‖ = 0.0597) and hightemperature condition (•: F = 1250; s = 0.08, Xa = 0.0707, andτ‖ = 0.093). The exponent value (slope) β = 0.5 is indicated toshow that both systems feature the same scaling behavior. Note theincreased roughness (three times larger) of the high T configuration.Units employed for all axes are arbitrary.

16
FIG. 7: (a) Time evolution of the interface roughness from a numeri-cal integration of Eq. (7) for L = 512, K = 1, ε = 1, and δt = 0.01,for the low T noise configuration of Fig. 6 with λ = 0.01 (dashedline), and for the high T configuration of Fig. 6 with λ = 0.01 (solidline) and λ = 0.04 (dotted line). Note the initial unstable regimefor both T conditions and the different asymptotic regimes for thelow T (unstable) and high T (KPZ) configurations. (b) PSD froma numerical integration of Eq. (7) for the same noise conditions andparameter values as in (a). Both in (a) and in (b) relevant exponentvalues are indicated as the slopes of corresponding straight lines. (c)Time evolution of the average slope from a numerical integration ofEq. (7) for the same noise conditions and parameter values as in (a),and for different window sizes, `, as indicated. Units employed forall axes are arbitrary.

17
FIG. 8: Logarithmic plots of the q-th root of the moments of theheight-difference distribution Cq(r, t) [Eq. (3)] for several values ofq, from simulations of Eq. (7) for λ = 0.04 (uppermost set of 4curves, sequence q = 1, 2, 3, 4, bottom to top) and λ = 0.01 (low-ermost set of four curves, sequence q = 1, 2, 3, 4, bottom to top), atsimulation times after saturation. Straight lines are shown for refer-ence having slopes as indicated, that correspond to relevant values ofthe roughness exponent α. All units are arbitrary.

18
FIG. 9: (a) and (b): Interface profile evolution from numerical inte-grations of Eq. (7) for L = 512, K = 1, ε = 1 and δt = 0.01 fortimes from t = 1 up to t = 100 for the low T configuration withλ = 0.01 (a) and for the high T configuration with λ = 0.04 (b).The vertical dashed lines guide the eye along the evolution of varioussurface protrusions. Units employed are arbitrary. (c) and (d): Ex-perimental profile evolutions for the 611 K (c) and 723 K (d) films.The solid bar represents 100 nm (c), and 200 nm (d), respectively.

19
FIG. 10: (a) Initial stages of the interface profile evolution from anumerical integration of Eq. (7) for the high T configuration withδt = 0.001 and λ = 0.04. Simulation time for each profile isindicated in the legend. (b) Initial stages of the time evolution ofthe interface roughness from a numerical integration of Eq. (7) forδt = 0.001 for the low T configuration with λ = 0.01 (solid line)and for the high T configuration with λ = 0.04 (dotted line). Thevalues of τ‖ for each T configuration are those of Fig. 6. Units em-ployed for all axes are arbitrary.

20
FIG. 11: Semilogarithmic plots of the autocorrelation function of thehigh T (•) and low T () noise configurations n(x, t) generated bymodel (6), which have been considered in Figs. 6 and 7. The straightlines show the exponential decay in Eq. (9) with ρeff = 0.8788,τeff = 0.0871 (upper), and ρeff = 0.079, τeff = 0.0544 (lower).Units employed for all axes are arbitrary.
21
FIG. 12: (a) Time evolution of the interface roughness from a nu-merical integration of Eqs. (7) and (10) for L = 512, K = 1,ε = 1, and δt = 0.01, for the low T configuration of Fig. 6 withλ = 0.01 (open circles and dashed line, respectively), and for thehigh T configuration of Fig. 6 with λ = 0.04 (solid circles and solidline, respectively). (b) PSD from a numerical integration of Eqs. (7)and (10) for L = 512, K = 1, ε = 1 and δt = 0.01 for the lowT configuration with λ = 0.01 (open circles and dashed line, re-spectively), and for the high T configuration with λ = 0.04 (solidcircles and solid line, respectively). In both panels there is quanti-tative agreement between Eqs. (7) and (10) for the low T systems,whereas for the high T conditions the agreement is restricted to thescaling behavior. Units employed for all axes are arbitrary.