Modelling Grasslands GHG Balances_Dr Gary J Lanigan
29
Modelling Grassland GHG Balances Dr. Gary J. Lanigan
-
Upload
bc3-basque-center-for-climate-change -
Category
Environment
-
view
45 -
download
2
Transcript of Modelling Grasslands GHG Balances_Dr Gary J Lanigan

Modelling Grassland GHG Balances
Dr. Gary J. Lanigan
Outline
1) Challenges facing verification of measuring management effects
on GHG balance in grasslands
2) Use of modelling to assess co-mitigation and adaptation options
into the future
3) Farm-scale models- comparing systems and downscaling to
individual farms
4) Outreach to farmers: DSS tools- what to focus on

Pasture GHG Balance: Key Uncertainties:
• C Sequestration is decadal – makes measurement and verification
difficult
• Large variations in ecosystem C sink/source can occur- driven by
land management, soils and climate
• Unclear how long sequestration can last after management/land-use
change
• Assessment of pasture management is especially difficult-
particularly when attempting to assess future CC effects
C sequestration
N2O • Pasture, range and paddock emissions vary greatly temporally and
spatially
• Large measurement uncertainties
• N balance closure is problematic

Impacts of Land-use change
Measurement of fluxes
reveals large inter-annual
variation
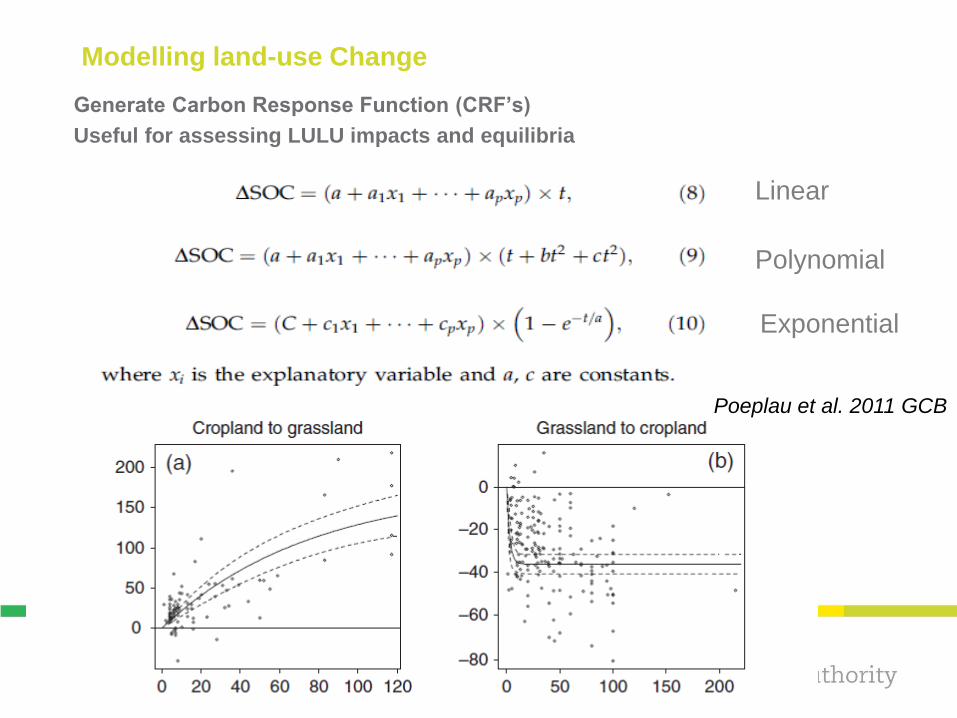
Modelling land-use Change
Generate Carbon Response Function (CRF’s)
Useful for assessing LULU impacts and equilibria
Linear
Polynomial
Exponential
Poeplau et al. 2011 GCB

Temporal and spatial variation in N2O from grazed pastures
• Highly episodic in nature
• PRP emissions add a high degree of spatial variation
• Emissions vary based on N type and amount, soil type and climate
• Event driven – require high soil moisture
Range: 2 – 200 mgN ha-1 d-1

N2O- CAN YOU TRUST THE MEASUREMENTS?
Li, Humphreys, Lanigan 2011 STOTEN

Dynamic Biogeochemical Models
• Biogeochemical Models allow assessment of land
management strategies under current conditions and into
the future
• Predict future climate impacts – future-proof mitigation and
an assessment of co-mitigation/adaption
• Models allow insight into mechanisms controlling
source/sink strength
• Allow insights into permanency of stocks – partition
between labile and recalcitrant C
Advantages
Disadvantages • Parameter-hungry
• Requires constraint –equilibrium runs
Principal models: DNDC (multiple versions), Century/DailyDAYCENT
PASIM, APSIM, RothC/SUNDIAL/ECOSSE

PASIM
ECOSSE
DNDC

Models require
constraint either
a) Against long-term
SOC datasets OR
B) With flux data
Long-term effects on SOC- are the
models accurate Smith.2005 EJSS
Dondini et al. 2010 GCB-B

Flux data allow greater fine detail temporal assessment of simulated and measured
emissions
Model Accuracy and Uncertainty

• Goodness-of-fit may vary between sites
Model Accuracy and Uncertainty
Vuichard et al. 2007 Global Biogeochem. Cycl.
Gottschalk et al. 2007 AGEE

Impacts of drainage
Necpalova et al. 2013 Grass For. Sci.
0
20
40
60
80
100
120
140
160
180
Undrained Drained Undrained Drained
Measured Modelled
SO
C (
tC h
a-1
)
0
20
40
60
80
100
120
140
160
180
Undrained Drained Undrained Drained
Measured Modelled
Sand/Loam
Clay
N2O
(kg N
2O
-N h
a-1
)

Fertiliser Rate N
2O
(kgN
ha
-1 y
r-1
)
N2 (
kg
N h
a-1
yr-
1)
NH
3 (
kgN
ha
-1 y
r-1
)
Leach N
(kgN
ha
-1 y
r-1
)
a b
c d

Inclusion of legumes N
2O
(kg N
2O
-N h
a-1
yr-
1)
Legume proportion (%)
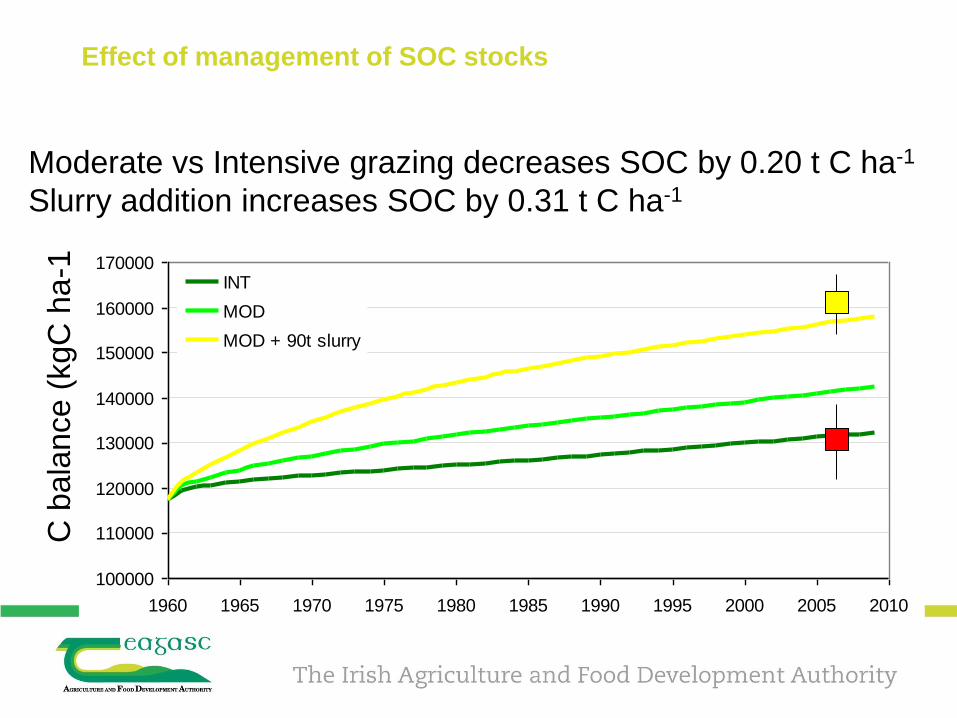
Effect of management of SOC stocks
100000
110000
120000
130000
140000
150000
160000
170000
1960 1965 1970 1975 1980 1985 1990 1995 2000 2005 2010
INT
MOD
MOD + 90t slurry
C b
ala
nce (
kgC
ha
-1
Moderate vs Intensive grazing decreases SOC by 0.20 t C ha-1
Slurry addition increases SOC by 0.31 t C ha-1
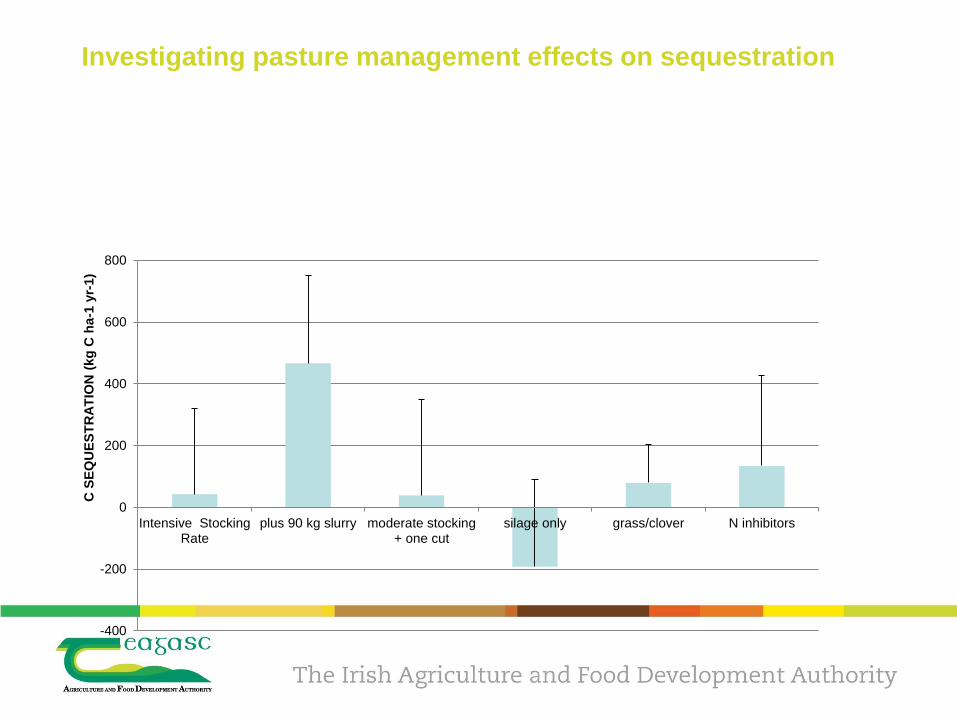
Investigating pasture management effects on sequestration
-400
-200
0
200
400
600
800
Intensive StockingRate
plus 90 kg slurry moderate stocking+ one cut
silage only grass/clover N inhibitors
C S
EQ
UE
ST
RA
TIO
N (
kg
C h
a-1
yr-
1)

Assessing quality of C sequestration
• Can relate soil C pools in models in measured C pools
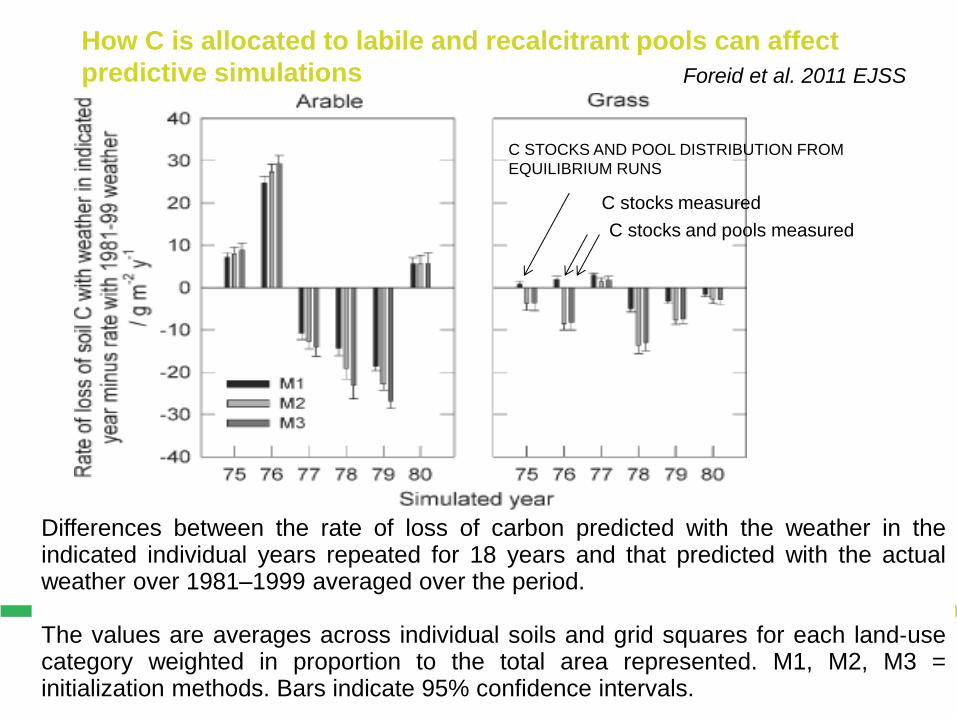
How C is allocated to labile and recalcitrant pools can affect
predictive simulations
Differences between the rate of loss of carbon predicted with the weather in the indicated individual years repeated for 18 years and that predicted with the actual weather over 1981–1999 averaged over the period. The values are averages across individual soils and grid squares for each land‐use category weighted in proportion to the total area represented. M1, M2, M3 = initialization methods. Bars indicate 95% confidence intervals.
Foreid et al. 2011 EJSS
C STOCKS AND POOL DISTRIBUTION FROM
EQUILIBRIUM RUNS
C stocks measured
C stocks and pools measured

Predicting sward productivity into the future
Lolium
4 spp mix
Lolium/trifolium
Sum of Harvested Biomass over Time
0
1
2
3
4
5
6
7
8
9
Lp Pp Tp Tr Cent Lp/Pp Lp/Tp Lp/Tr Pp/Tp Pp/Tr Tp/Tr
Community
Bio
ma
ss
[t
d.m
. h
a-1
]
Net Ecosystem Productivity
0
1
1
2
2
3
3
4
4
Lp Pp Tp Tr Cent Lp/Pp Lp/Tp Lp/Tr Pp/Tp Pp/Tr Tp/Tr
Community
Bio
ma
ss
[t
d.m
. h
a-1]

Predicting future trends
Abdalla et al. 2013 STOTEN
• Future Climate Change will not make much difference in SOC assuming seasonal
temperature and moisture distribution remains unaffected
• Weather volatility induces much larger changes
0
1
2
3
4
5
6
7
8
9
10
BG Measured BG Modelled Graz Measured Graz Modelled
N2O
(kg
N h
a-1
yr-
1)
Gleysol
0
0.5
1
1.5
2
2.5
3
3.5
4
4.5
5
BG Measured BG Modelled Graz Measured Graz Modelled
2003/10
A2 2070
HP69 2070
HP85 2070
Sandy
Impacts of CC on N2O
NEE is a sink except during dry years.
Decrease in sink activity is due to
waterlogging
N2O increases with aridity in clay soils
N2O decreases with aridity in sandy
soils

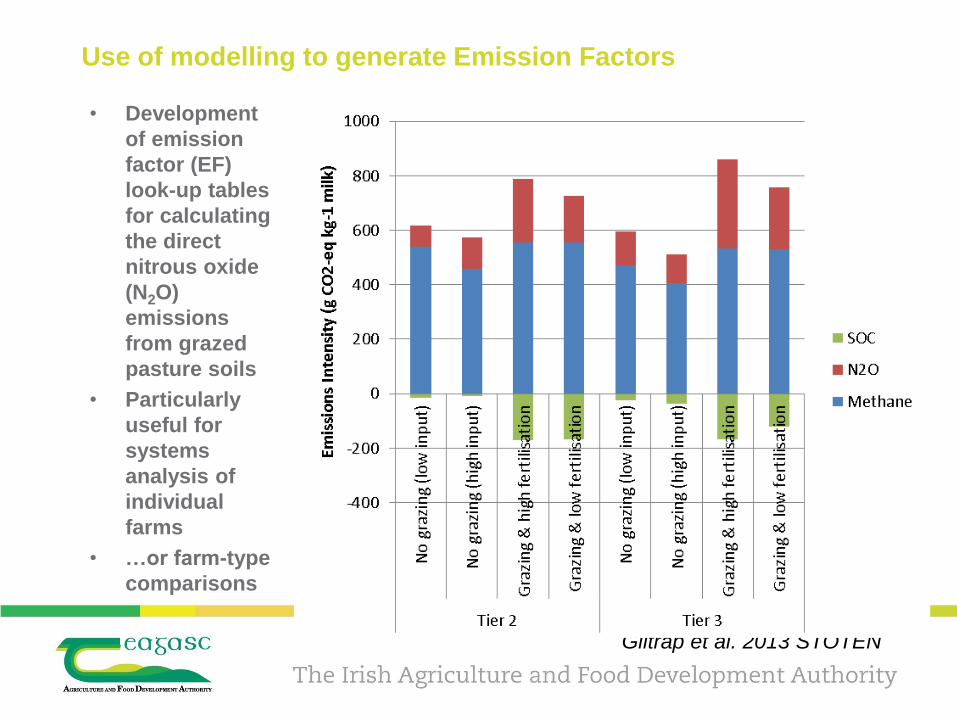
Use of modelling to generate Emission Factors
• Development of emission factor (EF) look-up tables for calculating the
direct nitrous oxide (N2O) emissions from grazed pasture soils
• Particularly useful for systems analysis of individual farms
• Scaling up to the farm- assessment within a whole production system
• Can set the modelled emissions in the context of production efficiency
Giltrap et al. 2013 STOTEN
Use of modelling to generate Emission Factors
• Development
of emission
factor (EF)
look-up tables
for calculating
the direct
nitrous oxide
(N2O)
emissions
from grazed
pasture soils
• Particularly
useful for
systems
analysis of
individual
farms
• …or farm-type
comparisons
Giltrap et al. 2013 STOTEN

What does this all mean to the farmer?
• Policy stakeholder require absolute emissions and
accurate emissions intensity
• Farmers need to know a) Is my efficiency increasing?
b) where am I relative to my peers?
c) ease of use

Carbon navigator: Principles
Mitigation measures:
Reduce carbon footprint
Increase profitability
Practical to implement
Software program
User friendly - data
Scientifically robust
Complementary to ongoing programmes

A comparison of published analyses of GHG emissions from
beef production systems (LCA and systems analysis)
0
5
10
15
20
25
30
35
40
GH
G e
mis
sio
ns (
kg C
O2e/k
g c
arc
ass)
Crosson & Lanigan 2011 An. Feed Sci Tech.

Set current and
target performance
Review impact on GHG
emissions per kg beef
Scoring chart
Indicator of
improvement
in profitability

Review impact on GHG
emissions per kg beef
Set current and
target performance
Scoring chart
Indicator of
improvement
in profitability
Conclusions
• Modelling offers a strategy for verification of land
management impacts of C sequestration and N2O
• Viable risk assessment tool for impacts of climate
change – future-proof mitigation
• Generate downscaled EF’s for farm-scale models
• Care needs to be taken with incorporation into DSS