Modelling Curriculum Choice at A-level: Why is Business Studies
23
58 Modelling Curriculum Choice at A-level: Why is Business Studies More Popular than Economics? Ray Bachan Brighton Business School, University of Brighton Michael Barrow Department of Economics, University of Sussex Abstract This paper uses A-level Information System (ALIS) data to quantify the determinants of the choice between Economics and Business Studies at A-level. These subjects are often perceived as close curriculum options and possible substitutes in the UK. Subject choice is modelled using an underlying latent variable approach. On the basis of a series of counterfactual exercises an overall average grade differential, a measure of their comparative difficulty, is estimated to be 1.3 (old) UCAS points, equivalent to approximately two-thirds of a letter grade, in favour of Business Studies.The estimating equation suggests that a unit increase in the grade differential increases the probability of selecting Business Studies over Economics by approximately 12 percentage points.There is evidence that females are less likely to choose Economics over Business Studies and the more able students, in terms of their average GCSE score and mathematical ability, are more likely to select Economics. There is also some evidence of parental background characteristics and ethnicity exerting significant effects on the choice between these two subjects. Introduction Concern regarding falling enrolments on certain A-level courses has been part of the educational landscape in the UK since the introduction of the National Curriculum in 1989.These trends have persisted even though there was a rise in participation rates in post-compulsory education during the 1990s. In particular,
Transcript of Modelling Curriculum Choice at A-level: Why is Business Studies

58
Modelling Curriculum Choiceat A-level: Why is BusinessStudies More Popular thanEconomics?
Ray BachanBrighton Business School, University of Brighton
Michael BarrowDepartment of Economics, University of Sussex
Abstract
This paper uses A-level Information System (ALIS) data to quantify thedeterminants of the choice between Economics and Business Studies at A-level.These subjects are often perceived as close curriculum options and possiblesubstitutes in the UK. Subject choice is modelled using an underlying latentvariable approach. On the basis of a series of counterfactual exercises an overallaverage grade differential, a measure of their comparative difficulty, is estimated tobe 1.3 (old) UCAS points, equivalent to approximately two-thirds of a letter grade, infavour of Business Studies.The estimating equation suggests that a unit increase inthe grade differential increases the probability of selecting Business Studies overEconomics by approximately 12 percentage points.There is evidence that femalesare less likely to choose Economics over Business Studies and the more ablestudents, in terms of their average GCSE score and mathematical ability, are morelikely to select Economics.There is also some evidence of parental backgroundcharacteristics and ethnicity exerting significant effects on the choice betweenthese two subjects.
Introduction
Concern regarding falling enrolments on certain A-level courses has been part ofthe educational landscape in the UK since the introduction of the NationalCurriculum in 1989.These trends have persisted even though there was a rise inparticipation rates in post-compulsory education during the 1990s. In particular,
Modelling Curriculum Choice at A-level: Why is Business Studies More Popular than Economics?
59
declining enrolments in the ‘hard’ mathematics/science-orientated A-level subjectsand languages have been highlighted as particular areas for concern(Dearing,1996; Fitz-Gibbon, 1999).The introduction of the Advanced Subsidiary (AS)and the Advanced (AS+A2) qualifications in England and Wales in September 2000was anticipated to help reverse these unfavourable patterns of enrolments,particularly in the area of mathematics/science and languages.The newexamination offers students greater choice and flexibility regarding A-level optionsparticularly in their first year of study.1 Indeed, the Royal Society (2005) has recentlyreported that there have been some modest improvements in A-level enrolmentsin Chemistry and Mathematics but stress that enrolments in mathematics/science-related A-level options are still relatively low compared to their levels in the early1990s. However, the new examination has not helped some A-level options, such asmodern languages, to recover from the fall in enrolments witnessed in the 1990s.
Despite this concern, there has been relatively little systematic examination of thecause of these observed trends, particularly for A-level subjects outside curriculumareas such as languages and mathematics/science.
A primary motivation for this research is to address this gap in the literature byfocusing on two A-level subjects that have witnessed opposite fortunes inenrolment patterns in recent times: Economics and Business Studies.These subjectsare often cited as closely related A-level options, and provide examples of a‘difficult’ and a ‘less challenging’ course of study.We analyse factors that canpotentially influence the choice between Economics and Business Studies in oneparticular year using a large dataset, and in so doing develop an econometricmethodology that can be employed to address concerns regarding the choicebetween any two curriculum options.The quantification of the determinants ofsuch choices should enhance understanding of the trends in A-level enrolmentnoted above.
Research into A-level subject choice has identified several factors that influence thechoice of subject.These include: the previous study of the subject; the student’sperception of the subject’s challenging nature; the likelihood of passing or failing;the interest/enjoyment value of the subject (particularly evident amongst femalestudents); the type of school (i.e. single sex or mixed); the complementaritybetween A-level subjects (particularly in the sciences); the career aspirations of thestudent; parental socio-economic characteristics; and the guidance a studentreceives at school or from parents. Ryrie (1981), Garratt (1985, 1986), McEwan, Curryand Watson (1986), Stables and Stables (1995), Gallagher, McEwan and Knipe (1997),Stables and Wikeley (1997) and Werfhorst, Sullivan and Cheung (2002) provideevidence on these issues.

International Review of Economics Education
60
The case of Economics and Business Studies
Between 1992 and 2004, the number of students entered for the full two-year A-level examinations in Economics in England witnessed a 62% decline, whereas thenumbers entered for A-level examinations in Business Studies increased by 70%over the period (see Figure A1 in the appendix). It should be noted that by 1995, thenumber of students sitting examinations in Business Studies rose above that ofEconomics for the first time.The pattern described by the data may suggest that, tosome extent, students may be substituting A-level Business Studies for A-levelEconomics. It should also be noted that over the whole period the total number ofstudents taking either subject fell by 18%.This may reflect a strong growth ininterest in ‘new’ subjects offered by the wider post-16 advanced curriculum offeredin the 1990s.2 Whether some of these students would have selected Economicsover Business Studies if these subjects were not available is difficult to discern, butit is a possibility. Moreover, the figure also reveals that the introduction of AS andthe full two-year qualifications in 2000 has had little effect on reversing decliningenrolments on the full two-year Economics option.
It is against this background that concern over the declining student numbers onA-level Economics courses has been expressed by economics educators. It is arguedthat the perceived difficulty between these two subjects is an important factor inexplaining Economic’s declining enrolments and Business Studies’ relative rise inpopularity over the past decade.The observed trends are often taken as a reflectionof a rational reaction by students to move towards the ‘easier’ Business Studies andaway from the ‘harder’ Economics (Ashworth and Evans, 2000, 2001; Bachan andReilly, 2003; Reilly and Bachan, 2005).
Few studies have attempted to explicitly model the choice of Economics over othercurriculum options at A-level.The econometric work by Ashworth and Evans (2001)is a notable exception.They find evidence that mathematical ability, prior study ofEconomics, under achievement in Economics and certain features of the classroomenvironment are important factors influencing the decision to select Economics atA-level.
The econometric methodology adopted in this paper allows for the control of avariety of individual, family and school characteristics that are assumed, a priori, toinfluence a student’s choice between A-level Business Studies and Economics, in oneparticular year. A measure that standardises comparative subject ‘difficulty’ betweenthe comparator subjects is constructed and enters the analysis as an additionalregressor in the choice equation.The inclusion of this variable allows for the possibleimpact that comparative ‘difficulty’ has on the probability of choosing one subjectover another.This measure of difficulty varies by student, so may be better thought
Modelling Curriculum Choice at A-level: Why is Business Studies More Popular than Economics?
61
of as the student’s ‘aptitude’ for the subject.The average of this measure then givesan estimate of the greater difficulty of one subject over the other.
The structure of this paper is as follows.The next section describes the dataset usedin the analysis then the following section contains a description of the econometricmethodology employed.The penultimate section reports the empirical results anda final section provides a summary of the conclusions.
Data used in the analysis
The data used are obtained from the ALIS Project administered at the Curriculum,
Evaluation and Management Centre (CEM Centre) at Durham University.The
specific data employed in this study are based on performance in the 1998
examinations by a sample of Economics and Business Studies candidates and the
information they provided on their personal and family characteristics during their
first term of a two-year course of study.The sample consists of students aged 16–19
years who completed two or more A-levels (excluding General Studies). Once
allowance is made for missing values, 2,052 and 3,453 usable observations are
available for Economics and Business Studies respectively.
The set of independent variables used and summary statistics are reported in Table
A1 of the appendix.They include a measure of A-level performance, prior
attainment (average GCSE score3), gender, ethnicity, school-type, parental
characteristics, examination board, other A-levels studied, the student’s desired
occupation and attitudes to the subject. It is important to note that for reasons of
confidentiality, the data are limited in a number of important respects. It is not
possible to identify either schools or colleges by their names or postcodes and
therefore not possible to assign certain factors (e.g. location, funding, staff/pupil
ratios, numbers on roll, teacher or class characteristics) to the individual level data
used here. In addition, it did not prove possible to identify prior attainment in either
GCSE Economics or Business Studies (if taken) for the sample of students.The data
set employed in this study has been fully described elsewhere (Reilly and Bachan,
2005). For convenience it may be instructive to briefly examine some of the key
characteristics of the data set that relate to its current use.
The sample of Economics candidates appear better qualified than their BusinessStudies counterparts using average GCSE performance measures. A significantlyhigher proportion of Economics candidates achieved A/A* grades in MathematicsGCSE relative to Business Studies (40% v. 16%), with smaller proportions obtaining agrade C or below (20% v. 45%). In terms of A-level performance, almost twice theproportion of Economics candidates secure an A-grade in comparison to their

International Review of Economics Education
62
Business Studies counterparts but a higher proportion also fail. Economics thuspresents a greater spread of grades than does Business Studies.
The gender balance for Business Studies is relatively even.The Economics samplehas a slight male dominance, but the proportion of female candidates studyingEconomics in this sample appears on the high side compared to national estimatesfor this particular year (DfEE, 1999).
The parents of students studying A-level Economics are more highly represented inthe professional job classifications than the parents of those studying BusinessStudies, whilst the parents of Business Studies students are more represented in theskilled and unskilled classification (see notes to Table A1 in the appendix for thedefinition of each job category). In terms of parental educational background thosestudents studying Economics have parents educated to a higher level. However, thereappear to be few significant differences in terms of parental employment status.
A greater proportion of Economics students tend to find it ‘more difficult to getdown to work’ than those studying Business Studies, perhaps reflecting the morepractical nature of the latter subject. But they do appear to think about the subjectmore than their Business Studies counterparts, perhaps suggesting greater interestin the subject content. It is also interesting to note the higher aspirations ofEconomics students, with a higher proportion wanting to be employed in thehighest professional category, and a greater proportion of Business Studies studentswanting to be employed in the lower professional and skilled job categories.
The ethnic mix of those studying A-level Economics is slightly more varied than forthe sample of Business Studies candidates. It is worth noting that a high proportionof Economics candidates complement their study of Economics with the study ofMathematics and/or Physics at A-level.
Methodology
The sample of students in this study have either taken a course in A-levelEconomics or Business Studies but not both. Subject choice is then modelled in twostages. First, a performance equation is estimated which provides predictions ofhow each student would perform in each subject.The difference between astudent’s predicted performance in the two subjects gives an estimate of thestudent’s aptitude for the subjects and hence of their relative difficulty. In thesecond stage, this predicted difference is used as an explanatory variable in asubject choice equation, with the prior hypothesis that a student’s greater aptitudefor a subject will make them more likely to choose to study that subject.The firststage of the analysis borrows the methodology employed by Reilly and Bachan
Modelling Curriculum Choice at A-level: Why is Business Studies More Popular than Economics?
63
(2005) to model student performance in Economics and Business Studies and theestimated equation is virtually identical to theirs.The real focus of this paper is thesecond stage – the subject choice equation.
Given the ordinal nature of the final grade classifications at A-level the first stage ofthe analysis employs an ordered probit equation (one for each subject) where theobservable ordinal variable, y, is coded 0, 1, 2, 3, 4, 5 on the basis of A-levelperformance (i.e. 0 = N/U grade, 1 = E, 2 = D,…, and 5 = A). A full list of theexplanatory variables in this model is shown in Table A2 in the appendix. Full detailsof the methodology utilised to estimate this equation are given in Reilly andBachan (2005).
We then simulate how the full sample of students would have performed if theyhad all chosen to study Economics, using the estimated coefficients and thresholdparameters θ from the Economics performance equation.This counterfactual canbe expressed as:
Prob[Economicsi = j] = (j = 1,…,J) [1]
where j indexes the grade categories and i indexes students). A further simulation isperformed to estimate the performance of all students were they to take theBusiness Studies course.This uses the coefficients and thresholds from the BusinessStudies performance equation and can be expressed as:
Prob[Economicsi = j] = (j = 1,......J) [2]
On the basis of the predicted grade probabilities resulting from expressions [1] and[2], an expected UCAS point score is computed for both Economics and BusinessStudies for each individual in the sample.This weighted average is constructedusing the old UCAS points tariff as weights.4 The differential in performance, on thecounterfactual assumption that each individual in the sample took both BusinessStudies and Economics, can be constructed using the results from the simulations.The differential (Di) can be expressed as:
Di = [3]
where SBi and SE
i are the predicted UCAS point scores in Business Studies andEconomics respectively, and Di can be interpreted as a measure of comparativeaptitude the student has for the two subjects. A positive differential implies that astudent would have performed better, in terms of the predicted UCAS points, ifBusiness Studies were selected. Similarly, a negative grade differential implies that astudent would have performed better if Economics were chosen.This differential isemployed as an additional regressor in the second stage of our analysis.
International Review of Economics Education
64
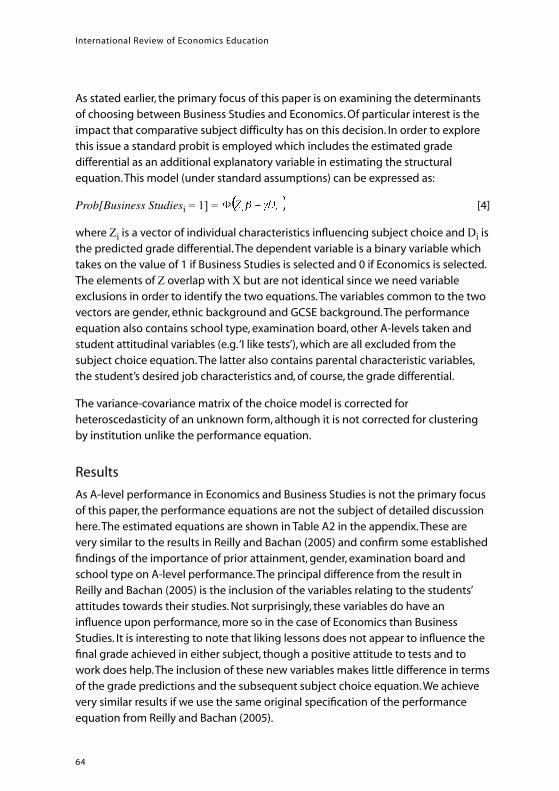
As stated earlier, the primary focus of this paper is on examining the determinantsof choosing between Business Studies and Economics. Of particular interest is theimpact that comparative subject difficulty has on this decision. In order to explorethis issue a standard probit is employed which includes the estimated gradedifferential as an additional explanatory variable in estimating the structuralequation.This model (under standard assumptions) can be expressed as:
Prob[Business Studiesi = 1] = [4]
where Zi is a vector of individual characteristics influencing subject choice and Di isthe predicted grade differential.The dependent variable is a binary variable whichtakes on the value of 1 if Business Studies is selected and 0 if Economics is selected.The elements of Z overlap with X but are not identical since we need variableexclusions in order to identify the two equations.The variables common to the twovectors are gender, ethnic background and GCSE background.The performanceequation also contains school type, examination board, other A-levels taken andstudent attitudinal variables (e.g.‘I like tests’), which are all excluded from thesubject choice equation.The latter also contains parental characteristic variables,the student’s desired job characteristics and, of course, the grade differential.
The variance-covariance matrix of the choice model is corrected forheteroscedasticity of an unknown form, although it is not corrected for clusteringby institution unlike the performance equation.
Results
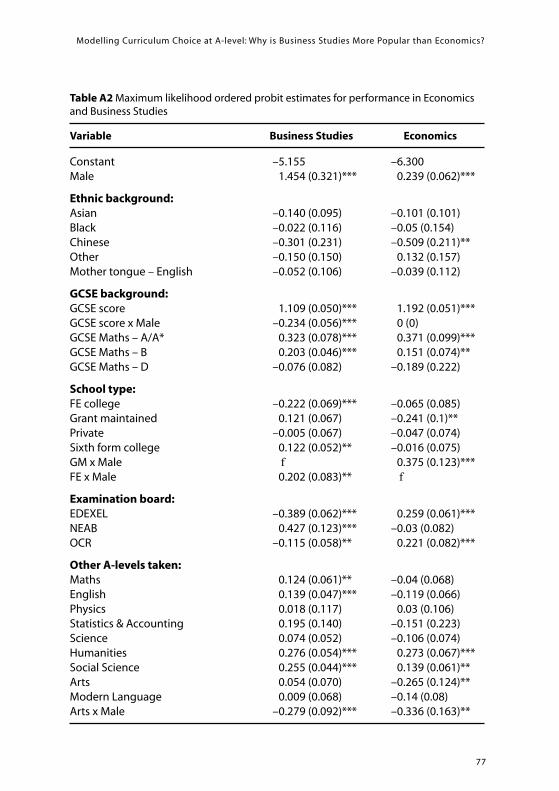
As A-level performance in Economics and Business Studies is not the primary focusof this paper, the performance equations are not the subject of detailed discussionhere.The estimated equations are shown in Table A2 in the appendix.These arevery similar to the results in Reilly and Bachan (2005) and confirm some establishedfindings of the importance of prior attainment, gender, examination board andschool type on A-level performance.The principal difference from the result inReilly and Bachan (2005) is the inclusion of the variables relating to the students’attitudes towards their studies. Not surprisingly, these variables do have aninfluence upon performance, more so in the case of Economics than BusinessStudies. It is interesting to note that liking lessons does not appear to influence thefinal grade achieved in either subject, though a positive attitude to tests and towork does help.The inclusion of these new variables makes little difference in termsof the grade predictions and the subsequent subject choice equation.We achievevery similar results if we use the same original specification of the performanceequation from Reilly and Bachan (2005).
Modelling Curriculum Choice at A-level: Why is Business Studies More Popular than Economics?
65
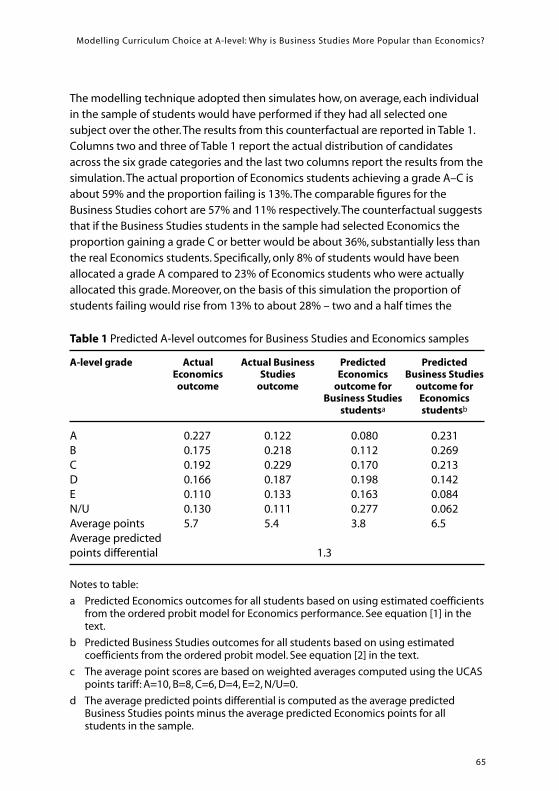
The modelling technique adopted then simulates how, on average, each individualin the sample of students would have performed if they had all selected onesubject over the other.The results from this counterfactual are reported in Table 1.Columns two and three of Table 1 report the actual distribution of candidatesacross the six grade categories and the last two columns report the results from thesimulation.The actual proportion of Economics students achieving a grade A–C isabout 59% and the proportion failing is 13%.The comparable figures for theBusiness Studies cohort are 57% and 11% respectively.The counterfactual suggeststhat if the Business Studies students in the sample had selected Economics theproportion gaining a grade C or better would be about 36%, substantially less thanthe real Economics students. Specifically, only 8% of students would have beenallocated a grade A compared to 23% of Economics students who were actuallyallocated this grade. Moreover, on the basis of this simulation the proportion ofstudents failing would rise from 13% to about 28% – two and a half times the
Table 1 Predicted A-level outcomes for Business Studies and Economics samples
A-level grade Actual Actual Business Predicted PredictedEconomics Studies Economics Business Studiesoutcome outcome outcome for outcome for
Business Studies Economics studentsa studentsb
A 0.227 0.122 0.080 0.231 B 0.175 0.218 0.112 0.269 C 0.192 0.229 0.170 0.213 D 0.166 0.187 0.198 0.142 E 0.110 0.133 0.163 0.084 N/U 0.130 0.111 0.277 0.062 Average points 5.7 5.4 3.8 6.5 Average predicted points differential 1.3
Notes to table:
a Predicted Economics outcomes for all students based on using estimated coefficientsfrom the ordered probit model for Economics performance. See equation [1] in thetext.
b Predicted Business Studies outcomes for all students based on using estimatedcoefficients from the ordered probit model. See equation [2] in the text.
c The average point scores are based on weighted averages computed using the UCASpoints tariff: A=10, B=8, C=6, D=4, E=2, N/U=0.
d The average predicted points differential is computed as the average predictedBusiness Studies points minus the average predicted Economics points for allstudents in the sample.

International Review of Economics Education
66
proportion that actually failed Business Studies. Similarly, it should be noted thatthe average Economics score falls from 5.7 to 3.8, a drop of a full letter grade.
The opposite simulation is now performed using the estimated Business Studiescoefficients and threshold parameters.The results from this exercise are reported inthe last column in Table 1. If the Economics students chose Business Studies, theproportion allocated an A-level grade C or better would be about 71%, greater thanthe proportion of Business Studies student who actually achieved these grades(57%).The failure rate is also lower than the actual proportion that failed BusinessStudies. In this case the average GCSE score for the Economics students is higherthan the Business Studies average by about half a grade.These results reflect thishigher ability of the Economics students (as evidenced by GCSE scores notedearlier) and the greater degree of difficulty of Economics as a subject.
These results may be re-interpreted in terms of the old A-level point scores for theaverage student (see the notes to Table 1).This information is provided in thebottom two rows of Table 1. Economics students achieved an average score of 5.7UCAS points per entry, while the average Business Studies student secured a scoreof 5.4. However, if Business Studies students had taken Economics A-level, theirpredicted average grade is just 3.8. Similarly, if the Economics students had takenBusiness Studies, the predicted average score is 6.5 (better than the averageEconomics grade for these students).
If all students were to take Economics then the average UCAS point score is 4.5 (itmakes no difference if we use the actual or predicted score for Economicsstudents). However, if the sample of students all took Business Studies then theaverage score turns out to be 5.8.The overall average grade differential is thuscomputed as 1.3 UCAS points (approximately two-thirds of a letter grade).Thisparticular result could be interpreted as a measure of the average level of ‘difficulty’between the two subjects suggesting that Economics is ‘harder’ or morechallenging than Business Studies. (An alternative explanation is that students, onaverage, have a greater aptitude for Business Studies than Economics. It isimpossible with the data we have to discriminate between these alternatives.) A‘grade maximising’ student would choose Business Studies rather than Economics.
The estimated coefficients for the choice equation are reported in Table 2, reportingthe marginal effects.The estimated gender effect suggests that, on average andceteris paribus, males are five percentage points less likely to choose BusinessStudies over Economics, compared to females,5 this being significant at the 1%level.There are well-defined effects associated with the Asian and Chinese ethniccontrol variables. For instance, Asian students, on average and ceteris paribus, areabout 16 percentage points less likely to choose Business Studies over Economics,

Modelling Curriculum Choice at A-level: Why is Business Studies More Popular than Economics?
67
compared to their white counterparts.The average GCSE score also exerts asignificant effect on the decision to study either Economics or Business Studies.Thepoint estimate implies that a unit increase in the average GCSE score reduces theprobability of selecting Business Studies over Economics by nearly eightpercentage points.This could be interpreted as indicating that the more able, interms of their average GCSE scores, are more likely to select Economics given the
Table 2 Maximum likelihood structural probit estimates for student choice ofBusiness Studies over Economics A-level
Variable Marginal effects
Constant 1.264 (0.255)***
Male –0.051 (0.015)***
Ethnic background: White ƒBlack –0.059 (0.047)Asian –0.159 (0.034)***Chinese –0.228 (0.069)***Other 0.039 (0.051)Mother tongue – English 0.028 (0.036)
GCSE background: Average GCSE score –0.076 (0.014)***GCSE Maths – A/A* –0.127 (0.026)***GCSE Maths – B –0.105 (0.019)***GCSE Maths – C ƒGCSE Maths – D 0.078 (0.039)*
Parental characteristics:Mother’s job characteristics Professional I 0.008 (0.028)
Professional II ƒSkilled (manual/non-manual) 0.036 (0.019)*Unskilled (manual/non-manual) 0.047 (0.028)*Category missing 0.049 (0.034)
Mother’s employment status Unemployed 0.006 (0.051)Full-time employment ƒPart-time employment –0.024 (0.017)Self-employed 0.025 (0.030)Other –0.030 (0.021)
Mother’s education Secondary education ƒFurther education –0.026 (0.017)Higher education –0.067 (0.023)***

International Review of Economics Education
68
Table 2 (continued) Maximum likelihood structural probit estimates for studentchoice of Business Studies over Economics A-level
Variable Marginal effects
Father’s job characteristics Professional I –0.038 (0.017)**Professional II ƒSkilled (manual/non-manual) 0.042 (0.020)**Unskilled (manual/non-manual) 0.051 (0.032)Category missing 0.018 (0.045)
Father’s employment status Unemployed –0.014 (0.044)Full -time employment ƒPart-time employment –0.038 (0.045)Self-employed –0.027 (0.020)Other –0.022 (0.030)
Father’s education Secondary education ƒFurther education –0.017 (0.019)Higher education –0.010 (0.018)
Student’s (desired) job characteristicsProfessional I –0.090 (0.016)***Professional II ƒSkilled (manual/non-manual) 0.070 (0.033)**Unskilled (manual/non-manual)–0.304 (0.080)***Category missing –0.129 (0.033)***
Predicted grade differential 0.123 (0.009)***
Log-likelihood value –3040.365Pseudo-R2 0.164Number of observations 5505
Notes to table:
a *significant at 10%, **significant at 5%, ***significant at 1%.b ƒ denotes category omitted in estimation.c Robust standard errors corrected for heteroscedasticity.d Pseudo-R2 based on the McFadden measure.
Modelling Curriculum Choice at A-level: Why is Business Studies More Popular than Economics?
69
alternative of Business Studies, and this reflects the greater apparent difficulty ofEconomics as a subject.
It is widely accepted that competence in basic mathematics enhances the study ofEconomics (and, implicitly, to a greater extent than for Business Studies). If thechoice of subject is exclusively between Economics and Business Studies it may beexpected that the more mathematically able would select Economics, given theircomparative advantage in this particular skill. Ashworth and Evans (2001) findevidence of this particular effect.The results here suggest that the top GCSE mathsgrades are highly significant and so provide further evidence in support of thisassertion. For instance, students who attain a grade A or A* in GCSE maths areabout 13 percentage points, on average and ceteris paribus, less likely to chooseBusiness Studies over Economics than students who only achieved a grade C. Asimilar finding is also noted for students with a grade B in GCSE maths and a Dgrade increases the probability of opting for Business Studies.
There are some interesting findings associated with the parental socio-economicbackground controls. In broad outline, the father’s job characteristics and mother’seducational qualifications seem to matter most. Having a father in the professionaljob category reduces the chances of choosing Business Studies by four percentagepoints, relative to the baseline ‘professional II’ category, and by eight percentagepoints relative to the skilled worker category.
Having an educated mother increases the chances of studying Economics.Compared to secondary education only, further education increases the probabilityof studying Economics by nearly three percentage points, higher education bynearly seven.The latter effect is significant at the 1% level; the former is notsignificant.The effects of father’s education are both smaller and less welldetermined.This result may in part be caused by the relatively rarity of highereducation amongst mothers: only 19% of the sample has higher educationcompared to 31% of fathers and hence it is a better discriminator.
The student’s aspirations regarding occupational type exert significant effects on theprobability of choosing between these two subjects. In particular, students whoprefer to work in professional I occupations are, on average and ceteris paribus, aboutnine percentage points less likely to choose Business Studies over Economics,compared to students who prefer to work in professional II occupations. Studentswho would like to work in skilled occupations are, on average and ceteris paribus,about seven percentage points more likely to choose Business Studies overEconomics. Both these effects are significant: at the 1% and 5% levels respectively.Thelarge (30 percentage points) and significant effect associated with a desired unskilledoccupation is probably spurious, despite the low significance level.The result is

International Review of Economics Education
70
derived from just 38 sample observations expressing this preference, with slightlymore (proportionately) choosing Economics over Business Studies as a subject.
Finally, the coefficient on the estimated average grade differential (the measure ofstudent aptitude for the subject) exerts a large and significant effect on studentchoice. A unit increase in the differential (equivalent to half a letter grade) raises theprobability of choosing Business Studies over Economics, on average and ceterisparibus, by 12 percentage points.This is clearly a substantial effect and suggeststhat, even if students have some difficulty in assessing their own aptitude for thesubjects, they are likely to favour the subject in which they have a relativeadvantage.Their choice might reflect a greater enjoyment of the subject, based onaptitude, or be the result of grade maximising behaviour.We noted earlier that theaverage predicted grade difference between the two subjects was 1.3 letter gradesand this would suggest an increase of about 16% points in the probability ofchoosing Business Studies over Economics. For example, this would turnindifference between the two subjects into at 58:42 ratio in favour of BusinessStudies, resulting in 38% more students opting for that subject.That fact, however,only accounts for a small proportion of the approximate 2.5:1 ratio between thesubjects revealed in Figure A1.
Alternatively, one can measure the grade differential elasticity, at 0.25, bymultiplying the marginal effect (0.12) by the ratio of means (1.3/0.63). Hence, forexample, a 10% increase in the grade differential results in a 2.5% increase in theprobability of choosing Business Studies over Economics.
Conclusions
The core theme of this paper was to systematically examine the factors that arelikely to influence a student’s choice of subject at A-level.The econometric analysispresented provides evidence of the factors that influence the choice betweenEconomics and Business Studies.6
The findings highlight the important role that comparative subject difficulty orstudent aptitude plays in influencing the choice between Economics and BusinessStudies at A-level, and provides further support for Ashworth and Evans (2000) whoconclude that ‘economists are grading students away from the subject’. If grade-maximisation is considered to be an important determinant of subject choice, asignificant portion of the more poorly qualified Economics candidates would bebetter off doing Business Studies and this could be a major contributory factor tothe former’s declining enrolments. Moreover, the signals sent by the examinationboards on the challenging nature of the two subjects under examination may inpart be a reflection of the marking criteria and grade allocation policies. Given the
Modelling Curriculum Choice at A-level: Why is Business Studies More Popular than Economics?
71
pattern of examination entries shown in Figure A1 Economics still proves vulnerableto attrition even after the reforms to the A-level examination in 2000. If relatively lowA-level achievement in Economics is indeed a consequence of the marking criteriaadopted by the examination boards, then a review of syllabus content and themarking and grading criteria set by the examination boards may be warranted.
The econometric analysis also provides further evidence on a variety of otherfactors that influence the choice between these two subjects at A-level.The issue offemale under-representation on Economics courses has been internationallyrecognised (Hovarth, Beaudin and Wright, 1992; Dyan and Rouse, 1997; Ferber, 1995;Greene, 1997; Burnett, 1997; Ashworth and Evans, 1999; Jensen and Owen, 2000).The evidence suggests that females are less likely than males to choose Economicsover Business Studies at A-level, and also confirms the empirical findings ofAshworth and Evans (2001) who detect a significant positive effect for womenchoosing Business Studies over Economics. It should be noted that they also findthat females are more likely to choose science and arts subjects rather thanEconomics at A-level.The potential reasons for the apparent female dislike ofEconomics relative to males are likely to be varied and complex.These range from alack of female skills in spatial relationships (Williams,Waldauer and Duggal, 1992) tothe lack of female role models and a critical mass of women studying the discipline(Ashworth and Evans, 1999, 2001). It is conceded that no useful insights can beoffered to explain the mechanisms at play, but after controlling for a variety offactors the effect still remains. Ashworth and Evans (1999) suggest that moreeffective marketing of Economics to potential female students would in part helpto reverse this apparent lack of female interest in Economics.
The results provide further supportive evidence on the important role played byprior attainment at GCSE and mathematical ability in selecting Economics overBusiness Studies at A-level (Ashworth and Evans, 2001). Ashworth and Evans (2001)also find evidence that the more able students, in terms of their GCSE score andmathematical ability, are more likely to choose science subjects over Economics.They point out that this poses certain dilemmas for economics educators who wantto attract otherwise bright students to the subject. Raising the mathematicalrequirement of the subject may prove to be counter-productive in that the moreable, mathematically, may opt for other equally challenging subjects. Economicseducators need to be aware of this in regard to curriculum development andcarefully review the mathematical requirement of the syllabus offered toprospective students.
It is argued that parents’ interests are channelled to their children who are likely tochoose subjects close to such interests (Dryler, 1998; Davies and Guppy, 1997;
International Review of Economics Education
72
Jonsson, 1999; Hansen, 1997; Werfhorst, Sullivan and Cheung, 2002). Moreover, thisliterature also suggests that children choose subjects that correspond closely totheir parents’ position in the economic and cultural hierarchy.There is somesupport for the notion that parental characteristics influence the choice of A-levelin the present study.The influence of parental background characteristics wasfound to be mediated through both fathers’ and mothers’ characteristics. Inparticular, there is evidence that maternal education level has some impact on thechoice of subject.
The specific focus of this paper was to examine the factors that influence subjectchoice at A-level for two subjects that are often perceived as possible substitutes. Inparticular, we examine the extent to which the perceived difficulty of the subjectimpacts upon students’ choices.The methodology adopted in this paper hasbroader applications for educationalists engaged in research on A-level subjectchoice (and comparative subject difficulty), and provides sharp insights into thedeterminants governing such choices. It may prove fruitful to examine the rolethese factors play in influencing the choice of continuing with an A-level optionbeyond the first year of study, where possible substitution exists and students havegreater experience of how difficult a subject is.We believe the econometricmethodology used in this paper can be easily adapted to explore this issue andprovides an avenue for further research. It was not possible to explore the extent towhich factors relating to classroom environment and prior study influence thechoice between A-level subjects. However, this does represent a further avenue toexplore using a richer set of individual level data than that employed in the presentstudy. On a more general level the findings presented in this paper offers potentialevidence on the factors that may contribute to the relative decline in studentenrolments on the ‘hard’ mathematics/science-orientated A-levels.This decline canbe partly explained by the comparative difficulty of these subjects compared totheir ‘softer’ A-level alternatives.This issue is exacerbated by the greater focus onresults, both for schools in respect of league tables and for students in terms of lateruniversity entrance. It may be the case that ‘hard’ subjects require a final gradeadjustment commensurate with their comparative difficulty to reverse theobserved recent enrolment trends in these subjects (Dearing, 1996; Fitz-Gibbonand Vincent, 1994; Fitz-Gibbon, 1999).Where possible substitutability existsbetween subjects the analysis suggests that the ‘harder’ of the two will lose interms of enrolments. Quantifying the impact of factors that influence the selectionof subjects at A-level is clearly useful to the policy maker engaged in curriculumdesign.

Modelling Curriculum Choice at A-level: Why is Business Studies More Popular than Economics?
73
Appendix
Source: DfEE (various years) Statistics of Education: Public Examinations GCSE and GCE,London: HMSO.
Table A1 Summary statistics for Economics and Business Studies samples
Variable Economics Business z-score/chi-Studies squared tests(a)
A-level grade performance:A 0.227 0.122 10.20B 0.175 0.218 –3.86C 0.192 0.229 –3.34D 0.166 0.187 –2.07E 0.110 0.133 –2.20N/U 0.130 0.111 2.13χ2
5120.47 (0.00)
Gender:Male 0.579 0.510 4.950
Figure A1. Total number of students taking A-level examinations in Economics andBusiness Studies: England 1992–2004
0
5 0 0 0
1 0 0 0 0
1 5 0 0 0
2 0 0 0 0
2 5 0 0 0
3 0 0 0 0
3 5 0 0 0
4 0 0 0 0
Exam Year
Tota
lStu
dent
Num
bers
Economics
Economics
Business Studies
Business Studies
3 6 2 2 5 3 3 2 4 6 2 8 3 2 2 2 3 9 4 3 2 1 8 4 2 2 0 2 1 7 1 8 8 6 9 1 8 8 6 5 1 7 7 4 2 1 6 8 1 2 1 3 6 2 8 1 3 7 4 2 1 3 4 2 1
1 8 4 6 6 2 1 9 8 2 2 4 5 7 4 2 5 7 6 0 2 7 7 1 6 3 0 0 4 7 3 2 1 0 2 3 3 0 8 3 3 3 1 7 7 3 0 9 2 2 3 2 9 5 1 3 3 5 6 0 3 1 3 1 8
9 2 9 3 9 4 9 5 9 6 9 7 9 8 9 9 2 0 0 0 2 0 0 1 2 0 0 2 2 0 0 3 2 0 0 4

International Review of Economics Education
74
Table A1 (continued) Summary statistics for Economics and Business Studiessamples
Variable Economics Business z-score/chi-Studies squared tests(a)
Ethnic background:White 0.827 0.888 –6.368Black 0.026 0.026 0.000Asian 0.107 0.064 5.668Chinese 0.014 0.007 2.510Other 0.026 0.015 2.763χ2
450.13 (0.00)
Mother tongue – English 0.914 0.944 –4.452
GCSE background:GCSE score 6.167 5.666 24.530
GCSE Maths – A/A* 0.402 0.162 20.609GCSE Maths – B 0.398 0.385 0.897GCSE Maths – C 0.185 0.393 –16.428GCSE Maths – D 0.015 0.060 –7.886χ2
3532.13 (0.00)
School type:LEA 0.299 0.222 6.389Grant maintained 0.206 0.116 9.118Private 0.208 0.113 9.646Sixth-form college 0.170 0.294 –10.414Further education college 0.117 0.255 –12.432χ2
4378.27 (0.00)
Student’s attitude to subject:I do not find it hard to get down to work 0.524 0.572 –3.439I look forward to lessons 0.494 0.517 –1.671I like exams and tests 0.162 0.166 –0.326I think about the subject a lot, even in my spare time 0.330 0.259 5.671
Student’s desired occupational category Professional I 0.684 0.498 13.664Professional II 0.218 0.358 –11.029Skilled (manual/non-manual) 0.027 0.075 –7.372Unskilled (manual/non-manual) 0.009 0.005 1.628Category missing 0.062 0.064 –0.269χ2
4287.12 (0.00)

Modelling Curriculum Choice at A-level: Why is Business Studies More Popular than Economics?
75
Table A1 (continued) Summary statistics for Economics and Business Studiessamples
Variable Economics Business z-score/chi-Studies squared tests(a)
Parental characteristics:Mother’s job characteristicsProfessional I(b) 0.097 0.067 4.088Professional II(c) 0.258 0.194 5.503Skilled (manual/non-manual)(d) 0.498 0.563 –4.717Unskilled (manual/non-manual)(e) 0.090 0.120 –3.429Category missing 0.057 0.056 0.220χ2
459.77 (0.00)
Mother’s employment statusUnemployed 0.018 0.024 –1.350Full-time employment 0.375 0.391 –1.110Part-time employment 0.323 0.330 –0.598Self-employed 0.070 0.069 0.094Other 0.214 0.186 2.504χ2
48.33 (0.08)
Mother’s educationSecondary education 0.393 0.533 –10.129Further education 0.352 0.317 2.629Higher education 0.255 0.150 9.729χ2
2132.27 (0.00)
Father’s job characteristicsProfessional I(b) 0.394 0.278 8.980Professional II(c) 0.373 0.394 –1.515Skilled (manual/non-manual)(d) 0.169 0.240 –6.210Unskilled (manual/non-manual)(e) 0.037 0.059 –3.730Category missing 0.027 0.029 –0.422χ2
498.21 (0.00)
Father’s employment statusUnemployed 0.027 0.032 –1.016Full-time employment 0.689 0.705 –1.274Part-time employment 0.029 0.023 1.206Self-employed 0.194 0.181 1.222Other 0.061 0.059 0.396χ2
44.63 (0.33)
International Review of Economics Education
76
Table A1 (continued) Summary statistics for Economics and Business Studiessamples
Variable Economics Business z-score/chi-Studies squared tests(a)
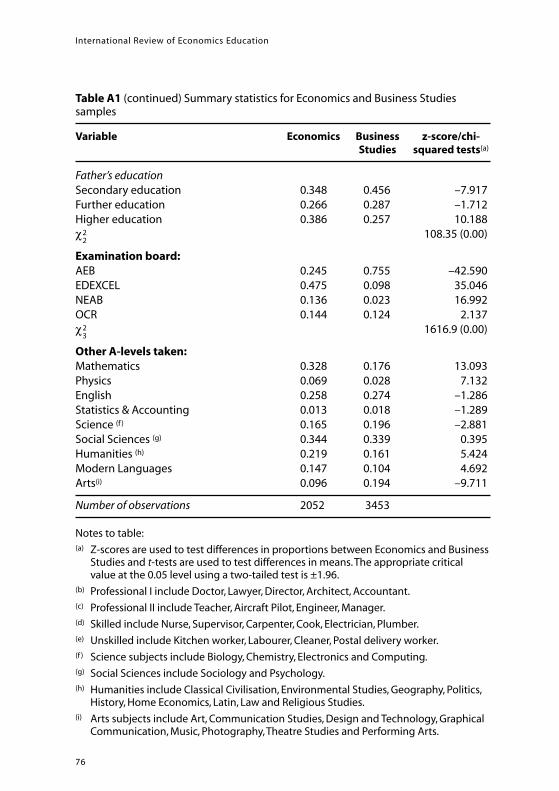
Father’s educationSecondary education 0.348 0.456 –7.917Further education 0.266 0.287 –1.712Higher education 0.386 0.257 10.188χ2
2108.35 (0.00)
Examination board:AEB 0.245 0.755 –42.590EDEXCEL 0.475 0.098 35.046NEAB 0.136 0.023 16.992OCR 0.144 0.124 2.137χ2
31616.9 (0.00)
Other A-levels taken:Mathematics 0.328 0.176 13.093Physics 0.069 0.028 7.132English 0.258 0.274 –1.286Statistics & Accounting 0.013 0.018 –1.289Science (f ) 0.165 0.196 –2.881Social Sciences (g) 0.344 0.339 0.395Humanities (h) 0.219 0.161 5.424Modern Languages 0.147 0.104 4.692Arts(i) 0.096 0.194 –9.711
Number of observations 2052 3453
Notes to table:(a) Z-scores are used to test differences in proportions between Economics and Business
Studies and t-tests are used to test differences in means.The appropriate criticalvalue at the 0.05 level using a two-tailed test is ±1.96.
(b) Professional I include Doctor, Lawyer, Director, Architect, Accountant.(c) Professional II include Teacher, Aircraft Pilot, Engineer, Manager.(d) Skilled include Nurse, Supervisor, Carpenter, Cook, Electrician, Plumber.(e) Unskilled include Kitchen worker, Labourer, Cleaner, Postal delivery worker.(f ) Science subjects include Biology, Chemistry, Electronics and Computing.(g) Social Sciences include Sociology and Psychology.(h) Humanities include Classical Civilisation, Environmental Studies, Geography, Politics,
History, Home Economics, Latin, Law and Religious Studies.(i) Arts subjects include Art, Communication Studies, Design and Technology, Graphical
Communication, Music, Photography,Theatre Studies and Performing Arts.
Modelling Curriculum Choice at A-level: Why is Business Studies More Popular than Economics?
77
Table A2 Maximum likelihood ordered probit estimates for performance in Economicsand Business Studies
Variable Business Studies Economics
Constant –5.155 –6.300Male 1.454 (0.321)*** 0.239 (0.062)***
Ethnic background:Asian –0.140 (0.095) –0.101 (0.101)Black –0.022 (0.116) –0.05 (0.154)Chinese –0.301 (0.231) –0.509 (0.211)**Other –0.150 (0.150) 0.132 (0.157)Mother tongue – English –0.052 (0.106) –0.039 (0.112)
GCSE background:GCSE score 1.109 (0.050)*** 1.192 (0.051)***GCSE score x Male –0.234 (0.056)*** 0 (0)GCSE Maths – A/A* 0.323 (0.078)*** 0.371 (0.099)***GCSE Maths – B 0.203 (0.046)*** 0.151 (0.074)**GCSE Maths – D –0.076 (0.082) –0.189 (0.222)
School type:FE college –0.222 (0.069)*** –0.065 (0.085)Grant maintained 0.121 (0.067) –0.241 (0.1)**Private –0.005 (0.067) –0.047 (0.074)Sixth form college 0.122 (0.052)** –0.016 (0.075)GM x Male f 0.375 (0.123)***FE x Male 0.202 (0.083)** f
Examination board:EDEXEL –0.389 (0.062)*** 0.259 (0.061)***NEAB 0.427 (0.123)*** –0.03 (0.082)OCR –0.115 (0.058)** 0.221 (0.082)***
Other A-levels taken:Maths 0.124 (0.061)** –0.04 (0.068)English 0.139 (0.047)*** –0.119 (0.066)Physics 0.018 (0.117) 0.03 (0.106)Statistics & Accounting 0.195 (0.140) –0.151 (0.223)Science 0.074 (0.052) –0.106 (0.074)Humanities 0.276 (0.054)*** 0.273 (0.067)***Social Science 0.255 (0.044)*** 0.139 (0.061)**Arts 0.054 (0.070) –0.265 (0.124)**Modern Language 0.009 (0.068) –0.14 (0.08)Arts x Male –0.279 (0.092)*** –0.336 (0.163)**

International Review of Economics Education
78
Table A2 (continued) Maximum likelihood ordered probit estimates for performance inEconomics and Business Studies
Variable Business Studies Economics
Attitudinal variables:Not hard to work 0.185 (0.039)*** 0.247 (0.072)***Think about subject 0.097 (0.043)** 0.179 (0.057)***Log-likelihood value –5177.3 –2863.8Pseudo-R2 0.144 0.209
Observations 3453 2052
ReferencesAshworth, J., and Evans, L. (1999) ‘Lack of knowledge Deters Women from StudyingEconomics’, Educational Research, 41, 209–227.
Ashworth, J., and Evans, L. (2000) ‘Economists are Grading Students Away from theSubject’, Educational Studies, 26, 475–487.
Ashworth, J., and Evans, L. (2001) ‘Modelling Student Choice at Secondary and TertiaryLevel: A Cross-section Study’, Journal of Economic Education, 32 (4), 311–320.
Bachan, R., and Reilly, B. (2003) ‘A Comparison of Academic Performance in A-levelEconomics Between Two Years’, International Review of Economics Education, 1, (2) 8–24.
Burnett, N. (1997) ‘Gender Economics Courses in Liberal Arts Colleges’, Journal ofEconomic Education, 28 (4) 369–376.
Davies, S., and Guppy, N. (1997) ‘Fields of Study, College Selectivity, and StudentInequalities in Higher Education’, Social Forces, 75, 1417–1438.
Dearing, R. (1996) Review of Qualifications for 16–19 Year Olds, London: NationalCurriculum Council and School Assessment Council.
DfEE (1999 and various issues), Statistics of Education: Public Examinations GCE and GCSE,London: HMSO.
Dryler, H. (1998) ‘Parental Role Models, Gender and Educational Choice’, British Journal ofSociology, 49, 375–398.
Dynan K. E., and Rouse, C. E. (1997) ‘The Under-representation of Women in Economics: AStudy of Undergraduate Economics Students’, Journal of Economic Education, 28,350–368.
Ferber, M. (1995) ‘The Study of Economics: A Feminist Critique’, American Economic Review(papers and Proceedings), 85, 335–361.
Fitz-Gibbon, C.T. (1999) ‘Long Term Consequences of Curriculum Choices with ParticularReference to Mathematics and Science’, School Effectiveness and School Improvement, 10,217–232.
Fitz-Gibbon, C.T. and Vincent, L. (1994) Candidates’ Performance in Public Examination inMathematics and Science, London, School Curriculum and Assessment Authority.
Gallagher,T., McEwan, A. and Knipe, D. (1997) ‘Science Education Policy: A survey of theParticipation of Sixth-Form Pupils in Science and other Subjects over a 10-year period,1985–1995’, Research Papers in Education, 12 (2), 121–142.
Modelling Curriculum Choice at A-level: Why is Business Studies More Popular than Economics?
79
Garratt, L. (1986) ‘Gender Differences in Relation to Science Choice at A level’, EducationalReview, 38 (1), 67–77.
Garratt, L. (1985) ‘Factors Affecting Subject Choice at A-level’, Educational Studies, 11 (2),127–132.
Greene B. (1997) ‘Verbal Abilities, Gender and the Introductory Economics Course: A NewLook at Old Assumptions’, Journal of Economic Education, 28 (Winter), 13–30.
Hansen, M. (1997) ‘Social and Economic Inequality in the Educational Career: Do theEffects of Social Background Characteristics Decline’, European Sociological Review, 13,305–321.
Horvath, J., Beaudin, B. Q. and Wright, S. P. (1992) ‘Persisting in the Introductory EconomicsCourse: An Exploration of Gender Differences’, Journal of Economic Education, 23,101–108.
Jensen, E. and Owen, L. (2000) ‘Why Are Women Reluctant Economists? Evidence fromLiberal Arts Colleges’, American Economic Review Papers and Proceedings, 90, 466–470.
Jonsson, J. (1999) ‘Explaining Sex Differences in Educational Choice: An EmpiricalAssessment of a Rational Choice Model’, European Sociological Review, 15, 391–404.
McEwan, A., Curry, C. A. and Watson, J. (1986) ‘Subject Preference at A level in NorthernIreland’, European Journal of Science Education, 8(1), 39–49.
Reilly B. and Bachan, R. (2005) ‘A Comparison of A-level Performance in Economics andBusiness Studies: How Much More Difficult is Economics?’, Education Economics, 13 (1),85–108.
Royal Society (2005) ‘A-level science entries still a cause for concern’, Press Release,www.royalsoc.ac.uk/news, accessed 18 August 2005.
Ryrie, A. C. (1981) ‘Rules and Results: A Study of Later Years Schooling’, SCRE PublicationNo. 75, Sevenoaks: Hodder and Stoughton.
Stables, A. and Stables, S. (1995) ‘Gender Differences in Students Approaches to A-levelSubjects: A Study of First-year A level Students in a Tertiary College’, Educational Research,37 (1), 39–51.
Stables, A. and Wikeley, F. (1997) ‘Changes in Preference for and Perceptions of RelativeImportance of Subjects During a Period of Educational Reform’, Educational Studies, 23,393–403.
Werfhorst, H., Sullivan, A. and Cheung, S. (2002) ‘Social Class, Ability and Choice ofSubjects in Secondary and Tertiary Education in Britain’, Mimeo, Nuffield College Oxford.Available at http://www.nuff.ox.ac.uk/users/werfhorst/
Williams, M.L., Waldauer, C. and Duggal, V.G. (1992) ‘Gender Differences in EconomicKnowledge: An Extension of the Analysis’, Journal of Economic Education, 23, 219–231.
Notes1 All the awarding bodies in England introduced the new two-year A-level award in
2000.The AS award is aimed at broadening the candidate’s range of studies (studentsin their first year of study are able to study, in most cases, up to five AS courses),postponing specialism until the second year of study.The AS accounts for 50% of thefull A-level award and was first awarded in August 2001. Students are then able tochoose which courses they intend to continue with after their first year of study(usually up to three) leading to the full A-level qualification in their second year ofstudy. It should be noted that there are six grade classifications at A-levels: from agrade A (highest pass grade) to a grade E (lowest pass grade) and N/U (failure).

International Review of Economics Education
80
2 New courses previously not available on the post-16 curriculum such as GNVQAdvanced Business (which may be viewed as a competing vocational optionalsubject),Theatre Studies, Media Studies, and Physical Education may appear moreattractive to students in terms of their modes of assessment and their less-challenging content. It is worth noting that the number of students sittingexaminations in Communication Studies (which represents a group of subjects thatwere not established A-levels in the early 1990s) rose by 92% between 1992 and2000 (DfEE).
3 The average GCSE score is calculated as the total GCSE points score achieved by acandidate divided by the number of GCSE subjects taken.The point scores are:A* = 8 points, A = 7, B = 6, C = 5, D = 4, E = 3, F = 2, G = 1.
4 The following tariff was used: A = 10, B = 8, C = 6, D = 4, E = 2 and N/U = 0 (note thatthe current UCAS tariff, which is not used in this analysis, is: A = 120, B =100, C = 80,D = 60, E = 40 and N/U = 0).
5 A likelihood ratio test was performed to test for any statistical justification forsplitting the sample by gender.The Chi-squared statistic (46.72, with 34 degrees offreedom) proved only to be significant at 7%, and the pooled model the moreappropriate.
6 It should be stressed that the findings and conclusions relate to just one cohortdrawn from 1998. It is conceded that a different picture may emerge in later years.
Acknowledgments
The authors would like to thank, Barry Reilly, Tom Bourner, Tim Fry, participants atthe World Conference on Economic Education, held in Adelaide, July 13-16 2004and two anonymous referees for constructive comments on earlier drafts of thispaper.
Contact detailsRay BachanBrighton Business SchoolUniversity of BrightonBrighton BN2 4ATUK
email: [email protected]
Michael BarrowDepartment of EconomicsUniversity of SussexFalmerBrighton BN1 9QNUK
email: [email protected]