Modelling and measurements of channel impulse response for an indoor wireless communication system
6
Modelling and measurements of channel impulse response for an indoor wireless communication system S.Y. Tan H.S. Tan tdexing terms: Channel impulse response, Indoor wireless communications, Uniform theory of diffraction Abstract: The paper presents a three-dimensional vector propagation model applicable to an indoor wireless communication system, in which the scat- terers are grouped into two categories, i.e. deter- ministic scatterers and randomly distributed scatterers. Exact information on locations and dimensions are used for the former category, while the rest of the scatterers are assumed to be ran- domly distributed with estimated statistical parameters. The model is based on the uniform theory of diffraction (UTD), multiple-image theory and a ray-launching technique to include all pos- sible reflections and diffractions from ceiling, floor, walls, columns, edges and corners. Theoretical results of the power delay profiles and root-mean- square delay spreads are compared with indoor measurements done in Ottawa and Kyoto published by other authors. The good agreement with these measurements indicates that our model works well for such indoor microcellular commu- nication applications. 1 Introduction Most of the published models for channel impulse response for indoor wireless communications are based on statistical fits of the measured data [l, 21. Statistical models are useful for checking certain characteristics and features of the type of environment being measured, but these models lack the generality and rigor of a basic theoretical formulation. For a prediction method to be applicable to a variety of propagation environments, it should be based on a general propagation theory which can integrate site-specific data into the model. Several such models have been published in the literature [3-71, which can predict path loss, impulse response and the RMS delay spread with various degrees of approx- imation. However, these models only calculate the power density of each signal component and do not take into account the polarisation, and include only a limited number of multiple reflections or diffractions. In earlier papers [S-lo] we have formulated a theory for propaga- tion path loss characteristics in an urban street scene 0 IEE, 1995 Paper 2050H (Ell), first received 8th November 1994, and in final re- vised form 7th April 1995 The authors are with the School of Electrical and Electronic Engineer- ing, Nanyang Technological University, Singapore 2263, Republic of Singapore IEE Proc.-Microw. Antennas Propag., Vol. 142, No. 5, October 1995 based on UTD and multiple-image concepts. This theory takes into account all possible multiple reflections between wall-to-wall, wall-to-ground and ground-to-wall as well as diffraction from corners of buildings, and also subsequent reflections from such diffracted signals, by using a two-dimensional ray-launching technique on the plan view of the street scene. However, the models in [S-101 are only applicable to an outdoor environment, where the buildings are much higher than transmitter and receiver heights, and there are no ceilings and roofs. The purpose of this paper is to derive an improved three-dimensional vector propagation model to remove the above-mentioned limitations and to apply the new model to an indoor propagation scene, i.e. multiple reflections and diffractions between floor, walls, columns, ceilings, etc. are now included. The presence of ceiling- floor reflections and scattering from furniture with low heights add significantly to the complexity of the model compared with that in [S-lo]. We now have to do a three-dimensional ray-launching technique to include these reflections and scattering. In addition, the effects of furniture, partitions, etc. are included in our model by assuming that they are randomly distributed with a given probability density function depending on the propaga- tion environment. The major concepts and formulations for our model have been explained in our previous papers [S-lo], and further refinements are briefly described in the following Section. 2 Theory and formulation The impulse response of a multipath channel can be modelled mathematically as [l] where K is the number of multipath components, E,, tk are the electric field and propagation delay, respectively, of a particular signal path, and 6 is the Dirac delta func- tion. For a measuring system having a finite time resolution t, , multipath components arriving with time intervals smaller than the measurement system’s t, cannot be resolved as contributions from distinct paths, and are detected as a single signal component. In our model, we take the vector sum of these unresolvable multipath components and treat it as a single signal com- ponent. This is analogous to the discrete-time impulse response model used in [ll, 121, where the time axis is divided into small time intervals called ‘bins’. Each bin is assumed to contain either one or no multipath com- ponent. The calculations for E, and tk follow our pre- vious theory [S-lo], except that we now include 405
Transcript of Modelling and measurements of channel impulse response for an indoor wireless communication system

Modelling and measurements of channel impulse response for an indoor wireless communication system
S.Y. Tan H.S. Tan
tdexing terms: Channel impulse response, Indoor wireless communications, Uniform theory of diffraction
Abstract: The paper presents a three-dimensional vector propagation model applicable to an indoor wireless communication system, in which the scat- terers are grouped into two categories, i.e. deter- ministic scatterers and randomly distributed scatterers. Exact information on locations and dimensions are used for the former category, while the rest of the scatterers are assumed to be ran- domly distributed with estimated statistical parameters. The model is based on the uniform theory of diffraction (UTD), multiple-image theory and a ray-launching technique to include all pos- sible reflections and diffractions from ceiling, floor, walls, columns, edges and corners. Theoretical results of the power delay profiles and root-mean- square delay spreads are compared with indoor measurements done in Ottawa and Kyoto published by other authors. The good agreement with these measurements indicates that our model works well for such indoor microcellular commu- nication applications.
1 Introduction
Most of the published models for channel impulse response for indoor wireless communications are based on statistical fits of the measured data [l, 21. Statistical models are useful for checking certain characteristics and features of the type of environment being measured, but these models lack the generality and rigor of a basic theoretical formulation. For a prediction method to be applicable to a variety of propagation environments, it should be based on a general propagation theory which can integrate site-specific data into the model. Several such models have been published in the literature [3-71, which can predict path loss, impulse response and the RMS delay spread with various degrees of approx- imation. However, these models only calculate the power density of each signal component and do not take into account the polarisation, and include only a limited number of multiple reflections or diffractions. In earlier papers [S-lo] we have formulated a theory for propaga- tion path loss characteristics in an urban street scene
0 IEE, 1995 Paper 2050H (Ell), first received 8th November 1994, and in final re- vised form 7th April 1995 The authors are with the School of Electrical and Electronic Engineer- ing, Nanyang Technological University, Singapore 2263, Republic of Singapore
IEE Proc.-Microw. Antennas Propag., Vol. 142, No. 5, October 1995
based on UTD and multiple-image concepts. This theory takes into account all possible multiple reflections between wall-to-wall, wall-to-ground and ground-to-wall as well as diffraction from corners of buildings, and also subsequent reflections from such diffracted signals, by using a two-dimensional ray-launching technique on the plan view of the street scene. However, the models in [S-101 are only applicable to an outdoor environment, where the buildings are much higher than transmitter and receiver heights, and there are no ceilings and roofs.
The purpose of this paper is to derive an improved three-dimensional vector propagation model to remove the above-mentioned limitations and to apply the new model to an indoor propagation scene, i.e. multiple reflections and diffractions between floor, walls, columns, ceilings, etc. are now included. The presence of ceiling- floor reflections and scattering from furniture with low heights add significantly to the complexity of the model compared with that in [S-lo]. We now have to do a three-dimensional ray-launching technique to include these reflections and scattering. In addition, the effects of furniture, partitions, etc. are included in our model by assuming that they are randomly distributed with a given probability density function depending on the propaga- tion environment. The major concepts and formulations for our model have been explained in our previous papers [S-lo], and further refinements are briefly described in the following Section.
2 Theory and formulation
The impulse response of a multipath channel can be modelled mathematically as [l]
where K is the number of multipath components, E , , t k
are the electric field and propagation delay, respectively, of a particular signal path, and 6 is the Dirac delta func- tion. For a measuring system having a finite time resolution t, , multipath components arriving with time intervals smaller than the measurement system’s t, cannot be resolved as contributions from distinct paths, and are detected as a single signal component. In our model, we take the vector sum of these unresolvable multipath components and treat it as a single signal com- ponent. This is analogous to the discrete-time impulse response model used in [ l l , 121, where the time axis is divided into small time intervals called ‘bins’. Each bin is assumed to contain either one or no multipath com- ponent. The calculations for E , and t k follow our pre- vious theory [S-lo], except that we now include
405

reflections from ceiling and furniture, and allow for any number of turns in the propagation path. Other refine- ments to the theory are also included. The major dgi- culty in the formulation is to determine E, and tk for all possible k. In our theoretical model this means that the exact point of reflection at a surface, or exact point of diffraction at an edge, and the corresponding planes of incidence have to be determined for all possible propaga- tion paths. This is necessary to enable us to calculate the polarisation components of the reflected or diffracted rays and their propagation delays. In our calculations, the transmitting and receiving antennas are modelled as omnidirectional dipoles with radia;tion patterns and pol- arisations characterised by sin ($)$, where $ is the polar angle.
For determining the location of these points of reflec- tion and diffraction, we show in [8-101 that the concept of multiple images is necessary to simplify the formula- tion. The use of these multiple images greatly facilitates the tracking and calculation of the rays which finally arrive at the receiver. The multiple-image concept requires that the location and sequence of all the images involved and their reflecting planes be determined [8-101. In our present model this is done by using a three-dimensional ‘test ray’ or ray-launching techique [13]. The fundamental operation in the ray-launching techique is the intersection of a ray with an object. To find this intersection poict, we define a ray given by &(p) = I?, + R,p, where R is a vector denoting the ray’s origin, which is initially at the transmitter. Subsequently t2is origin is at each reflection point under consideration. R, is a unit vector in the ray direction and p represents the distance from the ray’s origin. The procedure to determine the ray/object intersection for all possible ray paths is as follows: R, scans through the three- dimensional space with constant angular separation a. After the direct path has been checked for obstructions, the program traces a ray from the source in a predeter- mined direction and detects if an intersection with an object has occurred. In our model, these objects are divided into two groups : deterministic objects (e.g. walls and columns), and randomly distributed objects (e.g. fur- niture and equipment distributed in between the deter- ministic objects). We first check the ray’s intersection with deterministic objects, using the formulation set out in [lo] but modified for tracing the rays in a three- dimensional space. For randomly distributed objects, the probability of obstructions is assumed to be PobS(D, q) = (1 - e-:’“), where D is the distance between the ray’s origin R , and the point of reflection on a deterministic object, while is the ‘mean obstruction distance’ due to randomly distributed objects, with values depending on the propagation environment. For example, in a room with no random objects, y~ = CO and Pobs = 0 irrespective of D. If obstructions occur with random objects, a new reflection point and the reflecting plane are calculated based on the assumption that the reflection points from the obstructions are distributed with equal probability along the ray path. If an intersection occurs, the location of the images involved, the reflecting planes, the surface normals and the direction of the reflected ray are com- puted. The program then checks if the reflected ray reached the receiver’s vicinity and counts the number of reflections encountered. This process is repeated until a maximum number of reflections is exceeded.
The test to determine if a reflected ray reaches the receiver then follows. A reception sphere is constructed about the receiver point having a radius of adlJ3, where
406
d is the total distance of the propagation path from trans- mitter to receiver, including paths due to all multiple reflections. The reason for choosing a radius of ad/ J 3 is that ad is the distance swept out at the end of the ray when the launch angle is changed by a. Assuming the wavefront is locally plane, the rays can be visua as intersecting on the wavefront at points forming equi- lateral triangles whose edges are equal to ad. The radius of the circumscribing sphere for each triangle is then ad/,/3. A reception sphere of radius ad/J3 will then receive one and only one reflected ray provided the neighbouring rays are reflected from the scatterers origin- ating from the same set of reflecting planes. For better accuracy, a smaller value of a would be desirable to make the above assumption easier to realise. However, there is a tradeoff between the excessive computer time required if a is too small, and the possibility of missing out rays that would have contributed to the field at the receiver but are now excluded if a is too large. In this study we have used an a value of about lo, which is sufficient for the size of the building under consideration [7, 141, i.e. -40 x 20 m. For larger buildings and longer path lengths d, the value of a needed has to be reduced to keep the reception sphere’s radius sufficiently small.
After this three-dimensional ray-launching process, the exact three-dimensional path is determined by computing all the corresponding images, surface normals and reflect- ing planes to do the backware ray-tracing for the exact path from transmitter to receiver, as was done in our earlier papers [8-101. The electric field E, due to a partic- ular path is then computed, while the time delay t, is given by d/c, where c is the velocity of light.
For diffraction, we first determine whether a ray illu- minates a particular edge by constructing a reception cylinder consisting of a series of overlapping spheres, each with a radius ad/ J3. If the ray intersects the recep- tion cylinder and will contribute to the edge diffraction, the exact point of diffraction at the edge is determined by using the generalised Fermat principle, as was done in [8-101. For subsequent reflections from a wall, floor or ceiling after this diffraction, Fermat’s principle is again used to determine the points of diffraction and reflection. The specularly reflected fields, diffraction fields, diffraction-specular and specular-diffraction fields are cal- culated and vectorially summed if their differential delay is less than t, .
For the reception test to be valid, the rays must be launched such that each ray is separated from the neigh- bouring rays by a constant angle a. The ray-launching in three-dimensional space with constant angular separa- tion between neighbouring rays is equivalent to the problem of symmetrically dividing a closed surface about a centre point into areas of congruent polygons. The geometry so formed is a regular polyhedral. However, there exist only five regular polyhedrals [lS], i.e. tetra- hedron, cube, octahedron, dodecahedron and icosahe- dron. Each polyhedral has an inscribed sphere and a circumscribing sphere, the spheres being concentric. The best angular resolution among the five regular poly- hedrals is given by the icosahedron, which has 20 equi- lateral triangles as facets, with 12 vertices and 30 edges as shown in Fig. 1. If rays are launched from the vertices, each ray will have five neighbouring rays separated by the same angle a, which is about 63.5”. However, this angular separation is too large for our purpose. To achieve better accuracy, a smaller value of a is obtained by subdividing each equilateral triangle into four smaller equilateral triangles, and this process is repeated as many
IEE Proc.-Microw. Antennas Propag , Vol. 142, No. 5, October 1995
times as desired, as shown in Fig. 1. If M is the number of subdividions of the equilateral triangles in this process, the number of vertices generated is given by
Fig. 1 Icosahedron showing subdivision of equilateral triangles
3 c 40 t
U' 0 5 10 15 20 25
distance'm
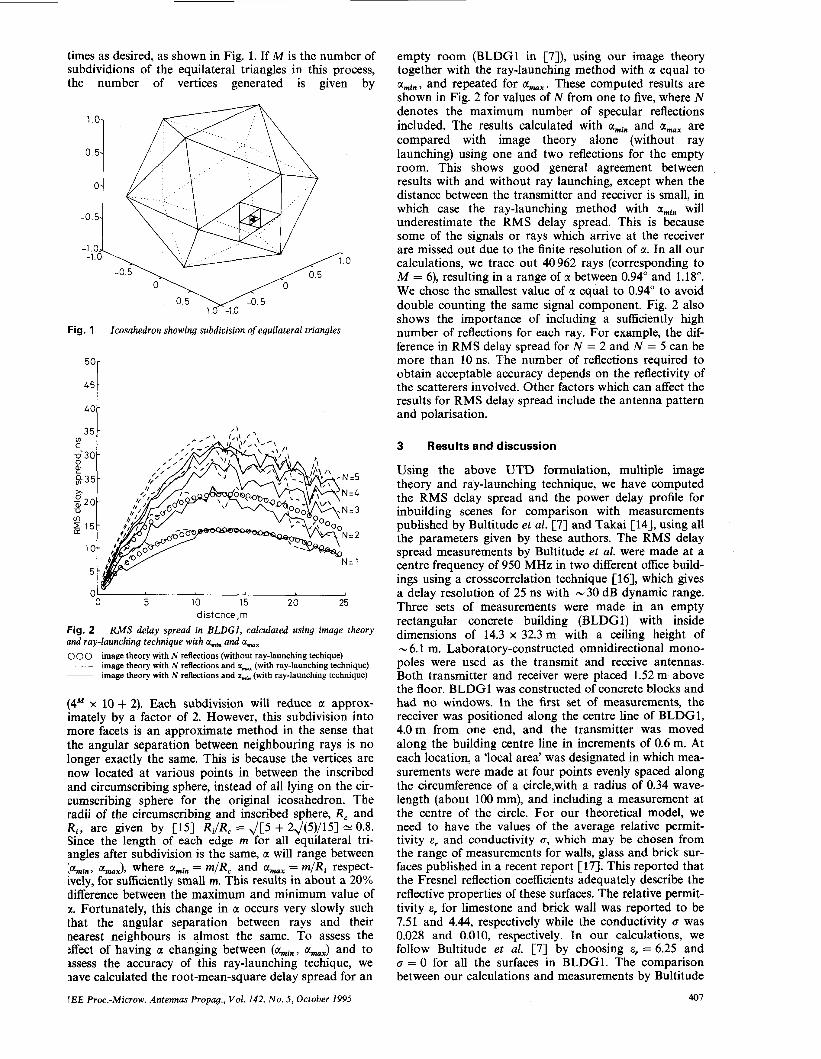
Fig. 2 and ray-launching technique with amh and amx 0 0 0 image theory with N reflections (without ray-launching techique) ~ _ _ _ image theory with N reflections and amX (with ray-launching technique) ~ image theory with N reflections and amin (with ray-launching technique)
RMS delay spread in BLDGI, calculated using image theory
(4" x 10 + 2). Each subdivision will reduce a approx- imately by a factor of 2. However, this subdivision into more facets is an approximate method in the sense that the angular separation between neighbouring rays is no longer exactly the same. This is because the vertices are now located at various points in between the inscribed and circumscribing sphere, instead of all lying on the cir- cumscribing sphere for the original icosahedron. The radii of the circumscribing and inscribed sphere, R, and R i , are given by [15] RJR, = J [ 5 + 2J(5)/15] 1: 0.8. Since the length of each edge m for all equilateral tri- angles after subdivision is the same, a will range between [amin, a,,,), where amin = m/R, and a,,, = m/Ri respect- ively, for sufficiently small m. This results in about a 20% difference between the maximum and minimum value of x . Fortunately, this change in a occurs very slowly such that the angular separation between rays and their nearest neighbours is almost the same. To assess the :ffect of having a changing between (amin, a,=,) and to mess the accuracy of this ray-launching techique, we lave calculated the root-mean-square delay spread for an
empty room (BLDG1 in [7]), using our image theory together with the ray-launching method with a equal to amin, and repeated for am,,. These computed results are shown in Fig. 2 for values of N from one to five, where N denotes the maximum number of specular reflections included. The results calculated with amin and amax are compared with image theory alone (without ray launching) using one and two reflections for the empty room. This shows good general agreement between results with and without ray launching, except when the distance between the transmitter and receiver is small, in which case the ray-launching method with amin will underestimate the RMS delay spread. This is because some of the signals or rays which arrive at the receiver are missed out due to the finite resolution of a. In all our calculations, we trace out 40 962 rays (corresponding to M = 6), resulting in a range of a between 0.94" and 1.18'. We chose the smallest value of c1 equal to 0.94" to avoid double counting the same signal component. Fig. 2 also shows the importance of including a sufficiently high number of reflections for each ray. For example, the dif- ference in RMS delay spread for N = 2 and N = 5 can be more than 1011s. The number of reflections required to obtain acceptable accuracy depends on the reflectivity of the scatterers involved. Other factors which can affect the results for RMS delay spread include the antenna pattern and polarisation.
3 Results and discussion
Using the above UTD formulation, multiple image theory and ray-launching technique, we have computed the RMS delay spread and the power delay profile for inbuilding scenes for comparison with measurements published by Bultitude et al. [7] and Takai [14], using all the parameters given by these authors. The RMS delay spread measurements by Bultitude et al. were made at a centre frequency of 950 MHz in two different office build- ings using a crosscorrelation technique [ 161, which gives a delay resolution of 25 ns with -30 dB dynamic range. Three sets of measurements were made in an empty rectangular concrete building (BLDGl) with inside dimensions of 14.3 x 32.3 m with a ceiling height of N 6.1 m. Laboratory-constructed omnidirectional mono- poles were used as the transmit and receive antennas. Both transmitter and receiver were placed 1.52 m above the floor. BLDGl was constructed of concrete blocks and had no windows. In the first set of measurements, the receiver was positioned along the centre line of BLDG1, 4.0m from one end, and the transmitter was moved along the building centre line in increments of 0.6 m. At each location, a 'local area' was designated in which mea- surements were made at four points evenly spaced along the circumference of a circle,with a radius of 0.34 wave- length (about 100 mm), and including a measurement at the centre of the circle. For our theoretical model, we need to have the values of the average relative permit- tivity E, and conductivity Q, which may be chosen from the range of measurements for walls, glass and brick sur- faces published in a recent report [17]. This reported that the Fresnel reflection coefficients adequately describe the reflective properties of these surfaces. The relative permit- tivity E, for limestone and brick wall was reported to be 7.51 and 4.44, respectively while the conductivity CJ was 0.028 and 0.010, respectively. In our calculations, we follow Bultitude et al. [7] by choosing E, = 6.25 and Q = 0 for all the surfaces in BLDG1. The comparison between our calculations and measurements by Bultitude
IEE Proc.-Microw. Antennas Propag., Vol. 142, No. 5 , October 1995 407

et al. are shown in Fig. 3. Our model is seen to give good general agreement for the level and trends of the RMS delay spread for the five local-area measurements at each
60-
50
40- U
P 5 30- 0 aJ U
m
-
g 20-
10
-
-
0 X
3 5 -
2 3 0 - P $ 2 5 -
C
- 6 g 20- m 2 LL 15-
10-
1
5 10 15 20 25 distance, m
Fig. 3 ments for the centre-line local areas in BLDGl
# # ‘IC ‘IC + 0 x 0
Comparison of present model with Bultitude et al.’s measure-
Bultitude et al.’s measurements calculations of RMS delay spread at centre of local areas calculations of RMS delay spread at circumference of local areas
50
45
40
35
3 0 - P P 2 5 -
UI C
x 0 - g 2 0 - m 5 15-
10
transmitter-receiver separation. It can be seen that within the five points of measurements separated by only 0.34 wavelength, the RMS delay spread can vary by more than 20 ns. Therefore, for a measurement system having finite time delay resolution, the graphs for the RMS delay spread values deduced from isolated measurements can be expected to be irregular rather than smooth, as noted in [7]. These variations are due to the limited time resolution of the measurement system, i.e. signal com- ponents with differential delays less than t , cannot be resolved and are detected as a single component. The constructive and destructive interference of the signal components causes fluctuations in signal amplitude and results in a scatter of the values of RMS delay spread. The comparisons between our calculations and Bultitude et al.’s theory and measurements for the median values of the five local areas at each transmitter-receiver separation are shown in Fig. 4. It is seen that our model (both limited- and infinite-resolution) gives better correlation with the measurements than Bultitude’s simulations, because our theory has included all the major multipath contributions due to reflections from the walls, floor and ceiling, whereas Bultitude’s simulations are limited to a maximum of two reflections for each path. We have in fact included contributions from rays which have under- gone five reflections for each path. Computations includ- ing six reflections show no significant change from the cases for five reflections, indicating that five reflections suffice for these cases. Our programme for these compu- tations takes up -30 min for each data point using an HP 700 series workstation running Matlab. This compu- tation time could be reduced substantially by using a more efficient language like C.
The second set of measurements were made in a similar manner to the first set, with transmitter and re- ceiver following lines parallel to the side walls of the building but offset from its centre line, 1.52m from the side walls. The third set of measurements were made at
408
-
-
-
-
-
equally spaced ‘local areas’ with intervals of 3.05 m on the radii of circles centred at the receiver, which is 4.0 m from one end and 1.52 m from the side walls. Figs. 5 and
50 r
I ob 5 10 15 20 25 distance,rn
Fig. 4 Comparison of present model with Bultitude et al.’s measure- ments and simulations of median values of RMS delay spread at each local area in BLDGl __ Bultitude et al.’s measurements
Bultitude et al.’s simulations (limited resolution 25 ns) - Buititude et al.’s simulations (infinite resolution) -*- calculations of RMS delay spread (limited resolution 25 ns) -0- calculations of RMS delay spread (infinite resolution)
6 show a comparison of the results from our theoretical model with the measurements and simulations by Bulti- tude et al. in BLDG1. In Figs. 4-6, Baltitude’s simula-
5! 5 10 15 20 25
distance rn OO
Fig. 5 ments and simulations along a line 5 feet from side of BLDGl
~ Bultidude et al.’s measurements Bultitude et al.’s simulations (Iimlted resolutlon 25 ns)
~ Bultitude et al.’s simulations (infinite resolutlon) -*- calculations of RMS delay spread (limited resolution 25 ns) -0- calculahons of RMS delay spread (infinite resolution)
Comparison of present model with Bultitude et al.’s measure-
tions consistently underestimate the RMS delay spread by N 10 ns. Our model evidently gives better correlations with the measurements than Bultitude’s simpler theory because of our inclusion of all the major multipath con- tributions. In Fig. 5 it is interesting to note that, due to
I E E Proc.-Microw. Antennas Propag., Vol. 142, No. 5, October 1995

the finite resolution of the measuring system, at a transmitter-receiver separation of - 6.2 m there is a peak RMS delay spread which is -20 ns more compared to
m
XI =. 3 5 -
30-
25-
in 1
D
g 20- LL
15-
10-
50r
5 0 -
4 5 -
4 0 -
3 5 -
2 3 0 -
g 25-
U 0
U)
21
2 20- T3 m 5 1 5 -
10-
5 -
45 t 401
0 0 5 10 15 20 25
dis tance , m
Fig. 6 ments and simulations along concentric arcs in BLDGl _ _ _ _ Bultitude et al.’s measurements - Bultitude et al.’s simulations (infinite resolution) -#- calculations of RMS delay spread (limited resolution 25 ns) -0- calculations of RMS delay spread (infinite resolution 25 ns)
Comparison of present model with Bultitude et al.’s measure-
that of a system with infinite resolution. This indicates that, in a practical wireless system design, the per- formance degradation due to finite resolution has to be taken into account in order to avoid excessive bit-error rate.
The second building (BLDG2) was 38.1 m x 22.9 m with a ceiling hung at a height of 2.7 m on a metallic grid. It had large windows along three sides, with a reinforced concrete floor. Two sets of measurements were made in BLDG2, where the first set were made at increasing ranges along the centre line of the building when it was empty, and the second set of measurements was identical to the first, except that BLDG2 was fully furnished. In all these measurements, the heights of transmitter and re- ceiver were placed at 2.1 m above the floor level. In our calculations, the dielectric constant for the walls and windows were assumed to be 6.25 and 4.0, respectively [7]. The comparisons between our calculations and Bul- titude’s measurements and theory are shown in Figs. 7 and 8. From these Figures our model again gives better correlation with the measurements. For the case where BLDG2 was fully furnished, excellent agreement was obtained with a mean obstruction distance of rj = 5 m as shown in Fig. 8. A change of y~ from 3 to 6 m did not produce significant changes in the RMS delay spread. As a further test of our theoretical model, we have compared our calculations with measurements published by Takai [14]. Delay profile measurements were made by Takai [14] in a shielded room at 2.38 GHz using a pseudorandom-noise correlation method [18]. The room was surrounded by steel shell plates with wood and plas- terboard inner walls, with inside dimensions of 6.9 x 3.4 x 2.3 m and had no windows. The transmit and receive antennas were vertically polarised dipole antennas, placed at heights of 1.2 m and 1.8 m, respec- tively. The measurement system had a delay resolution of -33 ns and only one measuring location was used. In our calculations, the conductivity 0 for all the surfaces is
IEE Proc.-Microw. Antennas Propag., Vol. 142, No. 5, October 1995
varied from 50 S/m to infinity, and the comparisons between our theoretical results and measurements by Takai are shown in Fig. 9. It is seen that a value of 0
equal to 500 S/m gives the best correlation with the mea- surement data. The value of RMS delay spread in this
100-
90
80 -
c -70-
L S O -
5 5 0 -
-
U l
D 0
1
D ul
[L 2 40-
3 0 -
2 0 -
1 0 -
5 10 15 20 25 3 0 d i s t ance ,m
Fig. 7 ments and simulations along a centre line in an empty building BLDG2 _ _ _ _ Bultitude et al.’s measurements ~ Bultitude et al.’s simulations (limited resolution 25 ns) - Bultitude et al.’s simulations (infinite resolution) -#- calculations of RMS delay spread (limited resolution 25 ns) -0- calculations of RMS delay spread (infinite resolution)
Comparison of present model with Bultitude et al.’s measure-
I
I O’, 5 10 15 20 25
d i s t ance , m Fig. 8 Comparison of present model with Bultitude et al.’s measure- ments and simulations along a centre line of BLDG2 (empty and furnished)
Bultitude et al.’s measurements for empty building __ Bultitude et al.’s measurements for furnished building - Bultitude et al.’s simulations for both empty and furnished (infinite
resolution) -0- calculations of RMS delay spread (infinite resolution) for empty building
with q = m -#- calculations of RMS delay spread (infinite resolution) for furnished
building with q = 5 m
shielded room was -50 ns from both theory and meas- urements, which is greater than the RMS delay spread observed in Bultitude’s BLDGl and BLDG2, even
409
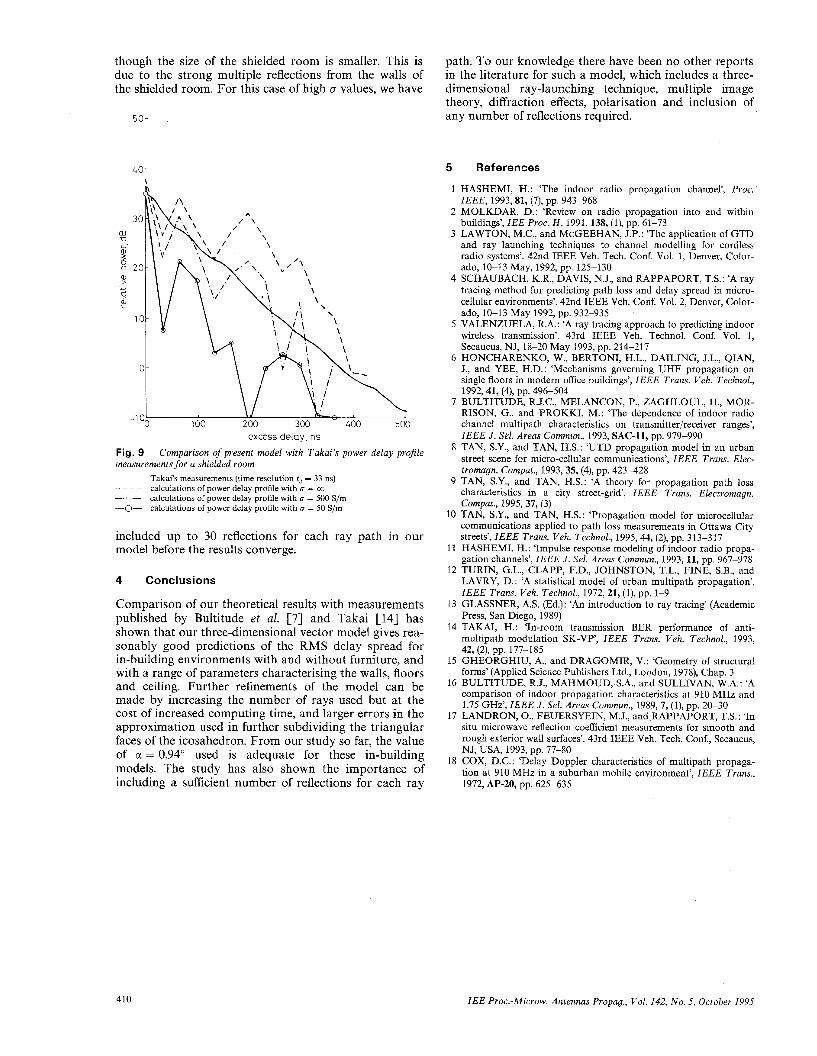
though the size of the shielded room is smaller. This is path. To our knowledge there have been no other reports due to the strong multiple reflections from the walls of in the literature for such a model, which includes a three- the shielded room. For this case of high D values, we have dimensional ray-launching technique, multiple image
theory, diffraction effects, polarisation and inclusion of any number of reflections required.
40 t A I\
excess delay, ns
Fig. 9 measurements for a shielded room ~ Takai’s measurements (time resolution t, = 33 ns) _ _ ~ ~ calculations of power delay profile with U = CO
calculations of power delay profile with U = 500 S/m -0- calculations of power delay proNe with U = 50 S/m
Comparison of present model with Takai‘s power delay profile
included up to 30 reflections for each ray path in our model before the results converge.
4 Conclusions
Comparison of our theoretical results with measurements published by Bultitude et al. [7] and Takai [14] has shown that our three-dimensional vector model gives rea- sonably good predictions of the RMS delay spread for in-building environments with and without furniture, and with a range of parameters characterising the walls, floors and ceiling. Further refinements of the model can be made by increasing the number of rays used but at the cost of increased computing time, and larger errors in the approximation used in further subdividing the triangular faces of the icosahedron. From our study so far, the value of G( = 0.94” used is adequate for these in-building models. The study has also shown the importance of including a sufficient number of reflections for each ray
5 References
1 HASHEMI, H.: ‘The indoor radio propagation channel’, Proc.
2 MOLKDAR, D.: ‘Review on radio propagation into and within buildings’, IEE Proc. H , 1991,138, (I), pp. 61-73
3 LAWTON, M.C., and McGEEHAN, J.P.: ‘The application of GTD and ray launching techniques to channel modelling for cordless radio systems’. 42nd IEEE Veh. Tech. Conf. Vol. 1, Denver, Color- ado, 10-13 May, 1992, pp. 125-130
4 SCHAUBACH, K.R., DAVIS, N.J., and RAPPAPORT, T.S.: ‘A ray tracing method for predicting path loss and delay spread in micro- cellular environments’. 42nd IEEE Veh. Conf. Vol. 2, Denver, Color- ado, 10-13 May 1992, pp. 932-935
5 VALENZUELA, R.A.: ‘A ray tracing approach to predicting indoor wireless transmission’. 43rd IEEE Veh. Technol. Conf. Vol. 1, Secaucus, NJ, 18-20 May 1993, pp. 214-217
6 HONCHARENKO, W., BERTONI, H.L., DAILING, J.L., QIAN, J., and YEE, H.D.: ‘Mechanisms governing UHF propagation on single floors in modern ofice buildings’, IEEE Trans. Veh. Technol.,
IEEE, 1993,81, (7), pp. 943-968
1992,41, (4), pp. 496-504 7 BULTITUDE, R.J.C., MELANCON, P., ZAGHLOUL, H., MOR-
RISON, G., and PROKKI, M.: ‘The dependence of indoor radio channel multipath characteristics on transmitter/receiver ranges’, IEEE J . Sel. Areas Commun., 1993, SAC-11, pp. 979-990
8 TAN, S.Y., and TAN, H.S.: ‘UTD propagation model in an urban street scene for micro-cellular communications’, IEEE Trans. Elec- tromagn. Compat., 1993,35, (4), pp. 423-428
9 TAN, S.Y., and TAN, H.S.: ‘A theory for propagation path loss characteristics in a city street-grid’, IEEE Trans. Electromagn. Compat., 1995,37, (3)
10 TAN, S.Y., and TAN, H.S.: ‘Propagation model for microcellular communications applied to path loss measurements in Ottawa City streets’, IEEE Trans. Veh. Technol., 1995, 44, (2), pp. 313-317
11 HASHEMI, H.: ‘Impulse response modeling of indoor radio propa- gation channels’, IEEE J . Sel. Areas Commun., 1993, 11, pp. 967-978
12 TURIN, G.L., CLAPP, F.D., JOHNSTON, T.L., FINE, S.B., and LAVRY, D.: ‘A statistical model of urban multipath propagation’, IEEE Trans. Veh. Technol., 1972,21, (I), pp. 1-9
13 GLASSNER, AS. (Ed.): ‘An introduction to ray tracing’ (Academic Press, San Diego, 1989)
14 TAKAI, H.: ‘In-room transmission BER performance of anti- multipath modulation SK-VP’, IEEE Trans. Veh. Technol., 1993, 42, (2), pp. 177-185
15 GHEORGHIU, A., and DRAGOMIR, V.: ‘Geometry of structural forms’ (Applied Science Publishers Ltd., London, 1978), Chap. 3
16 BULTITUDE, R.J., MAHMOUD, S.A., and SULLIVAN, W.A.: ‘A comparison of indoor propagation characteristics at 910 MHz and 1.75 GHz’, IEEE J . Sel. Areas Commun., 1989,7, (I), pp. 20-30
17 LANDRON, O., FEUERSYEIN, M.J., and RAPPAPORT, T.S.: ‘In situ microwave reflection coefficient measurements for smooth and rough exterior wall surfaces’. 43rd IEEE Veh. Tech. Conf., Secaucus, NJ, USA, 1993, pp. 77-80
18 COX, D.C.: ‘Delay Doppler characteristics of multipath propaga- tion at 910 MHz in a suburban mobile environment’, IEEE Trans., 1972, AP-20, pp. 625-635
410 IEE Proc.-Microw. Antennas Propag., Vol. 142, No. 5, October I995