
Modeling!and!Analysis!of!Nuclear!Fuel!Pin! Behavior!for ...
77
Inserire logo o denominazione del cobeneficiario Modeling and Analysis of Nuclear Fuel Pin Behavior for Innovative Lead Cooled FBR L. Luzzi, S. Lorenzi, D. Pizzocri, D. Rozzia, A. Aly, A. Del Nevo Report RdS/PAR2013/022 Agenzia nazionale per le nuove tecnologie, l’energia e lo sviluppo economico sostenibile MINISTERO DELLO SVILUPPO ECONOMICO
Transcript of Modeling!and!Analysis!of!Nuclear!Fuel!Pin! Behavior!for ...

Inserire logo o denominazione del cobeneficiario
Modeling and Analysis of Nuclear Fuel Pin Behavior for Innovative Lead Cooled FBR
L. Luzzi, S. Lorenzi, D. Pizzocri, D. Rozzia, A. Aly, A. Del Nevo
Report RdS/PAR2013/022
Agenzia nazionale per le nuove tecnologie, l’energia e lo sviluppo economico sostenibile MINISTERO DELLO SVILUPPO ECONOMICO

Modeling and Analysis of Nuclear Fuel Pin Behavior for Innovative Lead Cooled FBR L. Luzzi, S. Lorenzi, D. Pizzofri -‐ CIRTEN POLIMI, D. Rozzia, A. Aly, A. Del Nevo -‐ ENEA
Settembre 2014
Report Ricerca di Sistema Elettrico Accordo di Programma Ministero dello Sviluppo Economico -‐ ENEA Piano Annuale di Realizzazione 2013 Area: Produzione di energia elettrica e protezione dell'ambiente Progetto: Sviluppo competenze scientifiche nel campo della sicurezza nucleare e collaborazione ai programmi internazionali per il nucleare di IV Generazione Obiettivo: Sviluppo competenze scientifiche nel campo della sicurezza nucleare Responsabile del Progetto: Mariano Tarantino, ENEA Il presente documento descrive le attività di ricerca svolte all’interno dell’Accordo di collaborazione "Sviluppo competenze scientifiche nel campo della sicurezza e collaborazione ai programmi internazionali per il nucleare di IV generazione"
Responsabile scientifico ENEA: Mariano Tarantino
Responsabile scientifico CIRTEN: Giuseppe Forasassi


Ricerca Sistema Elettrico
Sigla di identificazione
ADPFISS – LP2 – 054
Rev.
0
Distrib.
L
Pag. di
2 75
(This page has been intentionally left blank)

Ricerca Sistema Elettrico
Sigla di identificazione
ADPFISS – LP2 – 055
Rev.
0
Distrib.
L
Pag. di
3 39
CIRTEN
Consorzio Interuniversitario per la Ricerca TEcnologica Nucleare
POLITECNICO DI MILANO
DIPARTIMENTO DI ENERGIA, Sezione INGEGNERIA NUCLEARE - CeSNEF
Part1
Modeling and analysis of nuclear fuel pin behavior for
innovative lead cooled FBR
Lelio Luzzi, Stefano Lorenzi, Davide Pizzocri
CERSE-POLIMI RL 1493/2013
Milano, Agosto 2014
Lavoro svolto in esecuzione dell’Attività LP2.A.3_A
AdP MSE-ENEA sulla Ricerca di Sistema Elettrico - Piano Annuale di Realizzazione 2013
Progetto B.3.1 "Sviluppo competenze scientifiche nel campo della sicurezza nucleare e
collaborazione ai programmi internazionali per il nucleare di IV generazione"

Ricerca Sistema Elettrico
Sigla di identificazione
ADPFISS – LP2 – 055
Rev.
0
Distrib.
L
Pag. di
4 39
(this page is intentionally left blank)

Ricerca Sistema Elettrico
Sigla di identificazione
ADPFISS – LP2 – 055
Rev.
0
Distrib.
L
Pag. di
5 39
LIST OF CONTENTS
1 INTRODUCTION ......................................................................................................... 7
2 LEAD AS A COOLANT IN FAST REACTORS ............................................................... 13
2.1 General considerations .................................................................................. 13
2.2 Heat exchange correlation for Nusselt number ............................................. 13
2.3 Corrosion of the cladding .............................................................................. 14
2.4 Other relevant properties of lead ................................................................... 15
3 AUSTENITIC STAINLESS STEELS FOR LEAD-COOLED FAST REACTORS ................ 18
3.1 Thermo-physical properties .......................................................................... 18
3.2 Mechanical properties ................................................................................... 22
3.3 Swelling ......................................................................................................... 25
3.4 Thermal creep strain rate ............................................................................... 26
3.5 Cumulative Damage Function ...................................................................... 29
3.6 Irradiation creep ............................................................................................ 33
4 CONCLUSION AND FUTURE WORK .......................................................................... 38

Ricerca Sistema Elettrico
Sigla di identificazione
ADPFISS – LP2 – 055
Rev.
0
Distrib.
L
Pag. di
6 39
(this page is intentionally left blank)

Ricerca Sistema Elettrico
Sigla di identificazione
ADPFISS – LP2 – 055
Rev.
0
Distrib.
L
Pag. di
7 39
1 Introduction
The Lead-cooled Fast Reactor (LFR) has been selected by the Generation IV International Forum as
one of the candidates for the next generation of nuclear power plants (GIF, 2002). Advanced reactor
concepts cooled by Heavy Liquid Metals (HLMs) ensure a great potential for plant simplifications
and higher operating efficiencies compared to other coolants, nevertheless introducing additional
safety concerns and design challenges (Cacuci, 2010). Reactor conditions of HLM-cooled reactor
designs (e.g., extended exposure to neutron irradiation, high temperature, corrosive environment)
impose challenges for engineers and designers concerning the selection of structural and cladding
materials. Key guidance on material behavior and help to improve the design can be achieved by
means of fuel pin performance codes. Since the fuel pin behavior is determined by the synergy of
several phenomena (heat transfer to the coolant, creep, swelling and corrosion of the cladding,
relocation, densification, creep, and swelling of the fuel, fission gas release, etc.), a fuel pin analysis
can be adequately accomplished by means of integral performance codes. In the present work, the
TRANSURANUS code (Lassmann et al., 2013) developed at JRC-ITU (Karlsruhe) has been
extended for the analysis of nuclear fuel pin behavior of the LFR employing 15-15Ti austenitic
steels as cladding material.
This work is grafted in the research activity of the Nuclear Reactor Group of the Politecnico di
Milano on LFRs. The particular features of this innovative reactor concepts attained the attention of
the European Commission and the LEADER Project (LEad Advanced DEmonstration Reactor) has
been introduced in the 7th Framework Program (FP7 – http://wwpw.leader-fp7.eu/). As a part of the
LEADER Project, the design of a demonstrator reactor is forecasted. This is a small (300 MWth)
reactor called ALFRED (Advanced Lead-cooled Fast Reactor) whose aim is to prove the technical
and economic feasibility of the Generation IV lead reactor concept (Alemberti et al., 2013). The 15-
15Ti austenitic steel is considered to be the cladding material in the ALFRED reactor, as well as for
other fast reactor systems like the Accelerator-Driven System MYRRHA (Aït Abderrahim et al.,
2012) and the Sodium Fast Reactor ASTRID (Gavoille et al., 2013). Despite the lower resistance to
void swelling compared to the ferritic-martenstic steel T91 (the former candidate material for the
cladding), the 15-15Ti austenitic steel has been selected due to the better thermal creep resistance,
the good mechanical strength and because it has been already qualified and licensed in fast reactors.
This report presents a critical review of the main LFR material properties (except for the fuel, which
is out of the scope of the present deliverable), aimed at the extension and validation of the fuel pin
performance code TRANSURANUS (TU) for modeling and analyzing the fuel pin integral
behavior in innovative LFRs, specifically referring to the ALFRED reactor.
Actually, an LFR-oriented version of TRANSURANUS represents the first, necessary step in a
more general process of analysis and optimization (see Figure 1), finalized to support the design and
the construction of ALFRED by means of the following actions:
i) critical analysis of the fuel pin behavior in reactor through the study of a "reference
case" (based on "best estimate" models) to verify the respect of design limits;
ii) identification of possible critical issues through an extensive sensitivity analysis on the
most significant phenomena (both in normal operation and accident conditions) affected
by a considerable modeling uncertainty, and oriented to the definition of a "worst case
scenario" for the fuel pin performance;

Ricerca Sistema Elettrico
Sigla di identificazione
ADPFISS – LP2 – 055
Rev.
0
Distrib.
L
Pag. di
8 39
Figure 1: Scheme of the optimization process that can be carried out by means of the extended
TRANSURANUS version to give feedbacks on the ALFRED conceptual design.
iii) optimization of the fuel pin design, in order to improve the performance and safety-by-
design features of the ALFRED reactor;
iv) identification of design solutions aimed at achieving enlarged safety margins and of the
most adequate FA geometrical configuration from the thermo-mechanical point of view
(e.g., optimization of the radial power peak factor in the reactor core).
The v1m3j12 version of the TRANSURANUS code has to be considered as the starting point of the
work, which has permitted the development of an LFR-oriented version that includes an updating of
the correlations for the thermo-physical properties of the lead and introduces new correlations for
swelling, thermal creep and heat capacity of the 15-15Ti austenitic steels. As first step of this
process, a review of the main properties of lead as a coolant is carried out, making a comparison
with literature data. Afterwards, a critical review of the correlations for the 15-15Ti austenitic steels
is performed.
In this report, on the basis of the information available in literature, the correlations included in the
LFR-oriented version of TRANSURANUS, for evaluating the thermo-physical properties of lead,
the thermo-mechanical properties and the treatment of the in-reactor behavior of 15-15Ti steels, are
reported.
sensitivity analysis
and worst case
ALFRED reference
case
safety-oriented pin
design feedbacks
LFR-oriented
TU extension
Part I
Part II

Ricerca Sistema Elettrico
Sigla di identificazione
ADPFISS – LP2 – 055
Rev.
0
Distrib.
L
Pag. di
9 39
LIST OF SYMBOLS
Latin symbols
A, B, C materials constants
cp specific heat (at constant pressure) [J kg-1
K-1
]
CDF cladding cumulative damage function [-]
D pin diameter [m]
E Young’s modulus [GPa]
mean neutron energy [MeV]
EAB elongation at break [%]
LMP Larson-Miller Parameter
Nu Nusselt number [-]
Nulam laminar Nusselt number (Ushakov correlation) [-]
p pin pitch [m]
P P parameter (thermal creep)
Pe Peclet number [-]
R perfect gas constant [cal mol-1
K-1
]
t temperature [°C]
tR rupture time [h]
T temperature [K]
Tboil boiling temperature [K]
Tl liquidus temperature [K]
Tmelt melting temperature [K]
Ts solidus temperature [K]
Greek symbols
ΔH specific activation energy [cal mol-1
]
Δt time interval [h]
volume swelling strain [%]
ε equivalent thermal creep strain [%]
equivalent creep strain rate [% h-1
]
εth equivalent thermal creep cladding hoop strain [%]
εth,R equivalent thermal creep cladding rupture strain [%]
λ thermal conductivity [W m-1
K-1
]
ρ density [kg m-3
]
ρ0 density at 20°C [kg m-3
]
stress (Von Mises equivalent) [MPa]
σUT ultimate tensile strength [MPa]
σY,0.2% yield strength [MPa]
fast neutron flux [n cm-2
s-1
]
Φ fast neutron fluence [1022
]
ζ linear thermal expansion coefficient [%]
ω Ushakov correlation parameter [-]
Δ indicates variations

Ricerca Sistema Elettrico
Sigla di identificazione
ADPFISS – LP2 – 055
Rev.
0
Distrib.
L
Pag. di
10 39
LIST OF ACRONYMS
AIM Austenitic Improved Material
ALFRED Advanced Lead-cooled Fast Reactor European Demonstrator
ASTRID Advanced Sodium Technological Reactor for Industrial Demonstration
CEA Commisariat à l’Energie Atomique
CDF Cumulative Damage Function
FA Fuel Assembly
FAE Fuel Adjacency Effect
FBR(s) Fast Breeder Reactor(s)
FP7 7th
Framework Program
GESA Gepulste ElektronenStrahlAnlage
GIF Generation IV International Forum
HLM Heavy Liquid Metals
INL Idaho National Laboratory
ITU Institute for TransUranium elements
JOG Joint Oxide-Gain
JRC Joint Research Center
LEADER Lead-cooled European Advanced DEmonstration Reactor
LFR(s) Lead-cooled Fast Reactor(s)
LMFR(s) Liquid Metal-cooled Fast Reactor(s)
LMP Larson-Miller Parameter
MYRRHA Multipurpose hYbrid Research Reactor for High-tech Applications
MOX Mixed OXyde
NEA Nuclear Energy Agency
OECD Organization for Economic Co-operation and Development
P Parameter, cladding thermal creep
PCMI Pellet Cladding Mechanical Interaction
PLD Pulsed Laser Deposition
POLIMI Politecnico di Milano
POLITO Politecnico di Torino
SFR Sodium Fast Reactor(s)
TU TRANSURANUS
UT Ultimate Tensile strength
YS Yield Strength

Ricerca Sistema Elettrico
Sigla di identificazione
ADPFISS – LP2 – 055
Rev.
0
Distrib.
L
Pag. di
11 39
LIST OF FIGURES
Figure 1: Scheme of the optimization process that can be carried out by means of the
extended TRANSURANUS version to give feedbacks on the ALFRED conceptual
design. ............................................................................................................................... 8
Figure 2: Nusselt number dependence on Peclet number and on pitch parameters for liquid
pure lead in a triangular lattice (far from spacers) according to simplified
Ushakov correlation. The three curves are plotted with p/D = 1.30, 1.35 and
1.40. ................................................................................................................................. 14
Figure 3: Liquid lead density (OECD-NEA, 2007). .......................................................................... 15
Figure 4: Gurvich correlation for isobaric specific heat of liquid lead as presented in
OECD-NEA (2007). ........................................................................................................ 16
Figure 5: Liquid lead thermal conductivity (OECD-NEA, 2007). ..................................................... 17
Figure 6: Comparison between the Rudtsch et al. (2005) data for linear thermal expansion
and the correlation implemented in TRANSURANUS. ................................................... 19
Figure 7: Comparison between the Rudtsch et al. (2005) data for density and the correlation
implemented in TRANSURANUS. ................................................................................... 20
Figure 8: Specific heat correlation compared with recent experimental data for 1.4970 steel
(Rudtsch et al., 2005). ..................................................................................................... 21
Figure 9: Comparison between correlation and experimental data for thermal conductivity
of a Ti stabilized 20% cold worked austenitic stainless steel. ........................................ 22
Figure 10: Comparison between correlation and experimental data for the elastic modulus
of 15-15Ti stainless steel. ................................................................................................ 22
Figure 11: Correlations for ultimate tensile strength (UT) and yield strength (YS) are here
plotted together. .............................................................................................................. 23
Figure 12: The mismatch between correlation and open literature data for the rupture strain
of the 15-15Ti austenitic stainless steel is here clearly shown. ...................................... 24
Figure 13: Comparison between experimental data and the "Specific AIM1" and
"Generalized 15-15Ti" correlations for the cladding steel swelling as a function
of temperature. ................................................................................................................ 26
Figure 14: Comparison between experimental data and the "Specific AIM1" and
"Generalized 15-15Ti" correlations for the cladding steel swelling as a function
of dpa. .............................................................................................................................. 26
Figure 15: Többe correlation for the thermal creep strain rate of 1.4970m steel. ........................... 27
Figure 16: Modified Többe correlation for the thermal creep strain of the AIM1 steel. The fit
is made on Gavoille data, Filacchioni data are reported for comparison. .................... 28
Figure 17: P/stress correlation for 1.4970m steel. Rupture time is calculated from
equivalent stress, at different temperatures. ................................................................... 31
Figure 18: LMP/stress correlation for AIM1. ................................................................................... 32

Ricerca Sistema Elettrico
Sigla di identificazione
ADPFISS – LP2 – 055
Rev.
0
Distrib.
L
Pag. di
12 39
LIST OF TABLES
Table 1: Liquid lead density correlation............................................................................................ 15
Table 2: Liquid lead specific heat capacity correlation. ................................................................... 16
Table 3: Liquid lead thermal conductivity correlation. ..................................................................... 16
Table 4: Chemical composition of some austenitic stainless steels of the 15-15Ti family.
Compositions are expressed in weight percentage [wt. %] (Gavoille et al., 2013;
Banerjee et al., 2007). ..................................................................................................... 18
Table 5: 15-15Ti steels linear thermal expansion correlation. ......................................................... 19
Table 6: 15-15Ti steels specific heat correlation............................................................................... 21
Table 7: 15-15Ti steels thermal conductibility correlations. ............................................................. 21
Table 8: 15-15Ti steels Young's modulus correlation. ...................................................................... 23
Table 9: 15-15Ti steels yield strength and ultimate tensile strength correlations............................. 24
Table 10: 15-15Ti steels elongation at break correlations. ............................................................... 25
Table 11: 1.4970m thermal creep strain rate correlation. ................................................................ 27
Table 12: AIM1 thermal creep strain rate correlation. ..................................................................... 28
Table 13: Cumulative Damage Function (CDF) possible definitions. .............................................. 29
Table 14: 15-15Ti steels irradiation creep correlation. .................................................................... 33

Ricerca Sistema Elettrico
Sigla di identificazione
ADPFISS – LP2 – 055
Rev.
0
Distrib.
L
Pag. di
13 39
2 Lead as a coolant in fast reactors
In this section, the properties of lead are presented, focusing in particular on its use as a coolant in
fast reactors. The OECD-NEA Handbook (OECD-NEA, 2007) has been used as summarized and
reasoned reference.
2.1 General considerations
Pure lead is an interesting coolant in fast reactors due to its high mass number and its low
absorption cross-section, which are fundamental properties for a fast reactor coolant. It has good
thermal characteristics for heat removal. With respect to sodium and lead-bismuth eutectic (the
other metals proposed as coolants in innovative LMFRs), it has high melting temperature (327°C,
600 K) and an high boiling point (1749°C, 2022 K) allowing a wide range of operation.
Compared to sodium, it does not present the problem of strong exothermic reaction with air and
water, while with respect to the lead-bismuth eutectic, it is less corrosive, it does not present the
problem of activation issue typical of bismuth (polonium production) and does not present the issue
of solidification volume growth. Nevertheless, it is steel-aggressive for the core materials both for
erosion and corrosion issues (therefore, a flow velocity of less than 2 m s-1
is envisaged, and an
oxygen control and/or a coating for cladding are required, respectively) and it is very toxic and
polluting, requiring particular attention from production to disposal or recycling.
2.2 Heat exchange correlation for Nusselt number
Liquid lead is meant to be the coolant of LFRs. Therefore, its heat exchange properties are
fundamental. The heat exchange correlation has been developed by Ushakov et al. (1977) for
regular hexagonal fuel elements, far from spacing grids.
The correlation that is called in the TRANSURANUS routine is the following:
(
)
(
)
(1)
(1.3 < p/D < 2.0 in TU)
In Figure 2, Ushakov correlation is plotted (Nu as a function of Pe) for three different pitch
parameters (p/D = 1.30, 1.35 and 1.40).
It should be noted that this correlation is just an approximation of the Ushakov complete correlation
for triangular lattice, acceptable in the range of pin-pitch over diameter indicated above. The
complete correlation is reported in Equation (2).
(
(
)
(
)
)(
(
)
) (2)

Ricerca Sistema Elettrico
Sigla di identificazione
ADPFISS – LP2 – 055
Rev.
0
Distrib.
L
Pag. di
14 39
(
) (
((
)
) √ )
(
)
The complete correlation is implemented in TRANSURANUS, and called only when
is out of the
validity range for the simplified one.
Figure 2: Nusselt number dependence on Peclet number and on pitch parameters for liquid pure
lead in a triangular lattice (far from spacers) according to simplified Ushakov correlation. The
three curves are plotted with p/D = 1.30, 1.35 and 1.40.
2.3 Corrosion of the cladding
The problem of keeping a stainless steel in the aggressive environment represented by liquid lead is
not yet solved, but certainly maintaining flow velocity under 2 m s-1
reduces the erosion effect.
Nevertheless, the stainless steel of which the cladding is made requires further protection, and
different coating layers are under development. Among the proposed solutions, the most promising
are the FeCrAlY alloy, realized through the so-called GESA (Gepulste ElektronenStrahlAnlage)
treatment (Weisenburger et al., 2008) and the Al2O3 coating realized through Pulse Laser
Deposition (PLD) (Garcia Ferrè et al., 2013)1. For our purposes, the modeling solution that can be
adopted is substitute an external layer of the cladding (40 μm) by a coating which is not affected by
1 The lead corrosion and erosion of the cladding is a critical issue for LFR development. A complete review of this
research field goes beyond the scope of this work.
10
15
20
25
30
0 500 1000 1500 2000 2500 3000 3500 4000
Nu
Pe
Ushakov
1.3
0
1.3
5
1.4
0

Ricerca Sistema Elettrico
Sigla di identificazione
ADPFISS – LP2 – 055
Rev.
0
Distrib.
L
Pag. di
15 39
corrosion and is featured by a thermal conductivity of 16 W m-1
K-1
(Agosti et al., 2013).
Mechanical and irradiation effects on the coating are presently not taken into account.
2.4 Other relevant properties of lead
The other properties of liquid lead are less problematic for this work, and therefore they are simply
reported with their correlation according to OECD-NEA (2007).
Melting point
OECD-NEA (2007) indicates an interpolation value between the ones available in literature. The
dependence on pressure is in the order of a 0.08 K increase per 1 MPa increase and thus it has been
disregarded.
(3)
Boiling point
For boiling point, uncertainties are higher than for melting point. The value recommended in the
OECD-NEA (2007) is the following:
(4)
Density
The density of liquid lead can be related to temperature with a simple linear correlation. Even if
purity is not well specified in single references, agreement within data is very strong, with
uncertainty under 1%. This is shown in Figure 3. The correlation is reported in Table 1.
Table 1: Liquid lead density correlation.
[ ] [ ] Reference
OECD-NEA, 2007
Correlation
Figure 3: Liquid lead density (OECD-NEA, 2007).

Ricerca Sistema Elettrico
Sigla di identificazione
ADPFISS – LP2 – 055
Rev.
0
Distrib.
L
Pag. di
16 39
Specific heat capacity at constant pressure
According to OECD-NEA (2007), Gurvich and Veyts (1991) correlation is suggested as a
reasonable choice between available data (Table 2). Both data and correlation are plotted in Figure
4.
Table 2: Liquid lead specific heat capacity correlation.
[ ] [ ] Reference
OECD-NEA, 2007
Correlation
Figure 4: Gurvich correlation for isobaric specific heat of liquid lead as presented in OECD-NEA
(2007).
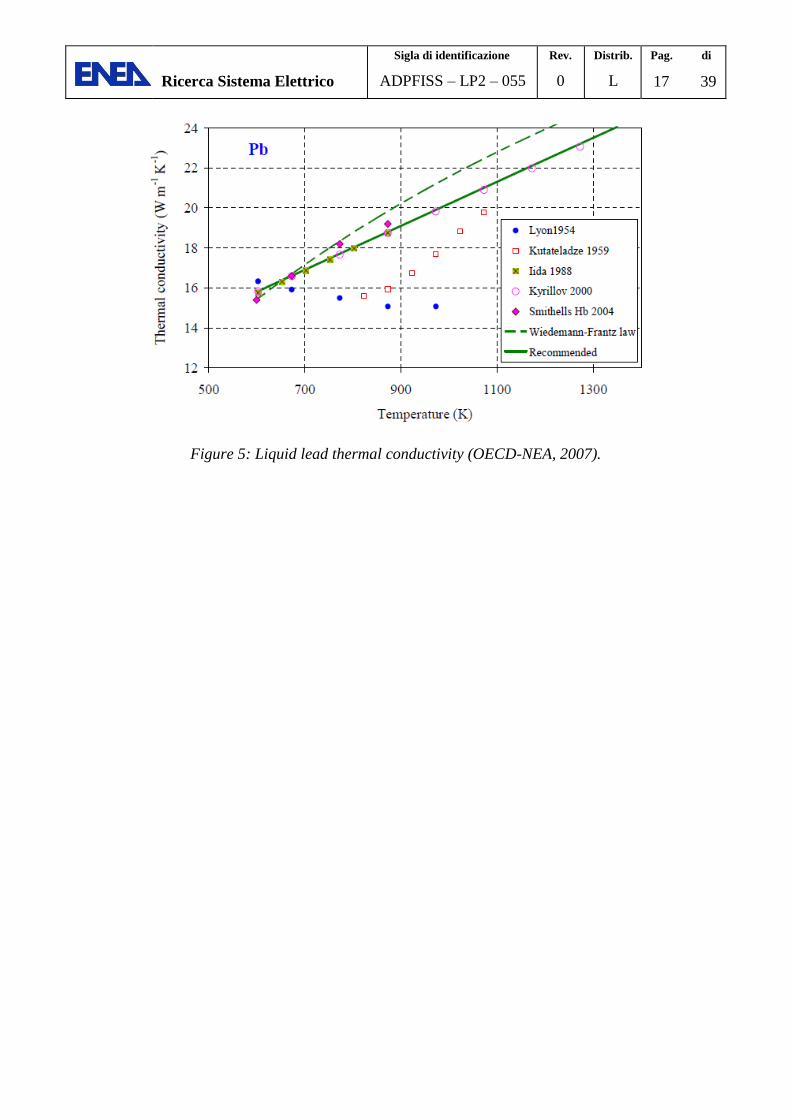
Thermal conductivity
The data regarding the thermal conductivity of liquid lead are very dispersed. Therefore, in this
case, the recommendation by OECD-NEA (2007) is particularly useful (Table 3). The proposed
correlation is linear and fits well recent data, as is shown in Figure 5.
Table 3: Liquid lead thermal conductivity correlation.
[ ] [ ] Reference
OECD-NEA, 2007
Correlation
Ricerca Sistema Elettrico
Sigla di identificazione
ADPFISS – LP2 – 055
Rev.
0
Distrib.
L
Pag. di
17 39
Figure 5: Liquid lead thermal conductivity (OECD-NEA, 2007).

Ricerca Sistema Elettrico
Sigla di identificazione
ADPFISS – LP2 – 055
Rev.
0
Distrib.
L
Pag. di
18 39
3 Austenitic stainless steels for Lead-cooled Fast Reactors
This section presents the correlations for the main thermal and mechanical properties of 15-15Ti
austenitic stainless steels adopted as cladding material for some lead-cooled fast nuclear reactors
(e.g., ALFRED, MYRRHA).
Specific austenitic stainless steels have been developed to be used as cladding materials in fast
reactors. The main advantages of these materials are their good thermal creep behavior and their
excellent mechanical properties. The main issue for these materials is to resist swelling, avoiding
the risk of gap reopening during fuel life and hence the occurrence of the so-called "thermal
feedback effect" (Lombardi, 2006). This is achieved through the inclusion of titanium, whose little
TiC precipitates are able to increase the incubation time of the phenomena interacting with the
voids created by fast neutrons irradiation. Also silicon seems to play an important role in
contrasting swelling. Moreover, the presence of boron goes in the direction of improving creep
ductility (Frost, 1994). The characteristics of these steels may justify their use as structural materials
also for other components, such as the Fuel Assemblies (FAs) wrapper.
Following this concept, a certain number of 15-15Ti steels has been developed in different
countries: D9 in the US, AIM1 in France, DIN 1.4970 in Germany. The chemical compositions of
these alloys is summarized in Table 4. All these materials are cold worked at 20%.
Table 4: Chemical composition of some austenitic stainless steels of the 15-15Ti family.
Compositions are expressed in weight percentage [wt. %] (Gavoille et al., 2013; Banerjee et al.,
2007).
C Cr Ni Mo Si Mn Ti Nb P B AIM1 0.1 15 15 1.2 0.6 1.5 0.4 - 0.03 0.0060
DIN 1.4970 0.1 15 15 1.2 0.4 1.5 0.5 - - 0.0045 D9 0.05 14 15 1.5 0.9 1.7 0.23 - - 0.0015
In the following subsections, a review of the main properties of 15-15Ti will be presented, all
described by out-of-pile correlations. The properties of the austenitic steels (Többe, 1975) are
compared with other literature data in order to assess their validity. On the other hand, the specific
heat (Banejree, 2007), the swelling and the thermal creep have been updated. In particular, these
last two properties have been carefully evaluated since the different composition of the alloying
material has a great impact on these material features.
3.1 Thermo-physical properties
Here below, the fundamental out-of-pile thermal properties of 15-15Ti austenitic stainless steels are
reported. For all these properties, the effect of specific alloyed elements is minimum, and therefore
the difference between the specific alloys (AIM1, 1.4970 and D9) is practically negligible. On the
other hand, for some mechanical properties, swelling and thermal creep, the different percentage of
the alloying elements has a relevant impact on these properties.
Melting temperature
In the TRANSURANUS code, the melting temperature is set in the SOLIMT subroutine at:
Tmelt = 1673 K (5)
Ricerca Sistema Elettrico
Sigla di identificazione
ADPFISS – LP2 – 055
Rev.
0
Distrib.
L
Pag. di
19 39
From literature data, the melting temperature (liquidus) and solidification temperature (solidus)
have been measured for 1.4970 steel by Nikolopoulos and Schulz (1979). The values proposed in
these references are:
(6)
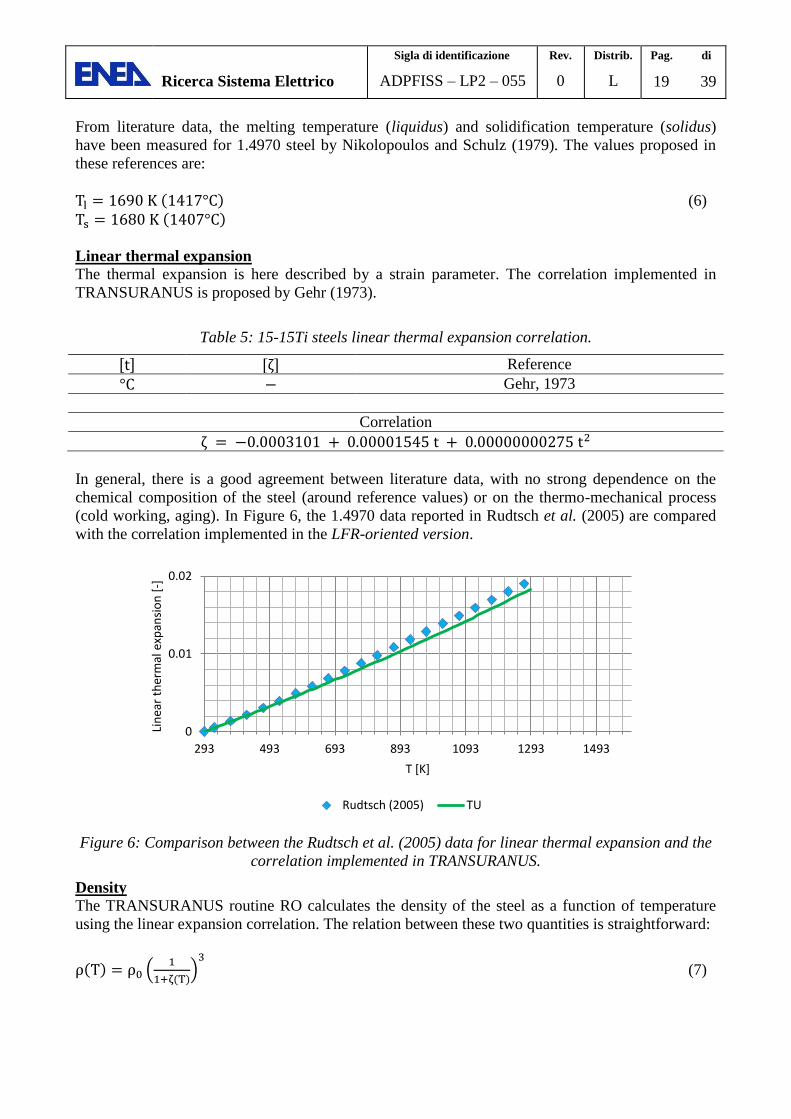
Linear thermal expansion
The thermal expansion is here described by a strain parameter. The correlation implemented in
TRANSURANUS is proposed by Gehr (1973).
Table 5: 15-15Ti steels linear thermal expansion correlation.
[ ] [ ] Reference
Gehr, 1973
Correlation
In general, there is a good agreement between literature data, with no strong dependence on the
chemical composition of the steel (around reference values) or on the thermo-mechanical process
(cold working, aging). In Figure 6, the 1.4970 data reported in Rudtsch et al. (2005) are compared
with the correlation implemented in the LFR-oriented version.
Figure 6: Comparison between the Rudtsch et al. (2005) data for linear thermal expansion and the
correlation implemented in TRANSURANUS.
Density
The TRANSURANUS routine RO calculates the density of the steel as a function of temperature
using the linear expansion correlation. The relation between these two quantities is straightforward:
(
)
(7)
0
0.01
0.02
293 493 693 893 1093 1293 1493
Lin
ear
ther
mal
exp
ansi
on
[-]
T [K]
Rudtsch (2005) TU

Ricerca Sistema Elettrico
Sigla di identificazione
ADPFISS – LP2 – 055
Rev.
0
Distrib.
L
Pag. di
20 39
Therefore, only the value at a certain reference temperature is needed. Equation (7) is
implemented in TRANSURANUS (Schumann, 1970), and results in good agreement with the value
proposed by Rudtsch et al. (2005).
t = 20 [°C] (8)
= 7900 [kg m-3
]
An explicit fit for is represented in Figure 7. This correlation does not present validity range
problems.
Figure 7: Comparison between the Rudtsch et al. (2005) data for density and the correlation
implemented in TRANSURANUS.
Specific heat
Specific heat measurements have been carried out in the range 20÷1000°C (293÷1273 K). In Figure
8, the correlation proposed by Banerjee et al. (2007) is compared with the 1.4970 data reported in
Rudtsch et al. (2005). The former correlation has been selected and implemented in the LFR-
oriented version.
7400
7500
7600
7700
7800
7900
8000
293 493 693 893 1093 1293 1493
Den
sity
[kg
m-3
]
T [K]
Rudtsch (2005) TU

Ricerca Sistema Elettrico
Sigla di identificazione
ADPFISS – LP2 – 055
Rev.
0
Distrib.
L
Pag. di
21 39
Figure 8: Specific heat correlation compared with recent experimental data for 1.4970 steel
(Rudtsch et al., 2005).
In Table 6, the correlation plotted in Figure 8 is reported.
Table 6: 15-15Ti steels specific heat correlation.
[ ] [ ] Reference
Banerjee, 2007
Correlation
cp = 431 + 0.177 T + 0.0000872 T-2
Thermal conductivity
The thermal conductivity of the cladding material is a fundamental property because it determines
the temperature gradient across the cladding, controlling thermal stress and temperature levels
(which determine all the other mechanical properties). Therefore, it is fundamental to have a
reliable correlation implemented in the routine LAMBDA of TRANSURANUS code.
It should be noticed that the cold work treatment slightly alters the thermal conductivity (especially
over 900 K, region in which also the measurement uncertainty grows). Therefore, the degree of cold
work should be specified. In Figure 9, the correlation proposed by Tobbe (1975) and implemented
in the LFR-oriented version is reported and compared with the data from Rudtsch et al. (2005) 20%
cold worked 1.4970 steel.
Table 7: 15-15Ti steels thermal conductibility correlations.
[ ] [ ] Reference
Többe, 1975
Correlation

Ricerca Sistema Elettrico
Sigla di identificazione
ADPFISS – LP2 – 055
Rev.
0
Distrib.
L
Pag. di
22 39
Figure 9: Comparison between correlation and experimental data for thermal conductivity of a Ti
stabilized 20% cold worked austenitic stainless steel.
3.2 Mechanical properties
This subsection presents the most relevant mechanical properties of the 15-15Ti austenitic stainless
steels. Thermal creep and swelling phenomena will be treated separately. All the properties
presented here are intended out-of-pile, therefore only the dependence on temperature is considered.
The properties already implemented in the v1m3j12 version, and also adopted in the LFR-oriented
version, will be discussed and compared with data and correlations found in literature, pointing out
the critical issues.
Young’s modulus
There are very few data available in the open literature about the Young’s modulus of a 15-15Ti
steel (or about similar austenitic stainless steels). The only data found in literature come from
Bergmann (1988) for 1.4970 steel. It is in general stated that the Young’s modulus does not depend
on the cold work degree. In Figure 10, the correlation proposed by Többe (1975) is plotted and
compared with the data from Bergmann (1988).
Figure 10: Comparison between correlation and experimental data for the elastic modulus of 15-
15Ti stainless steel.
10
15
20
25
30
293 493 693 893 1093 1293Ther
mal
co
nd
uct
ivit
y [
W m
-1 K
-1]
T [K]
TU Rudstch (2005)
100
120
140
160
180
200
220
293 493 693 893 1093
Elas
tic
mo
du
lus
[G
Pa]
T [K]
TU Bergmann (1988)

Ricerca Sistema Elettrico
Sigla di identificazione
ADPFISS – LP2 – 055
Rev.
0
Distrib.
L
Pag. di
23 39
In Table 8, the correlation plotted in Figure 10 is reported. The range of validity should be the one
explored in Bergmann experiment, 20÷800 °C (293-1073 K).
Table 8: 15-15Ti steels Young's modulus correlation.
[ ] [ ] Reference
Többe, 1975
Correlation
The correlation implemented in TRANSURANUS overestimates the elastic modulus in all the
range of temperatures.
Yield strength and ultimate tensile strength
These properties are discussed together because they represent the basic parameters of the stress-
strain diagram of a steel (along with rupture strain discussed in the next subsection and the Young’s
modulus). Moreover, it is important to notice that for these properties there is a quite strong
disagreement between what reported in Filacchioni et al. (1990) and what implemented in
TRANSURANUS (Többe, 1975). The data reported in Filacchioni et al. (1990) refer to the DS3, a
15-15Ti austenitic steel close to the AIM1. The discrepancies between the data and the correlation
can be explained with the relevance of the alloying element for these properties. Accordingly,
different steels of the 15-15Ti family can show very different behavior. It is important to remind
that every property has to be intended out-of-pile.
According to the literature data, measurements have been carried out until roughly 1100 K (≈
850°C) and therefore correlations are reliable until this temperature with around 10% of
uncertainty. Nevertheless, the range of validity of these correlations is suitable for the fuel
performance analysis of the LFR in operational cases.
Figure 11: Correlations for ultimate tensile strength (UT) and yield strength (YS) are here plotted
together.
In Table 9, the correlations plotted in Figure 11 are reported.
100
200
300
400
500
600
700
800
293 493 693 893 1093Ult
imat
e te
nsi
le s
tren
gth
| Y
ield
st
ren
gth
[M
Pa]
T [K]
TU | UT TU | YS Filacchioni (1990) | UT Filacchioni (1990) | YS

Ricerca Sistema Elettrico
Sigla di identificazione
ADPFISS – LP2 – 055
Rev.
0
Distrib.
L
Pag. di
24 39
Table 9: 15-15Ti steels yield strength and ultimate tensile strength correlations.
[ ] [ ] Reference
Többe, 1975
Correlation
,0.2%
555.5 0.25 600
405.5 0.775 600 600 1000
1000345.5 0.25
Y
T C if T C
T C if C T C
if T CT C
700 0.3125 600
512.5 0.96875 600 600 1000
1000437.5 0.3125
UT
T C if T C
T C if C T C
if T CT C
The third segment of the correlation implemented in TRANSURANUS has a slope which is less
than the second segment, bringing to higher values of ultimate tensile strength at high temperature,
not supported by open literature data.
Rupture strength is calculated from the rupture strain in TRANSURANUS, and therefore no
specific correlation is implemented. Actually, also the rupture strain presents the same criticalities
as the quantities described in this subsection.
Rupture strain
For the elongation at break it is fundamental to understand if the Többe (1975) data are reliable.
There is disagreement between the correlation implemented in TRANSURANUS and the data
proposed by Filacchioni et al. (1990) on DS3, similar to AIM1. Once again, this behavior can be
explained with the different composition of the alloying element that dramatically influences some
properties. In addition, this is the only property whose modeling in TRANSURANUS considers
also the in-pile behavior: when neutron fluence exceeds 1022
n cm-2
, the rupture strain is set at 6%.
A conversion factor of 2 1021
n cm-2
= 1 dpa is assumed. In Figure 12, the correlations are plotted.
In Table 10, the out-of-pile correlation plotted in Figure 12 is shown.
Figure 12: The mismatch between correlation and open literature data for the rupture strain of the
15-15Ti austenitic stainless steel is here clearly shown.
0
10
20
30
40
50
293 493 693 893 1093
Ro
ptu
re s
trai
n [
%]
T [K]
TU out-of-pile TU in-pile Filacchioni (1990)
Ricerca Sistema Elettrico
Sigla di identificazione
ADPFISS – LP2 – 055
Rev.
0
Distrib.
L
Pag. di
25 39
Table 10: 15-15Ti steels elongation at break correlations.
[ ] [ ] Reference
Többe, 1975
Correlation
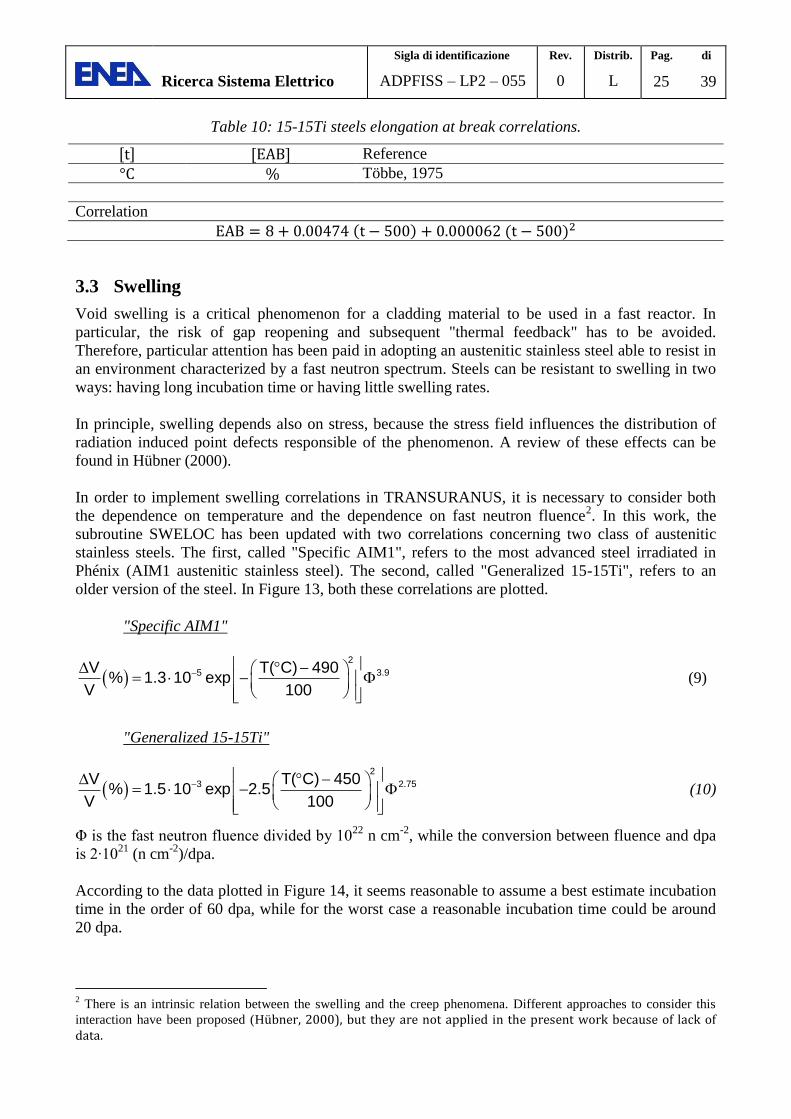
3.3 Swelling
Void swelling is a critical phenomenon for a cladding material to be used in a fast reactor. In
particular, the risk of gap reopening and subsequent "thermal feedback" has to be avoided.
Therefore, particular attention has been paid in adopting an austenitic stainless steel able to resist in
an environment characterized by a fast neutron spectrum. Steels can be resistant to swelling in two
ways: having long incubation time or having little swelling rates.
In principle, swelling depends also on stress, because the stress field influences the distribution of
radiation induced point defects responsible of the phenomenon. A review of these effects can be
found in Hübner (2000).
In order to implement swelling correlations in TRANSURANUS, it is necessary to consider both
the dependence on temperature and the dependence on fast neutron fluence2. In this work, the
subroutine SWELOC has been updated with two correlations concerning two class of austenitic
stainless steels. The first, called "Specific AIM1", refers to the most advanced steel irradiated in
Phénix (AIM1 austenitic stainless steel). The second, called "Generalized 15-15Ti", refers to an
older version of the steel. In Figure 13, both these correlations are plotted.
"Specific AIM1"
2
5 3.9V T( C) 490% 1.3 10 exp
V 100 (9)
"Generalized 15-15Ti"
2
3 2.75V T( C) 450% 1.5 10 exp 2.5
V 100 (10)
Φ is the fast neutron fluence divided by 1022
n cm-2
, while the conversion between fluence and dpa
is 2∙1021
(n cm-2
)/dpa.
According to the data plotted in Figure 14, it seems reasonable to assume a best estimate incubation
time in the order of 60 dpa, while for the worst case a reasonable incubation time could be around
20 dpa.
2 There is an intrinsic relation between the swelling and the creep phenomena. Different approaches to consider this
interaction have been proposed (Hübner, 2000), but they are not applied in the present work because of lack of data.

Ricerca Sistema Elettrico
Sigla di identificazione
ADPFISS – LP2 – 055
Rev.
0
Distrib.
L
Pag. di
26 39
Before reporting the correlations implemented in the TRANSURANUS, it must be said that
discrepancies in available data are very strong, that leads to the necessity of a sensitivity analysis
for this important phenomenon. In any case, Dubuisson (2013) and Bergmann et al. (2003) are
considered to be reliable data references.
Figure 13: Comparison between experimental data and the "Specific AIM1" and "Generalized 15-
15Ti" correlations for the cladding steel swelling as a function of temperature.
Figure 14: Comparison between experimental data and the "Specific AIM1" and "Generalized 15-
15Ti" correlations for the cladding steel swelling as a function of dpa.
3.4 Thermal creep strain rate
Thermal creep is a critical phenomenon for the cladding steel. The different chemical composition
in terms of alloying elements plays a fundamental role in determining the creep strain rate of a steel.
-2
0
2
4
6
400 500 600 700
CEA indication 93 dpa"Specific AIM1" 93 dpa"Generalized Ti-15-15" 93 dpa150 dpa130 dpa120 dpa105 dpa80 - 91 dpa75 dpa60 - 67 dpa50 dpa40 dpa26 - 35 dpa13 dpa» 0 dpa
Temperature (°C)
Sw
elli
ng
V
/V (
%)
-2
0
2
4
6
8
10
12
0 60 120 180
"Specific AIM1" 400°C"Specific AIM1" 550°C"Specific AIM1" 490°C"Generalized Ti-15-15" 500°C"Generalized Ti-15-15" 450°C15-15Ti BS Phenix15-15 Av. Phenix600 °C575 °C550 °C530 °C500 °C467 - 475 °C430 °C420 °C405 °C400 °C
Dose (dpa)
Sw
elli
ng
V
/V (
%)

Ricerca Sistema Elettrico
Sigla di identificazione
ADPFISS – LP2 – 055
Rev.
0
Distrib.
L
Pag. di
27 39
Therefore, in the LFR-oriented version two specific correlations for 1.4970m and AIM1 steels have
been included.
1.4970m creep strain rate
For the 1.4970m specific steel of the 15-15Ti class, Többe (1975) correlation, already present in the
v1m3j12 version, has been adopted in the LFR-oriented version for the thermal creep strain rate
(Table 11). The structure of this correlation is a Nabarro-Herring equation, different from the
typical Arrhenius equations used in creep strain rate modeling. In Figure 15, the correlation is
plotted.
Table 11: 1.4970m thermal creep strain rate correlation.
[ ] [ ] [ ] Reference
% h-1
MPa K Többe, 1975
Correlation
Figure 15: Többe correlation for the thermal creep strain rate of 1.4970m steel.
10
100
1000
1.00E-06 1.00E-05 1.00E-04 1.00E-03 1.00E-02 1.00E-01 1.00E+00
Equ
ival
en
t st
ress
[M
Pa]
Thermal creep equivalent strain rate [% h-1]
Tobbe 550°C
Tobbe 650°C
Tobbe 750°C

Ricerca Sistema Elettrico
Sigla di identificazione
ADPFISS – LP2 – 055
Rev.
0
Distrib.
L
Pag. di
28 39
AIM1 creep strain rate
For the AIM1 specific steel of the 15-15Ti class, a modified version of the Többe correlation is
adopted (Table 12), fitting Gavoille et al. (2013) data. This correlation is implemented in the LFR-
oriented version of TRANSURANUS. In Figure 16, the correlation is compared also with
experimental data from Filacchioni et al. (1990). Also this correlation presents a Nabarro-Herring
structure.
Table 12: AIM1 thermal creep strain rate correlation.
[ ] [ ] [ ] Reference
% h-1
MPa K Gavoille et al., 2013 (data)
Correlation
Figure 16: Modified Többe correlation for the thermal creep strain of the AIM1 steel. The fit is
made on Gavoille data, Filacchioni data are reported for comparison.
10
100
1000
1.00E-06 1.00E-05 1.00E-04 1.00E-03 1.00E-02 1.00E-01 1.00E+00
Equ
ival
en
t st
ress
[M
Pa]
Thermal creep equivalents train rate [% h-1]
Mod. Tobbe 550°C
Mod. Tobbe 600°C
Mod. Tobbe 650°C
Mod.Tobbe 700°C
Mod. Tobbe 750°C
Mod. Tobbe 800°C
Mod. Tobbe 850°C
Filacchioni 750°C
Filacchioni 550°C
Filacchioni 650°C
AIM1 550°C
AIM1 600°C
Ricerca Sistema Elettrico
Sigla di identificazione
ADPFISS – LP2 – 055
Rev.
0
Distrib.
L
Pag. di
29 39
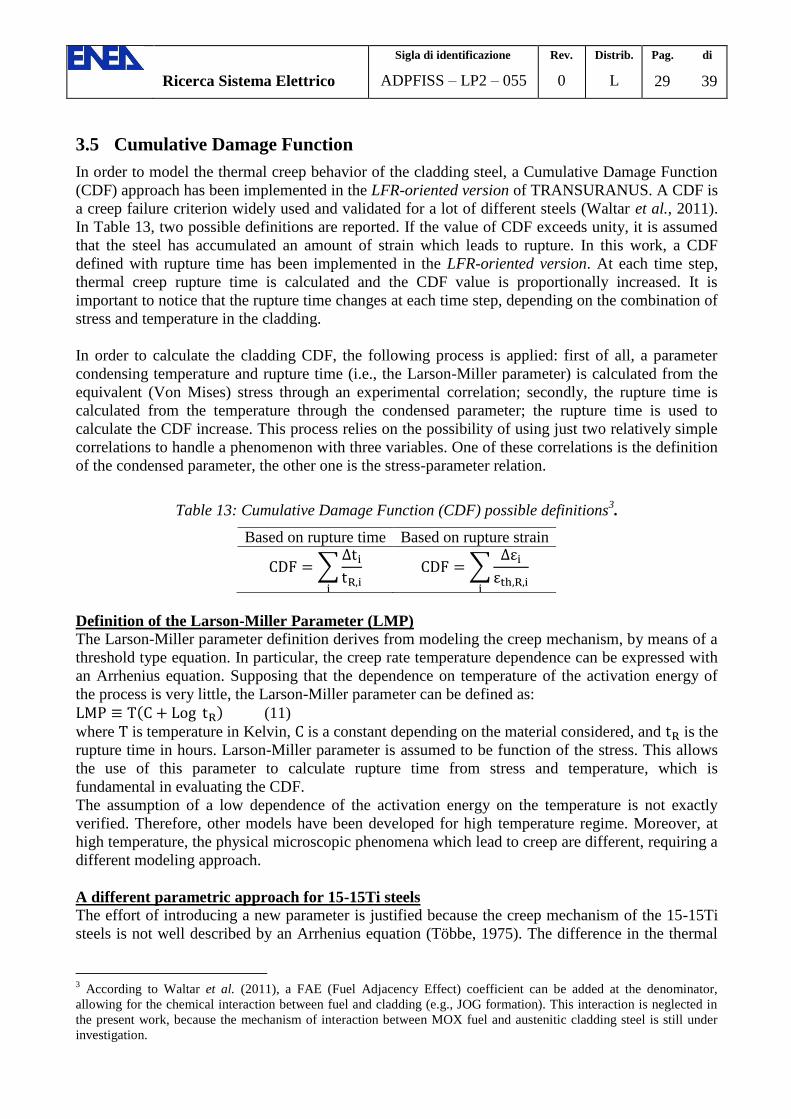
3.5 Cumulative Damage Function
In order to model the thermal creep behavior of the cladding steel, a Cumulative Damage Function
(CDF) approach has been implemented in the LFR-oriented version of TRANSURANUS. A CDF is
a creep failure criterion widely used and validated for a lot of different steels (Waltar et al., 2011).
In Table 13, two possible definitions are reported. If the value of CDF exceeds unity, it is assumed
that the steel has accumulated an amount of strain which leads to rupture. In this work, a CDF
defined with rupture time has been implemented in the LFR-oriented version. At each time step,
thermal creep rupture time is calculated and the CDF value is proportionally increased. It is
important to notice that the rupture time changes at each time step, depending on the combination of
stress and temperature in the cladding.
In order to calculate the cladding CDF, the following process is applied: first of all, a parameter
condensing temperature and rupture time (i.e., the Larson-Miller parameter) is calculated from the
equivalent (Von Mises) stress through an experimental correlation; secondly, the rupture time is
calculated from the temperature through the condensed parameter; the rupture time is used to
calculate the CDF increase. This process relies on the possibility of using just two relatively simple
correlations to handle a phenomenon with three variables. One of these correlations is the definition
of the condensed parameter, the other one is the stress-parameter relation.
Table 13: Cumulative Damage Function (CDF) possible definitions3.
Based on rupture time Based on rupture strain
∑
∑
Definition of the Larson-Miller Parameter (LMP)
The Larson-Miller parameter definition derives from modeling the creep mechanism, by means of a
threshold type equation. In particular, the creep rate temperature dependence can be expressed with
an Arrhenius equation. Supposing that the dependence on temperature of the activation energy of
the process is very little, the Larson-Miller parameter can be defined as:
(11)
where is temperature in Kelvin, is a constant depending on the material considered, and is the
rupture time in hours. Larson-Miller parameter is assumed to be function of the stress. This allows
the use of this parameter to calculate rupture time from stress and temperature, which is
fundamental in evaluating the CDF.
The assumption of a low dependence of the activation energy on the temperature is not exactly
verified. Therefore, other models have been developed for high temperature regime. Moreover, at
high temperature, the physical microscopic phenomena which lead to creep are different, requiring a
different modeling approach.
A different parametric approach for 15-15Ti steels
The effort of introducing a new parameter is justified because the creep mechanism of the 15-15Ti
steels is not well described by an Arrhenius equation (Többe, 1975). The difference in the thermal
3 According to Waltar et al. (2011), a FAE (Fuel Adjacency Effect) coefficient can be added at the denominator,
allowing for the chemical interaction between fuel and cladding (e.g., JOG formation). This interaction is neglected in
the present work, because the mechanism of interaction between MOX fuel and austenitic cladding steel is still under
investigation.

Ricerca Sistema Elettrico
Sigla di identificazione
ADPFISS – LP2 – 055
Rev.
0
Distrib.
L
Pag. di
30 39
creep mechanism should lead to the use of a different parameter. Indeed, Larson-Miller parameter is
by definition nonphysical for this class of steels.
The creep mechanism of the 15-15Ti steels can be described by means of a Nabarro-Herring
equation (the same form of Többe correlation), which introduces a change in the creep behavior at
high temperature. Two equations are in general used for Nabarro-Herring creep rate modeling, one
being the approximation of the other:
(12)
In Equation (12), and are constants depending on the material, is the perfect gas constant and
represent the equivalent Von Mises stress applied to the material. The stress is involved in the
creep mechanism because Nabarro-Herring thermal creep is interpreted by the migration of point
defects in the metal lattice, which is governed by stress level. The hyperbolic sine term becomes
important at high temperature.
In analogy with the definition of Larson-Miller parameter, from Equation (12) it is possible to
define a parameter P merging temperature and rupture time as follows:
(
) (13)
Comparing this result with Larson-Miller parameter, it can be noticed how the presence of an high
temperature effect is translated in a rescaling of the rupture time. In this subsection, both LMP and P
parameters are used to construct stress-parameter diagrams interpolating creep data of few stabilized
austenitic stainless steels. What is expected is that, at high temperature and for steel of the 15-15Ti
class, P would be more reliable than LMP.
It is useful to summarize all the hypotheses made in the definition of P. Some of them are in
common with Larson-Miller parameter, some others are specific.
1) Creep rate can be modeled by a Nabarro-Herring equation (13).
This means that the creep phenomenon has to be governed by point-like entities (defects or
little precipitates) in the lattice, at high temperature.
2) Activation energy of the creep phenomenon can be assumed independent of temperature
and stress.
3) Stress variation effect is little compared with temperature effect.
This is in general not true, particularly when strong stress gradients are presents and creep is
originated from vacancies flow.
Hypothesis 3) is critical and should always be checked. In general, if stresses are intense, it is
possible to go further in Mc Laurin expansion, Equation (12), adding higher order terms. This
results in a parameter that has the same functional structure of P, with more free parameters that
have to be set.

Ricerca Sistema Elettrico
Sigla di identificazione
ADPFISS – LP2 – 055
Rev.
0
Distrib.
L
Pag. di
31 39
Rupture time correlation for 1.4970m
The thermal creep strain for 1.4970m is calculated by means of Többe correlation, which has a
Nabarro-Herring structure. This suggests that the correlation for rupture time should be based on P
parameter. Indeed, a single stress-LMP correlation is not able to follow temperature changes. In
Figure 17, the stress-P correlation implemented in the LFR-oriented version of TRANSURANUS,
based on Bergmann (1988) data, is reported.
(
)
(14)
(15)
Figure 17: P/stress correlation for 1.4970m steel. Rupture time is calculated from equivalent stress,
at different temperatures.
1.E-01
1.E+00
1.E+01
1.E+02
1.E+03
1.E+04
1.E+05
1.E+06
1.E+07
1.E+08
1.E+09
1.E+10
0 100 200 300 400 500
Ru
ptu
re t
ime
[h
]
Equivalent stress [MPa]
Bergmann (1988) @923 KP/stress correlation
1.00E-01
1.00E+00
1.00E+01
1.00E+02
1.00E+03
1.00E+04
1.00E+05
1.00E+06
1.00E+07
1.00E+08
1.00E+09
1.00E+10
0 100 200 300 400 500
Ru
ptu
re t
ime
[h
]
Equivalent stress [MPa]
Bergmann (1988) @773 K
P/stress correlation

Ricerca Sistema Elettrico
Sigla di identificazione
ADPFISS – LP2 – 055
Rev.
0
Distrib.
L
Pag. di
32 39
Rupture time correlation for AIM1
The thermal creep strain for AIM1 is calculated by means of the modified Többe correlation, which
has a Nabarro-Herring structure. This suggests that the correlation for rupture time should be based
on P parameter. Nevertheless, according to Filacchioni et al. (1990), in this particular case the
classical LMP is sufficient. Therefore, a correlation based on the Larson-Miller parameter has been
implemented. Of course, also a stress-P correlation can be used, but where possible LMP is here
preferred because it is usually adopted in the literature. The correlation implemented in the LFR-
oriented version of TRANSURANUS is the following:
(16)
(17)
In Figure 18, the correlation is compared with Filacchioni (1990) data.
Figure 18: LMP/stress correlation for AIM1.
0
100
200
300
400
500
600
16000 16500 17000 17500 18000 18500 19000 19500 20000 20500 21000
Equ
ival
en
t st
ress
[M
Pa]
LMP = T (17.125 + Log tR)
Filacchioni et al., 1990
LMP/Stress correlation
@823 K
@923 K
@ 1023 K

Ricerca Sistema Elettrico
Sigla di identificazione
ADPFISS – LP2 – 055
Rev.
0
Distrib.
L
Pag. di
33 39
3.6 Irradiation creep
The irradiation creep of the 15-15Ti austenitic steels depends on the neutron flux and on the mean
neutron energy, along with the stress. The correlation proposed by Többe (1975), reported in Table
14, is already implemented in TRANSURANUS (v1m3j12).
Table 14: 15-15Ti steels irradiation creep correlation.
[ ] [ ] [ ] [ ] Reference
MPa n cm-2
s-1
MeV h-1
Többe, 1975
Correlation
The treatment of the irradiation creep in TRANSURANUS
The correlation for the irradiation creep rate can be expressed in the following general form:
(18)
where A* is a constant in MPa
-1 n
-1 cm
2 s h
-1 (the unit of measurement is unusual since some
conversions have been applied).
A similar approach is already adopted in TRANSURANUS for other materials (TRANSURANUS
Handbook, 2013; Többe, 1975). In these routines, the irradiation creep rate is proportional to the
flux, and not to the fluence. Obviously, to calculate the irradiation creep, the time integration is
needed:
(19)
For this reason, the irradiation creep rate is expressed in h-1
.
The Equation (18) has been implemented following the literature for what concerns the cladding in
Liquid Metal Reactors (Frost, 1994; Kohno et al., 1999; Toloczko et al., 1996; Toloczko et al.,
1998). The relation indicated by the literature reads:
⁄ (20)
Where
is the irradiation creep rate in dpa-1
B0 is the creep compliance in dpa-1
MPa-1
D is the swelling enhanced coefficient in MPa-1
is the volumetric swelling rate dpa-1
Nevertheless, because of the high uncertainty of the swelling behavior, the approach proposed does
not consider the coupling with the swelling - i.e., the second term of the Equation (20). In order to
implement this relation in TRANSURANUS, the irradiation creep rate has to be converted from
dpa-1
in h-1
(i.e., from unit of "dose" to unite of time) according to the following relation:
(21)
Ricerca Sistema Elettrico
Sigla di identificazione
ADPFISS – LP2 – 055
Rev.
0
Distrib.
L
Pag. di
34 39
Where
K is the conversion factor between fluence and "dose" in n cm-2
dpa-1
(a typical value for fast
reactor is 2∙1021
)
d is the "dose" in dpa
t is the time in h (3600 is the conversion from hours to seconds)
Even if the fluence appears in the previous relation, only the flux is present in the Equation (18)
since the irradiation creep has to be expressed per unit of time.
By means of some substitutions, it is possible to derive the initial equation, Equation (18), where
(22)
and the irradiation creep rate is proportional to the flux and stress.

Ricerca Sistema Elettrico
Sigla di identificazione
ADPFISS – LP2 – 055
Rev.
0
Distrib.
L
Pag. di
35 39
REFERENCES
Agosti, F., Botazzoli, P., Di Marcello, V., Pastore, G., Luzzi, L., 2013. Extension of the
TRANSURANUS code to the analysis of cladding materials for liquid metal cooled fast reactors: a
preliminary approach. Technical Report, CESNEF-IN-02-2013 (public version).
Aït Abderrahim, H., Baeten, P., De Bruyn, D., Fernandez, R., 2012. MYRRHA – A multi-purpose
fast spectrum research reactor. Energ. Convers. Manage. 63, 4–10.
Alemberti, A., Frogheri, M., Mansani, L., 2013. The Lead Fast Reactor: Demonstrator (ALFRED)
and ELFR Design. In: Proceedings of the IAEA International Conference on Fast Reactors and
Related Fuel Cycles: Safe Technologies and Sustainable Scenarios (FR13), Paris, France, March 3-4.
Banerjee, A., Raju, S., Divakar, R., Mohandas, E., 2007. High temperature heat capacity of alloy D9
using drop calorimetry based enthalpy increment measurements. Int. J. Thermophys. 28 (1), 97–
108.
Bergmann, H.J., 1988. Projekt-Materialdatenhandbuch IV KNKII/3, Revisionsstand 04/88,
INTERATOM Bericht/Report 55.07148.1.B.
Bergmann, H.J., Dietz, W., Ehrlich, K., Mühling, G., Schirra, M., 2003. Entwicklung des
Werkstoffs X10CrNiTiB 15 15 als Strukturmaterial für Brennelemente. Wissenschaftiche Berichte
FZKA 6864, FZK, Karlsruhe.
Cacuci, D.G., 2011. Chapter 23: Lead-Cooled Fast Reactor (LFR) Design: Safety, Neutronics,
Thermal Hydraulics, Structural Mechanics, Fuel, Core, and Plant Design. In: Handbook of Nuclear
Engineering, Volume 4, ed. Springer, Boston.
Cheynet, B., Dubois, J.D., Milesi, M., 1996. Données thermodynamiques des éléments chimiques,
Techniques de L’Ingénieur, Matériaux métalliques, No. M153, Form M64.
Dubuisson, P., 2013. Core structural materials - feedback experience from Phénix. IAEA TECDOC
1689, pp. 235-247.
Filacchioni, G., De Angelis, U., Ferrara, D., Pilloni, L., 1990. Mechanical and structural behaviour
of the second double stabilized stainless steels generation. In: Proceedings of the International
Conference on Fast Reactor Core and Fuel Structural Behaviour, Inverness, London, UK, June 4-6,
pp. 255-261.
Friedland, A.J., 1966. Coolant Properties, Heat Transfer and Fluid Flow of Liquid Metals. In: Fast
Reactor Technology: Plant Design, J.G. Yevick (Ed.), Chapter. 2, The M.I.T. Press, Cambridge
(MA), USA.
Frost, B.R.T., 1994. Nuclear Materials, Volume 10B, ed., Materials Science and Technology Series,
VCH Verlagsgesellschaft GmbH and VCH Publishers, Inc, Weinheim.
García Ferré, F., Ormellese, M., Di Fonzo, F., Beghi, M.G., 2013. Advanced Al2O3 coatings for
high temperature operation of steels in heavy liquid metals: a preliminary study. Corros. Sci. 77,
375–378.
Gavoille, P., Courcelle, A., Seran, J.L., Averty, X., Bourdiliau, B., Provitina, O., Garat, V.,
Verwaerde, D., 2013. Mechanical Properties of Cladding and Wrapper Materials for the ASTRID
Fast-Reactor Project. In: Proceedings of the IAEA International Conference on Fast Reactors and
Related Fuel Cycles: Safe Technologies and Sustainable Scenarios (FR13), Paris, France, March 3-4.
Gehr, H.L., 1973. Datensammlung zur Kernelementauslegung. Interatom - Technischer Bericht
73.30.

Ricerca Sistema Elettrico
Sigla di identificazione
ADPFISS – LP2 – 055
Rev.
0
Distrib.
L
Pag. di
36 39
GIF, 2002. A Technology Roadmap for Generation IV Nuclear Energy Systems. Technical Report
GIF-002-00.
Gurvich, L.V., Veyts, I.V., 1991. Thermodynamic Properties of Individual Substances, 4th ed., Vol.
2, Parts 1 and 2, Hemisphere Pub. Corp., New York.
Hübner, R., 2000. Das Bestrahlungverhalten des austenitischen Stahls DIN 1.4970, FZK, Karlsruhe.
Hultgren, R., Desai, P.D., Hawkins, D. T., Gleiser, M., Kelley, K.K., 1973. Selected Values of the
Thermodynamic Properties of Binary Alloys. ASM, Metals Park, Ohio, USA.
http://www.leader-fp7.eu/ (accessed 06.08.2014).
Iida, T., Morita, Z., Takeuchi, S., 1975. Viscosity Measurements of Pure Liquid Metals by the
Capillary Method. J. Japan Inst. Metals 39, 1169–1175.
Kirshenbaum, A.D., Cahill, J.A., Grosse, A.V., 1961. The density of liquid lead from the melting. J.
Inorg. Nucl. Chem. 22, 33–38.
Kohno, Y., Kohyama, A., Hirose T., Hamilton, M.L., Narui, M., 1999. Mechanical property
changes of low activation ferritic/martensitic steels after neutron irradiation. J. Nucl. Mater. 271-
272, 145–150.
Kutateladze, S.S., Borishansky, V.M., Novikov, I.I., Fedyaskii, O.S., 1959. Liquid-metal Heat
Transfer Media. At. Energ., Suppl. 2. (Transl. Cons. Bur. Inc., New York, 1959).
Kyrillov, P.I., Deniskina, N.B., 2000. Thermophysical Properties of Liquid Metal Coolants. Tables
and Correlations, Review FEI-0291, IPPE, Obninsk.
Lombardi, C., 2006. Impianti nucleari, Cusl, Milano.
Lucas, L.D., 1984, Données physico-chimiques des principaux métaux et métalloïdes. Techniques
de l’Ingénieur, Matériaux métalliques, N° M153, Form M65a.
Lyon, R.N. (Ed.), 1954. Liquid Metals Handbook, 2nd Ed., Report NAVEXOS P-733, Atomic
Energy Commission and Dept. of the Navy, Washington, USA (rev. 1954).
Nikolopoulos, P., Schulz, B., 1979. Density, thermal expansion of stainless steel and interfacial
properties of UO2-stainless steel above 1690 K. J. Nucl. Mater. 82, 172–178.
OECD-NEA, 2007. Handbook on Lead-Bismuth Eutectic Alloy and Lead properties, Materials
Compatibility, Thermal-hydraulics and Technologies.
Rudtsch, S., Ebert, H.P., Hemberger, F., Barth, G., Brandt, R., Groß, U., Hohenauer, W., Jaenicke-
Roessler, K., Kaschnitz, E., Pfaff, E., Pößnecker, W., Pottlacher, G., Rhode, M., Wilthan, B., 2005.
Intercomparison of thermophysical property measurement on an austenitic stainless steel. Int. J.
Thermophys. 26 (3), 855–867.
Ruppersberg, H., Speicher, W., 1976. Density and Compressibility of Liquid Li-Pb Alloys. Z.
Naturforsch. 31 a, 47–52.
Schumann, U., 1970. MAPLIB, A program system for provision of material property data to
computer programs. KFK 1253.
Smithells Metals Reference Book (8th edition), 2004. Gale W.F., Totemeier T.C. (Eds.), Elsevier,
Amsterdam.
Többe H., 1975. Das Brennstabrechenprogramm IAMBUS zur Auslegung von Schellbrüter – Brenn - stäben, Technischer Bericht, ITB 75.65.

Ricerca Sistema Elettrico
Sigla di identificazione
ADPFISS – LP2 – 055
Rev.
0
Distrib.
L
Pag. di
37 39
Toloczko, M.B., Garner, F.A., 1996. Irradiation Creep and Void Swelling of two LMR Heats of HT9 at ≈ 400°C and 165 dpa. J. Nucl. Mater. 233-237, 289–292.
Toloczko, M.B., Garner, F.A., Eiholzer, C.R., 1998. Irradiation Creep of Various Ferritic Alloys Irradiated at ≈ 400°C in the PFR and FFTF Reactors. J. Nucl. Mater. 258-263, 1163–1166.
TRANSURANUS Handbook, 2013. European Commission, JRC, Institute for Transuranium
Elements, Karlsruhe.
Ushakov, P.A., Zhukov, A.V., Matyukhin, N.M., 1977. Heat transfer to liquid metals in regular
arrays of fuel elements. Translated from Teplofizika Vysokikh Temperatur 15 (5).
Waltar A.E., Todd D.R., Tsvetkov, P.V. (Eds), 2011. Fast Spectrum Reactors, Springer, New York.
Weisenburger, A, Heinzel, A., Muller, G., Muscher, H., Rousanov, A., 2008. T91 cladding tubes
with and without modified FeCrAlY coatings exposed in LBE at different flow, stress and
temperature conditions. J. Nucl. Mater. 376, 274–281.

Ricerca Sistema Elettrico
Sigla di identificazione
ADPFISS – LP2 – 055
Rev.
0
Distrib.
L
Pag. di
38 39
4 Conclusion and future work
The present work has been dedicated to the extension of the TRANSURANUS code for analyzing
the fuel pin behavior of innovative LFRs, with reference to the materials adopted in the ALFRED
design. The material properties of lead as well as of 15-15Ti austenitic cladding steels have been
implemented in the LFR-oriented version.
The main outcomes of this report may be summarized as follows:
The properties of lead have been updated in the TRANSURANUS code. The OECD-NEA
Handbook has been used as summarized and reasoned reference. In particular, the
correlations concerning specific heat capacity, dynamic viscosity, density, heat transfer,
boiling temperature, thermal conductivity, enthalpy, boiling pressure, heat of evaporation
and corrosion have been updated.
A critical review of the main properties of 15-15Ti steel has been performed, with the
description of the out-of-pile correlations implemented in the TRANSURANUS code. The
properties of the austenitic steels are compared with other literature data in order to assess
their validity. Beside this purpose, the comparison has been useful to understand the critical
properties which are strongly dependent on the alloying elements and to underline the
different behavior of the various steels of the 15-15Ti family (AIM1, 1.4970, D9). In this
sense, yield strength, ultimate tensile strength, rupture strain, swelling and thermal creep are
features that strongly depend on the composition.
The Banerjee correlation for the heat capacity of the 15-15Ti steel has been implemented in
the code.
New correlations for the swelling, the thermal creep strain and the Cumulative Damage
Function (CDF, with the introduction of the P parameter) of 15-15Ti cladding steels have
been implemented in the LFR-oriented version. This crucial aspect was totally absent in
TRANSURANUS before this work. In particular, specific correlations for the 1.4970m and
the AIM1 steels have been proposed.
As natural continuation of this work, we envisage in the future to adopt the LFR-oriented version
for analyzing the fuel pin integral behavior of the ALFRED reactor. To this purpose, the capabilities
of the TRANSURANUS integral performance code will be exploited to evaluate (on the basis of
power history simulations) the synergy of the phenomena occurring throughout the fuel pin life in
reactor and their impact on the fuel pin design improvement.
In particular, the following results are expected to be suitable for giving important feedbacks to the
reactor designers during the conceptual design of ALFRED reactor (see also Figure 1, in
Introduction):
critical analysis of the fuel pin behavior in reactor, along with a sensitivity analysis on the
models affected by more uncertainty so as to identify a worst case scenario for the fuel pin
performance;
careful evaluation of the PCMI dynamics, both in normal operation and accident conditions,
due to the closing process of the fuel pin gap;

Ricerca Sistema Elettrico
Sigla di identificazione
ADPFISS – LP2 – 055
Rev.
0
Distrib.
L
Pag. di
39 39
optimization of the fuel pin design and performance, in order to achieve enlarged safety
margins;
identification of the most adequate FA geometrical configuration from the thermo-
mechanical point of view;
identification of the main issues on which the R&D activities and efforts should be focused
in the near future as far as the behavior of the materials (lead, AIM1 cladding steel, coating,
MOX fuel) is concerned.
All these future activities are expected to give useful indications for the design of the ALFRED
reactor and, more in general, for improving the intrinsic safety features of innovative lead cooled
FBRs.
Ricerca Sistema Elettrico
Sigla di identificazione
ADPFISS – LP2 – 054
Rev.
0
Distrib.
L
Pag. di
40 75
Part2
Modeling and analysis of nuclear fuel pin behavior for
innovative lead cooled FBR:
MOX conductivity models

Ricerca Sistema Elettrico
Sigla di identificazione
ADPFISS – LP2 – 054
Rev.
0
Distrib.
L
Pag. di
41 75
CONTENTS
1 INTRODUCTION ....................................................................................................... 42
1.1 Objective of the activity ................................................................................ 42
1.2 Thermal conductivity of ceramic fuel ........................................................... 42
1.3 Effect of temperature .................................................................................... 43
1.4 Effect of stoichiometry .................................................................................. 43
1.5 Effect of burn up ........................................................................................... 44
1.6 Effect of fuel porosity ................................................................................... 44
1.7 Effect of Plutonium content .......................................................................... 45
2 TRANSURANUS THERMAL CONDUCTIVITY MODELS ........................................ 46
2.1 Correlation 31-Van Uffelen and Schubert .................................................... 46
2.2 Correlation 32-Carbajo ................................................................................. 48
2.3 Correlation 33-Lanning and Beyer ............................................................... 52
2.4 Correlation 34, Wiesenack. ........................................................................... 56
2.5 Comparison among TRANSURANUS models ............................................ 58
3 ANALYSIS OF MOX CONDUCTIVITY MODELS FROM OPEN LITERATURE .............. 60
3.1 D.G Martin review 1982 ............................................................................... 60
3.2 FTHCON subscode-MATPRO ..................................................................... 62
3.3 The COMETHE formulation-1982 ............................................................... 65
3.4 Baron Hervè- 1995 Model ............................................................................ 67
4 COMPARISON BETWEEN THE STUDIED MODELS. ................................................... 70
REFERENCES ............................................................................................................ 75

Ricerca Sistema Elettrico
Sigla di identificazione
ADPFISS – LP2 – 054
Rev.
0
Distrib.
L
Pag. di
42 75
1 Introduction
1.1 Objective of the activity
Among the parameters that governs the myriad of processes that occurs during irradiation of fuels
rods, the fuel temperature, is by far the most important one (i.e. it dominates the FGR and swelling
mechanisms) [1]
.
The correct prediction of the fuel temperature profile is therefore the basis for the simulation of
integral fuel rods by means of fuel performance codes. The present report aims to assess the
correlations implemented in TRANSURANUS code to simulate conductivity of MOX fuels
comparing them with correlations available from open literature.
1.2 Thermal conductivity of ceramic fuel
Thermal conductivity is a property representing the ability of a solid material to transfer heat. There
are three phenomena considered when modelling thermal conductivity. Lattice vibrations, radiation
heat transfer and electronic conductivity[2]
.
Lattice vibration thermal conductivity (klatt) is modelled by assuming the solid to be an ideal gas
consisting of phonons. Phonons are quasi particles representing the wave nature of the vibrating
solid in the lattice. They tend to collide with each other and with defects in the crystal with a certain
mean free path. They transport their energy as they translate in the medium from the hot side to the
cold one. Thermal conductivity depends on the amount of energy a phonon can carry and the mean
free path of the phonon[3]
. Phonon’s mean free path should be inversely proportional to the
temperature. Due to the presence of point defects in the crystal solid that acts as a barrier to
phonon’s mobility, the mean free path cannot keep monotonically increasing as the temperatures
gets lower[3]
. This requires that the mean free path is inversely proportional to temperature plus an
extra constant term representing phonon scattering with defects. Being proportional to the mean free
path of the phonon, klatt would be written as:
Eq.1
Where A, and B are constants, and T is the temperature in (K).
Heat is conducted as well with radiation on the form of electromagnetic waves. Energy is
transported due to the movement of charged particles (protons and electrons) which emit some of
their energy on the form of electromagnetic radiation[3][4]
. Radiation term of thermal conductivity
(Krad) is written on the form of a constant times the cube of temperature:
Eq.2
At temperatures high enough, energy is sufficient to generate an amount of electron-hole pairs that
contribute to thermal conductivity (Kel)[3]
.
(
)
[
(
)] Eq.3
Where:
= electronic contribution to thermal conductivity.

Ricerca Sistema Elettrico
Sigla di identificazione
ADPFISS – LP2 – 054
Rev.
0
Distrib.
L
Pag. di
43 75
= Boltzmann constant, 1.38x10²³
(J/K)
= electron charge, 1.6x10⁻¹⁹
(Coul)
= electron/hole contribution to electrical conductivity (
)
(
)
= energy gap between conduction and valence bands (J)
Where the first term on the RHS is the conductivity effect of holes and electrons separately. The
second term represents the ambipolar effect, which is the release of the kinetic energy of both the
electron and hole when they recombine together plus the release of their generation energy at areas
of lower temperature leading to the transfer of heat electronically.
This equation can be simplified using some experimental data and assumptions to be written on the
form:[2]
Eq.4
Where D,E and n are constants, it should be noted that n differs from one model to another.
These physical principles of heat conduction and their equation forms are generally taken into
account in the models even if they can be implemented in different ways. Most of these models
account only for the first two thermal conductivity principles.
1.3 Effect of temperature
Thermal conductivity of UOx and MOX is a property that depends on temperature. It has been
noted experimentally that the thermal conductivity decreases with temperature until a plateau is
reached in the range between 1500 to 2000 0C. This decrease is due to the lattice vibration
conductivity, which is inversely proportional to the temperature. At temperatures above the plateau
range, the thermal conductivity begins to rise again. This is attributed to either of the two other
components of the thermal conductivity. Radiation heat conduction takes place above the plateau
temperature even though it is not that much significant. Electronic term of the thermal conductivity
is the second term that is responsible for the increase of thermal conductivity.
The lattice vibration mechanism is included in all the models. As usual, it takes into consideration
other factors that affect the heat conductivity other than temperature (e.g. burn up rate, deviation
from stoichiometry, etc). Some models, take the radiation conduction term into consideration to
explain the increase of thermal conductivity at higher temperatures, while others relate that increase
to the electronic conduction term.
1.4 Effect of stoichiometry
The theoretical oxygen to metal ratio (O/M) between Uranium or Plutonium oxide (U-Pu)O2 is two.
Deviation from this value are generally adopted by design and are also induced in the nuclear fuel
aseffect of irradiation. The deviation can lead to hyper (>2) or hypo (<2) stoichiometric state of the
fuel[6]
.

Ricerca Sistema Elettrico
Sigla di identificazione
ADPFISS – LP2 – 054
Rev.
0
Distrib.
L
Pag. di
44 75
The effect of deviation from stoichiometric is generally modeled by assuming that this deviation
causes more defects in the lattice. This perturbation is included in the constant A in Eq.1 which
represents the phonon-defect interaction in the lattice and determined originally for stoichiometric
fuel conditions.
The modification of due to deviation from stoichiometry can be written as
Eq.5
Where is the constant A for stoichiometric fuel and C is a constant multiplied by which is the
deviation form stoichiometry (O/M-2)).
1.5 Effect of burn up
The irradiation process that takes place in a nuclear reactor leads to various changes in the
properties of the fuel rod. Defects in the lattice, porosity increase, deviation from stoichiometry and
fuel cracking with irradiation leads to degradation of the thermal conductivity. This effect is
important in fast reactors since burn up can reach to more than 10% of the original weight content
of the uranium and plutonium[6]
. Solid fission products have different effects on thermal
conductivity. In general, those that are dissolved tend to decrease the thermal conductivity, while
those that are precipitated tends to increase it. The integral effect is however a degradation of
conductivity with increasing burn-ups.
1.6 Effect of fuel porosity
The presence of voids in the solid fuel pin leads to degradation of its thermal conductivity. A
poreless fuel is required to obtain the maximum thermal conductivity. On the other side, the
presence of pores in the fuel pin is important to accommodate the release of fission gases that are
formed during irradiation. Theses fission gases can cause internal pressure of the fuel pin to increase
leading to deformation and swelling of the fuel. This effect is more important for fast reactors than
thermal reactors because the higher power density leads to more generation of fission gases[6]
.
The porosity (P) is defined as the volume of the pores inside the fuel divided by the total volume of
the fuel this can be written as:
Eq.6
Where is the actual density of the fuel, and is the theoretical density of the fuel’s material
without pores. The effect of porosity on thermal conductivity is considered by using a correction
factor of the thermal conductivity. This factor has many formulations but the most used are the
modified Loeb formula:
Eq.7
or the Maxwell-Eucken formula:
Eq.8

Ricerca Sistema Elettrico
Sigla di identificazione
ADPFISS – LP2 – 054
Rev.
0
Distrib.
L
Pag. di
45 75
Where is the thermal conductivity of the poreless fuel. α and β are constants. Theoretically, the
values of α is 1 and β is 0.5. Experimentally, the noticed values of these factors are higher than
what the theory predicts. This is due to the fact that the pores are not randomly distributed in the
lattice which is theoretical assumption[7]
. The wide range of values used for the constants α and β
shows that they are in fact variables that depend on the pore shape. The values assigned to them
represents an average of the porosity effect.
1.7 Effect of Plutonium content
The effect of Plutonium on the constants A and B in the lattice vibration thermal conductivity term
has been carefully studied. Evidence does not show any systematic trend for the variation of the
constant A, while it shows a systematic increase of the constant B. Overall the effect of increasing
Plutonium’s content in the fuel is a decrease of the thermal conductivity of MOX fuel[3]
. This
decrease reaches up to 15% for a plutonium content of around 25 wt.%.

Ricerca Sistema Elettrico
Sigla di identificazione
ADPFISS – LP2 – 054
Rev.
0
Distrib.
L
Pag. di
46 75
2 TRANSURANUS thermal conductivity models
This section provides an assessment and a comparison of the correlations adopted in
TRANSURANUS to simulate MOX fuel conductivity.
2.1 Correlation 31-Van Uffelen and Schubert
This correlation is based on the data obtained experimentally by Duriez et.al where the laser flash
technique was used to measure the thermal diffusivity of MOX fuel. The Pu content of the fuel was
between 3-15%.wt, O/M ratio between 1.95-2.0 and in the temperature range between 700-2300
K[9]
. The the thermal conductivity was modeled by using values of the heat capacity calculated from
Kopp’s law[8]
. The ambipolar electronic thermal conductivity term is based on the work of Ronchi
et.al in which they measured the thermal diffusivity and the heat capacity of UO2 for a temperature
range between 500 and 1900 using an advanced laser-flash technique that gave better results than
conventional laser flash methods at high temperatures[9]
. The correlation gives the thermal
conductivity of MOX as a function of temperature and burn-up:
Eq.9
Where
a=0.0308
a1 =5.498x10⁻³
b=2.515 x10⁻⁴
b1= -2.498 x10⁻⁶
c= 4.715x x109
d=16361
T is in K and = min(1923,T), bu is the local burn up in
The porosity effect can be taken into account using the following correction formula
Eq.10
This correlation has been assessed assuming different conditions. Due to the lattice vibration term,
the correlation predicts a decrease of thermal conductivity for 0
fuel with temperature until it
reaches a minimum around 2000 0K and then begins to rise again due to the electronic heat
conduction as shown in Fig.1. This figure assumes a fuel of 95% theoretical density and includes
different level burn-ups.
The effect of burn up on the thermal conductivity is more important at lower temperature. As can be
seen in Fig.1, at 800 K the thermal conductivity decreased by 60% of its original value for un-
irradiated fuel when the burn up reached 100
. For 2000 K, the thermal conductivity for the
same range of burn up decreases only by 10%. It is noticed as well that the higher burn-up, the
lower the rate of change of thermal conductivity with temperature. Also as the burn-up increases,
the lower the temperature for which the thermal conductivity reaches its minimum before it
increases again. At burn up of 100
, the thermal conductivity is slightly changing with

Ricerca Sistema Elettrico
Sigla di identificazione
ADPFISS – LP2 – 054
Rev.
0
Distrib.
L
Pag. di
47 75
temperature until the temperature is above 1500 K where the effect of the ambipolar term of thermal
conductivity starts to rise. This behavior is explained by the increase of the defects in the solid due
to irradiation. As consequence of this the phonon-defect interaction in the fuel dominates with
respect to hte temperature dependent phonon-phonon interaction term.
Fig.1 - Thermal conductivity as a function of temperature for different burn ups, correlation 31.
The effect of porosity is analyzed in Fig.2 (under the assumption of un-irradiated fuel). The
correlation predicts a decrease of thermal conductivity with porosity. This decrease is linear and the
rate of decrease is constant over the whole range of temperatures. It is between 20 to 25% in thermal
conductivity when the porosity increase from 0 to 10%.
In Fig.3, The contributions of the lattice vibration and the ambipolar thermal conductivity are
plotted according Van Uffeleln & Schubert correlation. This is done for this correlation only to
illustrate what was explained before in theory related to the dominating contribution of lattice
vibration term at low temperatures. At low temperatures the main contribution to the total thermal
conductivity is the one related the lattice vibration. As the temperature increases, this term keeps
decreasing combined with the increase of the electronic term. When the rate of increase of
electronic thermal conductivity dominates the rate of decrease due to lattice vibration the thermal
conductivity begin to rise again. This domination takes place in the temperature range between
(1600-2000 K).

Ricerca Sistema Elettrico
Sigla di identificazione
ADPFISS – LP2 – 054
Rev.
0
Distrib.
L
Pag. di
48 75
Fig.2 - Effect of fuel porosity on thermal conductivity, correlation 31.
Fig.3 - Comparison between the lattice and the ambipolar contribution to the total thermal
conductivity.
2.2 Correlation 32-Carbajo
This correlation is based on the work of Carbajo et.al. that take basis for best value estimation of
data available from open literature available recommendations given in other works. The physically
based correlation by Lucuta et.al was recommended. It gives the thermal conductivity as a function
of temperature, burn-up, deviation from stoichiometry along with a porosity correction. The
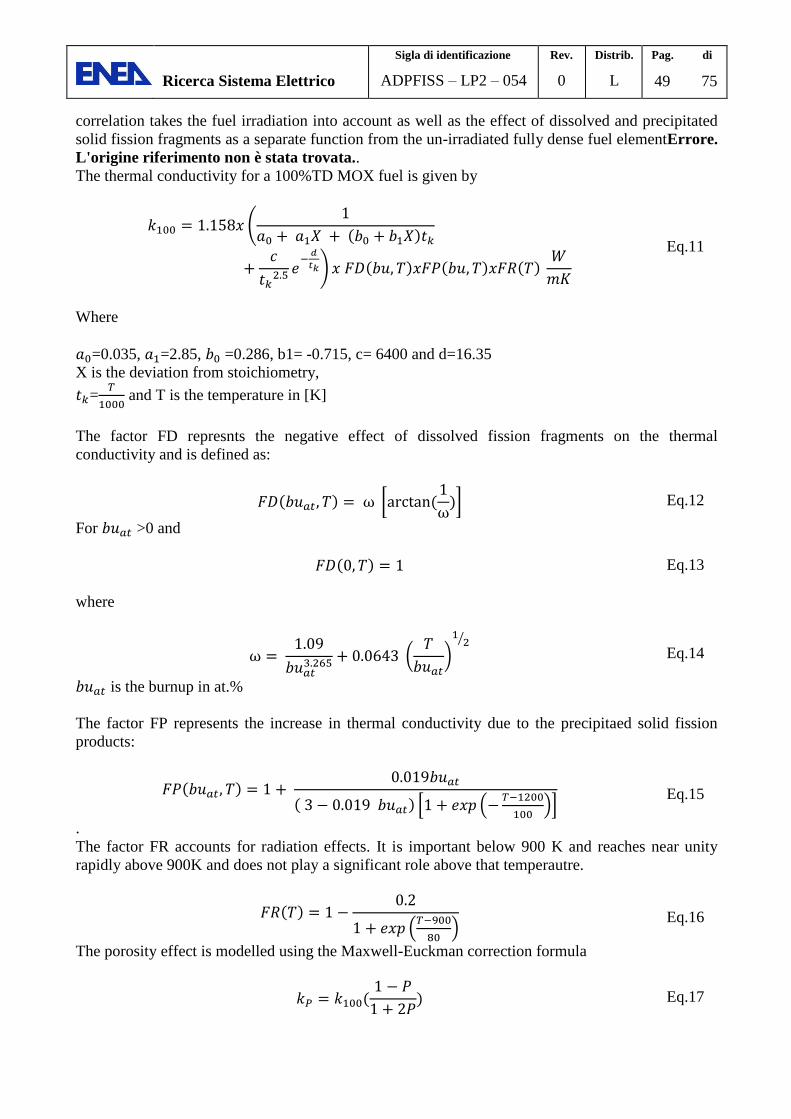
Ricerca Sistema Elettrico
Sigla di identificazione
ADPFISS – LP2 – 054
Rev.
0
Distrib.
L
Pag. di
49 75
correlation takes the fuel irradiation into account as well as the effect of dissolved and precipitated
solid fission fragments as a separate function from the un-irradiated fully dense fuel elementErrore.
L'origine riferimento non è stata trovata..
The thermal conductivity for a 100%TD MOX fuel is given by
(
)
Eq.11
Where
=0.035, =2.85, =0.286, b1= -0.715, c= 6400 and d=16.35
X is the deviation from stoichiometry,
=
and T is the temperature in [K]
The factor FD represnts the negative effect of dissolved fission fragments on the thermal
conductivity and is defined as:
[
] Eq.12
For >0 and
Eq.13
where
(
)
⁄
Eq.14
is the burnup in at.%
The factor FP represents the increase in thermal conductivity due to the precipitaed solid fission
products:
[ (
)]
Eq.15
.
The factor FR accounts for radiation effects. It is important below 900 K and reaches near unity
rapidly above 900K and does not play a significant role above that temperautre.
(
) Eq.16
The porosity effect is modelled using the Maxwell-Euckman correction formula
Eq.17

Ricerca Sistema Elettrico
Sigla di identificazione
ADPFISS – LP2 – 054
Rev.
0
Distrib.
L
Pag. di
50 75
The correlation predicts a decrease of thermal conductivity with temperature due to lattice vibration
until it reaches a minimum around 2000 K. Then, it begins to rise again due to the electronic heat
conduction as shown in Fig.4 for a 95%TD fuel at different burn ups. The same is true for different
values of fuel porosity. It can be noticed as well the decrease of thermal conductivity with burn up.
The effect of burn up on the thermal conductivity is more important at lower temperature. As can be
seen from Fig.4, at 800 K, the thermal conductivity decreased by 40% of its original value for un-
irradiated fuel when the burn up reached 10 at.%. For 2000 K, the thermal conductivity for the same
range of burn up decreases by 15%.
Fig.4 - Thermal conductivity as a function of temperature for different burn ups, correlation 32.
The effect of porosity is analyzed inFig.5 (for un-irradiated MOX). The decrease of conductivity
with increased porosity is linear and the rate of decrease is constant over the whole range of
temperatures. It is between 20 to 25 when the porosity increase from 0 to 10%.
The effect of O/M is reported in Fig.6 and Fig.7 (for un-irradiated MOX). The correlation is
physical for the hypostoichiometric section while, for the deviation in the direction of
hyperstoichiometry, the correlation does not give physical results since it predicts the increase of
thermal conductivity, Fig.6 (that is in contradiction with the theoretical and experimental finding
that hilight a maximum of condutivity for O/M = 2 and lower values for all the other ratios). Due to
this reason, further analyses are conducted only up to O/M = 2, Fig.7. It sholud be pointed out that
the code recommends the use of these correlations only for O/M up to 2. It can be noticed that the
lower the temperature, the higher the degradation of thermal conductivity with deviation from
stoichiometry. For 800 K the thermal conductivity decreases by 30% for a deviation from
stoichiometry of 0.05. At 2000 K for the same range of deviations, the decrease of thermal
conductivity is around 8% and decreases more as the temperature goes higher.

Ricerca Sistema Elettrico
Sigla di identificazione
ADPFISS – LP2 – 054
Rev.
0
Distrib.
L
Pag. di
51 75
Fig.5 - Effect of fuel porosity on thermal conductivity, correlation 32.
Fig.6 - effect of deviation from stoichiometry on thermal conductivity at different values of
temperature, correlation 32.

Ricerca Sistema Elettrico
Sigla di identificazione
ADPFISS – LP2 – 054
Rev.
0
Distrib.
L
Pag. di
52 75
Fig.7 - Thermal conductivity as a function of temperature for different burn ups, correlation 32.
2.3 Correlation 33-Lanning and Beyer
This correlation gives the thermal conductivity for 95%TD MOX according to Lanning and Beyer.
The correlation is based on the work of Duriez et al.[8]
It gives the thermal conductivity as a function
of temperature, burn up and deviation from stoichiometry included in the lattice vibration term and
another term for ambipolar thermal conductivity that is a function of temperature only.
The thermal conductivity for MOX 95%TD is given by:
Eq.18
Where:
X is the deviation from stoichiometry and
T is in K and the burn up is in
.

Ricerca Sistema Elettrico
Sigla di identificazione
ADPFISS – LP2 – 054
Rev.
0
Distrib.
L
Pag. di
53 75
A porosity correction term according to Lucuta applies to obtain the thermal conductivity at
different real densities. The porosity correction is on the form of Maxwell-Euckman formula:
(
) Eq.19
The correlation predicts decrease of thermal conductivity with temperature until it reaches a
minimum between 1850 and 1900 K then begins to rise again due to the electronic heat conduction
as shown in Fig.8 for a 95%TD of the fuel at different burn-ups. The same is true for different
values of fuel porosity. It can be noticed as well that the decrease of thermal conductivity with burn-
up which is consistent with the other MOX correlation used in TRANSURANUS and the theoretical
expectations. Again, the effect of burn-up on the thermal conductivity is more important at lower
temperature as can be seen from Fig.8 being the degradation of conductivity in the order of 40% at
800K (in the range 0 – 100MWd/kgHM). At 2000 K, the thermal conductivity for the same range of
burn-up decreases by 18%.
Porosity effect is given in Fig.9. The decrease is linear and the rate of decrease is constant over the
whole range of temperatures (it is about 15% when the porosity increase from 0 to 10%).
Deviation from stoichiometry is accounted in Fig.10 and Fig.11. The more hypostoichiometric the
fuel, the higher the decrease of the thermal conductivity. For a change of O/M from 2 to 1.95, the
decrease in thermal conductivity can reach upto 30% at 800 K. This effect gets lower as the
temperature goes high. At 2000 K and the reduction in thermal conductivity on the same range of
change of O/M ratio is about 8%, as noticed in Fig.10.
It is known that the thermal conductivity decreases with temperature to a minimum then increases
again. It can be notice from Fig.10. that the more hypostoichiometric the fuel is the lower the
temperature for which the thermal conductivity reaches that minimum.
As in the previous case, the correlation is non physical for hyperstoichiometry since it predicts the
increase of thermal conductivity with hyperstoichiometry which contradicts the experimental
findings. It sholud be pointed out that the code recommends the use of these correlations only for
O/M up to 2. The lower is the temperature, the higher is the degradation of thermal conductivity
with the hypostoichiometry, Fig.11. For 800 K the thermal conductivity decreases by 30% for a
deviation from stoichiometry of 0.05. At 2000 K for the same range of deviations the decrease of
thermal conductivity is around 8% and decreases more as the temperature goes higher.

Ricerca Sistema Elettrico
Sigla di identificazione
ADPFISS – LP2 – 054
Rev.
0
Distrib.
L
Pag. di
54 75
Fig.8 - Thermal conductivity as a function of temperature for different burn ups, correlation 33.
Fig.9 - Effect of fuel porosity on thermal conductivity, correlation 33.

Ricerca Sistema Elettrico
Sigla di identificazione
ADPFISS – LP2 – 054
Rev.
0
Distrib.
L
Pag. di
55 75
Fig.10 - Effect of deviation from stoichiometry on thermal conductivity at different values of
temperature, correlation 33.
Fig.11 - Thermal conductivity as a function of temperature for different burn ups, correlation 33.

Ricerca Sistema Elettrico
Sigla di identificazione
ADPFISS – LP2 – 054
Rev.
0
Distrib.
L
Pag. di
56 75
2.4 Correlation 34, Wiesenack.
Correlation 34 is the original Wiesenack’s correlation that is developed for UO2 fuel. In order to
apply it for MOX, the correlation is multiplied by a correction factor of 0.92. The original
correlation gives the thermal conductivity of MOX as a function of temperature and burn-up on the
form:
{ } { }
Eq.20
Where:
0.00188
And is the temperature in [0C] and bu is the burn up in
There is no specific equation for porosity correction given for this model so the original MATPRO-
11 porosity correction is used:
Eq.21
Where P is the porosity and
The correlation predicts a decrease of thermal conductivity with temperature until it reaches a
minimum between 1700 and 1900 K. For un-irradiated fuel, the minimum of thermal conductivity is
reached at 1900 as shown in Fig.12. The correlation indicates that as the burn up of the fuel
increases, that minimum in thermal conductivity is reached at a lower temperature. The minimum in
thermal conductivity at burn up of 100
is reached at a temperature range between 1500 to
1600. It can be noticed as well that the higher the burn up the flatter the curve of thermal
conductivity at lower temperature before it increases rapidly again at higher temperature. This gives
an indication that the phonon-phonon lattice vibration term is not effective and that the constant
term related to the phonon-defect interaction is the dominant one leading to almost constant thermal
conductivities at the range in which the thermal conductivity is more dependent on lattice vibration
rather than electronic conductivity. The thermal conductivity begins to rise again in the range of
temperature in which the ambipolar conductivity is dominant. The effect of burn up on the thermal
conductivity is higher at lower temperature as shown in Fig.12 At 800 K the thermal conductivity
decreased by 55% of its original value for unirradiated fuel when the burn up reached 100
. For
2000 K, the thermal conductivity for the same range of burn-up decreases by 25%. The burn up at
temperatures higher than 2000K seems to have a constant effect. The amount of thermal
conductivity decrease is the same regardless of the initial level of thermal conductivity. The curves
appear to be parallel to each others as can be seen in Fig.12.
The correlation predicts (Fig.13) a decrease of thermal conductivity with porosity. This decrease in
thermal conductivity is about 22% at low temperature (800 K) when the porosity increases from 0%
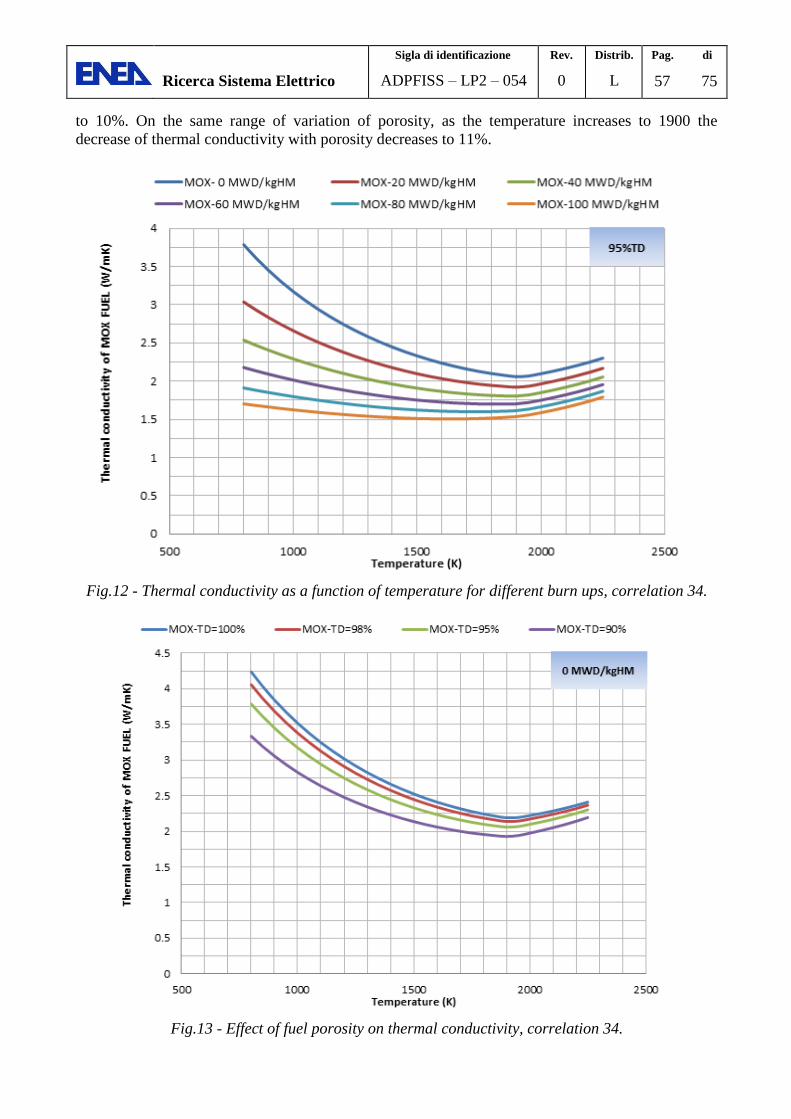
Ricerca Sistema Elettrico
Sigla di identificazione
ADPFISS – LP2 – 054
Rev.
0
Distrib.
L
Pag. di
57 75
to 10%. On the same range of variation of porosity, as the temperature increases to 1900 the
decrease of thermal conductivity with porosity decreases to 11%.
Fig.12 - Thermal conductivity as a function of temperature for different burn ups, correlation 34.
Fig.13 - Effect of fuel porosity on thermal conductivity, correlation 34.

Ricerca Sistema Elettrico
Sigla di identificazione
ADPFISS – LP2 – 054
Rev.
0
Distrib.
L
Pag. di
58 75
2.5 Comparison among TRANSURANUS models
The correlations implemented in TRANUSURANUS code described above are compared in Fig. 14
and Fig.15. The thermal conductivity change with temperature for un-irradiated 95% TD MOX fuel
is given in Fig. 14. The two correlations that has the effect of deviation from stoichiometry as
variables are ploted for two limits of 2 (stoichiometric condition) and 1.96 to see the range of
changes due to deviation from stoichiometry.
One can notice from Fig. 14 that the highest predicted thermal conductivity for the whole
temperature range is that for the Weisenak correlation (correlation 34) that is originally developed
for UO2 fuel with a correction factor to make it applicable for MOX. Lanning and beyer’s
correlation for stoichiometric condition gives values that are comparable to that of the modified
Weisenak correlation. The more hypostyoichiometric the fuel becomes, the higher deviation
between the two correlations exists. Correlation 31 according to Van Ufflen and Schubert is
identical to that of Lanning and Beyer (correlation 33) at lower temperature. As the ambipolar
thermal conductivity term begins to dominate, Correlation 33 deviates to a lower values from that of
Correlation 31 which is similar with the thermal conductivity according to Carbajo (correlation 32).
Correlation 32 gives a lower value of thermal conductivity from the other correlations at
stoichiometric conditions. At temperatures below 1000 K then, it becomes similar with them in the
intermediate temperature range then follow the same path as correlation 31 and deviates again to
lower values than that of correlation 32 and 34.
For the same theoretical density and with burn-up up to 100
, the rate of degradation of thermal
conductivity according to correlation 34 is the highest for most of the temperature range of interest
leading to higher decrease of thermal conductivity. The thermal conductivity by that correlation is
now comparable to those for the hypo-stoichiometric (O/M =1.96) correlations. Stoichiometric
correlations 32 and 33 have the lowest rate of decrease of thermal conductivity with burn up and at
the level of 100
they predict the highest thermal conductivities among all the correlations.
Fig.14 - Thermal conductivities from TRANSURANUS correlations.
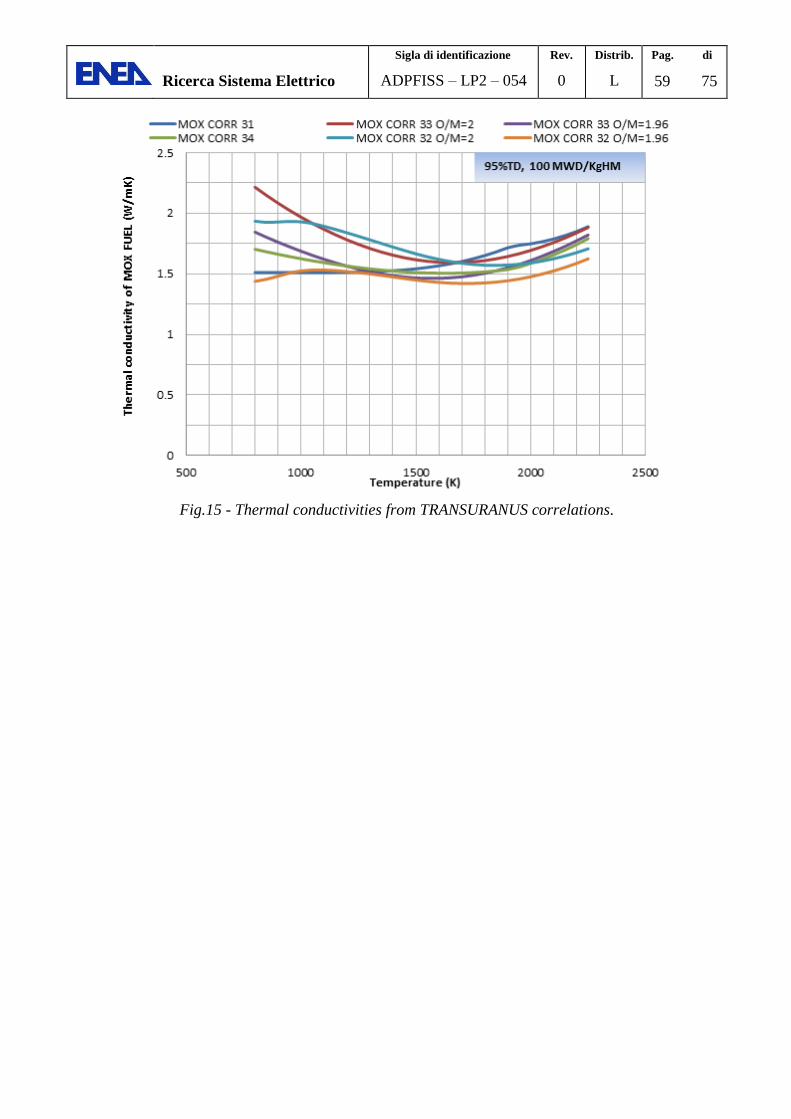
Ricerca Sistema Elettrico
Sigla di identificazione
ADPFISS – LP2 – 054
Rev.
0
Distrib.
L
Pag. di
59 75
Fig.15 - Thermal conductivities from TRANSURANUS correlations.

Ricerca Sistema Elettrico
Sigla di identificazione
ADPFISS – LP2 – 054
Rev.
0
Distrib.
L
Pag. di
60 75
3 Analysis of MOX conductivity models from open literature
In this section, several open literature correlations are described along with the variables that are
considered. The form of the equation for each model along with comments on the results obtained
from these correlations are included.
3.1 D.G Martin review 1982
In this work Martin did a re-appraisal of four thermal conductivity correlations (Washington,
Anscough, Killeen and Brandt) and chose one of them to do some ammendments to it instead of
producing a new independent correlation. The correlation chosen was that based on Washington’s
review in 1973. Even though the correlation by Killeen was the most correlation based on theory for
stoichiometric fuel, There were no theoretical knowledge sufficient enough to apply it with
certainity on non-stoichiometric fuel. The two correlations (Fig.16) are close to each other at low
and high temperature range, and even in the intermediate one, the deviation of Washington’s
correlation from that of Killeen should not cause great errors.[7]
The data available were reappraised and the few new data that appeared since the work of
Washington were added to the review. The correlation seemed to be giving satisfactory results for
UO2 and MOX as a function of temperature and O/M ratio.
The amended correlation can be written for hypostoichiometric MOX as:
Eq.22
The original correlations were tailored for UO2 and were projected to MOX by assuming a
correction factor of 0.95.The new correlation neglected the effect of irradiation in the temperature
range of (500-2800 0C) and the effect of plutonium content. It took the O/M ratio into account in the
lattice vibration term. The porosity correction was based on a modified Loeb forumula for porosity
level between (0<P<0.1 ) and based on Maxwell-Euckman formula in the range of (0.1<P<0.2). The
effect of porosity is a linear decrease of thermal conductivity as the porosity increases. This
decrease reaches to 42% for a porosity increase from 0 to 20% as shown in Fig.17
The effect of deviation from stoichiometry is a degradation of the thermal conductivity. This effect
is predicted from this correlation as shown in fig. to be from 42% at temperature of 800 K and
decreases with temperature to a value of 18% at 2000K for a stoichiometry change between (2 and
1.95). The effect of stoichiometry keeps decreasing with temperature but it can be considered
important on the whole range of normal operation of a fast breeder reactor fueled with MOX.

Ricerca Sistema Elettrico
Sigla di identificazione
ADPFISS – LP2 – 054
Rev.
0
Distrib.
L
Pag. di
61 75
Fig.16 - Thermal conductivity according to the four re-appraised models by Martin.
Fig.17 - Effect of fuel porosity on thermal conductivity, Martin.

Ricerca Sistema Elettrico
Sigla di identificazione
ADPFISS – LP2 – 054
Rev.
0
Distrib.
L
Pag. di
62 75
Fig.18 - Thermal conductivity as a function of temperature for different stoichiometries, Martin.
3.2 FTHCON subscode-MATPRO
The correlation used by the FTHCON subroutine determines the thermal conductivity of uncracked
UO2 and MOX fuels as a function of temperature, O/M ratio and plutonium content of a solid fuel.
It uses a porosity correction based on the Maxwell-Eucken relation. The burn-up is used only to
calculate the melting temperature of the fuel. Interpolation is used to remedy the discontinuity of the
slope in the temperature range between (1364-2300 K).
The correlation can be written as follows for Solid fuel:
[
] [
]
[
] { [
]
}
Eq.23
Where:
K = Thermal conductivity (W/m.K)
D = fractional theoretical density
= Phonon contribution to the specific heat at constant vlume (J/kg.K). MATPRO correlation for
specific heat is used to calculate this factor
= Linear strain caused by thermal expansion for temperatures above 300 K. MATPRO
correlation for linear strain is used to calculate this factor for uranium and plutonium then the value
is weighted according to the percentage of Plutonium in the fuel.
A = a factor represents the point defect contribution to the phonon’s mfp. = 0.339 + 12.6X where
X is the absolute value of the deviation from stoichiometry
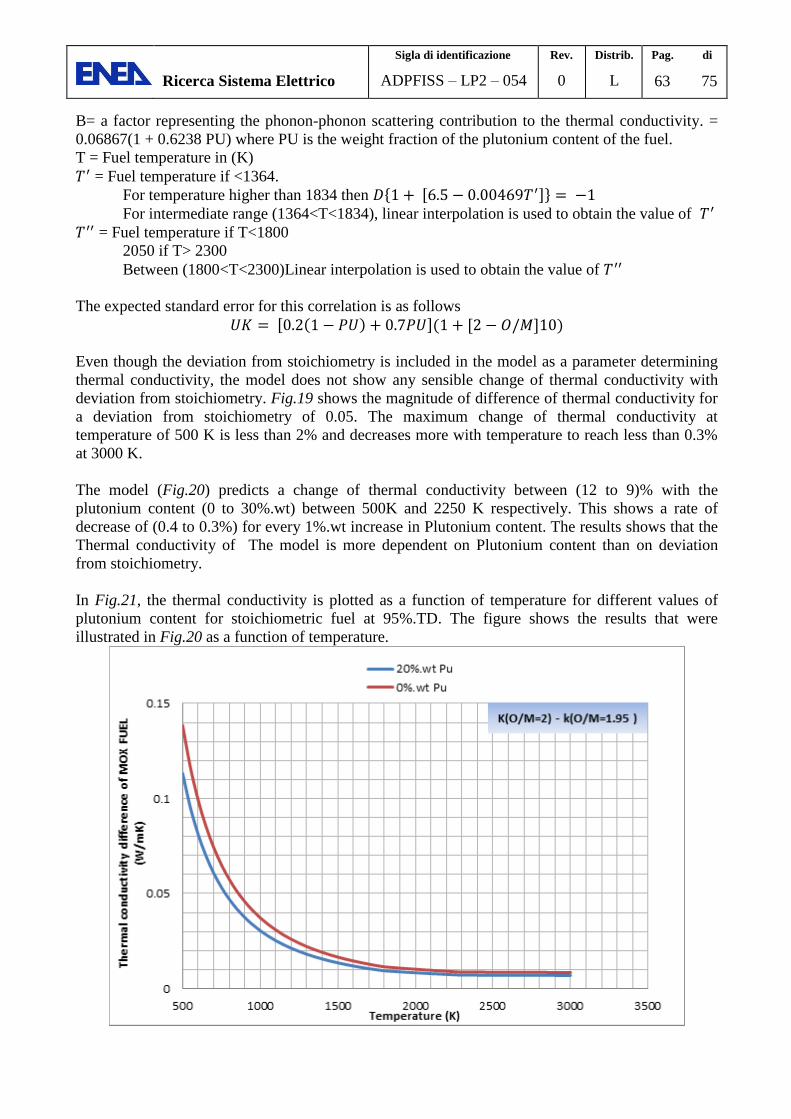
Ricerca Sistema Elettrico
Sigla di identificazione
ADPFISS – LP2 – 054
Rev.
0
Distrib.
L
Pag. di
63 75
B= a factor representing the phonon-phonon scattering contribution to the thermal conductivity. =
0.06867(1 + 0.6238 PU) where PU is the weight fraction of the plutonium content of the fuel.
T = Fuel temperature in (K)
= Fuel temperature if <1364.
For temperature higher than 1834 then { }
For intermediate range (1364<T<1834), linear interpolation is used to obtain the value of
= Fuel temperature if T<1800
2050 if T> 2300
Between (1800<T<2300)Linear interpolation is used to obtain the value of
The expected standard error for this correlation is as follows
Even though the deviation from stoichiometry is included in the model as a parameter determining
thermal conductivity, the model does not show any sensible change of thermal conductivity with
deviation from stoichiometry. Fig.19 shows the magnitude of difference of thermal conductivity for
a deviation from stoichiometry of 0.05. The maximum change of thermal conductivity at
temperature of 500 K is less than 2% and decreases more with temperature to reach less than 0.3%
at 3000 K.
The model (Fig.20) predicts a change of thermal conductivity between (12 to 9)% with the
plutonium content (0 to 30%.wt) between 500K and 2250 K respectively. This shows a rate of
decrease of (0.4 to 0.3%) for every 1%.wt increase in Plutonium content. The results shows that the
Thermal conductivity of The model is more dependent on Plutonium content than on deviation
from stoichiometry.
In Fig.21, the thermal conductivity is plotted as a function of temperature for different values of
plutonium content for stoichiometric fuel at 95%.TD. The figure shows the results that were
illustrated in Fig.20 as a function of temperature.
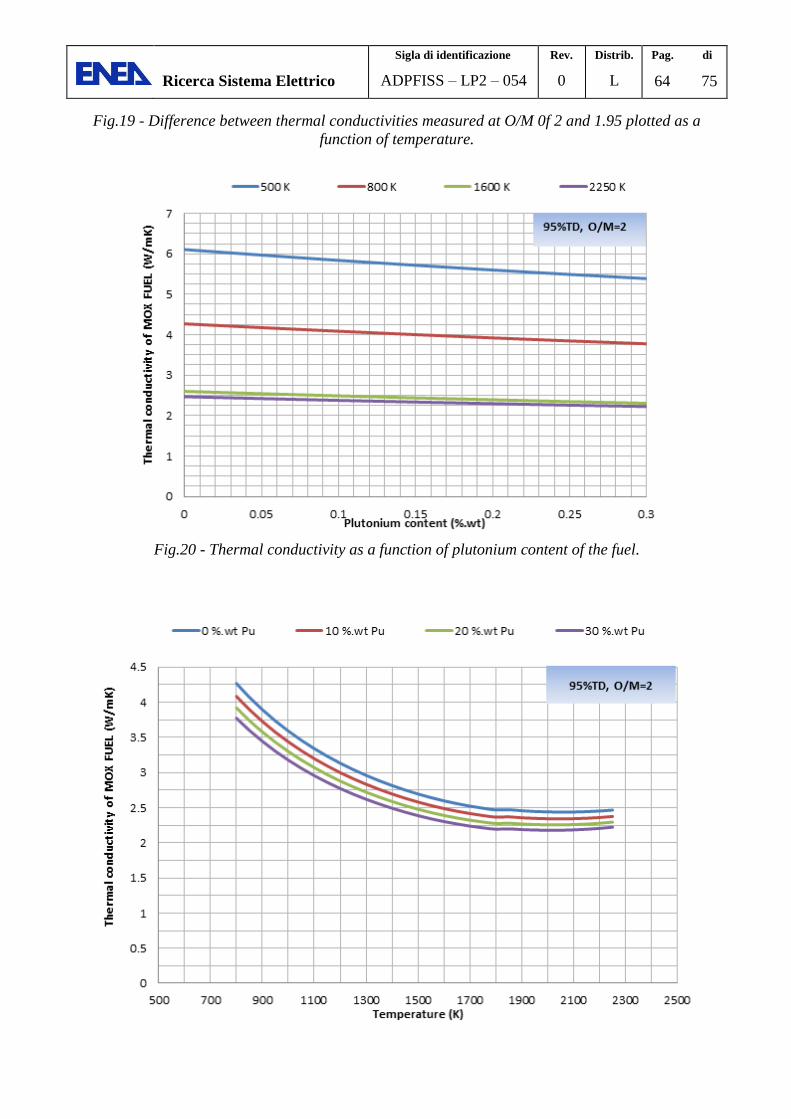
Ricerca Sistema Elettrico
Sigla di identificazione
ADPFISS – LP2 – 054
Rev.
0
Distrib.
L
Pag. di
64 75
Fig.19 - Difference between thermal conductivities measured at O/M 0f 2 and 1.95 plotted as a
function of temperature.
Fig.20 - Thermal conductivity as a function of plutonium content of the fuel.

Ricerca Sistema Elettrico
Sigla di identificazione
ADPFISS – LP2 – 054
Rev.
0
Distrib.
L
Pag. di
65 75
Fig.21 Thermal conductivity as a function of temperature for different Plutonium contents.
3.3 The COMETHE formulation-1982
This formula is used for UO2 and MOX fuels. It gives thermal conductivity of 95%TD fuel. A
porosity correction is used to give the thermal conductivity at different porosities. It was enhanced
to take the plutonium weight percentage into account based on the data from Gibby, Van Craey and
weilbacher.[11]
The formula is written as follows
( Eq.24
Where
T = temperature (K)
X = absolute value of deviation from stoichiometry
q= Plutonium content
= 40.05
= 129.4
= 16020
= 0.8
C = 0.6416x10⁻¹²
The model predicts (Fig.22) a decrease in thermal conductivity at lower temperature of about 0.5%
for every 1%.wt increase in the Plutonium content for stoichiometric fuel. The rate of decrease
slightly decreases at 2000 K but still in the same range of 0.5% per 1%.wt increase in Pu content
implying a constant effect of plutonium content on the whole temperature range of interest under
normal operations.
The effect of deviation from stoichiometry (from 2 to 1.95) is illustrated in Fig.23. The decrease of
thermal conductivity with hypo-stoichiometry can reach up to 42% decrease in thermal conductivity
at lower temperatures (800 K). This effect decreases with temperature to reach around 18% decrease
with stoichiometric decrease from 2 to 1.95. For the whole range of temperatures of interest the
change of thermal conductivity with deviation from stoichiometry is higher than that due to increase
of plutonium content of the fuel.

Ricerca Sistema Elettrico
Sigla di identificazione
ADPFISS – LP2 – 054
Rev.
0
Distrib.
L
Pag. di
66 75
Fig.22 - Thermal conductivity as a function of temperature for different plutonium contents.
Fig.23 - Thermal conductivity as a function of temperature for different O/M ratios.

Ricerca Sistema Elettrico
Sigla di identificazione
ADPFISS – LP2 – 054
Rev.
0
Distrib.
L
Pag. di
67 75
3.4 Baron Hervè- 1995 Model
The model is a modification of the same model that originated in 1994. The modification concerns
the high temperature term. It included originally a term relating high temperature conductivity to
radiation. The modification substituted this term by another one that considers electronic thermal
conductivity instead. This was done based on the work be Delette and Charles.[11]
The model takes
the temperature, deviation from stoichiometry, plutonium and Gadolinium content as variables. In
order to apply this model to MOX fuel, The Gadolinium content should be set to zero.
Eq.25
Where:
=Boltzmann constant (1.38.10-23
J/K)
W= (1.41*1.6)*10-19
J
=4.4819.10-2
(m.K/W), =4, =0.611 (m.K/W), =11.081(m.K/W)
= 2.4544.10-4
(m/W) , =0.8, =9.603.10-4
(m/W), =-1.768.10-2
(m/W)
C=5.516.109(W.K/m)
D=-4.302.1010
(W.K/m)
And, T is temperature in K up to 2600 K, x is the absolute value of deviation from stoichiometry, q
is the plutonium weight content, and g is the Gadolinium weight content.
The model predicts the same effect of Plutonium as in the Comethe formulation. In Fig.24 a
decrease in thermal conductivity at lower temperature of about 0.5% for every 1%.wt increase in the
Plutonium content for stoichiometric fuel. The rate of decrease slightly decreases at 2000 K but still
in the same range of 0.5% per 1%.wt increase in Pu content implying a constant effect of plutonium
content on the whole temperature range of interest under normal operations.
The effect of deviation from stoichiometry (from 2 to 1.95) is illustrated in Fig.25. Similar to the
COMETHE formulation, the decrease of thermal conductivity with hypostoichiometry can reach up
to 42% decrease in thermal conductivity at lower temperatures (800 K). This effect decreases with
temperature to reach around 18% decrease with O/M ratio decrease from 2 to 1.95. For the whole
range of temperatures of interest, the change of thermal conductivity with deviation from
stoichiometry is higher than that due to increase of plutonium content of the fuel.
Comparing the COMETHE formulation and Baron-Hervè model, the values of thermal conductivity
at temperatures up to 2000K are comparable. Above 2000 K, It can be noticed that the thermal
conductivity increases on a higher rate for Baron-Hervè model than for COMETHE formulation.

Ricerca Sistema Elettrico
Sigla di identificazione
ADPFISS – LP2 – 054
Rev.
0
Distrib.
L
Pag. di
68 75
Fig.24 - Thermal conductivity as a function of temperature for different plutonium contents.
0
0.5
1
1.5
2
2.5
3
3.5
4
4.5
500 700 900 1100 1300 1500 1700 1900 2100 2300 2500
The
rmal
co
nd
uct
ivit
y o
f M
OX
FU
EL (
W/m
K)
Temperature (K)
0 %.wt Pu 10%.wt Pu 20%.wt Pu 30 %.wt Pu 40 %.wt Pu
MOX 95%TD, O/M = 2

Ricerca Sistema Elettrico
Sigla di identificazione
ADPFISS – LP2 – 054
Rev.
0
Distrib.
L
Pag. di
69 75
Fig.25 - Thermal conductivity as a function of temperature for different O/M ratios.

Ricerca Sistema Elettrico
Sigla di identificazione
ADPFISS – LP2 – 054
Rev.
0
Distrib.
L
Pag. di
70 75
4 Comparison between the studied models.
In Fig.26, All the studied models are plotted together. For the models that include the deviation
from stoichiometry as a variable, the correlations are plotted for fresh fuel, for two limits of
stoichiometry (2 and 1.96). This is due to the significant effect of deviation from stoichiometry on
thermal conductivity. Meanwhile there are models that do not consider this effect, so it was needed
to see the prediction of both types of models together and how the deviation from stoichiometry
leads to higher variability between the models.
In Fig.26, The TRANSURANUS models are plotted with solid lines while the open literature
correlations are in dashed lines at O/M ratio of 2. The open literature correlations are plotted with
dots at O/M=1.96.
FOR (O/M=2), It can been seen that MATPRO at 20%.wt Plutonium and Martin’s values of
thermal conductivity are higher than TRANSURANUS models for all values of temperatures
considered. The values of COMETHE formulation for 20%.wt Plutonium is following Wiesenack’s
correlation upto 1600K then becomes slightly higher than it, then becomes lower again at 2100K.
The COEMTHE formulation gives higher thermal conductivities than the rest of TRANSURANUS
correlations for the shown range of temperature, except at 2200K when Lanning and beyer’s
correlations starts to give higher values of thermal conductivities.
Baron and hervè’s correlation for 20%.wt Pu gives lower values than TRANSURANUS correlations
except Carbajo’s correlation upto 1100K where it becomes slightly lower but comparable to Carbajo
and (Van Uffelen and Schubert) upto 1800 K where it starts to give higher values than both of them
but still lower than Wiesenack and (Lanning and Beyer). At 2200K, it starts to become higher than
Lanning and beyer but still lower than Weisenack.
In Fig.27, The same plot as in Fig.26 is done but the Plutonium content was reduced to 10%.wt.
TRANSURANUS correlations do not consider Pu content so they remain the same. The situation is
the same for Martin’s review. As for MATPRO correlation an expected increase in Thermal
conductivity occurs. The rate of increase of thermal conductivity for COMETHE formulation is
stronger than for MATPRO. The thermal conductivities predicted by COMETHE is now higher
than Martin’s and almost comparable to MATPRO below 1000K. With more decrease of Pu
content, COMETHE becomes higher than MATPRO for temperature upto 1100 for pure UO2.
For Baron-Hervè correlation, As the Pu content increase, thermal conductivity increases and follows
Martin’s at temperature upto 1100 K then follows Weisenack’s correlation for the rest of the
temperature range.
In Fig.26 when O/M ratio is reduced to 1.96. It is obvious at lower temperatures that the open
literature correlations, except MATPRO, predict a higher degradation with deviation from
stoichiometry than TRANSURANUS correlations that takes O/M ratio into account (Carbajo-
Lanning and beyer). At 1700 K it can be noticed that Martin review and COMETHE formulation
begins to follow Carbajo’s correlation. For the whole range of temperature, Baron and hervè’s
correlation is lower than all the others except below 950 K where it is slightly higher than Martin’s
review.
With O/M and Pu content decreased to 1.96 and 10%.wt Fig.27, the open literature correlations that
takes Pu content into account are still lower than Transuranus correlations in general. COMETHE

Ricerca Sistema Elettrico
Sigla di identificazione
ADPFISS – LP2 – 054
Rev.
0
Distrib.
L
Pag. di
71 75
formulation is higher than Carbajo for T<900 K then decreases up to 1600 where it becomes higher
than Carbajo again but still lower than Lanning and beyer for the whole range of temperature. Baron
and Hervè’s correlation becomes higher than Martin’s up to 1300 K. It decrease again upto 2150 K
where it increases again.
It this section there were no need to plot another figure at higher burn-up value since this was done
in section 2.5 for TRANSURANUS correlations. The open literature correlations that were studied
here do not have burn-up as a variable. So the figure is expected to be a plot where
TRANSURANUS predicted thermal conductivites degrade with burn-up for the same porosity and
stoichiometry level and the open literature remains in their high level.
It is important to note that even if the open literature models do not take burn-up as an explicit
variable affecting thermal conductivity, it does not mean that the thermal conductivity would not
degrade with irradiation. It means that with irradiation, the fuel structure would change and it would
have different level of porosity and stoichiometry and that would lead to a degradation of thermal
conductivity with burn-up.
So, in order to compare TRANSURANUS correlations that takes burn-up as an explicit variable
with the considered open literature correlations at higher burn-up, one must compare them with
open literature correlations at a different level of porosity and stoichiometry corresponding to the
new level of burn-up which is out of the scope of this study for now.
Finally a comparison is made between Martin’s review and COMETHE formulation and the
physically based correlation of Killeen. This is done for stoichiometric fuel with 20%.wt Pu content.
This is justified by what Martin recommendations in his paper[7]
that Killeen’s equation is more
preferred but due to lack of knowledge of how to project this correlation to non-stoichiometric fuel,
Washington’s recommendation was considered a suitable substitute.
It can be noticed from Fig.28 that COMETHE formulation is consistent with Washington’s equation
at lower temperature range upto 1000K where there is a slight deviation between the two upto
1300K. Then the COMETHE formulation follows Killeen’s model better than the review of Martin.
From 2300 K both correlations deviates from Killeen’s model. COMETHE correlation has larger
deviation from Martin’s review than Martin’s at high temperatures.
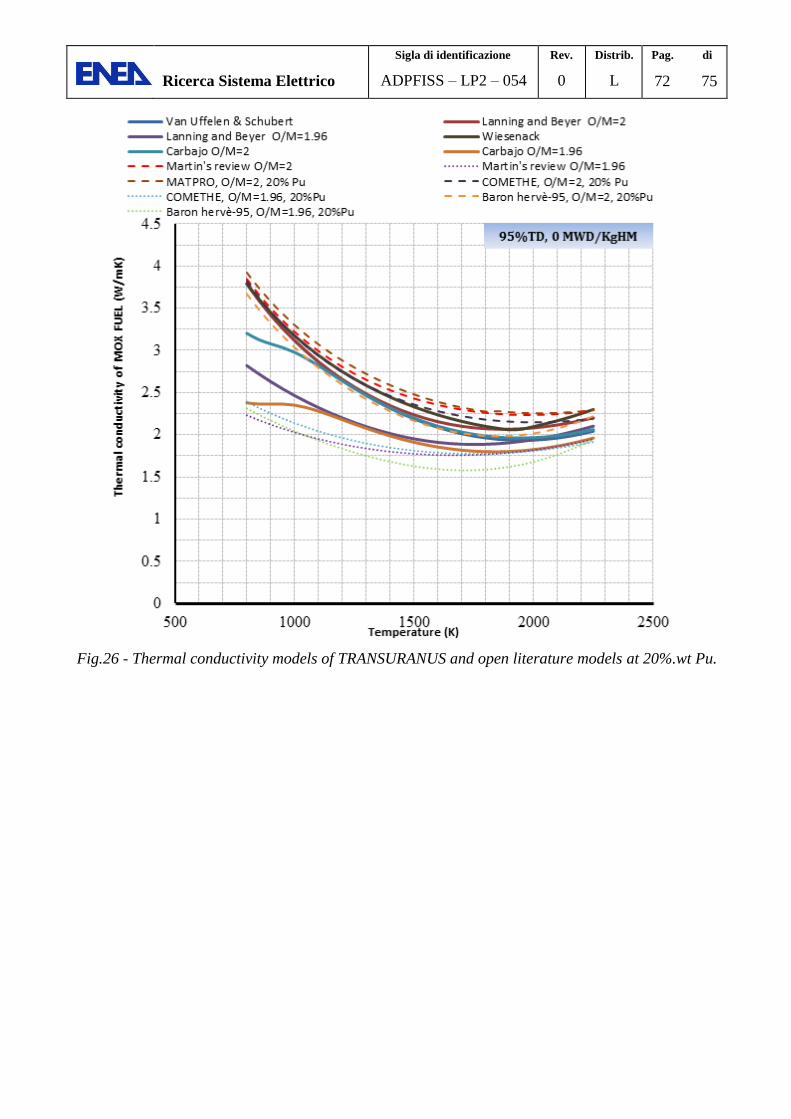
Ricerca Sistema Elettrico
Sigla di identificazione
ADPFISS – LP2 – 054
Rev.
0
Distrib.
L
Pag. di
72 75
Fig.26 - Thermal conductivity models of TRANSURANUS and open literature models at 20%.wt Pu.

Ricerca Sistema Elettrico
Sigla di identificazione
ADPFISS – LP2 – 054
Rev.
0
Distrib.
L
Pag. di
73 75
Fig.27 - Thermal conductivity models of TRANSURANUS and open literature models at 10%.wt Pu.

Ricerca Sistema Elettrico
Sigla di identificazione
ADPFISS – LP2 – 054
Rev.
0
Distrib.
L
Pag. di
74 75
Fig.28 - Thermal conductivities of the Killeen, Martin and COMETHE correlations.
0
1
2
3
4
5
6
500 1000 1500 2000 2500 3000
The
rmal
co
nd
uct
ivit
y o
f M
OX
FU
EL (
W/m
K)
Temperature (K)
Killeen Martin COMETHE
95%TD, O/M=2, 20%.wt

Ricerca Sistema Elettrico
Sigla di identificazione
ADPFISS – LP2 – 054
Rev.
0
Distrib.
L
Pag. di
75 75
REFERENCES
[1] Rozzia Davide, Del Nevo Alessandro, Modeling of FGR in nuclear reactor UO2 fuel and
its extension to MOX fuel.
[2] G.J.Hyland, Thermal conductivity of solid uo2: critique and recommendation 1982. J.
Nuclear Materials 113 (1983) 125-132
[3] D. R. Olander, Fundamental Aspects of Nuclear Reactors Fuel Elements. Department
of Nuclear Engineering University of California, Berkeley, 1976.
[4] http://en.wikipedia.org/wiki/Heat_transfer#Radiation, Last check 22-09-2014
[5] SCDAP/RELAP5/MOD3.1 Code manual volume4: MATPRO—A library of materials
properties for light water reactor accident analysis.
[6] Neil E. Todreas, Mujid S. Kazimi, Nucleaer Systems I, thermal Hydraulic
Fundamentals 1st edition. Massachusetts Institute of Technology, 1990.
[7] D.G. Martin, A reappraisal of the thermal conductivity of UO2 and mixed (U,Pu) oxide
fuels. Journal of Nuclear Materials 110 (1982) 73-94.
[8] Christian Duriez, Jean-Pierre Alessandri, Thierry Gervais, and Yannick Philipponneau,
Thermal conductivity of hypostoichiometric low Pu content (U,Pu)O2-x mixed oxide. J.
Nuclear Materials 277 (2000) 143-158.
[9] C.Ronchi, M. Sheindlin, M. Musella, and G.J. Hyland, Thermal conductivity of uranium
dioxide up to 2900 K from simulations measurement of the heat capacity and thermal
diffusivity. J. Applied Physics 85, 776 (1999)
[10] Juan J. Carbajo, Gradyon L.Yoder, Sergey G. Popov, and Victor K. Ivanov, A review of the
thermophysical properties of MOX and UO2 fuels. J. Nuclear Materials 299 (2001) 181-
198
[11] Daniel Baron, Fuel thermal conductivity: A review of the modeling available for UO2,
(U-Gd)O2 and MOX fuel. Thermal performance of high burn-up LWR fuel, seminar
proceddings Cadarache, France 3-6 March, 1998.