
Modeling wastewater management options with a Water...
21
Twelfth International Water Technology Conference, IWTC12 2008 Alexandria, Egypt 1 MODELING WASTEWATER MANAGEMENT OPTIONS WITH A WATER EVALUATION AND PLANNING TOOL (WEAP) FOR WADI NAR WATERSHED, WEST BANK, PALESTINE Mohammad N. Almasri and Ibrahim Hindi Water and Environmental Studies Institute An-Najah National University, P. O. Box 7, Nablus - Palestine E-mails: [email protected] , [email protected] ABSTRACT Water supply is a critical issue in the Middle East, particularly in the West Bank and Gaza Strip (Palestine). Water resources are scarce due to the arid climate and the population growth while water resources management and development is complicated by the ongoing Israeli occupation. There is a critical lack of sanitation in the West Bank. Only 45% of the Palestinian population is connected to a sewer network; the majority of households dispose of domestic sewage into unlined cesspits. There is currently only one operational wastewater treatment plant (WWTP) in the West Bank, so most of the sewage is directly discharged to the environment without treatment. Reuse of treated wastewater has great potential to alleviate this problem and improve crop yield. This paper presents a case study in the Wadi Nar Watershed (WNW) in the West Bank. The Water Evaluation and Planning Tool (WEAP) was used for mapping the management options related to wastewater reuse in WNW. Results show that WEAP is a sound management tool that can visualize the impact of key factors on the treated wastewater quantities and corresponding total area of wastewater reuse. INTRODUCTION The Middle East region including West Bank suffers from a chronic shortage in water resources accessibility. One of the most potential and promising alternative solutions is to reuse the treated wastewater for irrigation in agriculture. Wastewater management challenges are increasingly common. In water scarce regions, treated wastewater becomes a valuable alternative water resource for agricultural use. The identification and evaluation of different wastewater management options requires the integration of manifold issues to meet the needs of all stakeholders involved in the decision making process. This paper aims at documenting the development of a Water Evaluation and Planning (WEAP) tool for mapping the management options related to wastewater reuse in Wadi Nar Watershed (WNW), West Bank, Palestine. WNW is a watershed that extends from the eastern hills of Jerusalem and drains into the Dead Sea as shown in Figure 1.
Transcript of Modeling wastewater management options with a Water...
Twelfth International Water Technology Conference, IWTC12 2008 Alexandria, Egypt
1
MODELING WASTEWATER MANAGEMENT OPTIONS WITH A
WATER EVALUATION AND PLANNING TOOL (WEAP) FOR
WADI NAR WATERSHED, WEST BANK, PALESTINE
Mohammad N. Almasri and Ibrahim Hindi
Water and Environmental Studies Institute
An-Najah National University, P. O. Box 7, Nablus - Palestine
E-mails: [email protected] , [email protected]
ABSTRACT
Water supply is a critical issue in the Middle East, particularly in the West Bank and
Gaza Strip (Palestine). Water resources are scarce due to the arid climate and the
population growth while water resources management and development is complicated
by the ongoing Israeli occupation. There is a critical lack of sanitation in the West
Bank. Only 45% of the Palestinian population is connected to a sewer network; the
majority of households dispose of domestic sewage into unlined cesspits. There is
currently only one operational wastewater treatment plant (WWTP) in the West Bank,
so most of the sewage is directly discharged to the environment without treatment.
Reuse of treated wastewater has great potential to alleviate this problem and improve
crop yield. This paper presents a case study in the Wadi Nar Watershed (WNW) in the
West Bank. The Water Evaluation and Planning Tool (WEAP) was used for mapping
the management options related to wastewater reuse in WNW. Results show that
WEAP is a sound management tool that can visualize the impact of key factors on the
treated wastewater quantities and corresponding total area of wastewater reuse.
INTRODUCTION
The Middle East region including West Bank suffers from a chronic shortage in water
resources accessibility. One of the most potential and promising alternative solutions is
to reuse the treated wastewater for irrigation in agriculture. Wastewater management
challenges are increasingly common. In water scarce regions, treated wastewater
becomes a valuable alternative water resource for agricultural use. The identification
and evaluation of different wastewater management options requires the integration of
manifold issues to meet the needs of all stakeholders involved in the decision making
process. This paper aims at documenting the development of a Water Evaluation and
Planning (WEAP) tool for mapping the management options related to wastewater
reuse in Wadi Nar Watershed (WNW), West Bank, Palestine. WNW is a watershed
that extends from the eastern hills of Jerusalem and drains into the Dead Sea as shown
in Figure 1.

Twelfth International Water Technology Conference, IWTC12 2008 Alexandria, Egypt
2
Figure 1. Location of WNW in the West Bank
The watershed lies entirely within the eastern groundwater basin of the Mountain
Aquifer and is contained within Jerusalem and Bethlehem governorates. Figure 2
depicts a multitude of general properties of the watershed. Apparently, WNW is of
great heterogeneities in terms of ground surface elevation, head contours of
groundwater, evapotranspiration, rainfall distribution, subsurface formations, and
aridity. For a detailed elaboration of these issues, see Mutlak et al. (2006) and HWE
(2007a).

Twelfth International Water Technology Conference, IWTC12 2008 Alexandria, Egypt
3
Figure 2. General properties of Wadi Nar catchment
PROBLEM IDENTIFICATION
WNW witnesses the disposal of untreated wastewater into the main wadi course.
Wastewater originates from the major Palestinian cities and local communities in the
area, including East-Jerusalem that are inhabited by a total of approximately 135,000
residents.
The on-going practice of the disposal of untreated wastewater into the Wadi course
forms a health hazard, does not comply with the environmental requirements, and may
potentially contaminate the underlying aquifer. Management options proposed for
WNW would imply the reuse of the generated wastewater by installing wastewater
treatment plants in the area. Based on the work of HWE (2007a) and Klawitter et al.
(2007), Figure 3 shows the expected population size of the study area by year 2035,
the corresponding water consumption, wastewater generation, and the area of land
needed to implement an economically-sound wastewater reuse scheme.

Twelfth International Water Technology Conference, IWTC12 2008 Alexandria, Egypt
4
Figure 3. Current and expected future population, water consumption and wastewater
production, and proposed land to be equipped for potential wastewater reuse in the
study area
SCOPE AND OBJECTIVES
This paper aims at documenting the development of a Water Evaluation and Planning
(WEAP) tool for mapping the management options related to wastewater treatment
and reuse in WNW. Scope of work includes the following:
To map the recent wastewater collection situation;
To visualize and describe different wastewater management scenarios taking
into account increasing wastewater quantity caused by population growth and
increasing central water supply;
To build up the WEAP model allowing for the simulation and analysis of
various treated wastewater use scenarios in relation to the availability of land fit
for irrigation in WNW.
The WEAP model developed for WNW takes into account the following management
options (Klawitter et al., 2007):
Option I: Reuse of wastewater from all Palestinian communities including East
Jerusalem. This option connotes the construction of a centralized treatment plant for
wastewater generated from all the Palestinian communities (including East Jerusalem)
linked to WNW.
Option II: Under the second option, there are two alternatives:
(IIa) reuse of wastewater from all Palestinian communities excluding East
Jerusalem. This implies the construction of one separate treatment plant for the
wastewater from all the Palestinian communities (excluding East Jerusalem)
linked to WNW;

Twelfth International Water Technology Conference, IWTC12 2008 Alexandria, Egypt
5
(IIb) Reuse of wastewater from all Palestinian communities in East Jerusalem
through a separate wastewater treatment plant for the wastewater originated
from these communities.
Therewith, WEAP visualizes the following planning output spatially and temporarily
(among others):
Amount of water consumed by each community in the study area based on the
activity level (population size and per capita water consumption on daily basis);
Amount of wastewater generated from each community in the study area;
Amount of wastewater treated by each proposed wastewater treatment plant;
and
Total agricultural area that can be irrigated adequately.
METHODOLOGY AND IMPLEMENTATION
In order to achieve the research objectives, we implemented the methodology depicted
in Figure 4 and outlined in the subsequent sections.
Figure 4. A pictorial representation of the methodology
We started by gathering the available relevant information mainly from the discussion
papers developed within the overall study. In addition, information was obtained
through meetings and workshops. This important step facilitated the conceptualization
of the WEAP model. In addition, this is a guarantee that the data used and the options
mapped are in full concordant with the other team members. After collecting relevant
data, work objectives were developed and existing problems were comprehended such
that the objectives address these problems.

Twelfth International Water Technology Conference, IWTC12 2008 Alexandria, Egypt
6
Conceptualization was a crucial step since it precedes the development of the WEAP
model. The conceptualization rotated around the design of the management options
that were agreed upon earlier. We relied largely on the study of Abu-Madi (2006) in
mapping the management options and in creating the WEAP model. After determining
the options and the designation of the related input parameters, WEAP models that
address the different options were developed and tested accordingly. WEAP results
were verified for the different options by comparing them with the results presented by
Abu Madi (2006). The outcomes from running the WEAP models developed to map
the above-mentioned options are presented and analyzed in the following sections.
CONCEPTUALIZATION OF MANAGEMENT OPTIONS
Existing conditions – status quo
This scenario considers the existing conditions. Conceptually, Figure 5 depicts this
scenario. Almost 2 million cubic meters (mcm) of raw wastewater are recently being
dumped in the Wadi untreated.
Figure 5. Conceptual representation of the status-quo scenario

Twelfth International Water Technology Conference, IWTC12 2008 Alexandria, Egypt
7
Option I: Reuse of wastewater from all Palestinian communities
including East Jerusalem
This option connotes the construction of a centralized treatment plant for the
wastewater generated from all the Palestinian communities (including East Jerusalem)
linked to WNW. Figure 6 depicts the conceptual representation of this option. The
location of the WWTP is next to Ubeidiya located within WNW.
Figure 6. Conceptual representation of the first management option (Option – I)
Option IIa: Reuse of wastewater from all Palestinian communities
excluding East Jerusalem
This implies the construction of one separate treatment plant for the wastewater from
all Palestinian communities (excluding East Jerusalem) linked to WNW. Figure 7
depicts the conceptual representation of this option.
Option IIb: Reuse of wastewater from all Palestinian communities in East
Jerusalem through a separate wastewater treatment plant for
the wastewater originated from these communities
This implies the construction of one separate treatment plant for the wastewater
generated from the Palestinian communities in East Jerusalem. Figure 8 depicts the
conceptual representation of this option.

Twelfth International Water Technology Conference, IWTC12 2008 Alexandria, Egypt
8
Figure 7. Conceptual representation of the Option – IIa
Figure 8. Conceptual representation of the Option – IIb
DEVELOPMENT OF WEAP MODELS
General description of WEAP
WEAP stands for Water Evaluation And Planning System (see Figure 9).

Twelfth International Water Technology Conference, IWTC12 2008 Alexandria, Egypt
9
Figure 9. The opening window of WEAP
WEAP is developed by the Stockholm Environment Institute (SEI) based in Boston,
MA, US. WEAP Can be downloaded from www.weap21.org. WEAP is a tool for
integrated water resources planning and provides a comprehensive, flexible and user
friendly framework for policy analysis and impact assessment. WEAP is
comprehensive, straightforward, easy to use, and attempts to assist rather than
substitute for the skilled planner. As a database, WEAP provides a system for
maintaining water demand and supply information. As a forecasting tool, WEAP
simulates water demand, supply, flows, storage, pollution generation, treatment and
discharge, etc. As a policy analysis tool, WEAP evaluates a full range of water
development and management options. WEAP operates on the basic principle of water
balance where it places the demands (water use patterns, equipment efficiencies, reuse,
prices and allocation) on an equal footing with the supply (streamflow, groundwater,
reservoirs and water transfers). WEAP is applicable to municipal and agricultural
systems and single catchments or complex transboundary water systems. Additional
information about WEAP is available at www.weap21.org.
WEAP development
WEAP development in general connotes several steps. In the definition, we set up the
time frame which is in this case the year 2006 for the current accounts. These accounts
simulate the existing situation of the water demand, population, and resources of the
system, the spatial boundary, system components and configuration of the problem.
Alternative sets of future assumptions are based on policies, technological
development and other factors that affect demand, pollution, and supply and
hydrology. Scenarios are constructed based on several assumptions. Finally, the
scenarios are evaluated with regard to water sufficiency and other considerations. The
scenarios can address a broad range of What if questions such as: what if population
growth and economic development patterns change? WEAP calculates a water mass

Twelfth International Water Technology Conference, IWTC12 2008 Alexandria, Egypt
10
balance for every node and link in the system on a monthly time step. In our work, the
time extends from the year 2006 to the year of 2035. A total of 10 demand nodes in the
current account and 11 demand nodes in the scenarios were considered. Demand nodes
and water consumption rates are summarized in Table 1. The percentages of
population connected to the sewage networks are summarized in Table 2.
Table 1. Demand nodes and water consumption rates (l/c/d) in the communities
under study
Community 2006 2010 2015 2020 2025 2030 2035
Part of Bethlehem 62 90 90 140 140 140 140
Beit Sahour 62 90 90 140 140 140 140
Ubediya 62 90 90 140 140 140 140
Abu Dis 147 140 140 140 140 140 140
Al Ezariya 141 140 140 140 140 140 140
Sawahreh Sharqeyeh 62 90 90 140 140 140 140
East Jerusalem 90 140 140 140 140 140 140
Others1 62 90 90 140 140 140 140
1 Several small communities within WNW
Table 2. Percentage of population connected to sewerage network
for the communities under study
Comunity 2006 2010 - 2035
East-Bethlehem 95% 95%
Beit Sahour 95% 95%
Ubediya 0% 95%
Abu Dis 10% 95%
Al Ezariya 3% 95%
Sawahreh Sharqeyeh 0% 95%
East Jerusalem 80% 95%
Others 5% 95%
It was assumed that the industrial sector consumes 10% of the domestic water
consumption until the year 2010 and 20% of the domestic water consumption
afterward. In the development of the WEAP model, it was assumed that water
resources are adequate and suffice all the demands from the communities of WNW
throughout the simulation period. In addition, a population growth rate of 3% was
considered up to the year of 2035.
WEAP model components and assumptions
During the course of WEAP development, the following assumptions were made:

Twelfth International Water Technology Conference, IWTC12 2008 Alexandria, Egypt
11
Demand sites and water consumption rates are as summarized in Table 1;
The annual activity level is assumed based on a population growth rate of 3%;
The return flow links connect the demand sites and the disposal nodes or the
WWTP;
The transmission links connect the demand sites with the supply node with a
maximum flow rate sufficient to cover the site demand;
As the demand sites are not fully connected to the wastewater networks, septic-
tank nodes where assumed in the system to account for the amount of
wastewater that is not collected by the sewerage system. We assumed that 50%
of the septic tanks are generally evacuated and that either the evacuated
wastewater was disposed off in the Wadi or diverted to the wastewater
treatment plant (WWTP);
We considered that 20% of the water consumed is lost and that 80% of this
water returns to the system as wastewater (represented in WEAP as return
flow). Thereafter, the return flow is then routed based on the percent of
connection to the wastewater network;
In the proposed future options two options where adopted; the first option is to
collect all the wastewater from the West Bank and East Jerusalem communities
and to be treated in Wadi Nar WWTP while the second option is to collect the
wastewater from West Bank communities and East Jerusalem communities and
to treat the wastewater separately. That is, there will be two WWTPs; one in
East Jerusalem and the second in Al-Ubeidiya;
Agricultural area that can be irrigated with the treated wastewater is based on a
water consumption rate of 700 CM/dunum in the dry season and
350 CM/dunum in the wet season. This agricultural area increases over time,
incrementally.
RESULTS AND ANALYSIS
In the following sections, results from WEAP model were obtained for the different
options. The essence of these options relies on the fact that the communities will be
almost connected to the sewerage collection network. These options differ from each
other when considering the existence of a wastewater treatment plant. Another key
factor embedded in these options is that the growth rate leads to an increased
population and indeed results in an increase in the generated wastewater in the area
due to the increase in water consumption.
Existing conditions
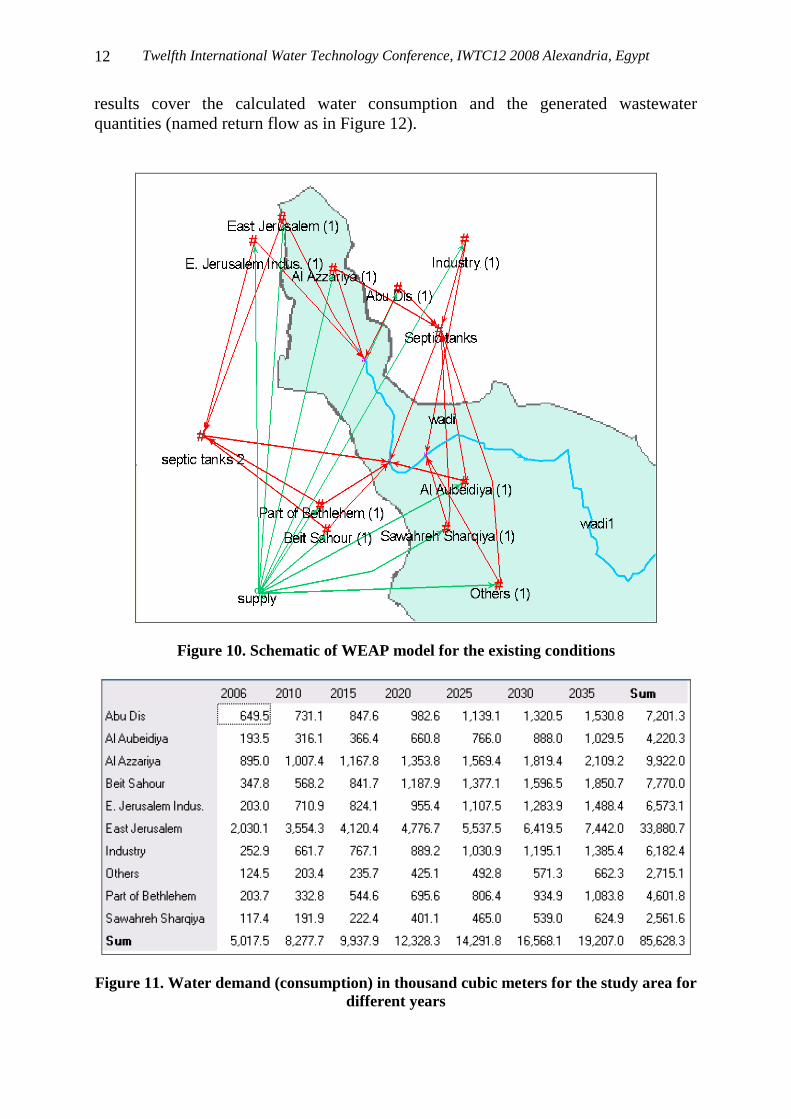
To map the existing situation in terms of wastewater generation, collection,
population, and future growth, the model was developed accordingly taking into
account the assumptions made earlier. Figure 10 illustrates the schematic of the WEAP
model for mapping the existing situation of wastewater. WEAP was executed and
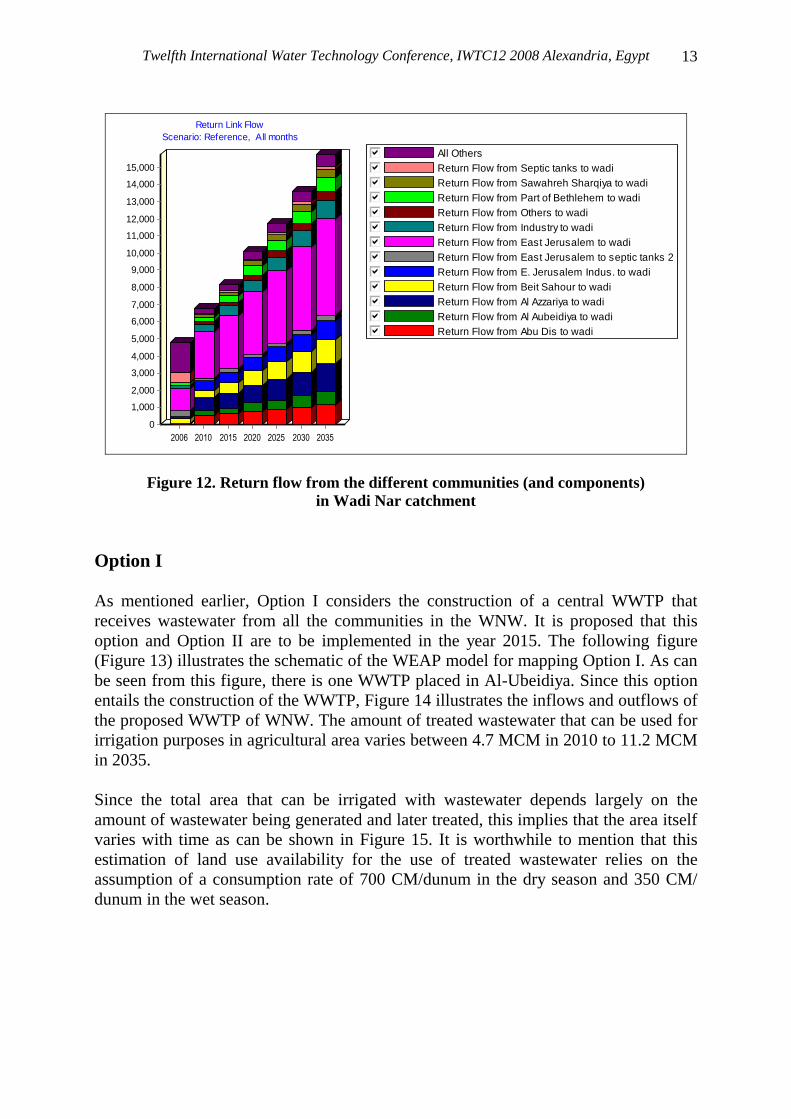
results are summarized in Figure 11. Results cover the period up to the year 2035. Key
Twelfth International Water Technology Conference, IWTC12 2008 Alexandria, Egypt
12
results cover the calculated water consumption and the generated wastewater
quantities (named return flow as in Figure 12).
Figure 10. Schematic of WEAP model for the existing conditions
Figure 11. Water demand (consumption) in thousand cubic meters for the study area for
different years
Twelfth International Water Technology Conference, IWTC12 2008 Alexandria, Egypt
13
All Others gfedcbReturn Flow from Septic tanks to wadigfedcbReturn Flow from Sawahreh Sharqiya to wadigfedcbReturn Flow from Part of Bethlehem to wadigfedcbReturn Flow from Others to wadigfedcbReturn Flow from Industry to wadigfedcbReturn Flow from East Jerusalem to wadigfedcbReturn Flow from East Jerusalem to septic tanks 2gfedcbReturn Flow from E. Jerusalem Indus. to wadigfedcbReturn Flow from Beit Sahour to wadigfedcbReturn Flow from Al Azzariya to wadigfedcbReturn Flow from Al Aubeidiya to wadigfedcbReturn Flow from Abu Dis to wadigfedcb
Return Link Flow
Scenario: Reference, All months
2006 2010 2015 2020 2025 2030 2035
Thousand C
ubic
Mete
r
15,000
14,000
13,000
12,000
11,000
10,000
9,000
8,000
7,000
6,000
5,000
4,000
3,000
2,000
1,000
0
Figure 12. Return flow from the different communities (and components)
in Wadi Nar catchment
Option I
As mentioned earlier, Option I considers the construction of a central WWTP that
receives wastewater from all the communities in the WNW. It is proposed that this
option and Option II are to be implemented in the year 2015. The following figure
(Figure 13) illustrates the schematic of the WEAP model for mapping Option I. As can
be seen from this figure, there is one WWTP placed in Al-Ubeidiya. Since this option
entails the construction of the WWTP, Figure 14 illustrates the inflows and outflows of
the proposed WWTP of WNW. The amount of treated wastewater that can be used for
irrigation purposes in agricultural area varies between 4.7 MCM in 2010 to 11.2 MCM
in 2035.
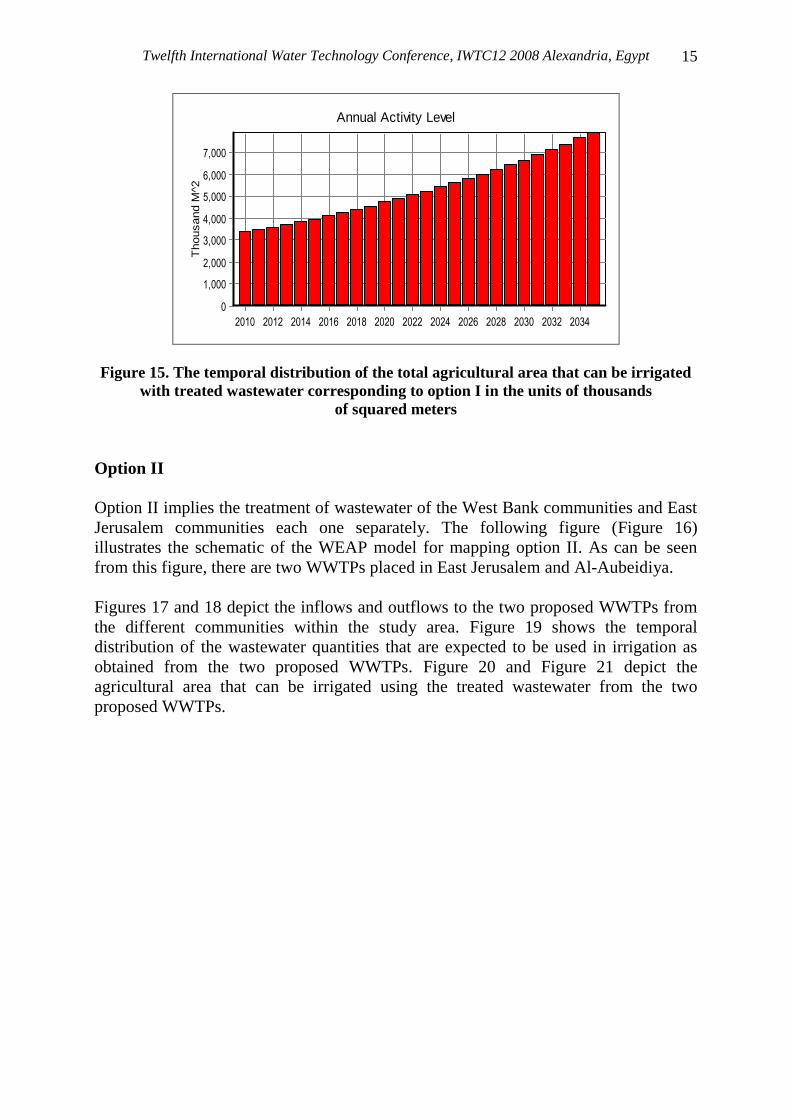
Since the total area that can be irrigated with wastewater depends largely on the
amount of wastewater being generated and later treated, this implies that the area itself
varies with time as can be shown in Figure 15. It is worthwhile to mention that this
estimation of land use availability for the use of treated wastewater relies on the
assumption of a consumption rate of 700 CM/dunum in the dry season and 350 CM/
dunum in the wet season.

Twelfth International Water Technology Conference, IWTC12 2008 Alexandria, Egypt
14
Figure 13. Schematic of WEAP model for option I
All Others gfedcbOutflow to treated watergfedcbLost in Treatment gfedcbInflow from Sawahreh SharqiyagfedcbInflow from Part of BethlehemgfedcbInflow from Others gfedcbInflow from Industry gfedcbInflow from East JerusalemgfedcbInflow from E. Jerusalem Indus.gfedcbInflow from Beit SahourgfedcbInflow from Al AzzariyagfedcbInflow from Al AubeidiyagfedcbInflow from Abu Dis gfedcb
Wastew ater Treatment Plant Inflow s and Outflow s
Scenario: Reference, All months, Wastew ater Treatment Plant: Wadi Nar WWTP
2010 2015 2020 2025 2030 2035
Thousand C
ubic
Mete
r
14,000
12,000
10,000
8,000
6,000
4,000
2,000
0
-2,000
-4,000
-6,000
-8,000
-10,000
-12,000
-14,000
Figure 14. The time distribution of the inflows and outflows of the proposed WTTP of
WNW corresponding to Option I
Twelfth International Water Technology Conference, IWTC12 2008 Alexandria, Egypt
15
Annual Activity Level
2010 2012 2014 2016 2018 2020 2022 2024 2026 2028 2030 2032 2034
Thousand M
^2
7,000
6,000
5,000
4,000
3,000
2,000
1,000
0
Figure 15. The temporal distribution of the total agricultural area that can be irrigated
with treated wastewater corresponding to option I in the units of thousands
of squared meters
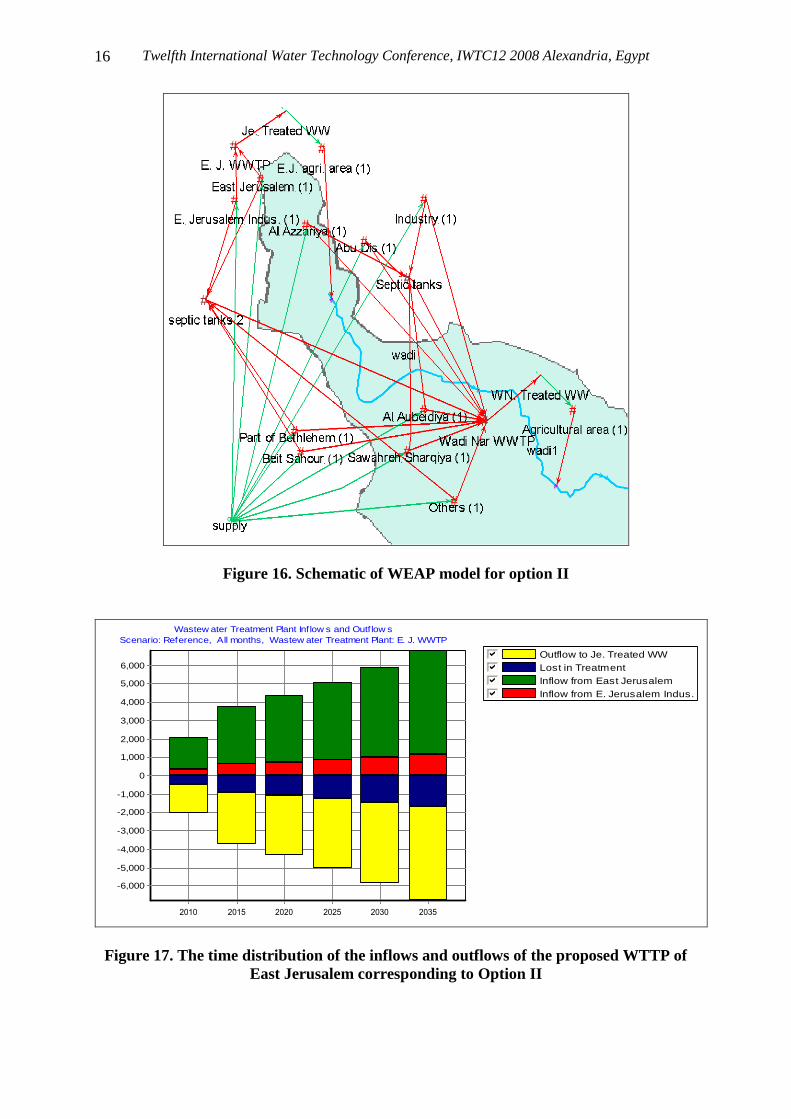
Option II
Option II implies the treatment of wastewater of the West Bank communities and East
Jerusalem communities each one separately. The following figure (Figure 16)
illustrates the schematic of the WEAP model for mapping option II. As can be seen
from this figure, there are two WWTPs placed in East Jerusalem and Al-Aubeidiya.
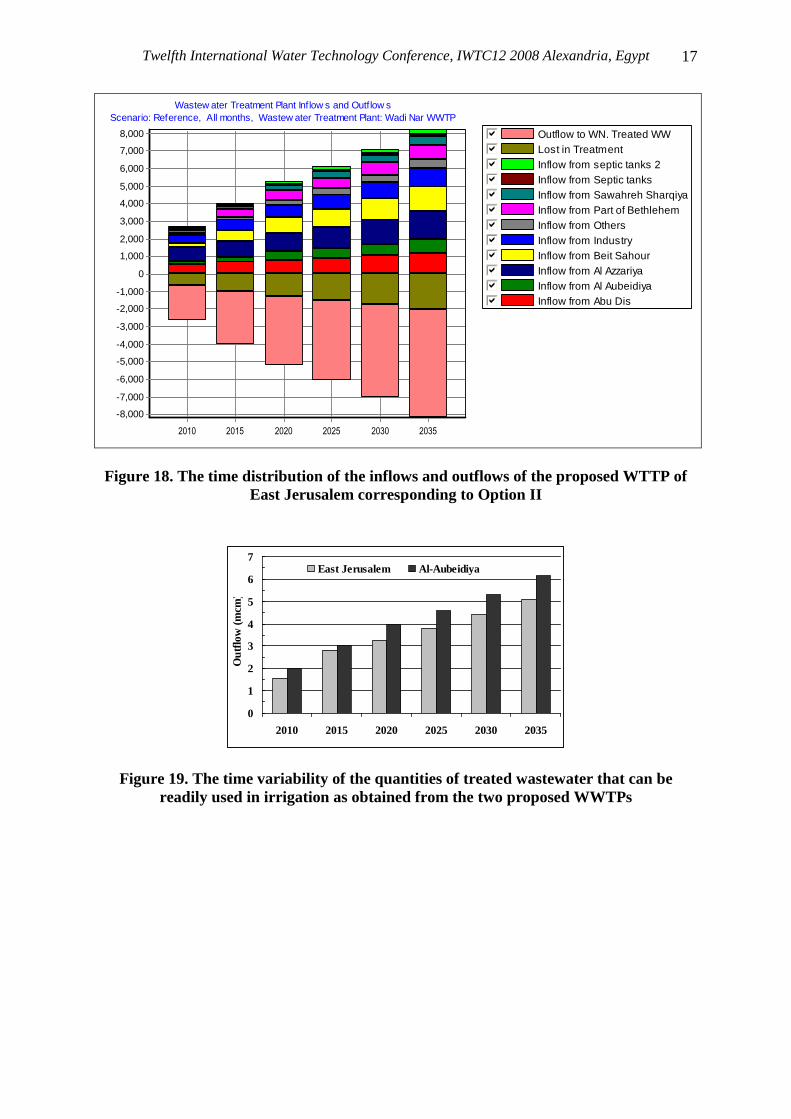
Figures 17 and 18 depict the inflows and outflows to the two proposed WWTPs from
the different communities within the study area. Figure 19 shows the temporal
distribution of the wastewater quantities that are expected to be used in irrigation as
obtained from the two proposed WWTPs. Figure 20 and Figure 21 depict the
agricultural area that can be irrigated using the treated wastewater from the two
proposed WWTPs.
Twelfth International Water Technology Conference, IWTC12 2008 Alexandria, Egypt
16
Figure 16. Schematic of WEAP model for option II
Outflow to Je. Treated WWgfedcbLost in Treatment gfedcbInflow from East JerusalemgfedcbInflow from E. Jerusalem Indus.gfedcb
Wastew ater Treatment Plant Inflow s and Outflow s
Scenario: Reference, All months, Wastew ater Treatment Plant: E. J. WWTP
2010 2015 2020 2025 2030 2035
Thousand C
ubic
Mete
r
6,000
5,000
4,000
3,000
2,000
1,000
0
-1,000
-2,000
-3,000
-4,000
-5,000
-6,000
Figure 17. The time distribution of the inflows and outflows of the proposed WTTP of
East Jerusalem corresponding to Option II
Twelfth International Water Technology Conference, IWTC12 2008 Alexandria, Egypt
17
Outflow to WN. Treated WWgfedcbLost in Treatment gfedcbInflow from septic tanks 2gfedcbInflow from Septic tanksgfedcbInflow from Sawahreh SharqiyagfedcbInflow from Part of BethlehemgfedcbInflow from Others gfedcbInflow from Industry gfedcbInflow from Beit SahourgfedcbInflow from Al AzzariyagfedcbInflow from Al AubeidiyagfedcbInflow from Abu Dis gfedcb
Wastew ater Treatment Plant Inflow s and Outflow s
Scenario: Reference, All months, Wastew ater Treatment Plant: Wadi Nar WWTP
2010 2015 2020 2025 2030 2035
Thousand C
ubic
Mete
r
8,000
7,000
6,000
5,000
4,000
3,000
2,000
1,000
0
-1,000
-2,000
-3,000
-4,000
-5,000
-6,000
-7,000
-8,000
Figure 18. The time distribution of the inflows and outflows of the proposed WTTP of
East Jerusalem corresponding to Option II
0
1
2
3
4
5
6
7
2010 2015 2020 2025 2030 2035
Ou
tflo
w (
mcm
)
East Jerusalem Al-Aubeidiya
Figure 19. The time variability of the quantities of treated wastewater that can be
readily used in irrigation as obtained from the two proposed WWTPs

Twelfth International Water Technology Conference, IWTC12 2008 Alexandria, Egypt
18
Annual Activity Level
2010 2012 2014 2016 2018 2020 2022 2024 2026 2028 2030 2032 2034
Thousand M
^2
3,500
3,000
2,500
2,000
1,500
1,000
500
0
Figure 20. The total area that can be irrigated using the treated wastewater from the
WWTP of East Jerusalem
Annual Activity Level
2010 2012 2014 2016 2018 2020 2022 2024 2026 2028 2030 2032 2034
Thousand M
^2
2,500
2,000
1,500
1,000
500
0
Figure 21. The total area that can be irrigated using the treated wastewater from the
WWTP of Al-Aubeidiya
Scenario assessment using WEAP
As was furnished earlier in this paper, all scenarios assume a water consumption rate
of 140 l/c/d starting from the outset in year 2010 and also assume that all communities
are connected to the sewerage network at a percentage of 95%. However, such a
scenario may not occur. If this is the case, then the expected benefits that may take
place will not be attained due to the decline in the amount of wastewater being
generated. This implies in turn that there will be a reduction in the total area that can
be irrigated using the treated wastewater.
In this section, we attempt to utilize the developed WEAP model in finding out the
implications of not fulfilling the above-mentioned assumptions. In other words, WEAP
will be utilized in addressing what if questions. By doing this, we aim to demonstrate
WEAP applicability and flexibility and to show the overall sensitivity of WEAP
outcome to changes in key inputs. Such an example definitely suites the desire of
decision makers in processing emerged scenarios and predicting the corresponding

Twelfth International Water Technology Conference, IWTC12 2008 Alexandria, Egypt
19
output. As such, we ran a scenario in which only 60% of the population that is
currently without a collected network are connected to a sewerage system.
This very scenario reflects potential influence of the current political situation in
Palestine and the possible impedance of connecting these communities to the sewerage
system. To determine the per capita daily consumption of water, it was assumed that
water consumption increases by 1 litre per capita per year. Figure 22 depicts the
amounts of wastewater that are expected to be generated from the two WWTPs. These
quantities can be used in irrigation. The agricultural area that can be irrigated from the
WWTP located in Al-Aubeidiya is 3,493 donums in the year 2035 while the
wastewater treated in the WWTP of East Jerusalem can irrigate a total area of 2,978
dunums.
0
1
2
3
4
5
6
7
2010 2015 2020 2025 2030 2035
Outflow (mcm)
East Jerusalem Al-Aubeidiya
Figure 22. The time variability of the quantities of treated wastewater that can be
readily used in irrigation. These quantities are obtained from the two proposed
WWTPs under the assumption that only 60% of the population are connected
to a sewerage network in million cubic meters
Cost estimate
WEAP can provide a cost estimate. In our model if we use an activated sludge WWT
method and for option I, the following figure illustrates cost of one cubic meter of
treated wastewater from year 2010 to the year 2035. It costs $1.32 /m3 in the year of
2010 to $0.56 /m3 in the year 2035 as shown in Figure 23.

Twelfth International Water Technology Conference, IWTC12 2008 Alexandria, Egypt
20
Reference
Average Cost of Water (per m^3)
month: January
Jan
2010
Jan
2015
Jan
2020
Jan
2025
Jan
2030
Jan
2035
U.S
. D
olla
r
1
0
Figure 23. The time variability of the cost of one cubic meter of treated wastewater from
year 2010 to the year 2035 under option I
CONCLUSIONS
The following are the main conclusions:
1. WEAP is a sound management tool that can visualize the impact of key factors on
the final outcome in terms of the treated wastewater quantities and corresponding
total area that can be irrigated accordingly;
2. Results show that the outcome depends largely on the population size (growth rate)
and the percentage of connection to sewerage systems. This is an indication of the
high sensitivity of the WEAP output to variations in the input parameters. Needless
to mention that the uncertainty in the values of these parameters would drastically
lead to unrealistic estimates of anticipated benefits. In other words, there are two
major concerns:
a. We do not expect that the per capita water consumption will go up to
140 l/d starting from 2010
b. We do not expect that the communities (within the study area) that are
currently unconnected to the sewerage system to be connected at 95%
level
3. There is variability in time and space in terms of the area that can be irrigated using
the treated wastewater. In other words, with increasing the population size more
wastewater will be available for reuse;
4. It is recommended that the data used in the development of the WEAP model to be
updated on regular basis to insure that the data is genuine and to verify the impacts
of the data on the overall planning strategies; and
5. One of the issues that need to be considered in a rational way is the availability of
freshwater resources that can furnish the designated water consumption rates. In
addition, this applies to the percentage of connection to the sewerage systems since
it is quite defying to arrive at 95% of connection within the specified time span.

Twelfth International Water Technology Conference, IWTC12 2008 Alexandria, Egypt
21
ACKNOWLEDGEMENTS
This research was carried out, in part, under GLOWA JR project. Special thanks go for
Simone Klawitter of Berlin University for the constructive comments.
REFERENCES
Abu Madi, M. (2006). Cost and benefits of wastewater treatment and reuse for
irrigation in Wadi Al-Nar area. Prepared to the House of Water and Environment.
Draft Report.
HWE, (2007a). Overview on current and potential land use/cover for the Wadi
Nar/Kidron catchment. Paper submitted to House of Water and Environment (HWE)
for the German-Israeli-Palestinian research project: “From conflict to collective action:
Institutional change and management options to govern transboundary watercourses”,
Ramallah.
HWE (2007b). Costs and benefits of wastewater treatment and reuse for irrigation in
Wadi Al-Nar/Kidron area. Paper submitted to House of Water and Environment
(HWE) for the project: “From conflict to collective action: Institutional change and
management options to govern transboundary watercourses”, Ramallah.
Klawitter, S., Mutlack, N., and Meran, G., (2007). Waste water treatment management
options for the Wadi Nar/Kidron and their characteristics, Discussion paper prepared
for the project "From Conflict to Collective Action: Institutional Change &
Management Options to Govern Transboundary Watercourses", Technical University,
Berlin, Germany.


