SPAN 6342 / 20th Century Span-American Prose SPRING 2019 ...

Modeling the span of control of leaders with differentskill sets
Walid F. Nasrallah1 • Charbel J. Ouba1 •
Ali A. Yassine1 • Issam M. Srour2
� Springer Science+Business Media New York 2015
Abstract In leading a team doing routine engineering design, two orthogonal skill
sets can be distinguished: domain-specific or technical skills, and interpersonal
‘‘managerial’’ skills which are more general. This paper presents a computational
model of team performance that relates these two types of skills to the amount of
managerial and communication work generated given a certain team size (i.e. span of
control). This model can be used to derive the optimal managerial profile for any team
size, or the optimal team size for the skill set of a specificmanager, provided the nature
of the work remains fixed. The analysis of the model reveals several interesting
insights. First, managerial skills are found to increase team performance up to a point
after which it starts to decrease again. Second, a manager needs to compensate for low
domain knowledge with high people skills, so optimal managerial skill level increases
with lower domain knowledge. Third, both abilities have a significant impact on the
manager’s allocated time for his/her group; however, more influence is noticed for
managerial skills. Finally, the manager was found to be more essential to large teams.
Keywords Span of control � Manager skills � Leadership traits � Engineeringproject team � Routine design
& Walid F. Nasrallah
Charbel J. Ouba
Ali A. Yassine
Issam M. Srour
1 Engineering Management Program, American University of Beirut, Beirut, Lebanon
2 Faculty of Engineering and Architecture, The American University of Beirut, Beirut, Lebanon
123
Comput Math Organ Theory
DOI 10.1007/s10588-015-9187-8

1 Introduction
Since the rise of modern quality management methods, firms have focused on the
importance of teamwork as a way to improve decision making, coordinate complex
activities, and speed up execution (Katzenbach and Smith 1992; Haddad 1996;
Scholtes 1998). For example, Chrysler has dramatically improved its performance
since the early 90s primarily due to the use of platform teams (Ashley 1997), as did
GM and Ford (Marton 1999).
The design of complex products and services increasingly requires teams of
technical experts to collaborate on routine specification and configuration tasks.
Different professionals on the team specialize in narrow fields of expertise within
their domain, and team managers combine basic technical knowledge and generic
managerial skills to make the work of the whole team more efficient.
Although some teams function well when they are self-managed (Nasrallah 2006;
Hamel 2011), most teams are typically composed of a teammanager and subordinates.
A good team manager, who might, depending on the setting, carry the title of
‘‘coordinator’’, ‘‘facilitator’’ or ‘‘team leader’’, is able to communicate with the
environment, infuse energy to enhance his/her team’s capabilities, handle distur-
bances, and carry out many other functions to reach the team’s goals (Mintzberg
1973). Subordinates are selected depending on the project needs and nature of work.
The team manager’s formal authority makes him/her a key player in reaching
optimum team performance. His (or her, but henceforth ‘‘his’’ for brevity) success
as a manager, and subsequently his contribution to the team’s success, depend on
two factors: understanding of specific business or engineering topics, Sects. 4.2 and
4.3. Managerial skills include interpersonal, communication, and leadership skills,
in addition to project and time management skills. Domain knowledge includes
technical or financial knowledge (depending on the nature of work), strategic
thinking and decision making (related to work). Since this type of knowledge is very
specialized, the richest research literature on it tends to be in detailed case studies,
e.g., Carindal et al. (2004) for logistics or Jones (1977) for construction . Managerial
skills are transferrable and mostly related to people, while domain skills are specific
to each industry (Bailey and Helfat 2003).
One important aspect of the team is its size. A naı̈ve view of team size assumes
that an increase in team size means less work per person, but this neglects the
coordination time required among team members and the complexity of the
relationships associated with large membership (Goldberg et al. 2004). Managing a
team, particularly a large one, poses the challenge of coordinating among members,
including the team leader. Coordination affects communication time, work
efficiency and effectiveness, and team performance in general.
As modern businesses have focused on the role and importance of teams,
researchers have written volumes extolling the virtues of teamwork. This research
has tended to be either empirical in orientation or qualitative in methodology.
Engineering by its nature seeks quantitative understanding of its subjects, even those
involving human beings. Engineers seek to understand not only whether, but also
how and why changes in one variable affect the outcome.
W. F. Nasrallah et al.
123

In this paper, we attempt to build a quantitative model of team size by trying to
balance a small subset of factors critical to a team’s success. In particular, the aim of
this paper is to combine the effects of team size with the effects of the team leader’s
managerial and domain skills to compute an estimate of the time needed to reach a pre-
determined level of quality in an engineering design project. The importance of this
model resides in capturing the effects of these two factors, team size and team leader
skills, on a one-dimensional view of team performance. Different team sizes require
different managers; the classification of skills into ‘‘Domain’’ and ‘‘Managerial’’ skills
highlights each type’s advantages and disadvantages, relative to team size.
The following section illustrates, through a motivating example of a typical
engineering firm, the need for a model of team performance as a function of team
size and team leader skill set. The proposed model enables top management to
increase the performance of its teams. Depending on each specific work process and
group internal communication, the model provides optimal combination(s) of team
leaders’ skills and team size to complete the project on time and within a certain
number of work hours. This combination could be reached through several means:
varying team size, modifying work process, assigning/hiring appropriate managers
for the selected teams, or sending managers to appropriate training programs.
1.1 Motivating example
The example comes from the second author’s employer, an EPC (Engineering-
Procurement-Construction) firm that constructs and manages power plants based on
reciprocating engines and gas turbines across the Middle East, Africa, and Central
Asia. We will refer to the company by its actual initials, SPP (for Solution Power
Fig. 1 Process flowchart for typical SPP project
Modeling the span of control of leaders with different skill sets
123

Partner), but the individual managers and projects will be referred to by numbers at
the request of the company’s management.
The company’s design process for each new project follows the general template
shown in Fig. 1. The SPP process is quite typical of pre-bid phase of similar
engineering firms (Cheng et al. 2006; Cooper et al. 2008).
The scope of work is divided into five work areas: pre-sales, sales, engineering,
project management, and after-sales. Team members communicate within and across
these work areas to finish the project. The communication dependencies among the
different specialized engineering sub-teams (i.e., clusters) are illustrated in the
Design Structure Matrix (DSM) shown in Fig. 2 (Eppinger and Browning 2012).
Due to the relatively large size of the engineering teams working on SPP projects
(e.g., 15–20), and the interdependence of their work, a considerable amount of time
is spent on communicating. In addition, each team leader has a different skill set,
matching this to the requirements of each job is a challenge. As a consequence, SPP
overhead costs are sometimes high, and project schedule targets are not always met.
Many engineering companies involved in routine technical or engineering design
and configuration share this problem (Chang 2002).
In this paper, the preliminary study phase is assumed to last enough to reach a
certain level of quality independently of the manager’s skills or number of people
selected to participate in the preliminary study. In other words, if a highly skilled
manager needs a certain time T1 to finish the preliminary study, then a lower skilled
manager will need time T2[T1 to finish the preliminary study with the same
quality. The question of how the team leader knows when the level of quality is
reached is outside the scope of this paper: either the manager has the skill to make
that determination in zero time, or a higher manager makes the call.
The teammembers are assumed to have the knowledge to cover the project at hand,
so no technical assistance from outside the group is required in the preliminary phase.
In the detailed design phase, any input from outside is considered part of the project
work volume. Teams are also assumed to have been around long enough that the skills
Fig. 2 Team-based DSM for typical SPP project
W. F. Nasrallah et al.
123

of the members are within a common range, with members whose background or
aptitudes are not compatible with the rest of the team eliminated over time.
This study focuses on the team leader’s inward-facing time, which is defined as
the time allocated for interaction with team members. This time, which affects team
performance, can be divided further into general management time and domain
specific time. We hypothesize that the combination of managerial and domain
abilities will greatly improve team performance by giving support to the right
people and directing the team to reach the project goals. The model presented in this
study allows for testing this hypothesis and investigating the effect of team size on
project duration in the context of engineering firms such as SPP.
2 Background
The literature on teams is voluminous and diverse. It spans areas ranging from
theoretical work in management and organization sciences (Graicunas 1937; Marks
et al. 2001; Millhiser et al. 2011; Neilson and Wulf 2012), to experimental work in
social psychology (Stasser and Dietz-Uhler 2001; Kerr and Tindale 2004; Hastie and
Kameda 2005; Laughlin et al. 2006), to the applied and empirical investigations of the
value of teams in product and software development (Kim and Clark 1992; Kraut and
Streeter 1995; Sawyer 2004; Nembhard and Edmondson 2006; Wheelan 2009).
These studies consider team size and composition, team dynamics, characteristics
of successful teams, selection of team members, and roles and characteristics of
successful team leaders. Furthermore, this literature could also be classified as either
qualitative and empirical in nature (Klenke 2008), or mathematical and computa-
tional (Hazy 2007). We focus on a subset of this literature that specifically addresses
the leaders role in affecting the outcome of the team.
2.1 Theories of teams and team leaders
Many studies of the performance of a team and its manager/leader focus on the
importance of the span of control (SOC) (Neilson and Wulf 2012). As team size
increases, difficulties arise in agreeing on common objectives and carrying out any
decision making process (Curral et al. 2001; Wheelan 2009). The role of the team
leader is especially important for large teams; he uses various skills and methods to
set structure and direction, identify, communicate and administer goals, and define
the work atmosphere. Mintzberg (1973) defined the ten working roles of a manager,
which are divided into three groups: interpersonal, informational, and decisional. By
properly filling the interpersonal roles defined byMintzberg, the manager can have an
indirect ‘‘effect on team performance via team climate’’ (Pirola-Merlo et al. 2002).
His ‘‘people skills’’ encourage subordinates to collaborate with each other and
strengthen bonding inside the team (Norrgren and Schaller 1999; Quinn et al. 1998).
Teams that collaborate well are often capable of achieving more whether or not the
team leader contributed to the quality of the collaboration (Baiden and Price 2011),
but the existence of good teams with bad leaders does not detract from the value that a
manager with good people skills can bring to a team (Dionne et al. 2004).
Modeling the span of control of leaders with different skill sets
123

The Leader-Member Exchange (LMX) theory suggests that the quality of the
relationship between manager and subordinates, characterized by ‘‘trust, respect,
and obligation’’, results in several positive outcomes for the organization (Winkler
2009). Therefore, this mature relationship has a powerful impact on team
performance (Graen et al. 1982; Scandura and Graen 1984; Graen et al. 1986).
One important finding by Kacmar et al. (2003) is the link between the frequency of
communication (between manager and subordinate), LMX, and performance,
through factors such as team climate (Pirola-Merlo et al. 2002) and group
confidence (Pearce et al. 2002).
Beyond the interpersonal and informational roles, a manger’s decision making
also affects team performance by creating a task structure that, if well designed and
understood, can positively influence the performance of multidisciplinary teams
(Wilemon and Thamhain 1983). Task structure is the set of tasks in a specified
process and the procedures for coordinating them (Sarin and McDermott 2003). By
setting a task structure and making sure it is followed, the manager reduces
communication and conflict inside his team (Muczyk and Reimann 1987).
Recent empirical research by Sauer (2011) has shown that new leaders who are
perceived as having low status, be it due to age, education, or experience, perform
better in a directive leadership role (i.e. telling team members exactly what needs to
be done and how). Such leaders can successfully transition to a more collaborative
leadership style only after they have established their authority among team
members.
Teams are understood to possibly consist of managers who themselves lead
teams or division, and not just of individual contributors. The model developed in
Sect. 3 connects the different roles of the manager discussed above to the different
ways in which team size drives combinatorial growth in communication volume.
The focus is on a team of individual contributors who are specialized engineers
grouped into self-organizing technical clusters.
2.2 Mathematical models of teams and team leaders
Mathematical modeling and computer simulation are valuable tools in studying
organizational behaviors (Ilgen and Hulin 2000; Rouse and Boff 2005). The core
tradeoff in all these models is to strike a balance between the time spent on working
versus the time spent communicating with other team members (Goldberg et al.
2004). Often the objective function is to reduce project lead-time (or cost) by
choosing the optimal team size or composition, or even the optimal number of
interactions between team members.
Millhiser et al. (2011) argue that previous research on team member selection has
focused only on the abilities of individual team members rather than on the
relationships among members, but the focus is shifting to skills related to working
well together. Accordingly, they offer a simple model of a team. In their model,
team output is a function of both individual outputs and peer effects. Peer effects are
the contributions each individual makes to the output of fellow team members.
Without peer effects, a teams output is simply a sum of individual outputs. The
model provides insights to managers for harnessing interdependence when forming
W. F. Nasrallah et al.
123
teams, whether the managers are familiar or unfamiliar with how well their people
work together.
Similarly, Solow et al. (2002) applied the NK model (Kauffman 1993) to the
process of replacing members of a team. The NK model contains no concept of
leadership, but Solow and Leenawong (2003) developed an extension that includes
the role of a leader in achieving cooperation among team members. This resulted in
a collection of models that shows the impact of a co-operational leader on the teams
performance. These models include controllable parameters whose values reflect the
amount of interaction among team members as well as the skill and variance of the
leader in achieving cooperation. Computer simulations with these models show that
having a leader with no co-operational skill is the same as having no leader at all.
Also, average team performance increases as the skill level of the leader increases,
regardless of the amount of interaction among the members. In a subsequent work,
Solow et al. (2005) investigated the role of motivational leadership on team
performance. Their results showed that having a skillful leader can be more
important for team performance than controlling the amount of interdependence
among team members.
Jacobsen and House (2001) described six phases in the charismatic leadership
process: Identification, activity arousal, commitment, disenchantment, depersonal-
ization, alienation. Then they use a system dynamics modeling to analyze the
process of charismatic leadership in organizations. They were able to duplicate
longitudinal data collected for six leaders, each of whom was generally considered
to possess charisma.
Schreiber and Carley (2006) used data from field observations and dynamic
network analysis to study how the flow of information within teams impacted
performance. They found that multiple network hubs in the flow of information,
rather than a single one, that is, a single ’’leader’’, led to better performance when
complex functioning was required. Similarly, Batallas and Yassine (2006)
determined optimal composition for multi-disciplinary team using social network
analysis.
Computational approaches to organizational theory are often characterized by the
use of sophisticated simulation and optimization requiring the setting of large
numbers of parameters, and hence tend to be case specific. Additionally, these
models require significant restrictive assumptions to maintain computational
traceability, while others are too detailed and difficult to experimentally test and
verify, such as computational organizational theory models.
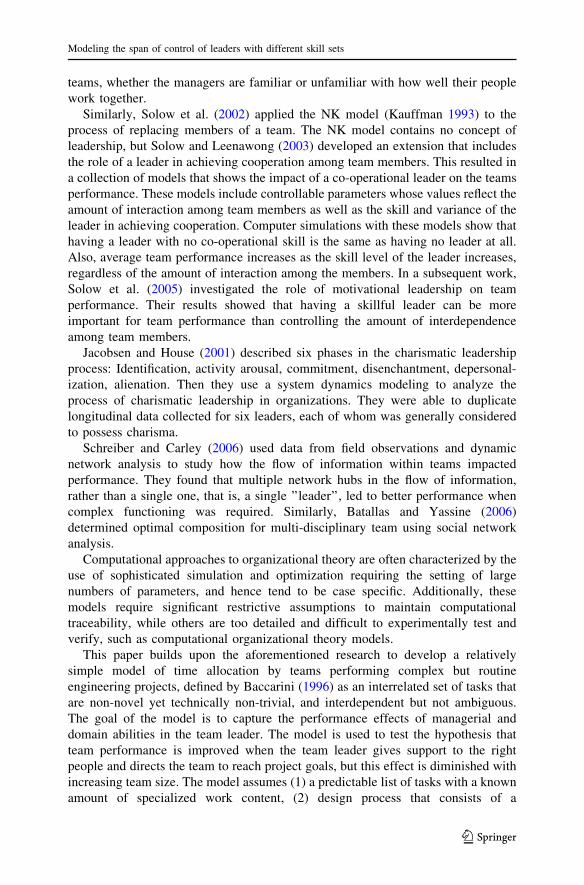
This paper builds upon the aforementioned research to develop a relatively
simple model of time allocation by teams performing complex but routine
engineering projects, defined by Baccarini (1996) as an interrelated set of tasks that
are non-novel yet technically non-trivial, and interdependent but not ambiguous.
The goal of the model is to capture the performance effects of managerial and
domain abilities in the team leader. The model is used to test the hypothesis that
team performance is improved when the team leader gives support to the right
people and directs the team to reach project goals, but this effect is diminished with
increasing team size. The model assumes (1) a predictable list of tasks with a known
amount of specialized work content, (2) design process that consists of a
Modeling the span of control of leaders with different skill sets
123
preliminary design and a detailed design phase (as in Fig. 1), and (3) prior
knowledge of the communication map between sub-teams in charge of these tasks
(as in Fig. 2).
3 Model
Consider an engineering design process which consists of two sequential stages: a
‘‘preliminary design’’ phase (duration P1 ) and a ‘‘detailed design’’ phase (duration
P2). The total time of the engineering process (TT) consists of the sum of the
durations of the two phases ðTT ¼ P1 þ P2Þ. The different contributors to each
phase are mutually interdependent. The proposed model takes as inputs the
managerial skills (M) and domain knowledge (D) of the team leader, as well as the
team size (N). Managerial skill (M) is measured as a percentage of the level of
competency of the most expert manager; i.e. the manager who can always pick
smallest representative subset of his team for the preliminary design stage. Domain
knowledge (D) is measured by the number of work areas in which the manager has
enough knowledge to be able to function in place of his team members, if necessary,
divided by the total number of work areas. The different parameters used in the
model are shown in Table 1. These include, in addition to the above, various
calibration parameters that are used to bring the model’s output in line with
observations, for example by modulating the presumably monotonic effect of a
higher M on the motivation of the team.
Table 1 Model parameters
Project parameters
V Volume of direct engineering work in preliminary design phase
W Volume of direct engineering work in the detail design phase
C Number of specialization clusters used to group tasks and people
DSM Matrix of communication relationships between clusters
Team parameters
N Number of engineers in the team
KW Vector of number of engineers in each of C clusters
Manager parameters
M Manager level of competency ð0�M� 1Þ;¼ Size of smallest representative subset
Size of preliminary design subset picked by manager
D Domain knowledge of the manager ð0�M� 1Þ; ¼ Areas known tomanagerAll areas in team
Calibration parameters (monotonically increasing functions)
f1ðMÞ Manager-to-subordinate communication multiplier
f2ðMÞ Manager-to-team communication multiplier
f3ðMÞ Subordinate-to-subordinate communication reduction factor
f4ðDÞ Inter-cluster communication reduction factor
W. F. Nasrallah et al.
123

3.1 Preliminary design phase
In the preliminary design phase, the team leader must choose the number of team
members (ND) who need to be involved. The leader’s domain knowledge allows him
to perform the work of certain specializations from his own time allocation, while
his managerial skills gives him the ability to recognize the best candidate for a
‘‘key’’ team member to represent each remaining specialization cluster.
Preliminary design is all about coordination, so any work not completely taking
place inside the head of a multi-skilled manager requires a meeting. Figure 3
describes the different kinds of possible meetings. Key members are essential to this
phase, but other team members who are not essential may also be present if the team
leader includes them due to his poor understanding of the team dynamics.
The team leader selects ND members to participate in this stage based on his
skills and his perceptions of the team’s structure and abilities. The team leader’s
managerial skills help choose the right member inside each cluster. The highest
level of skill leads to C members, one from each cluster, and the lowest level
leading to all N members participating in preliminary design.
We assume that the worst case scenario is to have all N members on the
preliminary design meetings. The degenerate case, when the manager chooses an
incomplete and inappropriate subset, will not reach the level of design quality
needed to move on until the official participants realize that they need to confer with
other team members. This scenario therefore devolves into about the same number
of communications needed as if all N members were participating.
If the team leader has domain skills in a specific specialization cluster, then this
eliminates the need for a separate representative from that cluster. This leads to
Eq. (1), which is a linear extrapolation from 0 for a manager who has enough
domain skills to complete the preliminary design on his own, to N for a manager
who has neither domain skills to contribute nor managerial skill to enable selection
of the smallest sufficient subset of the team to help with preliminary design.
ND ¼ ð1� DÞ MC þ ð1�MÞNð Þ ð1Þ
We calculate the expected total communication time T using the Graicunas (1937)
approach of enumerating possible subsets of the members present:
Fig. 3 Three types of communication in the preliminary design phase
Modeling the span of control of leaders with different skill sets
123

T ¼ ND þ ND
2
� �þ 2Cð1�DÞ � 1� Cð1� DÞ ð2Þ
Equation (2) represents the three communication stages shown in Fig. 3, where ND
is the number of possible interactions (meetings) between the team leader and each
team member, bND
2c is the number of pairs, and 2Cð1�DÞ � Cð1� DÞ � 1 is the
number of communications between the manager and all the different subsets of key
members. The term Cð1� DÞ is the number of key members, whose meetings
actually matter. Clearly the expression will be dominated by the polynomial term
for larger teams. The preliminary design phase ends when the key members have
participated in enough meetings to reach the required level of design quality.
P1 ¼ U þ T
U ¼ D� Vð3Þ
Finally, Eq. (3) gives the total time (P1) spent on the preliminary design, which is
the sum of team time (T) and the manager’s own work (U), obtained by multiplying
manager domain knowledge ratio (D) by the volume (V) of direct engineering work
in this phase. This linear relationship defines the scale of the variable M, so cali-
brating functions f1, f2 and f3 are used in the three other places where M enters into
an equation.
3.2 Detailed design phase
During the detailed design phase, the manager no longer carries out design work, so
the communications are divided into the following categories.
1. Dual communication (S), which is one-to-one meetings or other communica-
tions between the manager and one of his subordinates,
2. Multi-party communication (R) between the manager and a group of
subordinates, and
3. Communication among team members (Q).
Dual communication (S) is mostly initiated by the team leader to establish a high
Leader-Member Exchange (LMX) relationship with each of his subordinate. S
increases with managerial skill M: this can be viewed as a short-term expenditure of
additional time that leads to a long-term gain. The scaling function f1 is used to
isolate the effect of M on S from the definition of M ¼ CNfrom phase 1.
S ¼ Nf1ðMÞ ð4Þ
Multi-party communication with the manager (R) is a function of the number of
clusters in the team. We consider one person per meeting per cluster, and enumerate
the different sets of clusters, dividing by a monotonically increasing function of the
manager’s skills to account for increased motivation to finish meetings on time.
W. F. Nasrallah et al.
123

R ¼ 2C � 1
f2ðMÞ ð5Þ
Team member communication (Q) consists of two types of communication:
inter-cluster and intra-cluster communication. Both are reduced by higher M, but
inter-cluster communication is also reduced by higher D since the manager with
domain skills can do the coordination for those clusters he understands. Eq. (6)
gives the full expression for the value of Q.
Q ¼ 1
f3ðMÞXCa¼1
ð2Ka � Ka � CÞ þ 2Cð1�f4ðDÞÞ � C � 1
!ð6Þ
Figure 4 shows the different types of communication and work (W) encountered
during a typical second phase. Waiting/idle time is minimized by simply scheduling
meetings so that those that can happen in parallel do so. Nevertheless, it is possible
(Case 1) for the manager’s communication time with members is less than the
communication and work time of members without him, or conversely (Case 2) for
manager-mediated communication to require more time than inter-team
Fig. 4 Snapshot of simultaneous meetings in a typical project
Modeling the span of control of leaders with different skill sets
123

communication and work time. Equation (7) shows how the total duration of phase
2 is the maximum of the two cases.
P2 ¼ max Sþ R;Sþ CRþ QþW
N
� �ð7Þ
In addition to duration, the model also gives the total number of engineer-hours
(TC) required, by adding T from Phase 1 to the sum of S, Q and R from phase 2.
Similarly, the total number of manager-hours (T)M can be found as follows.
TC ¼ T þ Qþ Rþ S ð8Þ
TM ¼ U þ ðT � NDÞ þ Sþ R ð9Þ
4 Numerical results and discussion
This section illustrates the application of the proposed model to a real-world case
study. As mentioned earlier, SPP is a power generation firm which manufactures
products and provides engineering services related to the power sector. The team
studied includes fifteen engineers in the following different work areas (as shown in
Fig. 2): pre-sales (proposal), sales (business development), engineering, after-sales
(construction), and project management. Some of the clusters overlap, soP
Kn add
up to more than N. The complete set of input parameters used are shown in Table 2.
Table 2 Numerical parameters
for SPP caseProject parameters
V 12 work hours
W 1000 work hours
C 5
Team parameters
N 15
K1 3
K2 4
K3 4
K4 3
K5 3
Manager parameters
M 0.5
D 0.6
Calibration parameters
f1ðMÞ 7M
f2ðMÞ 5M
f3ðMÞ 3M
f4ðDÞ 23D
W. F. Nasrallah et al.
123

The project duration (TT) is computed as approximately 11 days and 1 h
(assuming 8 working hours per day). The preliminary study phase constitutes 17 %
of the total duration (15 h taking into account the quality of the study), while the
remaining time is for detailed design phase (74 h). The total communication effort
(TC) during the project is 101 engineer-hours. The team leader allocated (TM) 77 h
for his team during the project, which is equivalent to 86 % of the project time. The
following sections present a sensitivity analysis how project duration responds to
changes in team size in team leader domain knowledge and managerial skills. The
results are intended to demonstrate how this particular model with the specified
(linear) calibration functions produces changes consistent with what is expected in
this type of company.
4.1 Team size
Modifying team size N while maintaining the same output quality results in a trade-
off between calendar time and engineer-hours. As shown in Fig. 5, the decrease in
time with each additional member reaches an optimal point, beyond which having
extra members increases time slightly and raises costs significantly (the left axis is
in hours and the right is in dollars at the rate of 10 dollars per engineer-hour).
Depending on project priorities and objectives, team size can increase or decrease
between 5 (minimum needed members as number of different areas in the work is 5)
and 16 (optimal number of members for TT as shown in Fig. 5). That is, if the
company is not interested in minimizing the cost (as the total cost difference
between a team of 16 and a team of 5 is 21 %), and its only goal is to deliver the
project with the minimum time, then N is equal to 16 (optimal team size for time).
However, a company aiming to reduce its cost by 9 %, for example, at the expense
of time will reduce its team size to 11 (from initial size N = 16).
Figure 5 also shows a decreasing slope as the team size increases, where the total
time is decreasing at a smaller rate with each additional team member. For example,
(TT) decreased by 9.6 % when Team Member 9 was introduced while it decreased
25000250
23000
21000200
ojec
t
ojec
t
19000150
he p
ro
he P
ro
17000 t of t
h
e of
th
100
l Cos
t
Tim
e
1500050 To
tal
Tota
l
1300050
1100005 7 9 11 13 15 17 195 7
Team SizeTime Cost
Fig. 5 Total time (TT) and total cost of the project as a function of team size (N)
Modeling the span of control of leaders with different skill sets
123

by only 2.1 % with Team Member 16. This supports the argument of slow team
development with larger teams (Wheelan 2009). With each additional member, the
communication time increases exponentially up until the total time starts increasing.
The increase in project duration at the time where team size is large results in a
sharp increase of the cost shown in Fig. 5 (after N = 16). This means that the team
has a certain limit (in this case 16) where each extra member lowers the
performance.
4.2 Domain knowledge
Higher domain knowledge decreases duration as shown in Fig. 6. Total engineering
time (TT) and manager time (TM) are measured in working hours. Candidates with
higher domain knowledge are more valuable to the team, unless that higher domain
knowledge comes with a much higher salary requirement or lower number of hours
available for the project. Other roles of the manager which exclude his team are well
documented in the literature (Mintzberg 1973). These roles, such as figurehead or
liaison, limit the time allocated for the team.
4.3 Managerial skill
As shown in Fig. 7, managerial skills improve team performance up to a certain
level, after which performance starts to deteriorate. This means that a manager who
seeks to build close relationships with team members will, after a certain threshold,
cut into the performance of the current project. The manager’s time is even more
sensitive to managerial skills. When managerial skills are high, the manager spends
almost all of his time building relationships with his subordinates and reinforcing
team climate, leaving him with no time for other roles. The extent of this effect
60
70
80
90
100
110
120
130
0 1/5 2/5 3/5 4/5 1
Dura
�on
in w
ork
hour
s
Domain knowledge of the manager
TTTM
Fig. 6 Effects of team leader’s domain knowledge
W. F. Nasrallah et al.
123

depends on the team size and degree of clustering. In this specific case, the optimal
level of managerial skills required is 0.61 (see Fig. 7), which means hiring a
manager who establishes high LMX relationships with all of his team members will
lower the performance despite his other skills (communication, leadership, etc).
4.4 Two-way sensitivity
A two-way sensitivity analysis of domain and managerial abilities shows that the
optimal manager’s profile corresponds to having D ¼ 55and 0:4�M� 0:6. This
optimal managerial skills range was found to increase when domain knowledge
decreases. This is in line with literature (e.g., Nasrallah 2006) arguing that if the
manager is too democratic, the team’s performance can decrease, but it contradicts
the LMX theory: the link between LMX relationships and performance is not
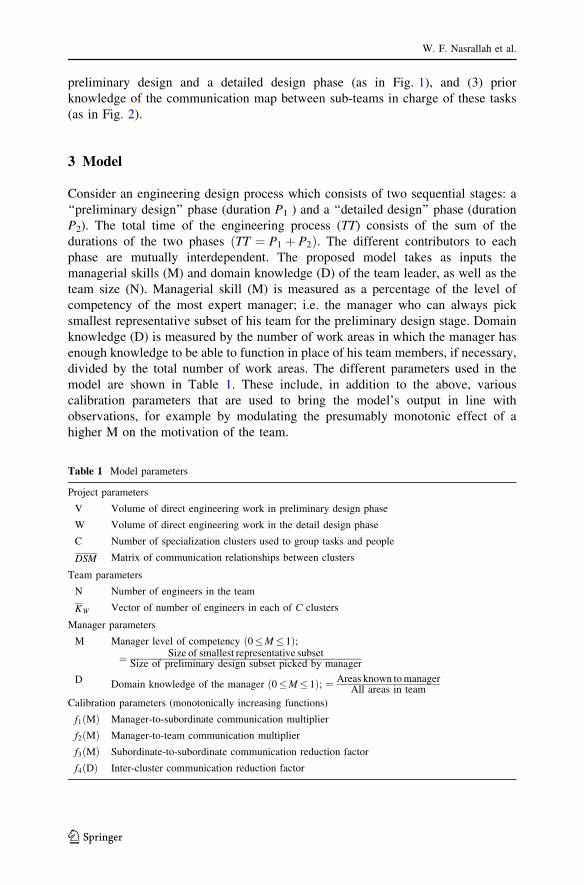
positive in all the cases. As shown in Fig. 8, the optimal managerial skill level
increases when domain knowledge decreases: when a candidate has lower domain
knowledge, his people skills must be higher to compensate for it. Finally, domain
knowledge has higher effect on duration than managerial skills. This follows from
observing how deviation from optimal D for a given M affects performance,
compared to the effect of deviation from optimal M for a given D:
– TT decreases by 28 % between D ¼ 0 and D ¼ 1 for M ¼ 0:1, while it
decreases by 21 % between M ¼ 0:1 and M ¼ 0:6 for D ¼ 0.
– TT decreases by 22 % between D ¼ 0 and D ¼ 1 forM ¼ 0:6 while it decreases
by 14 % between M ¼ 0:1 and M ¼ 0:6 for D ¼ 15.
This difference shows the higher impact of domain knowledge on team
performance compared to managerial skills.
0
20
40
60
80
100
120
140
0 0.2 0.4 0.6 0.8 1
Dura
�on
in w
ork
hour
s
Managerial skills
TT
TM
Fig. 7 Effects of team leader’s managerial skills
Modeling the span of control of leaders with different skill sets
123
Finally, we note that the decrease in TT between a low-skilled and an optimally-
skilled manager was higher in large teams (40 vs. 39 %) than in smaller ones (22 vs.
25 %). This follows from remarking that, as communication increases dramatically
with large teams, the role of the manager becomes more central to reducing all the
time-wasting cross-talk, whether it be by being better able to direct the communi-
cations due to better managerial skill or to being able to avoid the need for engineers
to coordinate by virtue of his understanding of the multiple domain issues.
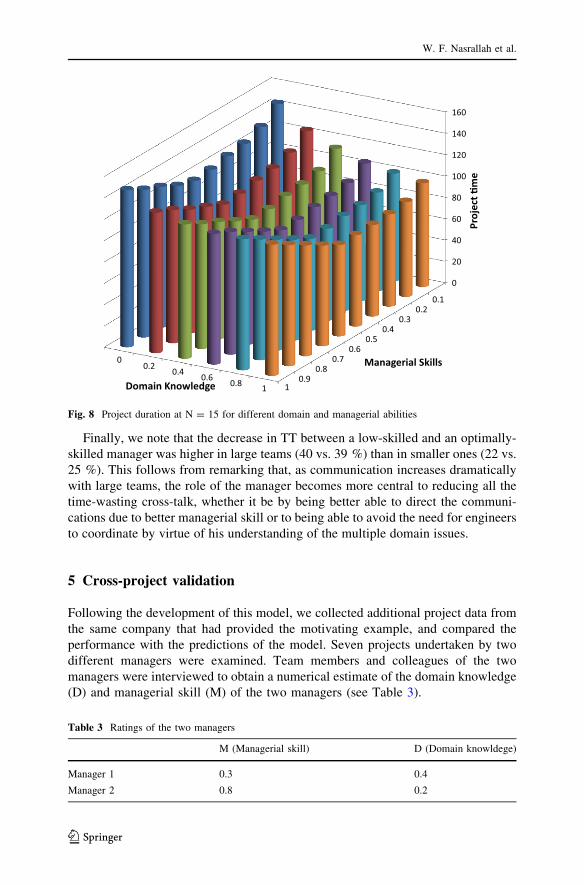
5 Cross-project validation
Following the development of this model, we collected additional project data from
the same company that had provided the motivating example, and compared the
performance with the predictions of the model. Seven projects undertaken by two
different managers were examined. Team members and colleagues of the two
managers were interviewed to obtain a numerical estimate of the domain knowledge
(D) and managerial skill (M) of the two managers (see Table 3).
00.2 0.4 0.6 0.8 1
0
20
40
60
80
100
120
140
160
0.10.2
0.30.4
0.50.6
0.70.8
0.91Domain Knowledge
Proj
ect �
me
Managerial Skills
Fig. 8 Project duration at N = 15 for different domain and managerial abilities
Table 3 Ratings of the two managers
M (Managerial skill) D (Domain knowldege)
Manager 1 0.3 0.4
Manager 2 0.8 0.2
W. F. Nasrallah et al.
123

The seven projects were characterized by the following parameters:
Volume of direct engineering work in preliminary design (V).
Volume of direct engineering work in the detail design phase (W).
V and W were obtained from the records of the SPP proposal department, which
prepares estimates prior to taking on a job.
Design structure matrix (DSM) Interviews with the team members were used to
determine the communication relationships between clusters, and these were
encoded into a matrix similar to the one in Fig. 2 (All seven had similar
communication relationships between clusters).
Number of specialization clusters (C) The number of distinct engineering job
disciplines used in each project was obtained from the project documents and
mapped one-to-one to communication clusters. (All seven projects had five
distinct clusters, with some overlaps).
Company cost records were used to obtain the actual time sheets of each team
member, and individual interviews were used to determine the phase where the time
was expended. Since time sheets provide the total engineer-hours of the project,
total actual duration was obtained by dividing total engineer-hour over number of
engineers. This was compared to what SPP estimators predicted before the work
started, and to the predictions of the model described in this paper (See Table 5).
Six of the seven projects were performed by a 10-person team, and Project 7 had
a 9-person team. For all seven, each team member belonged to one or more of the
communication clusters. The number of man-hours for various phases of the seven
projects are given in Table 4. Actual hours were obtained from cost records and
sorted into the two phases by interview. The SPP estimates came from company
files.
Table 4 Data for the seven projects from SPP
Project
number
Project
manager
Actual Ph.
1 h (�NdÞActual Ph.
2 h (�N)
Phi
estimate
(�NdÞ
Ph2
estimate
(�N)
Model
P1 output
Model
P2 output
1 PM#1 102 (34) 3849 (385) 108 (36) 3250 (325) 57 336
2 PM#1 109 (36) 1848 (185) 116 (39) 2083 (208) 61 219
3 PM#1 66 (22) 6244 (624) 71 (24) 4550 (455) 42 466
4 PM#1 58 (19) 2229 (223) 74 (25) 1925 (193) 44 203
5 PM#2 83 (28) 6824 (682) 133 (44) 5950 (595) 47 604
6 PM#2 68 (23) 2896 (290) 87 (29) 3125 (313) 38 322
7 PM#2 16 (8) 1352 (150) 26 (13) 1250 (139) 26 148
Modeling the span of control of leaders with different skill sets
123

Table 5 compares the model’s outputs to both SPP estimated time and actual time.
The model did a better job of approximating duration than the professional estimators
at SPP. In general, model predictions were within 15 % of the actual time except for
Projects 2 and 3, which were affected by factors outside the scope of the model.
Project 2 had a very low incidence of comments and revisions from the project owner,
leading to faster overall execution time. Project 3 had a higher communication
requirement due to the learning effect of a number of new hires in the company.
When the durations for all of the projects run by the same managers are summed
and the ratios of the sums from different managers are compared (Table 6), it can be
seen that the model output is closer to the actual value than the SPP estimate. This
can be read to indicate that the project managers relationship with the team
members, as modeled by this paper’s methodology, was a highly influential factor
affecting communication work. In particular, this factor overshadows factors such
as new team member assimilation and superior client relationship, which are not in
the model. This averaging also makes it more clear that SPP estimates for both
managers undershoot the actual times, reflecting an estimation process that does not
take account of communication slowdowns or project manager skills.
6 Conclusions, limitations and extensions
There has been progress in understanding organizational theory computationally in
recent years, but the busy complexity and one-off nature of those modeling efforts
makes one wonder whether simpler analytical models can help better guide
organizational thinking and design. This paper offers one such model.
This study examined the impact of team size, managerial skills, and domain
knowledge on team performance as measured by the time and effort needed to
complete conceptual and detailed design for a typical engineering project. The
model replicates the well-known fact that the benefits of each additional team
Table 5 Comparison of Model output with actual project data
Project number Project manager Estimate/actual (%) P1 ? P2/ actual (%)
1 PM#1 86 94
2 PM#1 112 127
3 PM#1 74 79
4 PM#1 90 102
5 PM#2 90 92
6 PM#2 109 115
7 PM#2 96 110
Table 6 Ratio of the actual,
estimated and model output
project durations by manager
Estimate/actual (%) Model/actual (%)
PMl 85.4 93.5
PM2 95.9 100.3
W. F. Nasrallah et al.
123

member to the group are less than the previous one. Team size can therefore be
selected according to the project priorities (e.g., time and cost) within the range
where marginal project time savings are higher then the cost of an additional
engineer. But even for the lowest-cost inputs, a limit exists where the performance
starts decreasing with each added member.
The team leader’s managerial skills do increase performance up to an optimal
point after which it starts to decrease. This implies that having close relationships
with team members must be limited, as it affects the performance beyond that
threshold. However, in small teams, the manager can have a closer relationship with
his members without affecting the performance. Therefore, high-percentile man-
agerial skills increase in value when team size decreases. In addition, a manager
needs to compensate for low domain knowledge with high people skills, so optimal
managerial skill level also increases with lower domain knowledge.
On the other hand, domain knowledge is positively related to performance.
Higher domain knowledge in the team leader is always better for the team’s
functioning regardless of size. This means that only the cost of having that more
domain-skilled team leader needs to be considered in selecting team leaders,
whether that cost is expressed as a higher salary requirement or in reduced level of
managerial skill.
Both abilities have a significant impact on manager’s allocated time for his
group. More influence is noticed for managerial skills which makes sense as more
time is consumed from the manager’s part. Finally, having a team leader with the
right skill set was found to be more beneficial to large teams. As team’s size
increases, relationships among its members tend to be more complex, so the
presence of a good leader is crucial in managing that complexity. The effects of
hiring more skilled managers on the cost of the project given a certain range of
managerial salaries presents a fascinating area of further study.
The model presented in this paper depends on some limiting assumptions which
might present further opportunities for future research. First, by incorporating
quality in the time dimension, we were not able to capture the true effect of
manager’s skills and team size on project quality. Future research may include
separate dimension for project quality. Another limitation of this research is that
team members competency is not part of the scope, which neglects the manager’s
ability to transfer his knowledge to members and therefore limits the effect of
domain knowledge. Future research can include each member competency in
different clusters and compare it to domain knowledge of the manager and their
influence on performance. Finally, the effects of using scaling functions fnðM;DÞthat are not linear also remains to be studied in future iterations of the model.
References
Ashley S (1997) Keys to chryslers comeback. ASME Mech Eng Mag 119(11):88–90
Baccarini D (1996) The concept of project complexity- a review. Int J Project Manag 14(4):201–204
Baiden BK, Price ADF (2011) The effect of integration on project delivery team effectiveness. Int J
Project Manag 29(2):129–136. doi:10.1016/j.ijproman.2010.01.016
Modeling the span of control of leaders with different skill sets
123

Bailey EE, Helfat CE (2003) External management succession, human capital, and firm performance: an
integrative analysis. Manag Decis Econ 24(4):47–369
Batallas DA, Yassine AA (2006) Information leaders in product development organizational networks:
social network analysis of the design structure matrix. Eng Manag IEEE Trans 53(4):570–582
Carindal LB, Sitikin SB, Long CP (2004) Balancing and rebalancing in the creation and evolution of
organizational control. Org Sci 15(4):411–431. doi:10.1287/orsc.1040.0084
Chang AST (2002) Reasons for cost and schedule increase for engineering design projects. J Manag Eng
18(1):29–36
Cheng MY, Tsai MH, Xiao ZW (2006) Construction management process reengineering: organizational
human resource planning for multiple projects. Autom Constr 15(6):785–799. doi:10.1016/j.autcon.
2005.10.014
Cooper R, Aouad G, Lee A, Wu S, Fleming A, Kagioglou M (2008) Process management in design and
construction. Wiley, Oxford
Curral LA, Forrester RH, Dawson JF, West MA (2001) It’s what you do and the way that you do It: team
task, team size, and innovation-related group processes. Eur J Work Org Psychol 10(2):187–204
Dionne SD, Yammarino FJ, Atwater LE, Spangler WD (2004) Transformational leadership and team
performance. J Org Change Manag 17(2):177–193
Eppinger SD, Browning TR (2012) Design structure matrix methods and applications. MIT Press,
Cambridge
Goldberg DE, Yassine A, Yu TL (2004) Calculating efficient team size: balancing deciding and doing as
an elementary optimization problem. In: Proceedings of the 2004 ASME design engineering
technical conference, Salt Lake City, UT
Graen GB, Liden RC, Hoel W (1982) Role of leadership in the employee withdrawal process. J Appl
Psychol 67(6):868–872
Graen GB, Scandura TA, Graen MR (1986) A field experimental test of the moderating effects of growth
need strength on productivity. J Appl Psychol 71(3):484–491
Graicunas VA (1937) Relationship in organization. In: Gulick L, Urwick L (eds) Papers on the science of
administration. Institute of Public Administration, New York, pp 183–187
Haddad C (1996) Operationalizing the concept of concurrent engineering: a case study from the US auto
industry. IEEE Trans Eng Manag 43(2):124–132
Hamel G (2011) First, let’s fire all the managers. Harv Bus Rev 89(12):48–60
Hastie R, Kameda T (2005) The robust beauty of majority rules in group decisions. Psychol Rev
112(2):494–508. doi:10.1037/0033-295X.112.2.494
Hazy JK (2007) Computer models of leadership: foundations for a new discipline or meaningless
diversion? Leadersh Q 18(4):391–410. doi:10.1016/j.leaqua.2007.04.007
Ilgen DR, Hulin CL (2000) Computational modeling of behavior in organizations: the third scientific
discipline. American Psychological Association, Washington
Jacobsen C, House RJ (2001) Dynamics of charismatic leadership: a process theory, simulation model,
and tests. Leadersh Q 12(1):75–112
Jones WL (1977) The construction manager at work - determining his roles, activities, and time allocation
by structured observation. Master’s thesis, Civil Engineering Department, Massachusetts Institute of
Technology
Kacmar KM, Witt LA, Zivnuska S, Gully SM (2003) The interactive effect of LeaderMember exchange
and communication the interactive effect of LeaderMember exchange and communication. J Appl
Psychol 88(4):764–772
Katzenbach JR, Smith DK (1992) The wisdom of teams: creating the high-performance organization.
Harvard University Press, Boston
Kauffman SA (1993) The origins of order: self-organization and selection in evolution. Oxford University
Press, New York
Kerr NL, Tindale RS (2004) Group performance and decision making. Annu Rev Psychol 55(1):623–655.
doi:10.1146/annurev.psych.55.090902.142009
Kim B, Clark SCW (1992) Organizing and leading ‘‘heavyweight’’ development teams. Calif Manag Rev
34:9–28
Klenke K (2008) Qualitative research in the study of leadership. Emerald Group Publishing, Bingley
Kraut RE, Streeter LA (1995) Coordination in software development. Commun ACM 38(3):69–81.
doi:10.1145/203330.203345
W. F. Nasrallah et al.
123

Laughlin PR, Hatch EC, Silver JS, Boh L (2006) Groups perform better than the best individuals on
letters-to-numbers problems: effects of group size. J Personal Soc Psychol 90(4):644–651. doi:10.
1037/0022-3514.90.4.644
Marks MA, Mathieu JE, Zaccaro SJ (2001) A temporally based framework and taxonomy of team
processes. Acad Manag Rev 26(3):356–376. doi:10.5465/AMR.2001.4845785
Marton B (1999) If it aint broke, fix it anyway: Communicating to create change at Ford. Harvard
Business Case, http://www.thecasecentre.org/educators/products/view?id=43432
Millhiser WP, Coen CA, Solow D (2011) Understanding the role of worker interdependence in team
selection. Org Sci 22(3):772–787. doi:10.1287/orsc.1100.0549
Mintzberg H (1973) The nature of managerial work. Prentice Hall, Englewood Cliffs
Muczyk JP, Reimann BC (1987) The case for directive leadership. Acad Manag Perspect 1(4):301–311
Nasrallah W (2006) When does management matter in a dog-eat-dog world: an interaction value analysis
model of organizational climate. Comput Math Org Theory 12(4):339–359
Neilson GL, Wulf J (2012) How many direct reports? Harv Bus Rev 90(4):112–119
Nembhard IM, Edmondson AC (2006) Making it safe: the effects of leader inclusiveness and professional
status on psychological safety and improvement efforts in health care teams. J Org Behav
27(7):941–966. doi:10.1002/job.413
Norrgren F, Schaller J (1999) Leadership style: its impact on cross-functional product development.
J Prod Innov Manag 16(4):377–384
Pearce CL, Gallagher CA, Ensley MD (2002) Confidence at the group level of analysis: a longitudinal
investigation of the relationship between potency and team effectiveness. J Occup Org Psychol
75(1):115–119
Pirola-Merlo A, Hartel C, Mann L, Hirst G (2002) How leaders influence the impact of affective events
on team climate and performance in R&D teams. Leadersh Q 13(5):561–581
Quinn JB, Anderson P, Finkelstein S (1998) The strategic management of intellectual capital., hap 7—
managing professional intellect: making the most of the bestButterworth-Heinemen, Oxford,
pp 87–100
Rouse WB, Boff KR (2005) Organizational simulation. Wiley-Interscience, Hoboken
Sarin S, McDermott C (2003) The effect of team leader characteristics on learning, knowledge
application, and performance of cross-functional new product development teams. Dec Sci
34(4):707–739
Sauer SJ (2011) Taking the reins: the effects of new leader status and leadership style on team
performance. J Appl Psychol 96(3):574–587
Sawyer S (2004) Software development teams. Commun ACM 47(12):95–99. doi:10.1145/1035134.
1035140
Scandura TA, Graen GB (1984) Moderating effects of initial leader-member exchange status on the
effects of a leadership intervention. J Appl Psychol 69(3):428–436
Scholtes PR (1998) The leader’s handbook: making things happen, getting things done. McGraw-Hill,
New York
Schreiber C, Carley KM (2006) Leadership style as an enabler of organizational complex functioning.
Emergence 8:67–76
Solow D, Leenawong C (2003) Mathematical models for studying the value of cooperational leadership
in team replacement. Comput Math Org Theory 9(1):61–81
Solow D, Vairaktarakis G, Piderit SK, Mc Tsai (2002) Managerial insights into the effects of interactions
on replacing members of a team. Manag Sci 48(8):1060–1073. doi:10.1287/mnsc.48.8.1060.164
Solow D, Piderit S, Burnetas A, Leenawong C (2005) Mathematical models for studying the value of
motivational leadership in teams. Comput Math Org Theory 11(1):5–36
Stasser G, Dietz-Uhler B (2001) Collective choice, judgment, and problem solving. In: Blackwell
handbook of social psychology: group processes, WIley, Chichester, pp 31–55
Wheelan SA (2009) Group size, group development and group productivity. Small Group Res
40(2):247–262
Wilemon D, Thamhain H (1983) Team building in project management. Project Manag Q 14(2):73–80
Winkler I (2009) Leader-member exchange theory., Contemporary leadership theoriesSpringer,
Philadelphia, pp 47–53
Modeling the span of control of leaders with different skill sets
123

Dr. Walid Nasrallah currently holds the rank of Associate Professor at the Engineering Management
Program at the American University of Beirut, whose faculty he joined in 2001. He earned his Master’s
degree at MIT in 1989, worked in the construction and software industries, then obtained his Engineer’s
Degree at Stanford University in 1996 and his Ph.D. in 2000 while working on business intelligence
applications at Oracle Corporation. His research interests include the development of new technologies
for managing information and the evolution of organizations in response to the adoption of these
technologies. At the time of publication (2015), he is in transition to a Data Scientist role at the World
Bank Treasury in Washington DC.
Charbel Ouba earned his Master of Engineering Management (MEM) from the American University of
Beirut in 2013 and currently works as a senior proposal engineer in Solution Power Partner (s.a.l.
Offshore). He prepares techno-commercial bids for power plants in the Middle East and Africa regions,
and assists in company’s quality plan and certification. Previously, he worked as a field/ project engineer
in Al-Husam GROUP LLC in Abu-Dhabi UAE, where he managed team of engineers and technicians in a
district cooling plant and installation of high voltage cable projects. Charbel is an active member in the
Lebanese order of Engineers. He holds a B.E. degree in Electrical Engineering from the Lebanese
American University (2008).
Ali A. Yassine is a Professor and Coordinator of the Engineering Management Program at the American
University of Beirut. Previously, he was an Assistant Prof. at the Department of Industrial & Systems
Engineering at the University of Illinois at Urbana-Champaign (UIUC). Prior to joining UIUC,
Professor Yassine was a research scientist at MIT Center for technology, Policy and Industrial
Development (CTPID) and a project manager at Chrysler International Corporation. Dr. Yassine received
the B.E. degree in Mechanical Engineering in 1988 from the American University of Beirut. He received
the M.S. and Ph.D. degrees in 1989 and 1994 in Industrial and Manufacturing Engineering from Wayne
State University in Detroit, Michigan.
Dr. Issam Srour joined the American University of Beirut (AUB)’s Engineering Management Program
as an assistant professor in fall 2008. His research focuses on the use of quantitative techniques and
sustainability principles to solve real-world construction problems including information management,
labor management, and material management. Before joining AUB, Dr. Srour served as an associate
project analyst with Independent Project Analysis, Inc. (IPA, Inc.), a US-based research and consulting
company, where he specialized in the evaluation of multi-billion dollar construction projects. Dr. Srour is
an active member of the American Society of Civil Engineers (ASCE) and the Lebanese Order of
Engineers. Dr. Srour earned a Ph.D. in Construction Engineering and Project Management (2005) and an
M.S. degree in Civil Engineering from the University of Texas at Austin (2001). He also holds a B.E.
degree in Civil and Environmental Engineering from the American University of Beirut (1999) where he
graduated with Distinction.
W. F. Nasrallah et al.
123