SWSI Update Carnegie Mellon University Katia Sycara Carnegie Mellon University softagents.
date post
21-Dec-2015Category
view
220download
0
Modeling the Relationship Between Sleep and Pediatric
Obesity
Andrew AlthouseCarnegie Mellon University, Department of Statistics
Southern Society of Clinical Investigation MeetingsAdolescent Medicine and Pediatrics
Friday, February 23, 2008

Speaker: Andrew Althouse
Andrew Althouse has documented that he has nothing to disclose.
DISCLOSURE STATEMENTDISCLOSURE STATEMENT
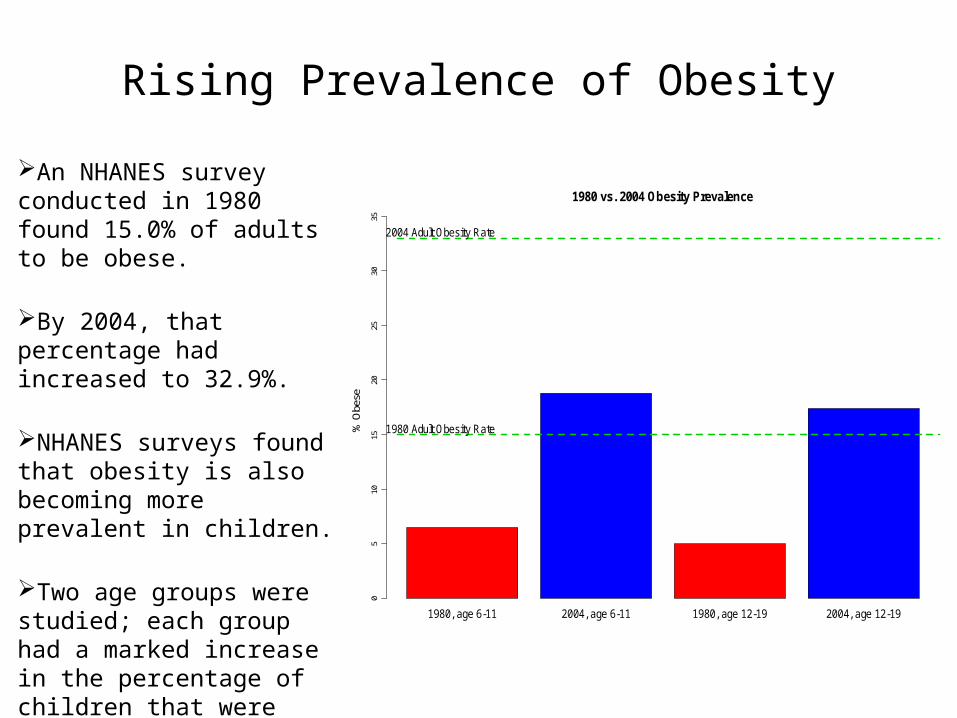
Rising Prevalence of Obesity
An NHANES survey conducted in 1980 found 15.0% of adults to be obese.
By 2004, that percentage had increased to 32.9%.
NHANES surveys found that obesity is also becoming more prevalent in children.
Two age groups were studied; each group had a marked increase in the percentage of children that were obese. 1980, age 6-11 2004, age 6-11 1980, age 12-19 2004, age 12-19
1980 vs. 2004 Obesity Prevalence
% O
bese
05
1015
2025
3035
1980 Adult Obesity Rate
2004 Adult Obesity Rate
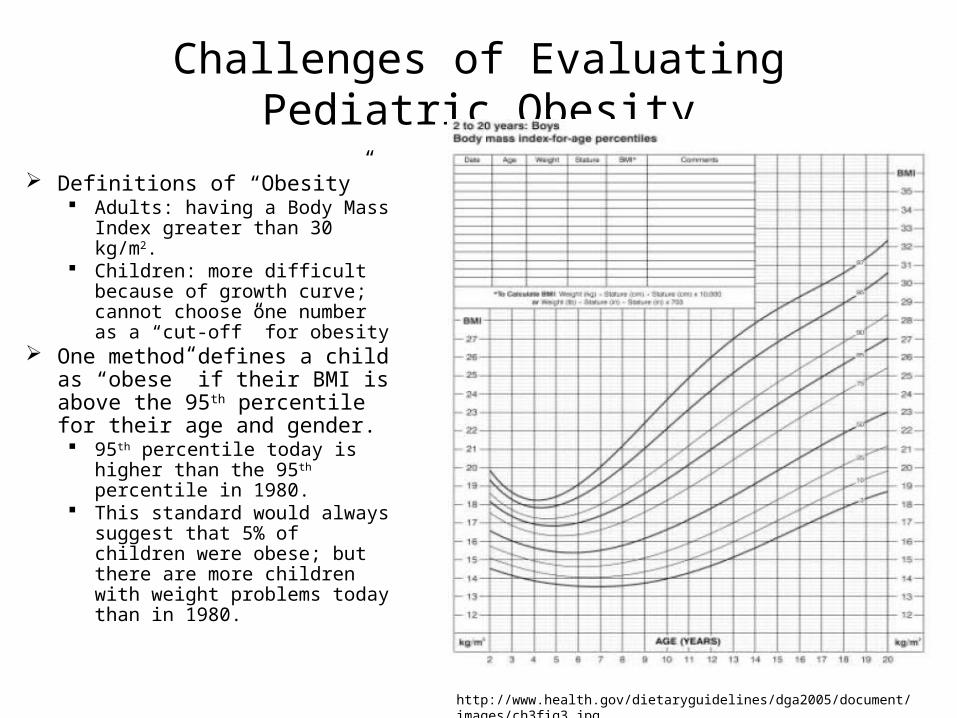
Challenges of Evaluating Pediatric Obesity
Definitions of “Obesity” Adults: having a Body Mass
Index greater than 30 kg/m2. Children: more difficult
because of growth curve; cannot choose one number as a “cut-off” for obesity
One method defines a child as “obese” if their BMI is above the 95th percentile for their age and gender. 95th percentile today is higher
than the 95th percentile in 1980.
This standard would always suggest that 5% of children were obese; but there are more children with weight problems today than in 1980.
http://www.health.gov/dietaryguidelines/dga2005/document/images/ch3fig3.jpg
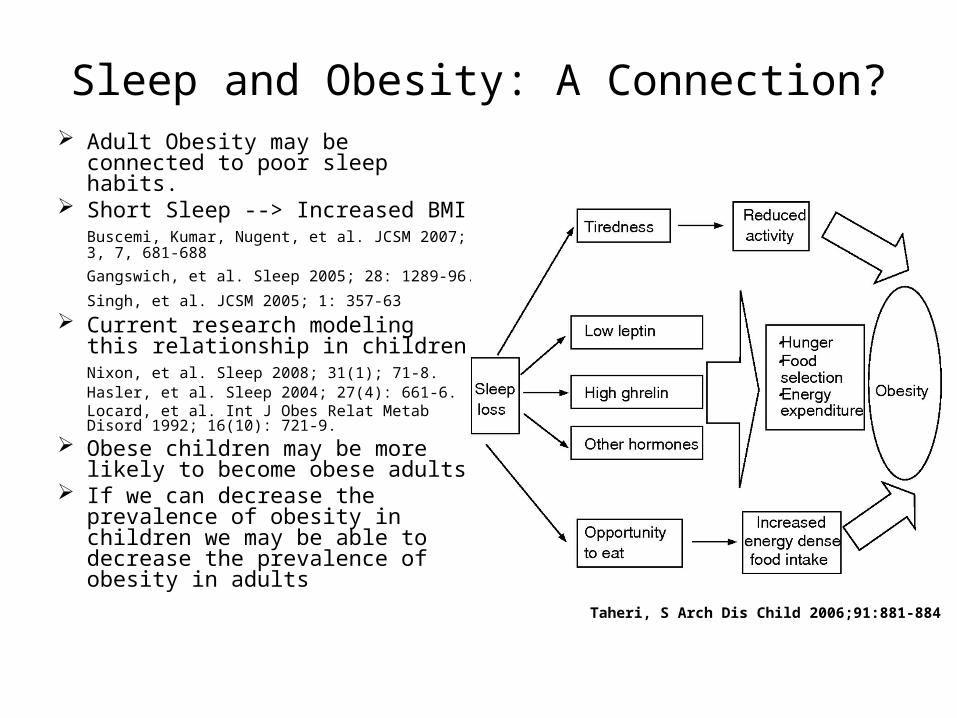
Sleep and Obesity: A Connection? Adult Obesity may be connected to
poor sleep habits. Short Sleep --> Increased BMI
Buscemi, Kumar, Nugent, et al. JCSM 2007; 3, 7, 681-688
Gangswich, et al. Sleep 2005; 28: 1289-96.
Singh, et al. JCSM 2005; 1: 357-63
Current research modeling this relationship in childrenNixon, et al. Sleep 2008; 31(1); 71-8.Hasler, et al. Sleep 2004; 27(4): 661-6.Locard, et al. Int J Obes Relat Metab Disord 1992; 16(10): 721-9.
Obese children may be more likely to become obese adults
If we can decrease the prevalence of obesity in children we may be able to decrease the prevalence of obesity in adults
Taheri, S Arch Dis Child 2006;91:881-884
Study Design
Convenience sample of 77 subjects Pediatrician referrals to a dietitian at Texas Tech University
Health Sciences Center (Lubbock, TX) Data collected from January 2006 until March 2007. Subjects completed standard sleep questionnaires
Pediatric Sleep Questionnaire 1: Sleep Habits Pediatric Sleep Questionnaire 2: Behavioral Problems Pediatric Daytime Sleepiness Scale Supplemental questions about daily habits with respect to:
• sleep routine• physical activity• use of electronic media
We chose to focus primarily on the variables related tosleep duration, quality of sleep, and consistency of sleep.
Distribution of Subjects' Age
Age (Years)
Fre
qu
en
cy
0 5 10 15 20
05
10
15
20
4 6 8 10 12 14 16
20
25
30
35
40
45
50
Scatterplot of Subjects' BMI vs. Age
Age (Years)
BM
I
Female Male
2025
3035
4045
50
Boxplot of BMI, Split by Gender
Gender
BM
I
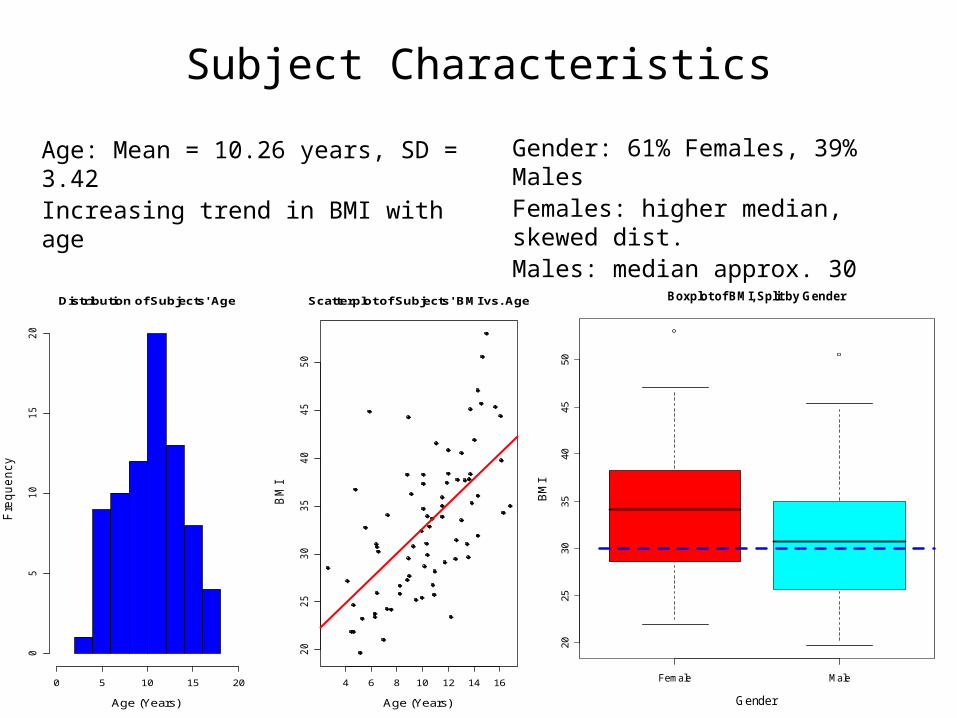
Subject Characteristics
Age: Mean = 10.26 years, SD = 3.42Increasing trend in BMI with age
Gender: 61% Females, 39% MalesFemales: higher median, skewed dist.Males: median approx. 30
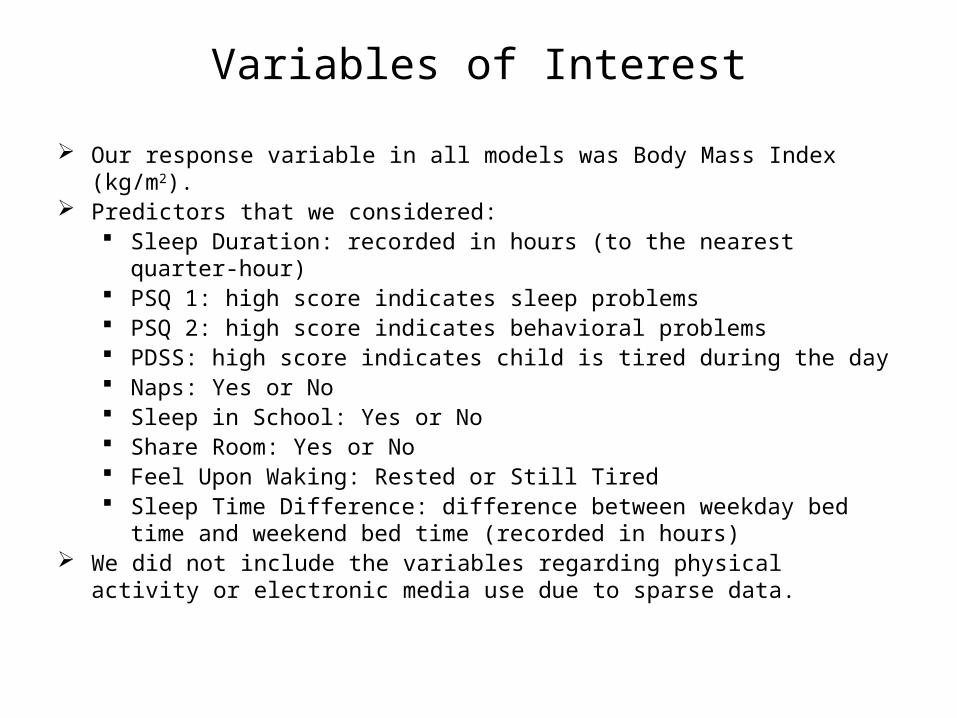
Variables of Interest
Our response variable in all models was Body Mass Index (kg/m2). Predictors that we considered:
Sleep Duration: recorded in hours (to the nearest quarter-hour) PSQ 1: high score indicates sleep problems PSQ 2: high score indicates behavioral problems PDSS: high score indicates child is tired during the day Naps: Yes or No Sleep in School: Yes or No Share Room: Yes or No Feel Upon Waking: Rested or Still Tired Sleep Time Difference: difference between weekday bed time and
weekend bed time (recorded in hours) We did not include the variables regarding physical activity or electronic
media use due to sparse data.
Histogram of Sleep Duration
Sleep Duration (Hours)
Fre
qu
en
cy
6 7 8 9 10 11 12 13
05
10
15
20
6 7 8 9 10 11 12
46
810
12
14
16
Scatterplot of Age vs. Sleep Duration
Sleep Duration (Hours)
Ag
e
6 7 8 9 10 11 12
20
25
30
35
40
45
50
Scatterplot of BMI vs. Sleep Duration
Sleep Duration (Hours)
BM
I
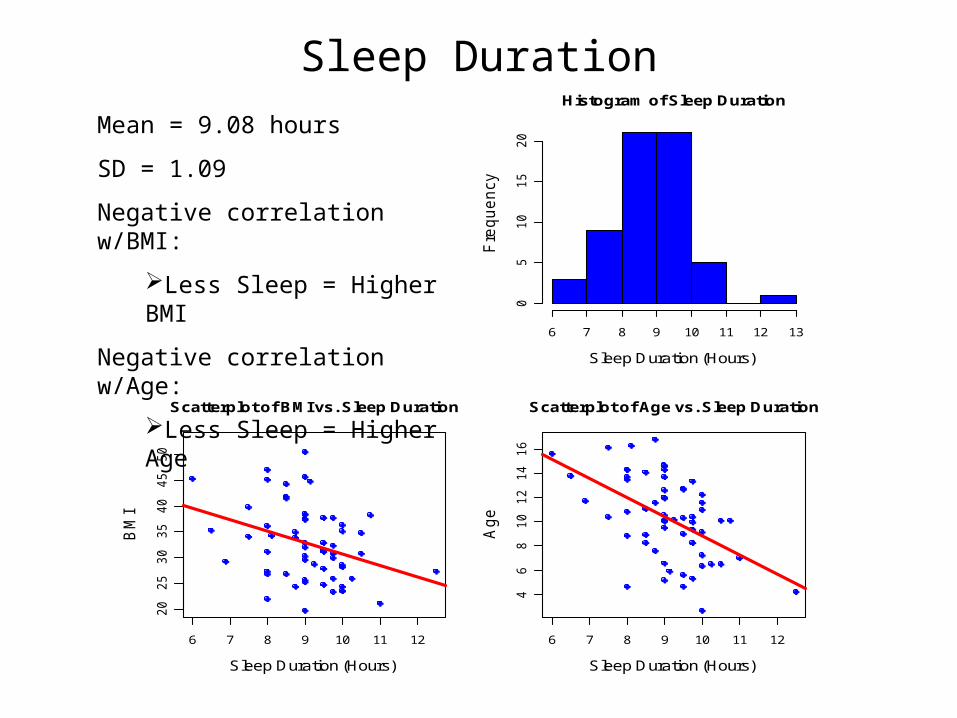
Sleep Duration
Mean = 9.08 hours
SD = 1.09
Negative correlation w/BMI:
Less Sleep = Higher BMI
Negative correlation w/Age:
Less Sleep = Higher Age
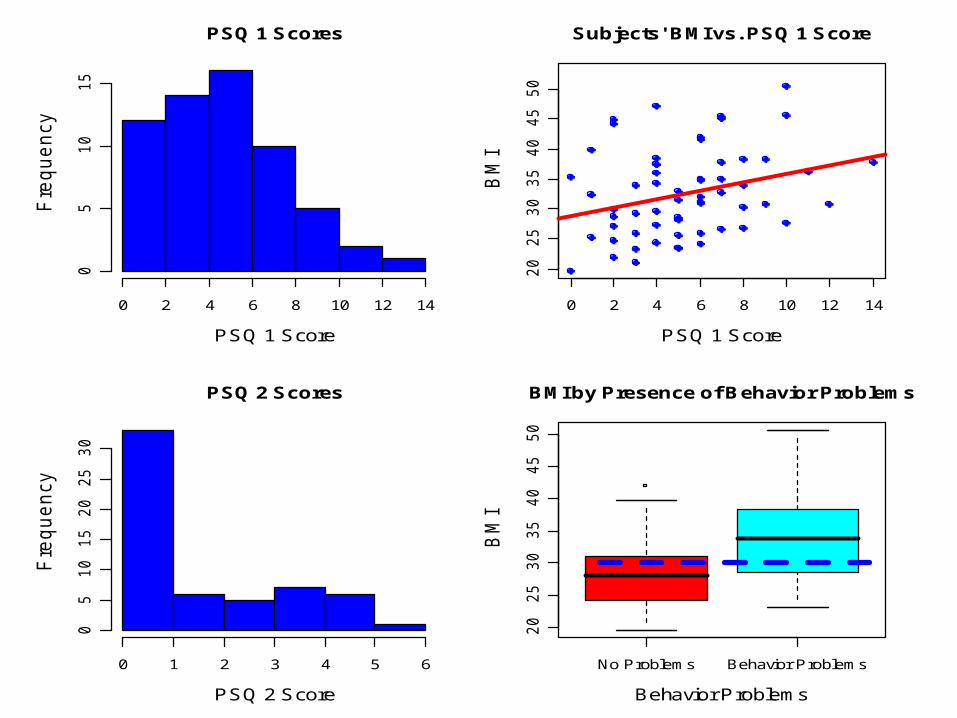
PSQ 1 Scores
PSQ 1 Score
Fre
qu
en
cy
0 2 4 6 8 10 12 14
05
10
15
0 2 4 6 8 10 12 14
20
25
30
35
40
45
50
Subjects' BMI vs. PSQ 1 Score
PSQ 1 Score
BM
I
PSQ 2 Scores
PSQ 2 Score
Fre
qu
en
cy
0 1 2 3 4 5 6
05
10
15
20
25
30
No Problems Behavior Problems
20
25
30
35
40
45
50
BMI by Presence of Behavior Problems
Behavior Problems
BM
I
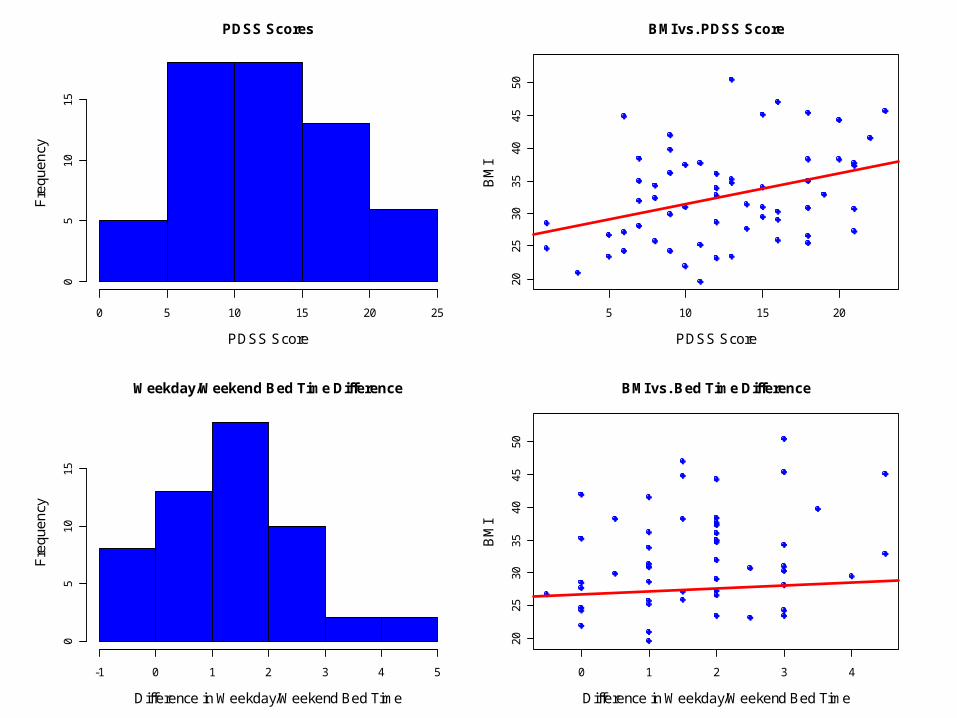
PDSS Scores
PDSS Score
Fre
quen
cy
0 5 10 15 20 25
05
1015
5 10 15 20
2025
3035
4045
50
BMI vs. PDSS Score
PDSS Score
BM
I
Weekday/Weekend Bed Time Difference
Difference in Weekday/Weekend Bed Time
Fre
quen
cy
-1 0 1 2 3 4 5
05
1015
0 1 2 3 4
2025
3035
4045
50
BMI vs. Bed Time Difference
Difference in Weekday/Weekend Bed Time
BM
I
No Naps Naps
20
25
30
35
40
45
50
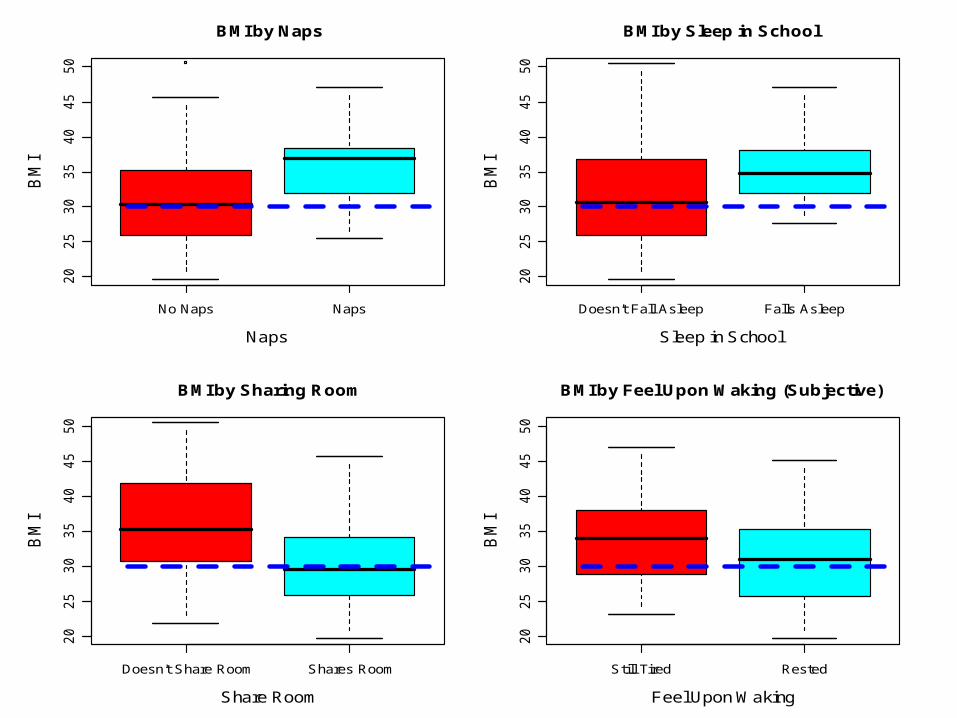
BMI by Naps
Naps
BM
I
Doesn't Fall Asleep Falls Asleep
20
25
30
35
40
45
50
BMI by Sleep in School
Sleep in School
BM
I
Doesn't Share Room Shares Room
20
25
30
35
40
45
50
BMI by Sharing Room
Share Room
BM
I
Still Tired Rested
20
25
30
35
40
45
50
BMI by Feel Upon Waking (Subjective)
Feel Upon Waking
BM
I
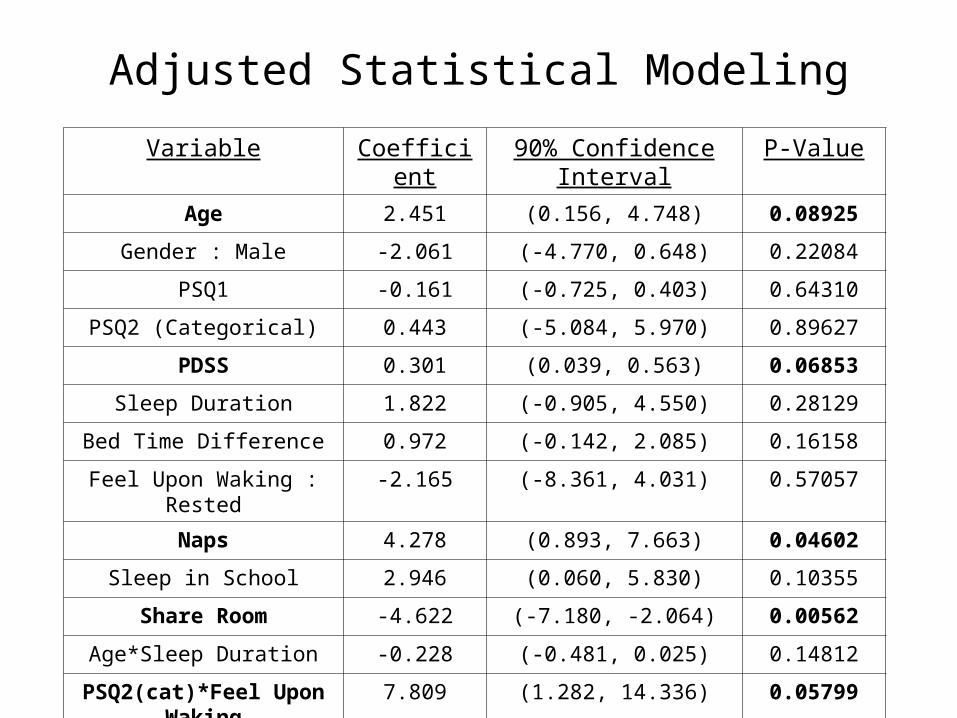
Adjusted Statistical Modeling
Variable Coefficient 90% Confidence Interval P-Value
Age 2.451 (0.156, 4.748) 0.08925
Gender : Male -2.061 (-4.770, 0.648) 0.22084
PSQ1 -0.161 (-0.725, 0.403) 0.64310
PSQ2 (Categorical) 0.443 (-5.084, 5.970) 0.89627
PDSS 0.301 (0.039, 0.563) 0.06853
Sleep Duration 1.822 (-0.905, 4.550) 0.28129
Bed Time Difference 0.972 (-0.142, 2.085) 0.16158
Feel Upon Waking : Rested -2.165 (-8.361, 4.031) 0.57057
Naps 4.278 (0.893, 7.663) 0.04602
Sleep in School 2.946 (0.060, 5.830) 0.10355
Share Room -4.622 (-7.180, -2.064) 0.00562
Age*Sleep Duration -0.228 (-0.481, 0.025) 0.14812
PSQ2(cat)*Feel Upon Waking 7.809 (1.282, 14.336) 0.05799
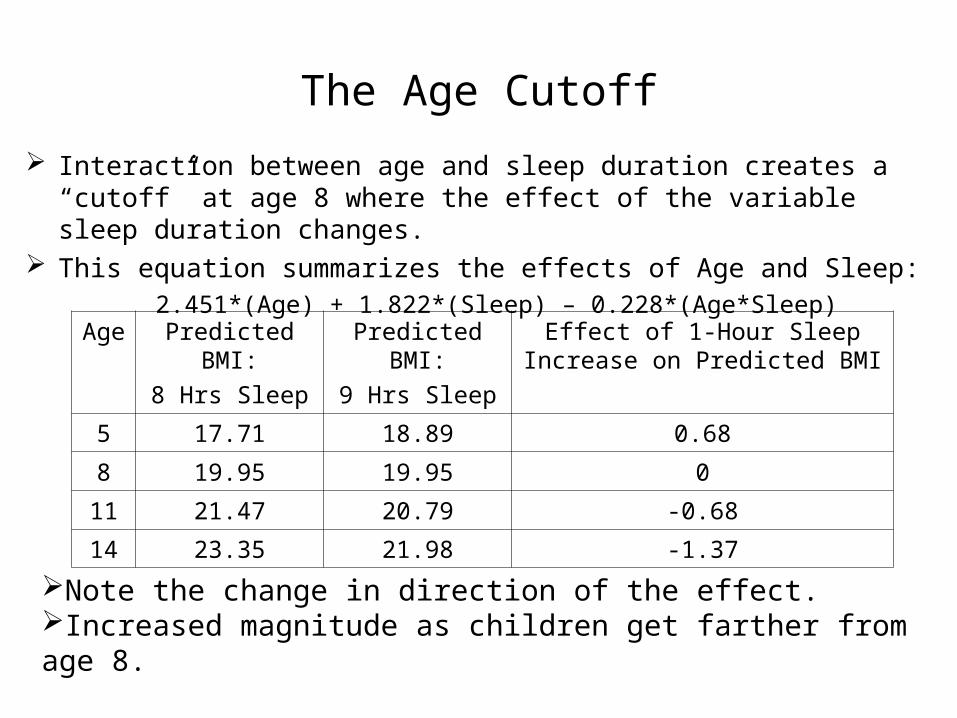
The Age Cutoff
Interaction between age and sleep duration creates a “cutoff” at age 8 where the effect of the variable sleep duration changes.
This equation summarizes the effects of Age and Sleep:2.451*(Age) + 1.822*(Sleep) – 0.228*(Age*Sleep)
Age Predicted BMI:
8 Hrs Sleep
Predicted BMI:
9 Hrs Sleep
Effect of 1-Hour Sleep Increase on Predicted BMI
5 17.71 18.89 0.68
8 19.95 19.95 0
11 21.47 20.79 -0.68
14 23.35 21.98 -1.37
Note the change in direction of the effect.Increased magnitude as children get farther from age 8.
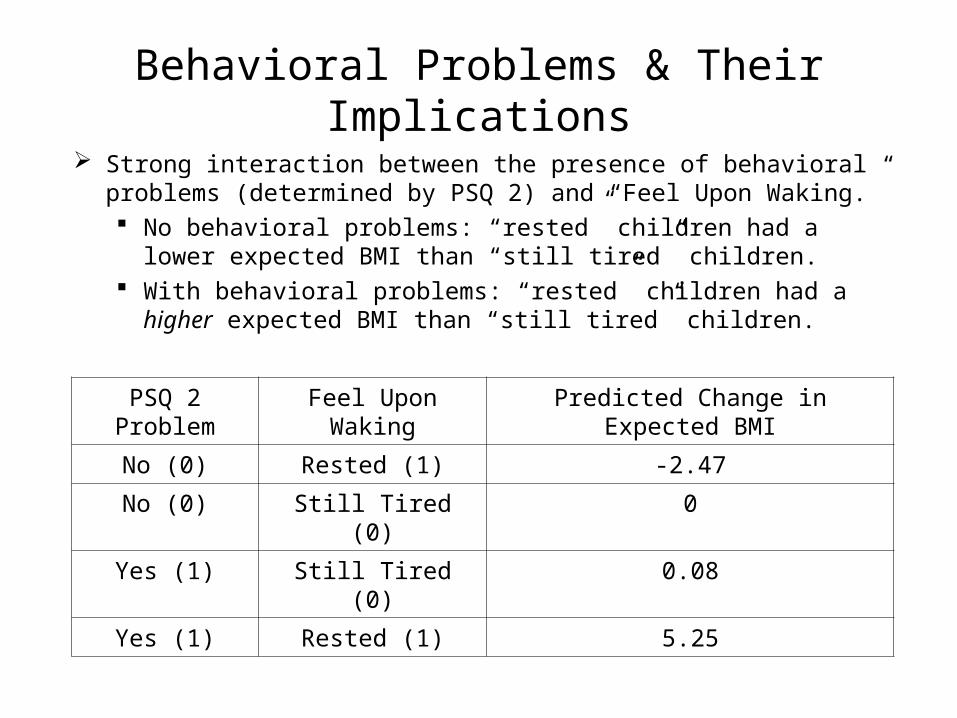
Behavioral Problems & Their Implications
Strong interaction between the presence of behavioral problems (determined by PSQ 2) and “Feel Upon Waking.” No behavioral problems: “rested” children had a lower
expected BMI than “still tired” children. With behavioral problems: “rested” children had a higher
expected BMI than “still tired” children.
PSQ 2 Problem Feel Upon Waking Predicted Change in Expected BMI
No (0) Rested (1) -2.47
No (0) Still Tired (0) 0
Yes (1) Still Tired (0) 0.08
Yes (1) Rested (1) 5.25
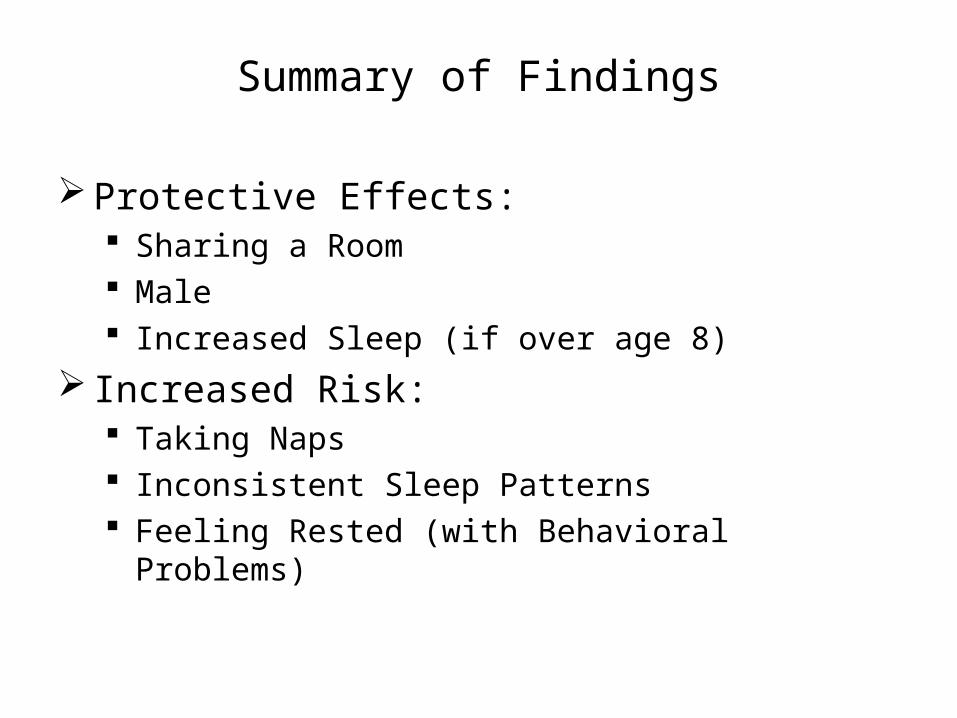
Summary of Findings
Protective Effects: Sharing a Room Male Increased Sleep (if over age 8)
Increased Risk: Taking Naps Inconsistent Sleep Patterns Feeling Rested (with Behavioral Problems)
Future Work
Current study limitations Sparse data: physical activity and electronic media use Difficulty understanding supplemental questions
Ongoing: Redesign of questionnaires; pre-testing Analysis of parent-child reliability issues
Manuscript in progress Designing longitudinal study with sleep-
intervention arm

Acknowledgements
NSF VIGRE (grant #: DMS-0240019) Dr. Rebecca Nugent, Carnegie Mellon University, Statistics Dr. Kenneth Nugent, TTUHSC Internal Medicine Dr. Rishi Raj, TTUHSC Internal Medicine Dr. Rita Corona, TTUHSC Internal Medicine Dr. Yasir Yaqub, TTUHSC Internal Medicine Dr. WM Hall, TTUHSC Pediatrics