Modeling the phase behaviour of bitumen/n-alkane systems ...
45
General rights Copyright and moral rights for the publications made accessible in the public portal are retained by the authors and/or other copyright owners and it is a condition of accessing publications that users recognise and abide by the legal requirements associated with these rights. Users may download and print one copy of any publication from the public portal for the purpose of private study or research. You may not further distribute the material or use it for any profit-making activity or commercial gain You may freely distribute the URL identifying the publication in the public portal If you believe that this document breaches copyright please contact us providing details, and we will remove access to the work immediately and investigate your claim. Downloaded from orbit.dtu.dk on: Feb 19, 2022 Modeling the phase behaviour of bitumen/n-alkane systems with the cubic plus association (CPA) equation of state Zhang, Yechun; Arya, Alay; Kontogeorgis, Georgios; Yarranton, Harvey Published in: Fluid Phase Equilibria Link to article, DOI: 10.1016/j.fluid.2019.01.004 Publication date: 2019 Document Version Peer reviewed version Link back to DTU Orbit Citation (APA): Zhang, Y., Arya, A., Kontogeorgis, G., & Yarranton, H. (2019). Modeling the phase behaviour of bitumen/n- alkane systems with the cubic plus association (CPA) equation of state. Fluid Phase Equilibria, 486, 119-138. https://doi.org/10.1016/j.fluid.2019.01.004
Transcript of Modeling the phase behaviour of bitumen/n-alkane systems ...
General rights Copyright and moral rights for the publications made accessible in the public portal are retained by the authors and/or other copyright owners and it is a condition of accessing publications that users recognise and abide by the legal requirements associated with these rights.
Users may download and print one copy of any publication from the public portal for the purpose of private study or research.
You may not further distribute the material or use it for any profit-making activity or commercial gain
You may freely distribute the URL identifying the publication in the public portal If you believe that this document breaches copyright please contact us providing details, and we will remove access to the work immediately and investigate your claim.
Downloaded from orbit.dtu.dk on: Feb 19, 2022
Modeling the phase behaviour of bitumen/n-alkane systems with the cubic plusassociation (CPA) equation of state
Zhang, Yechun; Arya, Alay; Kontogeorgis, Georgios; Yarranton, Harvey
Published in:Fluid Phase Equilibria
Link to article, DOI:10.1016/j.fluid.2019.01.004
Publication date:2019
Document VersionPeer reviewed version
Link back to DTU Orbit
Citation (APA):Zhang, Y., Arya, A., Kontogeorgis, G., & Yarranton, H. (2019). Modeling the phase behaviour of bitumen/n-alkane systems with the cubic plus association (CPA) equation of state. Fluid Phase Equilibria, 486, 119-138.https://doi.org/10.1016/j.fluid.2019.01.004

1
Modeling the Phase Behaviour of Bitumen/n-Alkane Systems with the Cubic Plus Association (CPA) Equation of State
Yechun Zhang1, Alay Arya2, Georgios Kontogeorgis2, Harvey Yarranton1*
1. Department of Chemical and Petroleum Engineering, University of Calgary, Canada
2. Center for Energy Resources Engineering, Technical University of Denmark, Denmark * corresponding author: [email protected]
Abstract
The cubic-plus-association equation of state was applied to model the phase behaviour of bitumen/n-alkane systems including saturation pressures, liquid-liquid boundaries, yields, and phase compositions. Yield is defined here as the mass of bitumen in the heavy phase divided by the mass of bitumen in the feed. To implement the model, the bitumen was divided into a set of pseudo-components based on a distillation assay and either the n-pentane insoluble content of the oil (CPA-C5 approach) or the propane insoluble content (CPA-C3 approach). The pseudo-components in the solvent insoluble part of the oil were defined as self-associating components, all other pseudo-components were non-associating. The critical properties and acentric factor for each pseudo-component were determined from established correlations. A set of CPA parameters was then developed to fit the available phase behavior data. The self-associating pseudo-components were assigned a distribution of self-association energies in order to capture the sequential partitioning of asphaltenes to the heavy phase upon solvent addition or in different solvents. Both approaches matched the phase behavior data for mixtures of bitumen with n-pentane and higher carbon number n-alkanes almost to within the experimental error. The CPA-C3 approach also matched the phase behavior data for mixtures of propane and bitumen. The CPA-C5 approach could not match the yield data for propane diluted bitumen but was more straightforward to implement and was less computationally intensive because it employed fewer self-associating components. To apply either approach to another oil, only the self-association energy of the self-associating pseudo-components need be adjusted. The cross-association energy between the solvent and the self-associating pseudo-components must be tuned for any new solvent. Keywords: phase behavior, bitumen, n-alkane, cubic plus association equation of state, phase boundaries, asphaltene yield, phase compositions

2
1. Introduction
Phase behavior models for mixtures of bitumens (or heavy oils) and n-alkanes are required for the
simulation of solvent-assisted in situ heavy oil recovery processes, solvent based oil sand
extraction processes, and solvent deasphalting processes [1, 2]. These mixtures can form multiple
phases including vapor-liquid (VL), liquid-liquid (LL), VLL, and possibly VLLL regions [3-6].
Depending on the solvent and the conditions, the second liquid phase can be a light solvent-rich
phase or a heavy asphaltene-rich phase. Asphaltene-rich phase formation, often termed
precipitation, and subsequent deposition is also a flow assurance issue for some conventional oil
applications including undersaturated live oil depressurization and carbon dioxide flooding [7-10].
It has proven challenging to model the full range of crude oil/solvent phase behavior, particularly
asphaltene-rich phase formation, with a single model and a consistent fluid characterization.
Asphaltenes are defined as the fraction of a crude oil that is insoluble in a paraffinic solvent
(usually n-pentane or n-heptane) and soluble in an aromatic solvent (usually toluene). They are the
heaviest and most aromatic fraction of a crude oil with the highest density, molecular weight and
heteroatom content [11-13]. Asphaltenes are known to self-associate into nano-aggregates
consisting of 5 to 10 molecules on average [14-16]. The changes in this self-association at different
temperature, pressures, and compositions and the effect of self-association on crude oil phase
behavior are currently ill-defined. Most crude oil phase behavior modeling approaches do not
explicitly consider asphaltene self-association.
To facilitate the discussion of the modeling approaches, the following terms are defined:
• “onset”: the condition (temperature, pressure, and composition) at which asphaltene
precipitation first occurs. In this study, the onset is usually defined in terms of the
precipitate content.
• “yield”: the amount of asphaltene precipitation (mass of precipitate divided by mass of oil).
To date, the two most successful approaches for modeling asphaltene precipitation are regular
solution models and equations of state (EoS). Regular solution models are particularly useful in
matching the onset and yield of precipitated asphaltenes from oils diluted with different solvents
or in blends [17-20]. However, these models are limited to liquid-liquid or liquid-solid equilibria.

3
Equations of state, on the other hand, can describe both vapor-liquid and liquid-liquid equilibria.
They have been widely applied in the petroleum industry and are the cornerstone of modern
chemical process simulators [21, 22].
Cubic equations of state (CEoS) are particularly popular due to their simplicity and relatively good
accuracy in predicting vapour-liquid equilibrium and liquid-liquid equilibrium for small, non-polar,
non-associating molecules, such as light hydrocarbons. CEoS can match the phase boundaries
(L/LL and L/VL) for heavy oil mixed with paraffinic solvents and dissolved gases such as carbon
dioxide [4,7]. However, they are unable to match the yield or composition of asphaltene-rich
phases without the use of composition dependent binary interaction parameters [2,33]. CEoS
cannot account for self-association and this lack may limit their ability to model asphaltene related
phase behaviour.
Two equations of state (EoS) that account for molecular self-association are statistical association
fluid theory (SAFT) [23] and cubic plus association (CPA) [24]. A modified version of SAFT was
used to model the onset of asphaltene precipitation from a crude oil after CO2 and CH4 injection
[8,9] and the yield of precipitated asphaltenes as a function of the gas-to-oil ratio [25]. The
Perturbed Chain form of the SAFT (PC-SAFT) was used to match the yield of asphaltene
precipitation from n-alkane diluted bitumens [10]. The self-association term within the SAFT
model was not required or used in these studies. Similarly, CPA was used to model the onset of
asphaltene precipitation during the depressurization of live oils with and without gas injection [26-
30], and the onset and yield for n-alkane diluted bitumens [31]. The asphaltene self-association
term of the CPA was used in these studies and was tuned to match onset and yields. While both
SAFT and CPA have shown promising results, this study focuses on the CPA approach because it
could be constructed started from a previously developed oil characterization for a cubic equation
of state [22, 39].
Although the CPA-EoS has been used to match asphaltene yield for different n-alkane diluted
bitumen, the following issues with the oil characterization and modeling have yet to be addressed:
• The self-associating components are arbitrarily defined as the pentane insoluble fraction of
the oil, “C5-asphaltenes”. This approach works well when the maximum yield is less than

4
or equal to the C5-asphaltene content; for example when the bitumen is diluted with n-
pentane or a higher carbon number n-alkane. However, the current approach is not
equipped to match yield data when other components also precipitate; for example, when
bitumen is diluted with propane or butane [3,33].
• Experimental data has shown that the heaviest, highest molecular weight asphaltenes
precipitate first; that is, the material that precipitates at low n-alkane content consists
predominantly of these heavier, more self-associated asphaltenes. The lighter asphaltenes
only precipitate at higher n-alkane content [32]. The current approach predicts that all of
the asphaltene fractions partition equally between the phases at all yields. This error could
lead to incorrect phase behavior and property predictions for oil fractions; for example, for
partially deasphalted oils.
• The ability of the model to predict phase compositions has not been tested.
• The CPA-EoS has been applied to SARA or GC based oil characterizations but not yet to
distillation assay based characterizations. Distillation based characterizations are
commonly used for refinery and other oil processing applications.
The objective of this study was to develop a methodology to model the phase behavior of diluted
bitumens with the Cubic Plus Association equation of state and to evaluate the strengths and
weakeness of this modeling approach. The methodology was developed by fitting the model to
propane and n-pentane diluted bitumen phase boundaries, asphaltene precipitation data, and phase
composition data from the literature at temperatures and pressures up to 150°C and 10 MPa,
respectively [2,33]. The bitumen characterization was based on a distillation assay rather than a
SARA or GC assay because boiling points are more representative of the molecular interactions
that define the phase behaviour of the system [22]. The asphaltene fraction was characterized such
that its highest boiling point cuts were less soluble than its lower boiling point cuts. Two different
characterization approaches were proposed, CPA-C5 and CPA-C3, where “C5” and “C3” denote
the material insoluble in n-pentane and propane, respectively; that is, asphaltenes. The CPA-C5
approach is similar to previous characterizations [28]. The CPA-C3 approach was proposed
because the CPA-C5 approach was unable to fit asphaltene yield data from propane diluted
bitumen. Both models were further tested on asphaltene precipitation data from the literature [34]
for other bitumens diluted with precipitants such as n-pentane, n-hexane and n-octane at

5
temperatures from 0 to 50°C at atmospheric pressure. The ability of the proposed approaches to
predict other thermodynamic derivative properties was beyond the scope of this study and was not
evaluated.
2. Datasets
Dataset 1
This dataset was used to develop a methodology to model the phase behaviour of bitumen/solvent
pseudo-binaries with the CPA-EoS. This dataset contains saturation pressures (liquid/vapour-
liquid boundaries), onsets of asphaltene precipitation (liquid/liquid-liquid boundaries), yields, and
phase compositions of pseudo-binaries WC-B-B2/n-pentane, WC-B-B3/propane and WC-B-
B4/propane. WC-B-B2, WC-B-B3, and WC-B-B4 are three Western Canada bitumen samples
recovered from the same reservoir but with slightly different density, viscosity, and C5-asphaltene
content, Table 1. Data for pseudo-binary WC-B-B2/n-pentane is reported at temperatures from 20
to 130°C at pressures up to 10 MPa [2]. Data for pseudo-binaries WC-B-B3/propane and WC-B-
B4/propane are reported at temperatures from 20 to 130°C at pressures up to 10 MPa [33]. A
distillation assay was reported for the WC-B-B2 bitumen and is provided in Table 2. The
distillation assay of the three bitumen samples was assumed to be the identical since the samples
were obtained from the same source reservoir.
Dataset 2
This dataset was used to test the proposed methodology to model phase boundaries using the CPA-
EoS on independently measured data. It includes saturation pressures (liquid/vapor-liquid and
liquid-liquid/vapor-liquid-liquid boundaries) of a Peace River bitumen/propane pseudo-binary
reported at temperatures from 30 to 120°C and propane contents from 9.8 to 85.7 wt% [3]. Peace
River bitumen is a Western Canada bitumen with similar physical properties to those of samples
WC-B-B2, WC-B-B3, and WC-B-B4. The distillation assay of the Peace River bitumen was not
reported and was assumed to be identical to that of the WC-B-B2 bitumen reported in Table 2.

6
Table 1. Specific gravities and SARA assays for the bitumen samples in the Dataset 1 [2,33]. All three samples are from the same reservoir. The bitumen sample from Dataset 2 has the same properties as the WC-B-B2 bitumen.
Property WC-B-B2 WC-B-B3 WC-B-B4 Specific Gravity 1.015 1.020 1.023 Saturates, wt% 17.0 - - Aromatics, wt% 46.9 - - Resins, wt% 16.7 - - C5-asphaltenes, wt% 19.4 19.2 22.3
Table 2. Spinning band distillation assay of WC-B-B2 bitumen [2].
Volume % Distilled
Normal Boiling Point °C
1.7 218.0 3.4 237.4 5.0 252.4 6.7 267.9 8.4 278.6 10.1 289.4 11.8 301.7 13.4 313.5 15.1 324.0 18.5 339.8 20.2 349.6 21.8 358.0 23.5 367.3 25.2 375.2 26.9 380.0 28.57 382.5 30.25 384 31.93 385
Dataset 3
This dataset was used to extend the CPA-EoS based methodology to model asphaltene
precipitation for different n-paraffin diluted oils. It contains asphaltene precipitation data reported
for three Western Canada bitumens (Athabasca, Lloydminster and Cold Lake) diluted with with

7
n-paraffins ranging from n-pentane to n-octane, and for a Venezuelan heavy oil (Venezuela-1)
diluted with n-pentane and n-heptane. The data is reported at temperatures from 0 to 23°C all at
atmospheric pressure [34]. No distillation data were available for these oils and therefore the
distillation assay of bitumen WC-B-B2 from Dataset 1 was used with only an adjustment to the
measured asphaltene content. Selected physical properties and SARA assay of the oils in this
dataset are presented in Table 3.
Table 3. Specific gravities and SARA assays for the bitumens in Dataset 3 [34].
Property Athabasca Cold Lake Lloydminster Venezuela-1 Specific Gravity 1.022 1.007 1.001 1.023 Saturates, wt% 16.3 19.4 23.1 15.4 Aromatics, wt% 39.8 38.1 41.7 44.4 Resins, wt% 28.5 26.7 19.5 25.0 C5-asphaltenes, wt% 15.4 15.8 15.7 15.0
3. The CPA Equation of State
The version of CPA used in this study was proposed by Kontogeorgis et al. [24] and combines the
physical terms from the Soave-Redlich-Kwong (SRK) EoS with the association term derived by
Michelsen and Hendriks [35] as follows:
𝑃𝑃 = 𝑅𝑅𝑅𝑅𝑉𝑉𝑚𝑚−𝑏𝑏
− 𝑎𝑎𝑉𝑉𝑚𝑚(𝑉𝑉𝑚𝑚+𝑏𝑏) −
12𝑅𝑅𝑅𝑅𝑉𝑉𝑚𝑚�1 + 𝜌𝜌 𝜕𝜕ln𝑔𝑔
𝜕𝜕𝜕𝜕�∑ 𝑥𝑥𝑖𝑖 ∑ (1 − 𝑋𝑋𝐴𝐴𝑖𝑖)𝐴𝐴𝑖𝑖𝑖𝑖 (1)
where P is pressure, R is the universal gas constant, T is the temperature, Vm is the molar volume,
a and b are constants, ρ is molar density, g is the radial distribution function, xi is the mole fraction
of component i, subscript A denotes a type of site on the molecules in component i, and XAi is the
fraction of Site A in Component i that is not bonded to other sites.
The radial distribution function, 𝑔𝑔, is given by:
𝑔𝑔 = 11−1.9𝑏𝑏𝜕𝜕/4
(2)
For pure components and pseudo-components, the constants a and b are calculated as:
𝑎𝑎 = 0.42747 𝑅𝑅2𝑅𝑅𝑐𝑐2
𝑃𝑃𝑐𝑐[1 + 𝑐𝑐(1 −� 𝑅𝑅
𝑅𝑅𝑇𝑇)]2 (3)
8
𝑏𝑏 = 0.08664 𝑅𝑅𝑅𝑅𝑐𝑐𝑃𝑃𝑐𝑐
(4)
where
𝑐𝑐 = 0.48508 + 1.55171𝜔𝜔 − 0.15613𝜔𝜔2 (5)
and Tc, Pc and ω are the critical temperature, critical pressure and acentric factor, respectively.
Parameters a and b for mixtures are calculated from those of the pure components or pseudo-
components using the classic van der Waals mixing rules:
𝑎𝑎 = ∑ ∑ 𝑥𝑥𝑖𝑖𝑥𝑥𝑗𝑗�𝑎𝑎𝑖𝑖𝑎𝑎𝑗𝑗�1 − 𝑘𝑘𝑖𝑖𝑗𝑗�𝑗𝑗𝑖𝑖 (6)
𝑏𝑏 = ∑ ∑ 𝑥𝑥𝑖𝑖𝑥𝑥𝑗𝑗𝑏𝑏𝑖𝑖𝑗𝑗𝑗𝑗𝑖𝑖 , 𝑏𝑏𝑖𝑖𝑗𝑗 = 12�𝑏𝑏𝑖𝑖 + 𝑏𝑏𝑗𝑗� (7)
For the association term (the last term in Eq. 1), each component must be classified into an
association type with a specified number of association sites per molecule (up to 4). The sites must
be defined as either positive representing proton donors, or negative representing proton accepters.
By default, only sites with an opposite sign can associate with each other. The fraction of
unoccupied sites, XAi, is then related (analogously to the Langmuir adsorption isotherm) to the
association strength Δ𝐴𝐴𝑖𝑖𝐵𝐵𝑗𝑗 between two sites (Site A and B) on two different molecules (i and j) as
follows:
𝑋𝑋𝐴𝐴𝑖𝑖 = 1
1+𝜕𝜕∑ 𝑥𝑥𝑗𝑗 ∑ 𝑋𝑋𝐵𝐵𝑗𝑗Δ𝐴𝐴𝑖𝑖𝐵𝐵𝑗𝑗𝐵𝐵𝑗𝑗𝑗𝑗
(8)
When i ≠ j, the interaction is termed cross-association and when i=j, the interaction represents self-
association. The self-association strength Δ𝐴𝐴𝑖𝑖𝐵𝐵𝑖𝑖 can be expressed as follows:
Δ𝐴𝐴𝑖𝑖𝐵𝐵𝑖𝑖 = 𝑔𝑔 �𝑒𝑒𝑥𝑥𝑒𝑒 �𝜀𝜀𝐴𝐴𝑖𝑖𝐵𝐵𝑖𝑖
𝑅𝑅𝑅𝑅� − 1� 𝑏𝑏𝑖𝑖𝑖𝑖𝛽𝛽𝐴𝐴𝑖𝑖𝐵𝐵𝑖𝑖 (9)
where 𝜀𝜀𝐴𝐴𝑖𝑖𝐵𝐵𝑖𝑖 is the association energy and 𝛽𝛽𝐴𝐴𝑖𝑖𝐵𝐵𝑖𝑖 is the association volume. In this study, the self-
association and cross-association energies were adjusted manually or calculated from the self-
association terms using the Elliot mixing rule given by:
Δ𝐴𝐴𝑖𝑖𝐵𝐵𝑗𝑗 = �Δ𝐴𝐴𝑖𝑖𝐵𝐵𝑖𝑖Δ𝐴𝐴𝑗𝑗𝐵𝐵𝑗𝑗 (10)
The association energy and volume are the two defining parameters for the association term in the
CPA-EoS; that is, all of the interaction terms can be determined from the 𝜀𝜀𝐴𝐴𝑖𝑖𝐵𝐵𝑖𝑖 and 𝛽𝛽𝐴𝐴𝑖𝑖𝐵𝐵𝑖𝑖 of the
components and pseudo-components. Hence, once the number and type of association sites for the
associating components has been defined, the CPA-EoS requires a total of 5 parameters for each
9
component: Tc, Pc, and ω for the SRK physical terms, and, 𝜀𝜀𝐴𝐴𝑖𝑖𝐵𝐵𝑖𝑖 and 𝛽𝛽𝐴𝐴𝑖𝑖𝐵𝐵𝑖𝑖 for the association term.
Binary interaction parameters in Eq. 6 must also be defined for each pair of components or pseudo-
components.
4. Modeling Methodology
Like all equations of state, the modeling methodology involves representing the oil as a set of
pseudo-components with defined properties (oil characterization), performing a flash calculation,
and then tuning some model parameters to fit the available data. The key step in this work is the
oil characterization which includes assigning the critical properties and acentric factor for each
pseudo-component, defining the association type and number of association sites per pseudo-
component molecule, assigning the CPA volume and energy parameters, and setting binary
interaction parameters.
The “trick” to modeling asphaltene precipitation with the CPA-EoS is to recognize that the
components that primarily form a heavy phase and contribute to the maximum yield (the yield at
high precipitant contents) are the self-associating components within the characterization. The
self-association was necessary to partition components preferentially to the heavy phase even at
high solvent contents in the feed. In other words, the self-association counters the effect of dilution
something a cubic EOS cannot model accurately without the use of composition dependent binary
interaction parameters [39]. The CPA-EoS can be tuned to accurately predict yields below the
input amount of self-associating components but not above. Therefore, the amount of self-
associating components must be defined to equal or exceed the maximum yield to be modeled.
The problem is that the maximum yield is different for different solvents. One solution is to define
the amount of self-associating components based on the highest yield expected to be encountered
in any application. For solvent diluted bitumens, that amount is the “asphaltene” yield in propane
diluted bitumen (C3-asphaltenes). Note that the C3-asphaltenes include many components that
would typically be defined as resins or maltenes.
Two characterization were prepared: 1) a “traditional” characterization with the amount of self-
associating components based on the C5-asphaltene content; 2) a modified characterization based
on the C3-asphaltene (propane insoluble) content. The CPA model with the two characterizations

10
are denoted as the “CPA-C5” and “CPA-C3” approaches. The CPA-C5 approach is simpler but is
incapable of predicting C3-asphaltene yields for propane diluted bitumen. The CPA-C3 approach
addresses this deficiency. The two characterizations are presented in detail below. Then the
changes made to the characterizations for other oils and solvents are discussed. Finally, the flash
calculation procedure is described.
4.1 Oil Characterization: Pseudo-Components (Dataset 1)
The WC-B-B3 bitumen from Dataset 1 was characterized based on distillation assay data based on
a characterization procedure presented in detail elsewhere [2, 33]. Briefly, the maltenes and
asphaltenes were characterized separately. The maltene fraction was divided into a set of pseudo-
components with critical properties, acentric factors and molecular weights calculated from the
Lee-Kesler correlations [36]. The maltene pseudo-component specific gravities, used as inputs for
the Lee-Kesler correlations, were calculated from the Katz-Firoozabadi correlation [37]. In this
study, the asphaltenes were represented as self-associating components instead of nano-aggregates
with a fixed molecular weight distribution as is done in other models [2,7-11,19,20,33,34]. Hence,
only the asphaltene monomer properties were defined. The asphaltene monomer molecular weight
was set to 800 g/mol [12, 16, 38] and the monomer critical properties and acentric factor were
obtained from Arya et al. [27, 28].
The asphaltene pseudo-components were set to have four association sites per molecule. Two sites
are set as negative and two as positive. These sites can bond with sites on the same species (self-
association) or with other species (cross-association). The maltenes and the n-alkane solvent were
set to have 1 site per molecule, which can cross-associate with either the positive or negative sites
of the asphaltene pseudo-components. These sites cannot self-associate and can only interact with
sites on other molecules through defined cross-association energies; in this study, they can only
interact with the asphaltenes.
The CPA-C5 and CPA-C3 approaches differed in the mass and number of pseudo-components
assigned to the self-associating and non-associating components. In the CPA-C5 characterization,
the amount of self-associating material was set to the mass fraction of C5-asphaltenes in the
bitumens from Dataset 1, Table 1. The maltenes were divided into 10 pseudo-components, each

11
representing a mass fraction interval of the same width. The asphaltenes were similarly divided
into 6 pseudo-components. Selected physical properties of the WC-B-B3 bitumen maltene and
asphaltene pseudo-components are shown in Table 4. This characterization can be used for
mixtures of bitumen and n-alkanes of carbon number 5 or more.
In the CPA-C3 approach, the CPA-C5 characterization was modified to model the phase behavior
of bitumen diluted with propane as well as higher carbon number n-alkanes. The asphaltene
content was redefined to the measured propane insoluble asphaltene content of the WC-B-B3
bitumen; in other words, 49.2 wt% of the oil was defined as self-associating components. This
value was the minimum content of self-associating components necessary to fit the yield data and
is equivalent to the minimum measured yield at high dilution with propane (see Figure 5). The
maltenes and asphaltenes were divided into 6 and 10 pseudo-components, respectively, with the
properties shown in Table 5.
Table 4. Number of association sites and properties of the WC-B-B3 bitumen pseudo-components for the CPA-C5 characterization.
Component Number of Association
Sites*
Mass Fraction
Tc K
Pc kPa
Acentric Factor
MW g/mol
Maltene 1 1 0.0808 738 2440 0.753 299 Maltene 2 1 0.0808 790 2079 0.836 368 Maltene 3 1 0.0808 829 1844 0.919 429 Maltene 4 1 0.0808 859 1690 1.002 480 Maltene 5 1 0.0808 883 1581 1.085 523 Maltene 6 1 0.0808 904 1489 1.168 561 Maltene 7 1 0.0808 923 1382 1.251 599 Maltene 8 1 0.0808 946 1281 1.334 644 Maltene 9 1 0.0808 973 1150 1.417 706 Maltene 10 1 0.0808 1008 1006 1.500 795 Asphaltene 1-6 4 0.032 1008 1186 1.535 800
*Maltene pseudo-components have one association site that can cross-associate with both positive and negative sites of an asphaltene molecule. Asphaltenes have 4 association sites: 2 positive sites and 2 negative sites.
12
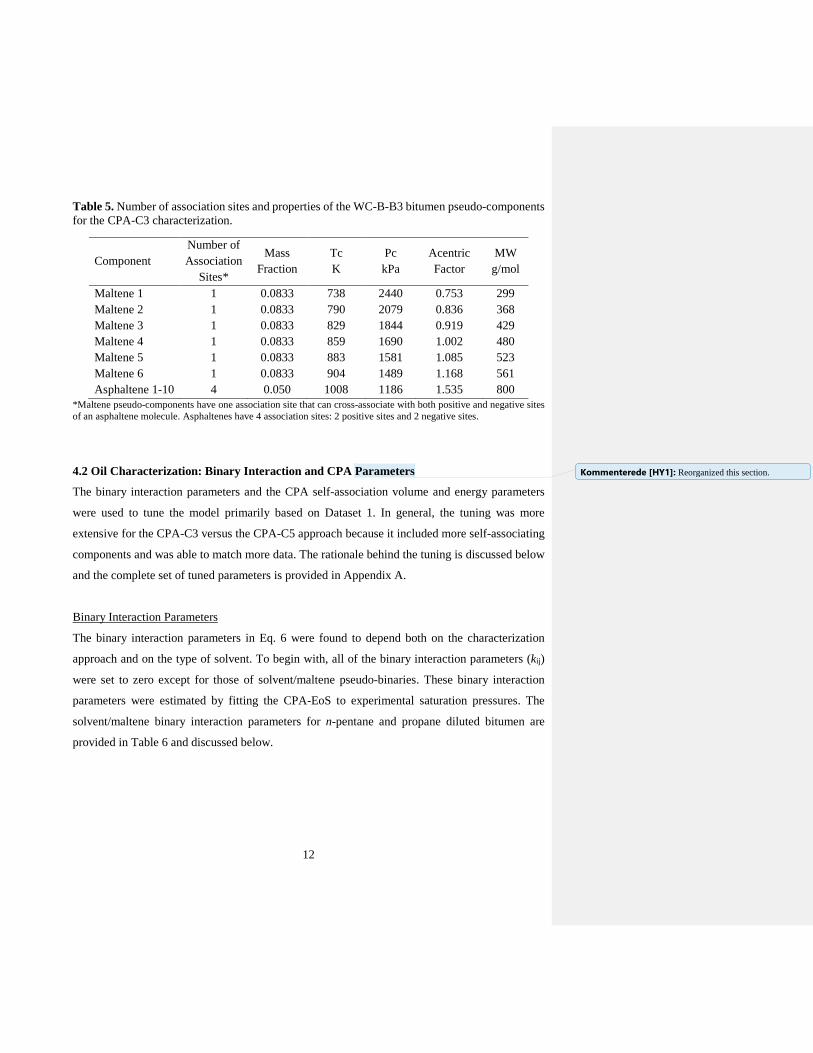
Table 5. Number of association sites and properties of the WC-B-B3 bitumen pseudo-components for the CPA-C3 characterization.
Component Number of Association
Sites*
Mass Fraction
Tc K
Pc kPa
Acentric Factor
MW g/mol
Maltene 1 1 0.0833 738 2440 0.753 299 Maltene 2 1 0.0833 790 2079 0.836 368 Maltene 3 1 0.0833 829 1844 0.919 429 Maltene 4 1 0.0833 859 1690 1.002 480 Maltene 5 1 0.0833 883 1581 1.085 523 Maltene 6 1 0.0833 904 1489 1.168 561 Asphaltene 1-10 4 0.050 1008 1186 1.535 800
*Maltene pseudo-components have one association site that can cross-associate with both positive and negative sites of an asphaltene molecule. Asphaltenes have 4 association sites: 2 positive sites and 2 negative sites.
4.2 Oil Characterization: Binary Interaction and CPA Parameters
The binary interaction parameters and the CPA self-association volume and energy parameters
were used to tune the model primarily based on Dataset 1. In general, the tuning was more
extensive for the CPA-C3 versus the CPA-C5 approach because it included more self-associating
components and was able to match more data. The rationale behind the tuning is discussed below
and the complete set of tuned parameters is provided in Appendix A.
Binary Interaction Parameters
The binary interaction parameters in Eq. 6 were found to depend both on the characterization
approach and on the type of solvent. To begin with, all of the binary interaction parameters (kij)
were set to zero except for those of solvent/maltene pseudo-binaries. These binary interaction
parameters were estimated by fitting the CPA-EoS to experimental saturation pressures. The
solvent/maltene binary interaction parameters for n-pentane and propane diluted bitumen are
provided in Table 6 and discussed below.
Kommenterede [HY1]: Reorganized this section.

13
Table 6. The tuned binary interaction parameters for the bitumen in Dataset 1.
Parameter CPA-C5 CPA-C3
kMalt/C5 T ≤ 1.0427Tc,C5: -0.03
T > 1.0427Tc,C5: 1.144 − 1.126 � 𝑅𝑅𝑅𝑅𝑐𝑐,𝐶𝐶5
�
T ≤ 1.0277 Tc,C5: -0.03
T > 1.0277 Tc,C5: 1.903− 1.881 � 𝑅𝑅𝑅𝑅𝑐𝑐,𝐶𝐶5
�
kMalt/C3 -0.057 -0.11 kAsph/C3 - -0.026 All others 0 0
n-Pentane Diluted Bitumen: For both the CPA-C5 and CPA-C3 approaches, the binary interaction
parameters of the maltene/n-pentane pseudo-binaries were found to be constant (kMalt/C5 = -0.03)
below the critical temperature of n-pentane (Tc,C5 = 469.7 K). It was necessary to add a temperature
dependence above this critical temperature, as shown in Table 6, with a slightly different
temperature dependence for each approach. The correlations are based on data from 20 to 280°C
and may not be valid at higher temperatures.
Propane Diluted Bitumen: For both the CPA-C5 and CPA-C3 approaches, the binary interaction
parameters of the maltene/propane pseudo-binaries were found to be constant but with different
values for each approach (kMalt/C3 = -0.057 for CPA-C5 and -0.11 for CPA-C3). Note, there were
few data points above the critical temperature of propane (Tc,C3 = 369.8 K) and it is possible the
interaction parameter would require adjustment at higher temperatures. In addition, for the CPA-
C3 approach, a non-zero interaction parameter was added for all of the asphaltene/propane pseudo-
binaries (kAsph/C3 = -0.026) in order to fit the asphaltene yield data.
CPA Association Volume Parameters
The CPA association volume parameters are provided in Table 7. For both approaches, the self-
association volume parameter was set to 0.05 for all asphaltene pseudo-components. The self-
association volume parameters for the maltenes and solvents were all set to zero because they do
not self-associate. The cross-association volume parameters for asphaltene/asphaltene,
asphaltene/maltene, and asphaltene/solvent pseudo-pairs were all set to 0.05 as recommended by
Arya et al. [28].

14
Table 7. The CPA volume parameters for mixtures of oil and solvent (same for both CPA-C3 and CPA-C5 approaches); X indicates any component.
Component Pair Volume Parameter βAsph/X 0.05 All others 0
CPA Energy Parameters
Recall that the CPA energy parameters include self-association energies, εAA, for each self-
associating component (asphaltenes) and cross-association energies, εAB, for each pair of cross-
associating components (asphaltene/maltene, asphaltene/solvent and asphaltene/asphaltene
pseudo-pairs). There is no cross-association between the maltene pseudo-component pairs or
between the maltene pseudo-components and the solvent; hence their cross-association energies
are zero. The cross-association energy of asphaltene/asphaltene pseudo-pairs, εAiAj, was calculated
from the Elliot mixing rule (Eq. 10) using self-association strength calculated from Eq. 9.
Therefore, there are three parameters remaining to be tuned: the self-association energy of
asphaltene pseudo-components (εAiAi), the cross-association energies of asphaltenes/maltenes
(εAsphMalt), and the cross-association of the asphaltenes/solvent pseudo-pairs (εAsphSolv and εAiAj). The
asphaltene self-association parameters have a physical basis in the sense that the asphaltenes
largely consist of self-associating components. The cross-association between maltenes and
asphaltenes is consistent with previous CPA models which require cross-association between
aromatic species and self-associating compounds such as water and glycols (Kontogeorgis and
Folas, 2010). The cross-association between asphaltenes and solvents has no known physical basis
and is simply used as a tuning parameter.
These three energy parameters were adjusted to fit the CPA-EoS to asphaltene precipitation data
as described below. There is not a unique set of energy parameters that fit the data; hence, they
were constrained within the physically reasonable range from 500 K to 7500 K as recommended
by Arya et al. [28]. The parameters were optimized manually by setting the self-association
parameter and optimizing the cross-association parameters. The optimization was repeated with
different self-association parameters to reach an approximate global optimum. The optimization
was relatively straightforward because the self-association parameter more strongly affected the
Kommenterede [HY2]: Georgios and Alay: please check this paragraph.

15
yields while the cross-association more strongly affected the onsets. The tuned parameters are
provided in Table 8 and discussed below.
Table 8. The tuned CPA energy parameters for the bitumen in Dataset 1. See Figure 1 for details on the asphaltene/solvent cross association energies; C3 = propane and C5+ = n-pentane and higher carbon number n-alkanes.
Parameter CPA-C5 CPA-C3 (εAiAi/R)° in C3, K 6840 6500 (εAiAi/R)° in C5+, K 6840 5950 ∆(εAiAi/R)°, K 60 60 εAiAj/R, K Elliot, Eq. 10 Elliot, Eq. 10 εAsph/Malt/R in C3, K 3241 + 2.325T 2765 + 3.055T εAsph/Malt/R in C5+, K 3241 + 2.325T 1985 + 5.543T εAsph/Solv/R (min), K 2580 2000 εAsph/Solv/R (max), K 3250 4000 All others 0 0
Asphaltene Self-Association Energies: These energies were set primarily to match the shape of the
asphaltene yield curve and to capture the sequential partitioning of asphaltenes to the heavy phase
upon dilution with the given solvent. The reduced energies (energy divided by the gas constant, R)
were set to a tunable value, (εAiAi/R)°, in K, for the first asphaltene pseudo-component and
incremented by 60 K for each subsequent fraction. The value of (εAiAi/R)° can be tuned for each oil
and, for the CPA-C5 approach, it was set to 6840 K for the WC-B-B2 bitumen.
Recall that the asphaltene fraction was divided into 10 pseudo-components in the CPA-C3
approach. In this case, a constant value, (εAiAi/R)°, was set for the first 6 asphaltene pseudo-
components. This self-association energy was incremented by 60 K successively for each of the
remaining 4 asphaltene pseudo-components. (εAiAi/R)° was set to 5950 K for the WC-B-B2 bitumen
diluted with n-pentane and higher carbon number n-alkanes. It was necessary to adjust (εAiAi /R)°
to 6500 K for WC-B-B2 bitumen diluted with propane, suggesting that asphaltenes self-associate
more strongly in propane than in n-pentane. The value for (εAiAi/R)° is higher than the value found
for the CPA-C5 asphaltene pseudo-components.
16
Asphaltene/Maltene Cross-Association Energies: The reduced asphaltene/maltene cross
association energies, εAsphMalt/R, were set primarily to match the onset of asphaltene precipitation
at different temperatures (23 to 230°C for n-pentane and 20 to 90°C for propane). For each of the
CPA-C5 and CPA-C3 approaches, the fitted parameters were correlated to temperature as shown
in Table 8. For the CPA-C5 approach one correlation was sufficient for all solvents considered.
For the CPA-C3 approach, one correlation was found for mixtures of bitumen and propane but
another for mixtures of bitumen with n-pentane and higher n-alkane number solvents. There is no
obvious physical basis for the use of different asphaltene/maltene cross-association energies in
different solvents; hence, it appears that the model is not completely capturing the physical basis
of the phase behavior. The necessity for this additional tuning is a weakness for the CPA-C3
characterization.
For bitumen/propane mixtures, the magnitude of the cross-association energy of
asphaltene/maltene pseudo-binaries from the CPA-C3 approach is higher than that of
asphaltene/maltene pseudo-binaries from the CPA-C5 approach from 20 to 90°C. However, the
predicted energies are higher than the CPA-C5 approach above 100°C. There is no obvious
explanation for this cross-over; hence, caution is advised if using the CPA-C3 approach for
mixtures of bitumen and propane above 90°C.
Asphaltene-Solvent Cross-Association Energies: This energy was the main parameter used to fit
the maximum asphaltene yield in each n-alkane solvent using the data for diluted crude oils in
Dataset 3. Essentially, reduced cross-association energies above a certain value (approximately
2600 K for CPA-C5 and 2000 K for CPA-C3) allowed a component to precipitate. The asphaltene-
solvent cross-association energy was also set to decrease with increasing asphaltene pseudo-
component number as shown in Figure 1a for the CPA-C5 approach and Figure 1b for the CPA-
C3 approach. This modification ensured that all asphaltene pseudo-components precipitated in low
carbon number n-alkanes, such as n-pentane, but only the most strongly associated pseudo-
components precipitated in higher carbon number n-alkanes. In effect, the cross-association
energies tuned the solubility of each asphaltene component without compromising the match to

17
the phase boundaries and yields. Such a tuning could not be achieved by adjusting the asphaltene
self-association energies.
The shape of curves shown in Figure 1 were adjusted to ensure the correct order of precipitation
for asphaltene pseudo-components in a given solvent. For the CPA-C5 approach, the minimum
and maximum asphaltene/solvent reduced cross-association energies, εC5Asph/Solv/R (in K), were set
to 2580 and 3250 K, respectively, for the solvents in this study. For the CPA-C3 approach, the
minimum and maximum cross-association energies were set to 2000 K and 4000 K, respectively.
Values outside this range had a negligible effect on the CPA-EoS predictions and were not
considered.
Figure 1. Tuned asphaltene-solvent reduced cross-association energy, εC5AsphSolv/R , for different n-paraffin solvents. The asphaltene pseudo-components were defined from: a) the CPA-C5 characterization approach; b) the CPA-C3 characterization approach.
4.3 Tuning the Model for Other Oils and Solvents
The asphaltene precipitation curves for the diluted bitumens in Dataset 3 were modelled using the
CPA-EoS as follows. Both characterization approaches, CPA-C5 and CPA-C3, were tested. The
critical properties and acentric factors for pseudo-components were estimated as described in
Section 4.1. The CPA association volume parameters were used as introduced in Section 4.2. The
2500
2700
2900
3100
3300
1 2 3 4 5 6
εAsp
h/So
lv/R
, K
CPA-C5 Asphaltene Pseudo-Component
C5
C6
C7
C8
(a)
1800
2400
3000
3600
4200
1 2 3 4 5 6 7 8 9 10
εAsp
h/So
lv/R
, K
CPA-C3 Asphaltene Pseudo-Component
C5
C8
C3
(b)

18
asphaltene-solvent cross-association energies were used as shown in Figure 1a for the CPA-C5
approach and Figure 1b, for the CPA-C3 approach. They were not adjusted for the different oils.
The model was tuned to match the onset condition for each oil in n-heptane at 23°C and
atmospheric pressure by adjusting the base line self-association energy, (εAiAi/R)°, of the asphaltene
pseudo-components. The self-association energies for the higher fractions of the asphaltene
pseudo-component were incremented as described previously. The tuned values for the Athabasca,
Cold Lake, Lloydminster and Venezuela-1 bitumens are provided in Table 9. The (εAiAi/R)°
parameter is the only tuning parameter required to match yield data from different bitumens at
23°C. All other parameters were unchanged from the base case characterizations.
Table 9. The tuned (εAiAi/R)° in K for the oils in Dataset 3.
Bitumen (εAiAi/R)°, K CPA-C5 CPA-C3
Athabasca 6840 6080 Cold Lake 6860 6100 Lloydminster 6890 6140 Venezuela-1 6850 6120
4.4 Flash Calculation
The flash calculations were performed in Matlab 2017b using a multi-phase flash algorithm
package developed by the Technical University of Denmark (DTU). The algorithm uses a standard
Rachford-Rice algorithm that converge to a fugacity based phase equilibrium. In this work, the
yield curves were generated by increasing the n-alkane content in feed in 1 wt% steps and
calculating the yield at each feed composition. The saturation pressures and liquid-liquid phase
boundaries were determined with a linear search for the phase change with increasing pressure at
different solvent contents in the feed mixture. Although this method is inefficient, it is the most
reliable approach for identifying the phase boundaries.
For the CPA-C3 based characterization approach with 7 non-associating and 10 associating
fractions in the mixture, 50 flash calculations per second were achieved with a 3.4 GHz Intel Core
19
i7 processor. For the CPA-C5 based characterization approach with 11 non-associating and 6
associating fractions in the mixture, 80 flash calculations per second were achieved.
5. Results and Discussion
First, the results for n-pentane diluted and propane diluted bitumen with CPA-C5 and CPA-C3
characterization approaches are discussed and compared. Then, the extension of the model to other
bitumens and solvents is examined. Finally, the limiting number of pseudo-components is
identified and the strengths and limitations of the proposed methodology are discussed.
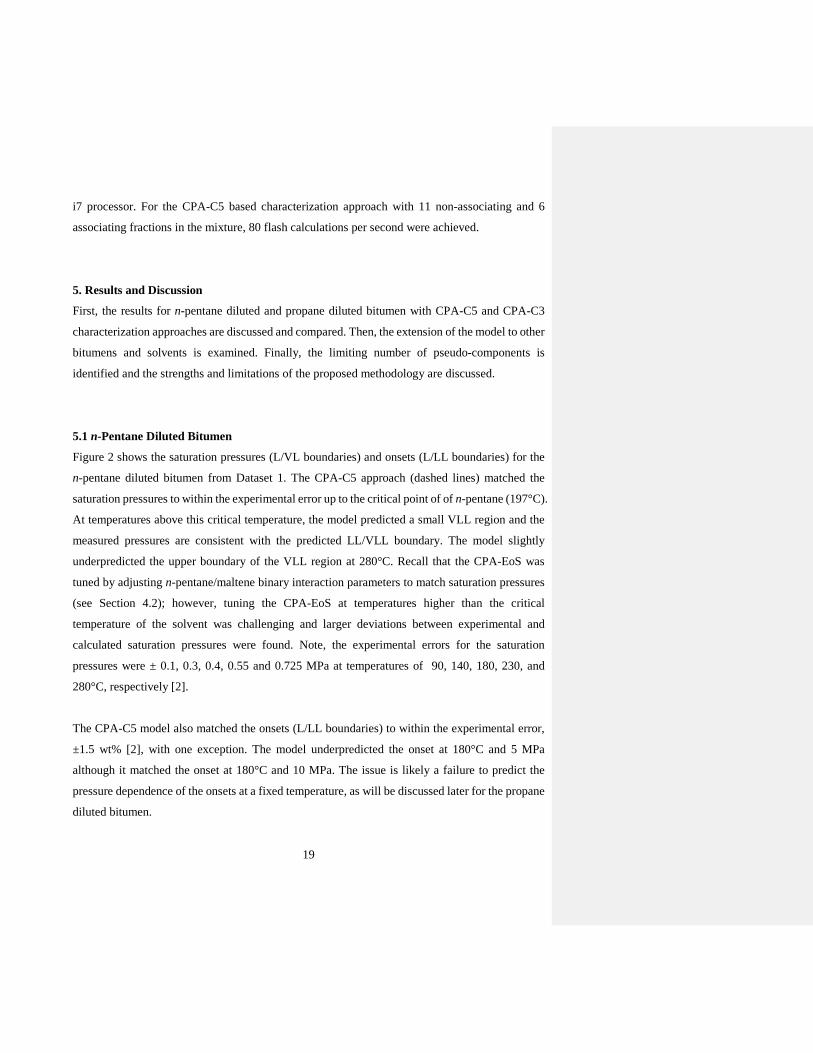
5.1 n-Pentane Diluted Bitumen
Figure 2 shows the saturation pressures (L/VL boundaries) and onsets (L/LL boundaries) for the
n-pentane diluted bitumen from Dataset 1. The CPA-C5 approach (dashed lines) matched the
saturation pressures to within the experimental error up to the critical point of of n-pentane (197°C).
At temperatures above this critical temperature, the model predicted a small VLL region and the
measured pressures are consistent with the predicted LL/VLL boundary. The model slightly
underpredicted the upper boundary of the VLL region at 280°C. Recall that the CPA-EoS was
tuned by adjusting n-pentane/maltene binary interaction parameters to match saturation pressures
(see Section 4.2); however, tuning the CPA-EoS at temperatures higher than the critical
temperature of the solvent was challenging and larger deviations between experimental and
calculated saturation pressures were found. Note, the experimental errors for the saturation
pressures were ± 0.1, 0.3, 0.4, 0.55 and 0.725 MPa at temperatures of 90, 140, 180, 230, and
280°C, respectively [2].
The CPA-C5 model also matched the onsets (L/LL boundaries) to within the experimental error,
±1.5 wt% [2], with one exception. The model underpredicted the onset at 180°C and 5 MPa
although it matched the onset at 180°C and 10 MPa. The issue is likely a failure to predict the
pressure dependence of the onsets at a fixed temperature, as will be discussed later for the propane
diluted bitumen.

20
Now consider the same n-pentane diluted bitumen discussed above but modelled using the
CPA- C3 approach (Section 4.2). In general, the CPA-EoS with both characterization approaches,
CPA-C5 and CPA-C3, has essentially the same performance in matching phase boundaries at
temperatures below the critical temperature of n-pentane (197°C), Figure 2 (solid lines). The most
notable differences were found at temperatures above the critical temperature of n-pentane. At
230°C, the CPA-C3 model predicts the intersection of the L/VL and LL/VLL boundaries at higher
n-pentane content. In addition, The VLL region predicted by the CPA-C3 approach is larger than
that predicted by the CPA-C5 approach with the CPA-C3 approach over-predicting the saturation
pressures in this region. Note, neither CPA-C5 not CPA-C3 approaches were able to capture the
effect of pressure on the onset of asphaltene precipitation at 180°C, Figure 2d.
Figure 3 shows the yield curves for the n-pentane diluted bitumen from Dataset 1 at temperatures
from 20 to 250°C and pressures up to 13.8 MPa. The CPA-C5 approach (dashed lines) fit the yield
curves up to 180°C to within the experimental error, ± 1.5 wt%, except at 140°C where the
deviations reached 3 wt%. The CPA-C3 model (solid lines) matched the yield data at all conditions
to within the experimental error. Note that both the CPA-C5 and CPA-C3 approaches over-
predicted the onset at 250°C by approximately 4 wt%. As will be discussed later, neither approach
can capture the effect of pressure on the onset.
Table 10 lists the measured and modeled phase compositions at feed n-pentane contents from 59
to 73 wt% at 180°C and 4.8 MPa from Dataset 1. No composition data were reported at
temperatures above the critical point of n-pentane. The CPA-C5 model matched the measured
compositions with an average absolute deviation of 2 wt% for the light phase and 5 wt% for the
heavy phase. The CPA-C3 model performed slightly worse with an average absolute deviation of
2 wt% for the light phase and 7 wt% for the heavy phase. Both models consistently under-predicted
the asphaltene content in the light phase and tended to under-predict the n-pentane content in the
heavy phase.

21
Figure 2. Pressure-composition diagram showing the saturation pressures and liquid-liquid boundaries (onset) for n-pentane diluted WC-B-B3 bitumen from Dataset 1 at: a) 20°C; b) 90°C; c) 140°C; d) 180°C; e) 230°C; f) 280°C. The onsets shown in (c) and (e) were measured at 120 and 250°C, respectively. Symbols are data [2]; solid and dashed lines are the CPA-C3 and CPA-C5 models, respectively.
0
0.2
0.4
0.6
0.8
1
0 10 20 30 40 50 60 70
Pres
sure
, MPa
Feed Pentane Content, wt%
onsetCPA-C3CPA-C5
L LL
(a) 20 °C
VL 0
1
2
3
4
5
6
0 10 20 30 40 50 60 70
Pres
sure
, MPa
Feed Pentane Content, wt%
PsatonsetCPA-C3CPA-C5
L LL
VL
(b) 90 °C
0
1
2
3
4
5
6
0 10 20 30 40 50 60 70
Pres
sure
, MPa
Feed Pentane Content, wt%
PsatonsetCPA-C3CPA-C5
L LL
VL
(c) 140 °C
0
5
10
15
0 10 20 30 40 50 60 70
Pres
sure
, MPa
Feed Pentane Content, wt%
PsatonsetCPA-C3CPA-C5
L LL
VL
(d) 180 °C
0
5
10
15
0 10 20 30 40 50 60 70
Pres
sure
, MPa
Feed Pentane Content, wt%
PsatonsetCPA-C3CPA-C5
L
LL
VL
(e) 230 °C VLL
0
5
10
15
0 10 20 30 40 50 60 70
Pres
sure
, MPa
Feed Pentane Content, wt%
PsatCPA-C3CPA-C5
L
VL
(f) 280 °C LL
VLL

22
Figure 3. Measured and modeled C5-asphaltene yields from pentane diluted bitumen from Dataset 1 at: a) 20°C, 0.1 MPa; b) 90°C, 4.8 MPa; c) 140°C, 4.8 MPa; d) 180°C, 13.8 MPa; e) 250°C, 10.3 MPa. Symbols are data [2]; solid lines and dashed lines are the CPA-C3 and CPA-C5 models, respectively.
0
5
10
15
20
40 50 60 70 80 90
C5-
Asph
alte
ne Y
ield
, wt%
Feed Pentane Content, wt%
yieldonsetCPA C3CPA C5
(a) 20°C, 0.1 MPa0
5
10
15
20
40 50 60 70 80 90
C5-
Asph
alte
ne Y
ield
, wt%
Feed Pentane Content, wt%
yieldonsetCPA C3CPA C5
(b) 90°C, 4.8 MPa
0
5
10
15
20
40 50 60 70 80 90
C5-
Asph
alte
ne Y
ield
, wt%
Feed Pentane Content, wt%
yieldonsetCPA C3CPA C5
(d) 180°C, 13.8 MPa0
5
10
15
20
40 50 60 70 80 90
C5-
Asph
alte
ne Y
ield
, wt%
Feed Pentane Content, wt%
yieldonsetCPA C3CPA C5
(c) 140°C, 4.8 MPa
0
5
10
15
20
40 50 60 70 80 90
C5-
Asph
alte
ne Y
ield
, wt%
Feed Pentane Content, wt%
yieldonsetCPA C3CPA C5
(e) 250°C, 10.3 MPa

23
Table 10. Comparison of measured and modeled feed, light phase, and heavy phase compositions of pentane diluted bitumen at 180°C and 4.8MPa. Experimental data from Johnston et al [2]; CPA-C5 and CPA-C3 are the model approaches.
Component
Measured CPA-C5 CPA-C3
Feed wt%
Light Phase wt%
Heavy Phase wt%
Light Phase wt%
Heavy Phase wt%
Light Phase wt%
Heavy Phase wt%
59 wt% C5 n-Pentane 59.2 67.1 31.4 64.5 19.9 65.3 23.4 C5-Maltenes 32.9 29.8 20.4 33.6 29.3 32.4 35.3 C5-Asphaltenes 8.0 3.1 48.2 1.9 50.8 2.3 41.2 64 wt% C5 (1) n-Pentane 64.4 68.0 26.0 70.4 18.0 69.5 21.8 C5-Maltenes 28.7 29.0 29.6 28.6 25.0 28.0 33.7 C5-Asphaltenes 6.9 3.0 52 0.9 57.0 0.8 44.5 64 wt% C5 (2) n-Pentane 63.7 72.8 19.2 69.5 17.7 70.7 22.1 C5-Maltenes 29.3 24.7 24.0 28.0 24.1 28.3 34.0 C5-Asphaltenes 7.0 2.6 56.8 0.8 58.2 1.0 43.9 73 wt% C5 n-Pentane 72.5 77.9 20.3 77.6 15.6 78.2 19.7 C5-Maltenes 22.2 20.0 23.7 22.1 17.9 21.5 31.1 C5-Asphaltenes 5.4 2.1 56.0 0.3 66.5 0.3 49.2
5.2 Propane Diluted Bitumen
Figure 4 shows the saturation pressures (L/VL boundaries) and onsets (L/LL boundaries) for the
propane diluted bitumen from Dataset 1. Note, the onset at 75°C and the saturation pressure at
20°C were not reported. The CPA-C5 approach (dashed lines) matched the saturation pressure data
to within the experimental error (± 0.4 MPa). A small VLL region was predicted at 90 and 135°C,
consistent with the observed VLL/VL boundary at 90ºC and 50 wt% feed propane content, Figure
4d.
The CPA-C5 approach could not match the observed pressure dependence of the L/LL boundary,
but rather predicted a pressure independent boundary, Figure 4. Hence, the model could only be
tuned to match the onset at one pressure. The same issue was encountered by Mancilla-Polanco et

24
al. [33] when modeling the same dataset with the Peng Robinson equation of state. Hence, this
model deficiency may be an inherited issue from the cubic equation of state.
The CPA-C3 approach (solid lines in Figure 4) also matched the saturation pressures of the
propane diluted bitumen from Dataset 1 to within the experimental error. Unlike the CPA-C5
approach, no VLL region was predicted at 90 and 135°C. This result contradicts the experimentally
confirmed existance of a VLL region at 90°C, Figure 4d. At 135°C, the light liquid phase was
predicted to become supercritical above approximately 60 wt% propane in the feed and, therefore,
there is no LL/VL boundary at higher propane contents, Figure 4e. The disappearance of the
LL/VL boundary was also observed experimentally [33]. As with the CPA-C5 approach, the CPA-
C3 approach was unable to predict the pressure dependence of the onsets.
Figure 5 shows the C5-asphaltene and C3-asphaltene yield curves for the bitumen from Dataset 1
diluted with propane at temperatures from 20 to 135°C and pressures up to 10 MPa. “C3-
asphaltene” denotes the solvent free material in the heavy phase and “C5-asphaltene” denotes the
n-pentane insoluble fraction. The CPA-C5 approach (dashed lines) was not able to predict that all
C5-asphaltenes immediately partition into the heavy phase just above the onset. It approximately
matched the C5-asphaltene yields at temperatures up to 90°C but drastically under-predicted the
C3-asphaltene yields at all conditions below the critical temperature of propane (96.6°C). The
CPA-C5 approach underpredicted the C3-asphaltene yield is because too few pseudo-components
were designated as self-associating components and therefore not enough of the bitumen could
partition to the heavy phase. One potential solution is to tune the binary interaction parameters of
some of the C5-maltene/propane pairs to force them partition into the heavy phase. However,
composition dependent binary interaction parameter would then be required to match the yield
curves (not shown here).
The CPA-C3 approach (solid lines in Figure 5) provided a significantly better prediction of yields
below the critical temperature of propane with the average deviations of 6 wt%. However, this
approach consistently under-predicted the C5-asphaltene yields just above the onset. This error
could be corrected by adjusting the binary interaction parameter between maltenes and propane
but then the match to the saturation pressures would be lost. At 135°C, the CPA-C3 approach

25
predicted that all of the bitumen partitioned into the heavy phase at the onset and over-predicted
the C3-asphaltene yield at propane content below 80 wt%. It is not clear how much the model
really deviates from the data because the experimental error in the yield data was reported to be
highest near the onset [33].
Table 11 lists the measured and modeled phase compositions at feed propane contents of 50 and
75 wt% at temperatures from 50 to 130°C and pressures up to 10 MPa. Since the CPA-C5 approach
failed to match the C3-asphaltene yields, the predicted phase compositions from this model will
not be discussed. The CPA-C3 approach matched the measured compositions with an average
absolute deviation of 5 wt% for the light phase and 6 wt% for the heavy phase. Up to 90°C, the
model predicted too little partioning of propane and maltenes to the heavy phase. At 130°C, the
error reversed, and the model predicted too much partioning of propane and maltenes to the heavy
phase. The change in pattern corresponds to the change in the shape of the predicted yield curves
in Figure 5.

26
Figure 4. Pressure-composition diagram showing the saturation pressures and liquid-liquid boundaries for propane diluted WC-B-C3 bitumen from Dataset 1 at: a) 20°C; b) 50°C; c) 75°C; d) 90°C; e) 135°C. Symbols are data [33]; solid lines and dashed lines are the CPA-C3 and CPA-C5 approaches, respectively. LF stands for liquid-fluid region.
0
2
4
6
8
10
12
0 20 40 60 80 100
Pres
sure
, MPa
Feed Propane Content, wt%
(a) 20°C
OnsetCPA-C3CPA-C5
L
VL
LL
0
2
4
6
8
10
12
0 20 40 60 80 100
Pres
sure
, MPa
Feed Propane Content, wt%
(b) 50°C
PsatOnsetCPA-C3CPA-C5
L
VL
LL
0
2
4
6
8
10
12
0 20 40 60 80 100
Pres
sure
, MPa
Feed Propane Content, wt%
(c) 75 °C
PsatCPA-C3CPA-C5
L
VL
LL
0
2
4
6
8
10
12
14
0 20 40 60 80 100
Pres
sure
, MPa
Feed Propane Content, wt%
PsatOnsetVLL/VLCPA-C3CPA-C5
L
VL
LL
VLL
(d) 90°C
0
2
4
6
8
10
12
14
0 20 40 60 80 100
Pres
sure
, MPa
Feed Propane Content, wt%
PsatOnsetCPA-C3CPA-C5
L
VL
LL
VLLLF
(e) 135°C

27
Figure 5. C3-asphaltene yield and C5-asphaltene yields from propane diluted WC-B-B3 bitumen at: a) 20°C, 5 MPa; b) 20°C, 10 MPa; c) 50°C, 10 MPa; d) 90°C, 10 MPa; e) 130°C, 10 MPa. Symbols are data [33]; solid lines and dashed lines are the CPA-C3 and CPA-C5 models, respectively.
0
20
40
60
80
100
20 40 60 80 100
Yiel
d, w
t%
Feed Propane Content, wt%
C3-asphC5-asphonsetCPA C3CPA C5
(b) 20°C, 10 MPa0
20
40
60
80
100
20 40 60 80 100
Yiel
d, w
t%
Feed Propane Content, wt%
C3-asphC5-asphonsetCPA C3CPA C5
(a) 20°C, 5 MPa
0
20
40
60
80
100
20 40 60 80 100
Yiel
d, w
t%
Feed Propane Content, wt%
C3-asphC5-asphonsetCPA C3CPA C5
(c) 50°C, 10 MPa0
20
40
60
80
100
20 40 60 80 100
Yiel
d, w
t%
Feed Propane Content, wt%
C3-asphC5-asphonsetCPA C3CPA C5
(d) 90°C, 10 MPa
0
20
40
60
80
100
20 40 60 80 100
Yiel
d, w
t%
Feed Propane Content, wt%
C3-asphC5-asphonsetCPA C3CPA C5
(e) 130°C, 10 MPa

28
Table 11. Comparison of measured and modeled feed, light phase, and heavy phase compositions of propane diluted bitumen. Experimental data from Mancilla-Polanco et al [33]; CPA-C3 is the modeling approach.
Component Measured CPA-C3
Feed wt%
Light Phase wt%
Heavy Phase wt%
Light Phase wt%
Heavy Phase wt%
50°C, 2 MPa Propane 49.5 72.6 22.1 64.4 21.7 C5-maltene 40.8 27.3 56.4 34.7 50.4 C5-Asphaltenes 9.7 0.0 21.5 0.9 27.9 50°C, 2 MPa Propane 74.2 88.0 20.7 85.1 19.9 C5-maltene 20.8 12.0 53.5 14.9 49.6 C5-Asphaltenes 5.0 0.0 25.8 0.0 30.5 50°C, 5 MPa Propane 49.7 69.6 26.8 64.2 21.5 C5-maltene 40.6 30.3 51.7 35.8 48.5 C5-Asphaltenes 9.7 0.0 21.5 0.1 30.0 90°C, 6.9 MPa Propane 49.5 76.9 18.4 66.4 16.3 C5-maltene 40.8 23.1 61.6 33.6 53.2 C5-Asphaltenes 9.7 0.0 20.0 0.0 30.5 130°C, 10 MPa Propane 50.0 79.8 1.8 71.0 15.8 C5-maltene 40.4 20.2 70.2 29.0 57.9 C5-Asphaltenes 9.6 0.0 28.0 0.0 26.3
5.3 Other Conditions, Oils, and Solvents
Independent Bitumen/Propane Data at Other Conditions
Dataset 2 includes L/VL and LL/VLL boundaries, but no L/LL boundaries, for propane diluted
Peace River bitumen and it is used to examine the CPA-EoS predictions in this region. Recall that
the bitumen in Dataset 2 is similar to the bitumen in Dataset 1 and the same characterization was
assumed to apply. Figure 6 shows the measured and modeled L/VL and LL/VLL phase boundaries.
The CPA-C3 approach was used. Below the critical temperature of propane (96.6°C), the CPA-
C3 approach slightly underpredicted the L/VL boundaries but was generally within ±0.2 MPa of
the data. The LL/VLL boundaries were consistently underpredicted by approximately 0.5 MPa.

29
Above the critical temperature of propane, both boundaries were significantly overpredicted. In
addition, the experimental L/VL and LL/VLL boundaries suggest that, for this propane diluted
bitumen, the onset of asphaltene precipitationan (L/LL boundary) is above 40 wt% propane content
in the feed at temperatures above 90°C. The experimental boundaries also suggest that the onset
of asphaltene precipitation is less than 35 wt% propane content at temperatues below 90oC. Note,
that the CPA-C3 approach underpredicts the onsets at all tested temperatures. The reason for these
deviations is unknown; however, it might be possible that that the bitumen from Dataset 2 has a
different distribution of properties than the bitumen from Dataset 1, affecting the performance of
the CPA-EoS. Whatever the reason for the difference, the model fit to the data can be improved if
the model is tuned to the experimental data.
Figure 6. Measured and modeled saturation pressures for propane diluted Peace River bitumen from Dataset 2 [3]: a) 52 to 90°C; b) 90 to 120°C. Different Oils and Solvents
Figures 7 and 8 show the yield curves for the four diluted oils in Dataset 3 at 23 and 0°C,
respectively. Recall that for each oil, the model was tuned to match the onset in n-heptane at 23°C
by adjusting only one parameter, (εAA/R)° (Section 4.3). The effect of the solvent was accounted
for with the asphaltene/solvent cross-association energies (Figure 1a for CPA-C5 and Figure 1b
0
1
2
3
4
5
0 20 40 60 80 100
Pres
sure
, MPa
Feed C3 Content, wt%
L/VL dataLL/VLL dataCPA-C3
(a)
52°C
90°C
80°C
70°C
0
2
4
6
8
10
0 20 40 60 80 100
Pres
sure
, MPa
Feed C3 Content, wt%
L/VL dataLL/VLL dataCPA-C3
(b)
90°C
120°C
110°C

30
for CPA-C3). Both approaches matched the yield data at 23°C with average deviations within ±0.5
wt%.
Figure 7. Measured and modeled asphaltene yields for four different bitumens at 23°C and 0.1 MPa: (a) Athabasca (b) Cold Lake (c) Lloydminster and (d) Venezuela-1 . Symbols are data [34]; solid lines and dashed lines are the CPA-C3 and CPA-C5 approaches, respectively.
To model the data at 0°C, the temperature dependent cross-association parameter between the
asphaltene and maltene pseudo-components (Eq. 13 for the CPA-C5 approach, Eq. 16 and 17 for
the CPA-C3 approach) was extrapolated to 0°C; no other parameters were adjusted. Both models
matched the yield data with deviations within ±2.5 wt% of the experimental data. The largest errors
0
2
4
6
8
10
12
14
16
18
30 40 50 60 70 80 90 100
Asph
alte
ne Y
ield
, wt%
Feed Solvent Content, wt%
C5-asphC6-asphC7-asphCPA C3CPA C5
(a) Athabasca0
2
4
6
8
10
12
14
16
18
30 40 50 60 70 80 90 100
Asph
alte
ne Y
ield
, wt%
Feed Solvent Content, wt%
C5-asphC6-asphC7-asphCPA C3CPA C5
(b) Cold Lake
0
2
4
6
8
10
12
14
16
18
30 40 50 60 70 80 90 100
Asph
alte
ne Y
ield
, wt%
Feed Solvent Content, wt%
C5-asphC6-asphC7-asphC8-asphCPA C3CPA C5
(c) Llyodminster
0
2
4
6
8
10
12
14
16
18
20
30 40 50 60 70 80 90 100
Asph
alte
ne Y
ield
wt%
Feed Solvent Content, wt%
C5-asphC7-asphCPA C3CPA C5
(d) Venezuela-1

31
were found for the Cold Lake and the Venezuela-1 bitumens at 0°C at higher dilutions. The most
likely explanation is that the temperature dependence of the asphaltene/maltene cross-association
energy for these oils is not the same as that for the oils from Dataset 1. Therefore, the extrapolation
of the cross-association parameter between the asphaltene and maltene pseudo-components is
inaccurate.
Figure 8. Measured and modeled asphaltene yields for four different bitumens at 0°C and 0.1 MPa: (a) Athabasca (b) Cold Lake (c) Lloydminster and (d) Venezuela-1. Symbols are data [34]; solid lines and dashed lines are the CPA-C3 and CPA-C5 approaches, respectively.
0
2
4
6
8
10
12
14
16
18
20
30 40 50 60 70 80 90 100
Asph
alte
ne Y
ield
, wt%
Feed Solvent Content, wt%
C5-asphC6-asphC7-asphCPA C3CPA C5
(a) Athabasca0
2
4
6
8
10
12
14
16
18
20
30 40 50 60 70 80 90 100
Asph
alte
ne Y
ield
, wt%
Feed Solvent Content, wt%
C5-asphC7-asphCPA C3CPA C5
(b) Cold Lake
0
2
4
6
8
10
12
14
16
18
20
30 40 50 60 70 80 90 100
Asph
alte
ne Y
ield
, wt%
Feed Solvent Content, wt%
C5C7CPA C3CPA C5
(c) Llyodminster0
2
4
6
8
10
12
14
16
18
20
30 40 50 60 70 80 90 100
Asph
alte
ne Y
ield
wt%
Feed Solvent Content, wt%
C5-asphC7-asphCPA C3CPA C5
(d) Venezuela-1

32
5.4 Order of Precipitation
It is known that the most strongly self-associating asphaltene fractions tend to precipitate
preferentially. For example, when an n-alkane is added to a bitumen, the most strongly associated
asphaltenes precipitate near the onset and the less strongly associated asphaltenes precipitate as
the yield increases at higher dilution. Similarly, only the more strongly associated asphaltenes
precipitate when the oil is diluted with a higher carbon number n-alkane. The less strongly
associated asphaltenes also precipitate in the lower carbon number n-alkanes where yields are
higher. Recall that one objective of this study was to better capture this sequential precipitation.
The correct allocation of self-associating species is important for predicting the phase behavior of
crude oil fractions (such as deasphalted oil) particularly if later blended with other oils or solvents
that can potentially cause asphaltene precipitation.
Figure 9 shows the distribution of the asphaltene fractions in the heavy phase at different n-pentane
contents in the feed for the Athabasca bitumen from Dataset 3. Both the CPA-C5 approach (Figure
9a) and the CPA-C3 approach (Figure 9b) predicted that the most self-associating species
precipitate preferentially. For example, for the CPA-C5 approach just above the onset, the Asph-
6 (strongest self-associating fraction) yield is three times more than Asph-1 (weakest self-
associating fraction) yield. As the n-pentane content increases, all of the fractions precipitate and
their yields are the same. Similar results were obtained for propane diluted bitumen.
Figure 10 shows the fractional precipitation (mass of fraction in heavy phase divided by mass in
feed) of each asphaltene pseudo-component from Athabasca bitumen from Dataset 3 diluted with
n-pentane, n-hexane, and n-heptane each at 23°C, 0.1 MPa, and 95 wt% solvent in the feed. At
these conditions, the most strongly self-associating asphaltenes (highest fraction numbers) always
precipitate. The less strongly associated asphaltenes precipitate sequentially when the solvent is
switched from n-heptane to n-hexane to n-pentane. Unfortunately, there were no data with which
to validate the model predictions but both the CPA-C3 and CPA-C5 models qualitative capture the
sequential precipitation of more to less self-associated asphaltenes.

33
Figure 9. Predicted composition of the heavy phase from the Athabasca bitumen from Dataset 3 diluted with n-pentane at 23°C and 0.1 MPa: a) CPA-C5 approach; b) CPA-C3 approach.
Figure 10. Fractional precipitation of each asphaltene fraction from the CPA-C5 approach (a) and from the CPA-C3 approach (b) for Athabasca bitumen diluted with n-pentane, n-hexane, and n-heptane at 23°C and 0.1 MPa, from Dataset 3. The solvent content in the feed is 95 wt% for all cases.
0.0
0.2
0.4
0.6
0.8
1.0
1 2 3 4 5 6
Frac
tiona
l Pre
cipi
tatio
n
C5-Asphaltene Fraction
C5C6C7
(a) CPA-C50.0
0.2
0.4
0.6
0.8
1.0
1 2 3 4 5 6 7 8 9 10
Frac
tiona
l Pre
cipi
tatio
n
C3-Asphaltene Fraction
C5C6C7
(b) CPA-C3

34
5.5 Effect of Lumping Pseudo-Components
In practical applications, the components are often lumped to improve the speed of the simulation.
Here, the impact of lumping on the accuracy of the phase behavior predictions was assessed
according to the lumping schemes presented in Table 12. The parameters of the lumped pseudo-
components for the cubic terms in the CPA were calculated with the mixing rules (Eqs. 6 and 7).
The only CPA parameters that required adjustment after lumping were the asphaltene self-
association energy and asphaltene-solvent cross association energy. They were adjusted as
discussed below. The effect of lumping on the phase boundary and yield curve predictions was
similar for both the CPA-C5 and CPA-C3 approaches and only the results for the CPA-C3
approach are shown below. Note, in general, the CPA-C5 approach is 40% faster than the CPA-
C3 approach because it includes less self-associating components.
Lumping Maltenes
Lumping maltenes into one pseudo-component had negligible impact on the calculated phase
boundaries and yields, and, the results are not shown here. The most important difference is the
increase of the number of flashes per second, from 50 for the full characterization (Section 4) to
90 for the maltenes lumped as one single pseudo-component, Table 12. Therefore, for calculation
of phase boundaries and yields, it is recommended to lump the maltenes as a single pseudo-
component.
Table 12. Flash calculation speed for different lumping schemes for the CPA-C3 approach. Note that the speed can vary ±10% depending on the location within the phase diagram. Full oil characterization was presented in Section 4. PC stands for pseudo-component.
Lumping Scheme Number
Maltene PC Number
Asphaltene PC Flashes per
second Full characterization 6 10 50 Lumping maltenes 1 10 90 Lumping asphaltenes (5) 6 5 147 Lumping asphaltenes (1) 6 1 440 Lumping both (5 asph) 1 5 539 Lumping both (1 asph) 1 1 1507

35
Lumping Asphaltenes
The model sensitivity to the number of asphaltene pseudo-components was also tested. Only
results for the CPA-C3 approach are shown here. This approach was tested on the propane and
pentane diluted bitumen from Dataset 1. The reduced asphaltene-solvent cross-association energy
was set to 2000 K for all propane/asphaltene pseudo-component pairs. For pentane diluted bitumen,
the cross-association energy trend was tuned for each lumping scheme in order to obtain the best
match of both onset and yield curves. The original relative trends were preserved (Figure 1b); only
the magnitudes were adjusted.
Lumping the asphaltenes did not have any impact on the predicted phase boundaries. It also had
negligible impact on the predicted yields for propane diluted bitumen, Figure 11a. This result
indicates that the shape of the propane diluted bitumen yield curve is independent of the
distribution of self-association energies of asphaltenes. Recall that the shape of the yield curve was
captured by adjusting asphaltene pseudo-component self-association energies, Section 4. However,
the ability to predict the order of precipitation will be lost with a single asphaltene pseudo-
component and therefore predictions for bitumen fractions may be compromised.
Figure 11. Effect of lumping asphaltene pseudo components on onset and yield curve predictions for: a) propane diluted bitumen in Dataset 1 at 90 °C, 10 MPa; b) n-pentane diluted bitumen in Dataset 1 at 20 °C, 0.1 MPa. PC stands for number of asphaltene pseudo-components. 10 PC refers to the full oil characterization, Table 12. The maltene fraction was represented as a single pseudo-component.
0
20
40
60
80
100
20 40 60 80 100
Yiel
d, w
t%
Feed Propane Content, wt%
C3-asphC5-asphonset10 PC5 PC 2 PC1 PC
(a)
0
5
10
15
20
40 50 60 70 80 90
Yiel
d, w
t%
Feed Pentane Content, wt%
C5-asphOnset10 PC5 PC2 PC1PC
(b)

36
Lumping significantly impacted the predicted yields for n-pentane diluted bitumen, Figure 11b. In
n-pentane diluted bitumen, only some of the asphaltenes precipitate and the ability of the model to
predict the yields at different solvent contents depends on the distribution of self-association
energies in the asphaltenes. This distribution is lost when the components are lumped too
extensively. A minimum of 5 asphaltene pseudo-components was required to maintain the
predictions of both onset and yield curves. Lumping into a single pseudo-component was not
viable because it was not possible to match both the onset and the yield. Therefore, at least 5
asphaltene pseudo-components are recommended. Table 12 shows that lumping the asphaltene
pseudo-components can increase the flash calculation speed up to 1500 flashes per second
depending on the amount of lumping.
5.6 General Application and Limitations of Model
In this study, the proposed methodology has only been tested on bitumens diluted with solvents.
The characterization must have a content of self-associating components equal or greater than the
asphaltene content defined as the mass fraction of the oil that is insoluble in the given solvent.
Hence, the CPA-C3 characterization is required to model yields from propane diluted bitumen or
higher carbon number n-alkanes. The CPA-C5 characterization can be used for n-pentane diluted
bitumen or higher carbon number n-alkanes. The CPA-C5 approach is less computationally
intensive and is 40% faster than CPA-C3 approach. In both cases, the only tuning parameter for
different bitumen is the asphaltene self-association energy. The only tuning parameter for different
solvents is the asphaltene-solvent cross-association energy. The CPA-C3 and CPA-C5 approaches
are also suitable for predicting the stability of oil blends but have not yet been tested for this
application.
Both the CPA-C3 and CPA-C5 approaches can be extended to live oil applications as shown by
Arya et al [28, 30] for a similar C5-asphaltene based characterization. Briefly, the proposed
characterization is taken to represent the heavy residue of a conventional oil. The lighter
components are added to the characterization usually based on a GC assay. Arya et al. [28] adjusted
the critical properties of the lumped maltenes to match the bubble point of the oil. Another option
is to adjust the binary interaction parameter between methane and the residue pseudo-components.

37
The former approach has successfully matched the onset of asphaltene precipitation from a live oil
depressurization or from the injecting of mixtures of carbon dioxide and nitrogen into crude oil.
The proposed methodology has the following limitations:
1. The model required additional tuning and the predicted phase boundaries were less reliable
above the critical temperature of the solvent.
2. The pressure dependence of the liquid-liquid boundary (which becomes significant as the
temperature approaches the critical temperature of the solvent) could not be accurately
captured. The model could only be tuned to match the liquid-liquid boundary at a single
pressure point at any given temperature.
3. The temperature dependence of the maltene-asphaltene cross-association energy was
different for propane than for the higher carbon number n-alkanes. The correlation may
need to be tuned for other solvents with critical temperatures close the operational
temperatures of interest.
4. The model tuning is not robust; sometimes changing one parameter will require retuning
of several other parameters. For example, if the self-association energy distribution of
asphaltenes is retuned to match yield data, it is likely that the other already established
correlations such as those for the asphaltene-maltene and asphaltene-solvent cross-
association energies will also require re-tuning.
5. The model is tunable when data are available but is not likely to be predictive for
significantly different oils, solvents, or temperatures and pressures beyond the tuned
conditions.
If a model is to be created from scratch or retuning is required, the following step-wise approach
is recommended:
1. Divide the bitumen into pseudo-components based on distillation data and the required
asphaltene content (e.g. C5-asphaltenes for pentane and higher carbon number solvents).
2. Define the asphaltene pseudo-components as self-associating species and the maltene
pseudo-components as non-associating species.
3. Assign the equation of state parameters as described previously.
4. Adjust the maltene-solvent binary interaction parameter to match saturation pressures.
5. Tune both (εAiAi/R)° and εAsphMalt/R to match the onset at a given temperature and pressure.

38
6. Adjust the εAsphMalt/R at several other temperatures and establish a correlation to
temperature.
7. To match the shape of the yield curve, tune the εAiAi/R distribution or the εAsphSolv/R
distribution.
8. Return to Step 3 and iterate until all phase behavior data matched.
6. Conclusions
Two oil characterizations were developed for the CPA model applied to the phase behavior of
mixtures of bitumen and n-alkanes: 1) the CPA-C5 approach with the fraction of self-associating
components based on the n-pentane insoluble content (19 wt% of the bitumen); 2) the CPA-C3
approach based on the propane insoluble content (50 wt% of the bitumen). The CPA-C5 model
was less complex and ran 40% faster but could not match the yield and phase composition data for
propane diluted bitumen. The key to matching yield data is that self-associating components must
equal or exceed the content on the oil that is insoluble in the given solvent.
Within their range of applicability, both approaches matched the phase boundaries and yields
generally to within the measurement error. The approaches matched the phase compositions
generally to within 11 wt% or less with the average absolute deviations listed below:
Solvent CPA-C3 (AAD in %) CPA-C5 (AAD in %) Light Phase Heavy Phase Light Phase Heavy Phase
Propane 5 6 N/A N/A n-Pentane 2 7 2 5
One advantage of the proposed approaches is that no composition dependent parameters were
required to fit the data. Previous work with a cubic equation of state found that it could match the
same dataset used in this study only by using composition dependent binary interaction parameters
[39]. It is possible that these binary interaction parameters were indirectly accounting for the effect
of self-association.
The proposed approaches also address a physical inconsistency in previous attempts to use CPA
to match yield curves of asphaltene precipitation from n-alkane diluted bitumen [28, 31].

39
Previously, all asphaltene components were characterized identically so that all partitioned equally
to the heavy phase. The proposed characterization assigns a range of self-association energies to
the asphaltenes so that more strongly self-associating components partition preferentially to the
heavy phase. This refinement potentially allows for more accurate prediction of the phase behavior
of fractions separated from the original mixture.
Although the CPA approach could be tuned to match much of the observed bitumen/solvent phase
behavior, asphaltene/solvent cross-association energies were required to fit the data although there
is no physical basis for this type of association energy. Both models required additional tuning and
were less accurate above the critical point of the solvent. The models also failed to predict the
pressure dependence of the liquid-liquid boundary at temperatures approaching the critical
temperature of the solvent. It appears that the model does not capture all of the physics underlying
the observed phase behavior. Hence, the model is suitable for interpolative modeling over a wide
range of conditions but extrapolation is risky.
The number of pseudo-components in either approach could be reduced to 1 non-associating
component and 5 associating components with minimal loss of accuracy and a significant
improvement in computational speed. However, both approaches have been tuned to match
measured data and are not predictive. The approaches can be applied to other solvents by tuning
the asphaltene/solvent cross-association energy. They can be applied to other bitumens by
adjusting the self-association energy of the asphaltenes. Caution is advised if other parameters are
adjusted because changes in one parameter may require retuning of several other parameters.
Previous studies have shown that this type of characterization can easily be extended to live oils
[26-30]. Hence, the proposed approaches can be adapted to all of the typically encountered crude
oil and solvent phase behavior. Caution is advised when predicting LL behavior above the critical
temperature of the solvent.
Acknowledgements
The authors would like to thank the sponsors of the Natural Science and Engineering Research
Council of Canada (NSERC) Industrial Research Chair in Heavy Oil Properties and Processing,
including NSERC, CNRL, Nexen Energy ULC., Petrobras, Schlumberger, Suncor, and Virtual

40
Materials Group (VMG), for their financial support. We are grateful to Dr. Francisco Ramos
Pallares for his suggestions.
References
1. Sabbagh, O., Akbarzadeh, K., Badamchi-Zadeh, A., Svrcek, W., Yarranton, H.W., Applying the PR-EoS to Asphaltene Precipitation from n-Alkane Diluted Heavy Oils and Bitumens. Energy Fuels 2006. 20: 625-634.
2. Johnston, K.A., Schoeggl, F.F., Satyro, M.A., Taylor, S.D., Yarranton, H.W., Phase behavior of bitumen and n-pentane. Fluid Phase Equilibria 2017. 442: 1-19.
3. Dini, Y., Becerra, M., Shaw, J.M., Phase Behavior and Thermophysical Properties of Peace River Bitumen + Propane Mixtures from 303 K to 393 K. J. Chem. Eng. Data 2016. 61(8): 2659-2668.
4. Mehrotra, A., Svrcek, W.Y., Correlations and Prediction of Gas Solubility in Cold Lake Bitumen. Can. J. Chem. Eng. 1988. 66: 666-670.
5. Badamchi-Zadeh, A., Yarranton, H.W., Maini, B.B., Satyro, M.A., A. Phase Behavior and Physical Property Measurements for VAPEX Solvents: Part 2. Propane, Carbon Dioxide and Athabasca Bitumen. J. Can. Pet. Technol. 2009. 48: 57-65.
6. Badamchi-Zadeh, A., Yarranton, H.W., Svrcek, W., Maini, B.B., Phase Behavior and Physical Property Measurements for VAPEX Solvents: Part 1. Propane and Athabasca Bitumen. J. Can. Pet. Technol. 2009. 48: 54-61.
7. Jamaluddin, A.K.M., Kalogerakis, N.E., Chakma, A., Predictions of CO2 Solubility and CO2 Saturated Liquid Density of Heavy Oils and Bitumens using a Cubic Equation of State. Fluid Phase Equilibria 1991. 64: 33-48.
8. Gonzalez, D.L., Ting, D.P., Hirasaki, G.J., Chapman, W.G., Prediction of Asphaltene Instability under Gas Injection with the PC-SAFT Equation of State. Energy Fuels 2005. 19: 1230-1234.
9. Gonzalez, D.L., Vargas, F.M., Hirasaki, G.J., Chapman, W.G., Modeling Study of CO2-Induced Asphaltene Precipitation. Energy Fuels 2008. 22: 757-762.
10. Tavakkoli, M., Panuganti, S.R., Taghikhani, V., Pishvaie, M.R., Chapman, W.G., Understanding the polydisperse behavior of asphaltenes during precipitation. Fuel 2014. 117: 206-217.
11. Yarranton, H.W., Masliyah, J.H., Molar mass distribution and solubility modeling of asphaltenes. AIChE J. 1996. 42(12): 3533-3543.
12. Badre, S., Goncalves, C.C., Norinaga, K., Gustavson, G., Mullins, O.C., Molecular size and weight of asphaltene and asphaltene solubility fractions from coals, crude oils and bitumen. Fuel 2006. 85(1): 1-11.
13. Arya, A., Liang, X., von Solms, N., Kontogeorgis, G.M., Modeling of asphaltene onset precipitation conditions with Cubic Plus Association (CPA) and Perturbed Chain Statistical

41
Associating Fluid Theory (PC-SAFT) equations of state. Energy Fuels 2016. 30(8): 6835-6852.
14. Agrawala, M., Yarranton, H.W., Asphaltene association model analogous to linear polymerization. Industrial & Engineering Chemistry Research 2001. 40: 4664-4672.
15. Speight, J.G., The Chemistry and Technology of Petroleum, 3rd ed. 1999. Marcel Dekker, New York.
16. Buch, L., Groenzin, H., Buenrostro-Gonzalez, E., Anderson, S.I., Lira-Galeana, C., Mullins, O.C., Molecular size of asphaltene fractions obtained from residuum hydrotreatment. Fuel 2003. 82(9): 1075-1084.
17. Wiehe, I.A., Kennedy, R.J., The oil compatibility model and crude oil incompatibility. Energy Fuels 2000. 14(1): 56-59.
18. Wang, J.X., Buckley, J.S., A two-component solubility model of the onset of asphaltene flocculation in crude oils. Energy Fuels 2001. 15(5): 1004-1012.
19. Alboudwarej, H., Akbarzadeh, K., Beck, J., Svrcek, W.Y., Yarranton, H.W., Regular Solution Model of asphaltene precipitation from bitumen. AIChE J. 2003. 49(11): 2948-2956.
20. Tharanivasan, A.K., Yarranton, H.W., Taylor, S.D., Application of regular solution based models to asphaltene orecipitation from live oils. Energy Fuels 2011. 25(2): 528-538.
21. Whitson, C.H., Brulé, M.R., Phase Behavior. 2000. Henry L. Doherty Memorial Fund of AIME, Society of Petroleum Engineers.
22. Castellanos Diaz, O., Modaresghazani, J., Satyro, M.A., Yarranton, H.W., Modeling the phase behavior of heavy oil and solvent mixtures. Fluid Phase Equilibria 2011. 304(1-2): 74-85.
23. Gross, J., Sadowski, G., Perturbed-Chain SAFT: An Equation of State Based on a Perturbation Theory for Chain Molecules. Industrial & Engineering Chemistry Research 2001. 40(4): 1244-1260.
24. Kontogeorgis, G.M., Voutsas, E.C., Yakoumis, I.V., Tassios, D.P., An equation of state for associating fluids. Ind. Eng. Chem. Res. 1996. 35(11): 4310-4318.
25. Gonzalez, D.L., Hirasaki, G.J., Creek, J., Chapman, W.G., Modeling of Asphaltene Precipitation Due to Changes in Composition Using the Perturbed Chain Statistical Associating Fluid Theory Equation of State. Energy Fuels 2007. 21: 1231-1242.
26. Shirani, B., Nikazar, M., Mousavi-Dehghani, S.A., Prediction of asphaltene phase behavior in live oil with CPA equation of state. Fuel 2012. 97: 89-96.
27. Arya, A., von Solms, N., Kontogeorgis, G.M., Determination of asphaltene onset conditions using the cubic plus association equation of state. Fluid Phase Equilibria 2015. 400: 8-19.
28. Arya, A., Liang, X., von Solms, N., Kontogeorgis, G.M., Modeling of asphaltene precipitation from crude oil with the Cubic Plus Association equation of state. Energy Fuels 2017. 31(2): 2063-2075.
29. Li, Z., Firoozabadi, A., Cubic-Plus-Association Equation of State for Asphaltene Precipitation in Live Oils. Energy Fuels 2009. 24: 2956-2963.

42
30. Arya, A., Liang, X., von Solms, N., Kontogeorgis, G.M., Prediction of Gas Injection Effect on Asphaltene Precipitation Onset Using the Cubic and Cubic-Plus-Association Equations of State. Energy Fuels 2017. 31(3): 3313-3328.
31. Li, Z., Firoozabadi, A., Modeling Asphaltene Precipitation by n-Alkanes from Heavy Oils and Bitumens Using Cubic-Plus-Association Equation of State. Energy Fuels 2010. 24: 1106-1113.
32. Saber, N., Shaw, J.M., On the Phase Behavior of Athabasca Vacuum Residue + n-Decane. Fluid Phase Equilibria 2011. 302: 254-259.
33. Mancilla-Polanco, A., Johnston, K., Richardson, W.D.L., Schoeggl, F.F., Zhang, Y., Yarranton, H.W., Taylor, S.D., The phase behavior of heavy oil and propane mixtures. SJ-0718-0002, SPE J. accepted July 2018.
34. Akbarzadeh, K., Alboudwarej, H., Svrcek, W., Yarranton, H.W., A generalized regular solution model for asphaltene precipitation from n-alkane diluted heavy oils and bitumens. Fluid Phase Equilibria 2005. 232: 159-170.
35. Michelsen, M. L., Hendriks, E. M. Physical Properties from Association Models. Fluid Phase Equilib. 2001, 180, 165-174.
36. Lee, B., Kesler, M.G., A generalized thermodynamic correlation based on three-parameter corresponding states. AIChE J. 1975. 21(3): 510-527.
37. Katz, D.L., Firoozabadi, A., Predicting phase behavior of condensate/crude-oil systems using methane interaction coefficients. Journal of Petroleum Technology 1978. 30(11): 1649-1655.
38. Barrera, D.M., Ortiz, D.P., Yarranton, H.W., Molecular Weight and Density Distributions of Asphaltenes from Crude Oils. Energy Fuels 2013. 27(5): 2474-2487.
39. Johnston, K.A., Satyro, M.A., Taylor, S.D., Yarranton, H.W., Can a Cubic Equation of State Model Bitumen-Solvent Phase Behavior? Energy Fuels 2017. 31(8): 7967-7981.

43
Appendix A: Association Energy Parameter Tables Table A1. First half of the matrix of self-association and cross-association energy parameters for the CPA-C5 characterization. Elliot refers to the Elliot mixing rule (Eq. 10).

44
Table A2. The matrix of self-association and cross-association energy parameters for CPA-C3 characterization. Elliot refers to the Elliot mixing rule (Eq. 10).