
Modeling the Personality of Dyads and Groupsgonzo/papers/persdyads.pdf · Modeling the Personality...
24
Modeling the Personality of Dyads and Groups Richard Gonzalez Dale Griffin University of Michigan and University of British Columbia ABSTRACT The paper presents a methodological approach for assessing the personality of a dyad or a group, a concept that is not equivalent to the sum, or mean, of the individual scores. We illustrate how the logic of the multitrait multimethod approach, which is a familiar technique for establishing construct validity, can be extended to assess the construct of a relationship ‘‘personality.’’ The model, which we call the latent group model, provides a decomposition and comparison of individual-level and group-level variance in a given trait, and the individual-level and group-level covariance or correlation between two traits. The model is also extended to the assessment of stability of the individual and group level traits. Throughout the paper, we draw connections between related methods and show how the latent group model can be estimated through hierarchical linear modeling. Journal of Personality 70:6, December 2002. Copyright # 2002 by Blackwell Publishing, 350 Main Street, Malden, MA 02148, USA, and 108 Cowley Road, Oxford, OX4 1JF, UK. Richard Gonzalez, University of Michigan; Dale Griffin, University of British Columbia. This research was supported by a grant from the National Science Foundation (Gonzalez) and a grant from the Social Science and Humanities Research Council of Canada (Griffin). Correspondence concerning this article may be addressed to either author: Richard Gonzalez, Department of Psychology, University of Michigan, Ann Arbor, MI 48109, or Dale Griffin, Faculty of Commerce and Business Administration, University of British Columbia, Vancouver, BC, Canada V6T 1Z2. Electronic mail may be sent to either: [email protected] or [email protected].
Transcript of Modeling the Personality of Dyads and Groupsgonzo/papers/persdyads.pdf · Modeling the Personality...

Modeling the Personality
of Dyads and Groups
Richard Gonzalez
Dale Griffin
University of Michigan and University of British Columbia
ABSTRACT The paper presents a methodological approach for assessing
the personality of a dyad or a group, a concept that is not equivalent to the sum,
or mean, of the individual scores. We illustrate how the logic of the multitrait
multimethod approach, which is a familiar technique for establishing
construct validity, can be extended to assess the construct of a relationship
‘‘personality.’’ The model, which we call the latent group model, provides a
decomposition and comparison of individual-level and group-level variance in
a given trait, and the individual-level and group-level covariance or
correlation between two traits. The model is also extended to the assessment
of stability of the individual and group level traits. Throughout the paper, we
draw connections between related methods and show how the latent group
model can be estimated through hierarchical linear modeling.
Journal of Personality 70:6, December 2002.
Copyright # 2002 by Blackwell Publishing, 350 Main Street, Malden, MA 02148,
USA, and 108 Cowley Road, Oxford, OX4 1JF, UK.
Richard Gonzalez, University of Michigan; Dale Griffin, University of British Columbia.
This research was supported by a grant from the National Science Foundation
(Gonzalez) and a grant from the Social Science and Humanities Research Council of
Canada (Griffin).
Correspondence concerning this article may be addressed to either author: Richard
Gonzalez, Department of Psychology, University of Michigan, Ann Arbor, MI 48109, or
Dale Griffin, Faculty of Commerce and Business Administration, University of British
Columbia, Vancouver, BC, Canada V6T 1Z2. Electronic mail may be sent to either:

Modeling the Personality of Dyads and Groups
It is common to measure the personality of individuals; it is morecomplex, but not impossible, to measure the personality of situations;it appears almost inconceivable to measure the personality of dyadsand groups. Nonetheless, in daily speech, people talk about narcissisticcouples, sociable groups, and polite or aggressive nations. What dopeople mean by such statements, and can these concepts be capturedby measures and statistics? Can we distinguish the personality of aninterpersonal relationship from the personality of the individuals in therelationship? Is the former more than the sum of the parts? Can thepersonality of a dyad or group be modeled as a function of the contextcreated by the people in the relationship?
Gonzalez and Griffin (2001) reviewed a social psychological debateabout the use of group-level concepts such as ‘‘group mind’’ in theoryconstruction. The debate can be characterized by placing GeorgeHerbert Mead (1934), who gave explanatory priority to the group, onone side and Floyd Allport (1924), who argued that explanations forsocial phenomena must ultimately reside in the individual, on the other.Gonzalez and Griffin (2001) provided a statistical structure thatmirrored this conceptual debate: a statistical framework that permitsthe modeling of group-level processes from individual-level data. Wecalled the model the latent group model. The model deals with Allport’sconcern that measurement and theory about groups should be bottom-up(i.e., it should derive from the individual because the responses of theindividuals in the same group are modelled as indicators of a group-level latent variable). The model simultaneously deals with Mead’sconcern that group-level explanations not be ignored in social science.The underlying logic of the latent group model is to construct group-level variance from the shared tendencies exhibited by the groupmembers and then use that group-level variance in subsequent analyses.
In this paper we argue that the common meaning of ‘‘grouppersonality’’ can indeed be measured, though not through standardstatistical techniques. We describe the latent group model in a way thatbuilds on standard methodological techniques from the personalityliterature. We show how those techniques can be adapted to measure the‘‘personality of a relationship.’’ The framework permits data collectedboth at the level of the individual and at the level of the couple. We showhow to use modern personality theory to inform our understanding ofrelationships (e.g., notions of coherence) and also show how the study
902 Gonzalez & Griffin

of relationships presents new challenges to personality theory (e.g.,studying the effects of the unique situational context created by thepersonality of the specific individuals in a relationship).
Latent Multitrait Multimethod Analysis
We build upon the logic of the multitrait-multimethod technique(MTMM) proposed by Campbell and Fiske (1959). Campbell andFiske had two themes guiding their framework. First, they consideredthe model in causal terms, in the sense that unobserved constructs areexpressed in observed variables. Observed measures are viewed as acombination of an underlying trait, giving rise to observed similarity,and specific unshared causes (often termed method factors), givingrise to observed uniqueness. Second, they viewed the model as a set ofconditions for an observed measure to be an indicator of an underlyingconstruct. These conditions are convergence (confirmation) anddiscrimination (falsification). Depending on the traits chosen,construct validity requires the trait-level relation either to be large(for conceptually related traits—yielding convergent validity) or small(for conceptually unrelated traits—yielding discriminant validity). Inthe end, construct validity requires a ‘‘nomological net’’ of variablesand unmeasured constructs (Cronbach & Meehl, 1955).
In the MTMM approach each trait is measured with multiplemethods. The analysis of the covariance matrix of such traits measuredwith multiple methods allows the assessment of reliability, convergentvalidity, and discriminant validity (Campbell & Fiske, 1959). Thestructure of the covariance matrix that is needed for MTMM isdepicted in Table 1.
The modern analysis of such matrices is typically done within theframework of structural equations modeling where each trait isrepresented by a latent variable and method variance is representedby correlated error (see Figure 1). We emphasize three key aspects ofthis latent variable MTMM. First, the paths from the trait latent variableto the indicators in this structural equations model provide reliabilityestimates (the square of the standardized path estimates are reliabilityestimates). This measure of reliability provides, for each trait, the ratioof true score variance to total variance. This is consistent with classicaltest theory, where reliability refers to the correlation between parallelmeasures of the same trait. Under the assumption of parallel tests (samescale, same error variance), further constraints need to be included, such
Modeling the Personality of Dyads and Groups 903
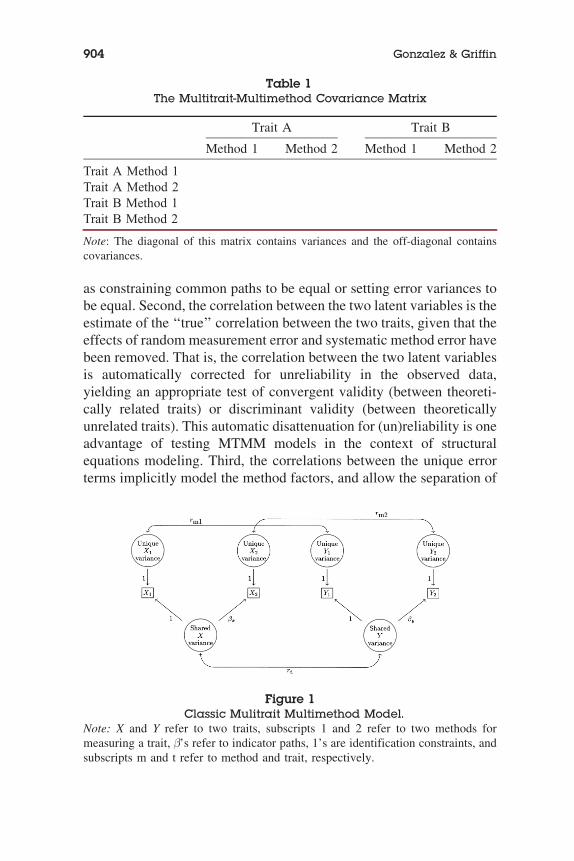
as constraining common paths to be equal or setting error variances tobe equal. Second, the correlation between the two latent variables is theestimate of the ‘‘true’’ correlation between the two traits, given that theeffects of random measurement error and systematic method error havebeen removed. That is, the correlation between the two latent variablesis automatically corrected for unreliability in the observed data,yielding an appropriate test of convergent validity (between theoreti-cally related traits) or discriminant validity (between theoreticallyunrelated traits). This automatic disattenuation for (un)reliability is oneadvantage of testing MTMM models in the context of structuralequations modeling. Third, the correlations between the unique errorterms implicitly model the method factors, and allow the separation of
Figure 1Classic Mulitrait Multimethod Model.
Note: X and Y refer to two traits, subscripts 1 and 2 refer to two methods formeasuring a trait, b’s refer to indicator paths, 1’s are identification constraints, andsubscripts m and t refer to method and trait, respectively.
Table 1The Multitrait-Multimethod Covariance Matrix
Trait A Trait B
Method 1 Method 2 Method 1 Method 2
Trait A Method 1
Trait A Method 2
Trait B Method 1
Trait B Method 2
Note: The diagonal of this matrix contains variances and the off-diagonal contains
covariances.
904 Gonzalez & Griffin

unique random variance from method variance. See Kenny (1976) andWothke (1996) for more details.
In standard personality applications, the logic of the latent variableMTMM approach permits the researcher to separate method variance(reflected in the covariance between error variables), unique randomvariance (reflected in the error variance), and ‘‘true-score’’ traitvariance (reflected in the latent variable), to estimate reliability and toevaluate construct validity. Most important to our perspective, thislogical procedure provides a path for ‘‘going beyond’’ observedsimilarity and estimating a theory-based ‘‘deep structure’’ of theinterrelationships among the variables. Suppose the researcher wishedto use the logic of MTMM on the two traits of neuroticism andsociability, each measured by using two methods (self-report andbehavioral observation). In this case, the latent variable MTMM modelwould have a latent variable for neuroticism identified by twoobserved indicators—one for the self-report neuroticism scale andanother for the behavioral observation of neuroticism. Similarly,sociability would be a latent variable with two indicators (self-reportand behavioral). The model would also have a correlation between thelatent variables neuroticism and sociability, which is an estimate of thedisattenuated (i.e., corrected for measurement error) correlationbetween the two traits. Method variance would be modeled by havinga correlated path between the error variances of the two self-reportscales (estimating the shared variance due to ‘‘self-report’’) and acorrelated path between the error variances of the two behavioralobservations (estimating the shared variance due to ‘‘behavioralobservation’’). This model is presented graphically in Figure 1.
The deep structure of the MTMM technique is simple: decompose theobserved variances and covariances using a linear model. The linearmodel has each observed variable as a weighted sum of the latentvariable and the method variable. Indeed, the graph in Figure 1 isidentical to a system of linear equations that have correlations imposedbetween parameters. The decomposition of variance occurs because thedesign of the MTMM framework crosses (in a factorial sense) themethod factor with the trait factor. In equation form Figure 1 becomes
neuroticismm ¼ �n0 þ �ntraitn þ errornm
m¼ rt m¼ rm
sociabilitym ¼ �s0 þ �straits þ errorsm
ð1Þ
Modeling the Personality of Dyads and Groups 905
The subscripts n, s, t, and m refer to neuroticism, sociability, trait,and method, respectively. According to this model, the twoneuroticism observed scales have an identical linear structure butare allowed to have different error variances (one error variance forthe behavioral measure and one for the self-report measure; hence,the subscript m). Thus, there are actually two equations forneuroticism, with each equation having its own error term. Similarly,the two observed scales for sociability have an identical linearstructure. In addition to these equations, the model has a correlationimposed between the two latent traits and a correlation imposedbetween the two errors (denoted by the vertical doubleheadedarrows; note that there are two sets of error covariances, one foreach method). The intercepts are not depicted in Figure 1 becausewe are modeling the covariance matrix; consequently, the variablesare centered and the intercepts do not play a role in standardMTMM testing.
When testing this model, there are several constraints that may betested. For example, one may test whether the correlated errorbetween the two self-report scales is the same as the correlatederror between the two behavioral observations. This provides a testof whether the variances of the two method factors are identical;such a test will become useful in the next section when we applythe MTMM framework to dyads. With only two indicators perlatent variable, the analyst runs into the problem that more generalmodels (i.e., models with fewer constraints) may not be identified.Applications of MTMM, therefore, usually have more than twoindicators per latent variable, but we will keep our example at twoindicators for simplicity and to maintain the connection to thedyadic research.
We now turn to the latent group model of relationships, andshow its connection to the MTMM model. We then place thelatent group model within the framework of a hierarchical linearmodel.
Latent Variable Model of a Relationship
The common meaning of group personality, we argue, is analogousto the latent variable version of a nomological net—a network ofvariables and relationships, observed and unobserved, that define aconstruct. In particular, the lay conception of group personality is
906 Gonzalez & Griffin

based on similarity that is more than skin deep. Members of an‘‘entity’’ with a ‘‘personality’’ should act similarly (observedsimilarity within groups on some response), but this action levelshould reflect a deeper level of organization and coherence. Thiscoherence should be reflected in correlated similarities across relatedtraits. Thus, a dyadic or group personality must fulfill twomeasurement conditions: (1) similarity on each trait and (2)correlated similarity across related traits. The former is indexed bythe intraclass correlation within a trait and the latter is indexed bythe group-level correlation between latent group-level traits. In (2)we highlight the notion of convergent validity, but divergent validity(low correlated similarity across unrelated traits) applies as well.Note that in answering the question of whether an aggregate ofpeople act like an entity, we are focusing on one of the fourdimensions that Campbell (1958) suggested people use to decide ifan aggregate looks like an entity: similarity, common fate, proximity,and boundedness.
A model with an analogous structure to the MTMM model can beused in the analysis of interpersonal relationship data, and it provides aframework for testing the two measurement conditions. Here the traitresides within the couple instead of the individual because, for eachcouple, there are two measurements on each variable. For example, ifeach member of the couple completes a neuroticism scale, then we canconstruct a latent variable having two indicators for the group-levellatent variable: the neuroticism scale score from the husband and theneuroticism scale score from the wife. Such a latent variable can beinterpreted as the dyad level effect. We construct such a latent variablestructure for each variable and allow correlation between pairs oflatent groups.
Because each individual dyad member is measured on multiplevariables, we also need to allow for individual-level correlationsacross variables. For example, the male provides both neuroticism andsociability scores; thus, there could be a correlation between themale’s unique score neuroticism and his unique score on sociability(i.e., the unique variance of each scale could be correlated because thesame individual responds to both scales). Similarly, there would be acorrelation between the wife’s unique terms for neuroticism andsociability. These individual-level correlations indicate that theunderlying dyadic relation is not enough to explain the observedrelationships. Even if neurotic couples tend to be more (or less)
Modeling the Personality of Dyads and Groups 907

sociable couples, the more neurotic individual within a couple mayalso be more (or less) sociable.
The latent group model for dyads is depicted in Figure 2, which isidentical to Figure 1, except for the labels and constraints. Instead ofmultiple measures of a trait converging as indicators of an underlyinglatent trait, we have multiple individuals converging as indicators ofan underlying group trait. Instead of unique method causes creatingdifferences among measures of the same trait, we have uniqueindividual trait causes creating differences among measures of thesame trait. Instead of unique method causes that correlate acrossdifferent traits, we have unique individual effects that correlate acrossdifferent traits. Put together, we have a multilevel model thatdecomposes the set of observed relationships into group-level relationsand individual-level relations.
This latent variable dyad model was developed in detail byGonzalez and Griffin (1999, see also Kenny & La Voie, 1985), wherewe showed the connection between the latent variable approach and anidentical, though easier to compute and understand, pairwise approach.Most of the examples we use in the present paper focus ondistinguishable dyads, or dyads where the two members can becategorized into different classes (e.g., males and females, doctor andpatient, mentor and student). For examples involving exchangeablecouples, such as same-sex romantic couples where couple membershipis not distinguishable, see Griffin and Gonzalez (1995). We usecouples in our examples for simplicity, but the techniques are notlimited to couples and easily extend to groups.
Figure 2Latent Group Dyad Model. X and Y refer to two traits, subscripts w andh refer to wife and husband (respectively), 1’s are identification
constraints, and subscripts d refer to dyad-level.
908 Gonzalez & Griffin
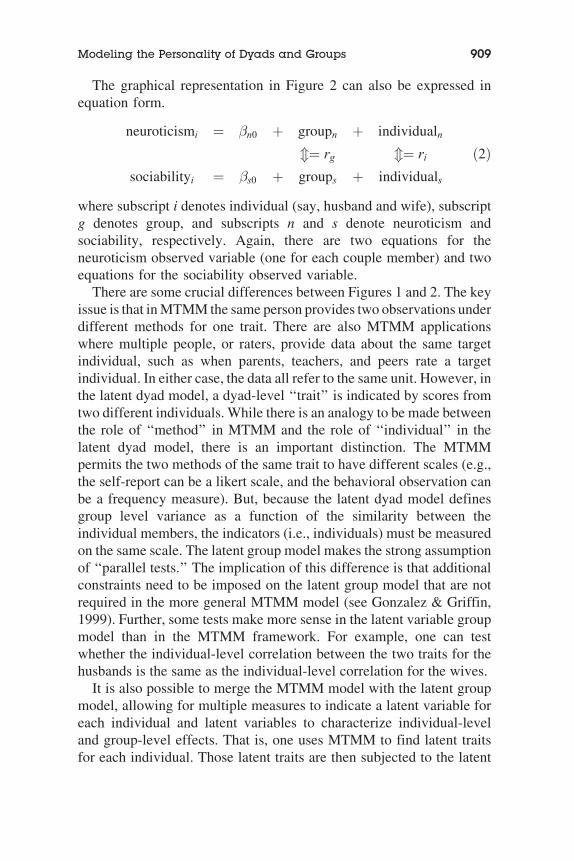
The graphical representation in Figure 2 can also be expressed inequation form.
neuroticismi ¼ �n0 þ groupn þ individualn
m¼ rg m¼ ri
sociabilityi ¼ �s0 þ groups þ individuals
ð2Þ
where subscript i denotes individual (say, husband and wife), subscriptg denotes group, and subscripts n and s denote neuroticism andsociability, respectively. Again, there are two equations for theneuroticism observed variable (one for each couple member) and twoequations for the sociability observed variable.
There are some crucial differences between Figures 1 and 2. The keyissue is that in MTMM the same person provides two observations underdifferent methods for one trait. There are also MTMM applicationswhere multiple people, or raters, provide data about the same targetindividual, such as when parents, teachers, and peers rate a targetindividual. In either case, the data all refer to the same unit. However, inthe latent dyad model, a dyad-level ‘‘trait’’ is indicated by scores fromtwo different individuals. While there is an analogy to be made betweenthe role of ‘‘method’’ in MTMM and the role of ‘‘individual’’ in thelatent dyad model, there is an important distinction. The MTMMpermits the two methods of the same trait to have different scales (e.g.,the self-report can be a likert scale, and the behavioral observation canbe a frequency measure). But, because the latent dyad model definesgroup level variance as a function of the similarity between theindividual members, the indicators (i.e., individuals) must be measuredon the same scale. The latent group model makes the strong assumptionof ‘‘parallel tests.’’ The implication of this difference is that additionalconstraints need to be imposed on the latent group model that are notrequired in the more general MTMM model (see Gonzalez & Griffin,1999). Further, some tests make more sense in the latent variable groupmodel than in the MTMM framework. For example, one can testwhether the individual-level correlation between the two traits for thehusbands is the same as the individual-level correlation for the wives.
It is also possible to merge the MTMM model with the latent groupmodel, allowing for multiple measures to indicate a latent variable foreach individual and latent variables to characterize individual-leveland group-level effects. That is, one uses MTMM to find latent traitsfor each individual. Those latent traits are then subjected to the latent
Modeling the Personality of Dyads and Groups 909

group model to separate the (second order) individual-level and group-level latent variables.
The Latent Group Approach in the Context of aHierarchical Linear Model
In this section we connect concepts from the previous section tohierarchical linear modeling (HLM; also known as multi-levelmodeling), a technique that is growing in popularity. HLM is atechnique that allows the estimation of random and nested effects in amore general way than traditional analysis of variance treatments (see,e.g., Bryk & Raudenbush, 1992). There are now several computerprograms that can do HLM analyses; the most well-known are HLM(Bryk & Raudenbush, 1992; the program and the technique are notsynonymous), MLwin, and PROC MIXED.
Sampling and Factorial Decomposition
There are additional similarities and differences to highlight betweenthe MTMM and the latent variable dyadic models. The MTMM modelis based on the standard psychometric assumption that eachobservation is modeled as a sum of intercept plus true score plus amethod term. Thus, under MTMM we have
observed score ¼ intercept þ true score þ method score ð3Þ
The latent variable dyad model has the same underlying mathema-tical structure, but there are some minor differences in interpretation.The sampling model is that there is a population of dyad effects ratherthan a population of true scores for each individual. Each dyad that issampled into the study brings a group-level score, and each member ofthe dyad has an individual effect (analogous to the method effect in theMTMM).1 Thus, under the latent variable dyad model
observed score ¼ intercept þ group score þ individual score ð4Þ
1. In the simplest case, where each member of the couple provides one score, it is
not possible to separate measurement error related to the scale from individual-
level variance. However, when each individual provides more than one observation
of the same trait, then additional decomposition is possible. The section of this
paper examining temporal stability provides one framework for dealing with such
multiple observations.
910 Gonzalez & Griffin

The structure of these equations is identical to a two-level model inthe context of HLM. Those familiar with the logic of HLM willrecognize the classic ‘‘slopes as outcomes’’ model. In the classicmodel, a slope is estimated at level one (e.g., the regression of anindividual’s reported well-being on the individual’s level of dailystress, using data collected over several days; intuitively, running aregression separately for each subject). At level two the slopes fromeach individual serve as an outcome for yet another regression on anindividual-difference variable (e.g., self-esteem).
In our simple model, there is no slope, only an intercept. As shownbelow, level one is the random intercept, and the second level is alinear model of that random intercept term. For example, in the case ofthe latent group model the two levels would be:
Y ¼ �þ individual effect ð5Þ
� ¼ �0 þ group effect ð6Þ
with Y being the dependent variable, � the random effect group mean,and �0 the fixed constant (or grand mean term). The ‘‘group effect’’ isequivalent to the group mean minus the grand mean, much liketreatment effects in the context of an ANOVA. But keep in mind thatin the present model the group is treated as a random effect. This isknown as a random intercept model because at level one � plays therole of an intercept that varies by group (each group has its own �).2
Additional individual-level predictors, or covariates, can be added inEquation 5; additional group-level predictors, or covariates can beadded in Equation 6.
Statistical programs provide several methods to estimate theparameters, with the two most popular being maximum likelihood(ML) and restricted maximum likelihood (REML). As far as thechoice between these two estimation procedures (ML and REML),they are asymptotically equivalent. But, for small numbers of dyads(say, less than 20 dyads), the two methods tend to yield differentparameter estimates. Because REML takes degrees of freedom intoaccount, it is the preferred method in the case of few dyads (this
2. Subscripts can be distracting when discussing HLM models, so we omit them for
sake of expositional clarity (even though we sacrifice mathematical rigor).
Modeling the Personality of Dyads and Groups 911

advice is especially relevant in applications where there are fewdata points to parameters).
The Intraclass Correlation
The previous subsection reviewed two equations (Equations 3 and 4)that had parallel structures. This simple structure leads to thewell-known intraclass correlation (ICC), which is a natural measureof similarity or reliability. The ICC is a ratio of true-score variancedivided by the sum of the true-score variance plus error variance. Indifferent applications, the true-score variance can take on differentinterpretations, and the computation of the error variance can also differ.The general formulation of the intraclass correlation in symbols takes onthe following form: if � denotes the term of interest (e.g., true-scorevariance) and � denotes the error term, then the ICC is given by
�2�
�2� þ �2
�
ð7Þ
The intraclass correlation provides a normalization of the (shared)variance of interest. In the MTMM context (Equation 3) the term ofinterest is the individual’s ‘‘true score’’ on a trait. Consider the casewhen neuroticism is measured both by self-report and by a behavioralmeasure, and the researcher acknowledges that each method hasspecific systematic effects. By using two methods, he or she hopes tocancel the unique impact of both methods, thus arriving at a betterestimate of the underlying neuroticism score. Reporting the true scorevariance by itself would be difficult to interpret; hence it is normalizedby Equation 7.
In the context of interpersonal research (Equation 4), the term ofinterest is the ‘‘group true score,’’ inferred from the similarity ofresponses for individuals in the same group. Again, the intraclasscorrelation provides a normalization of the group-level variance and, inthis context, carries the interpretation of true similarity, convergence,or resemblance. For example, when neuroticism is measured for boththe wife and the husband, the researcher wishes to arrive at a measureof convergence in the neuroticism scores. Here convergence, or‘‘shared variance,’’ has a very special meaning because it refers toabsolute similarity (Gonzalez & Griffin, 2001). Similarity is high whenboth members of the couple respond identically. This differs from, say,
912 Gonzalez & Griffin
the Pearson correlation between the husband and wife, which couldbe perfect even when the scores from the two individuals do notperfectly agree (e.g., the wife always responds some amount higherthan the husband).
Equation 7 provides a general formulation of the intraclasscorrelation that can also be used in the case of hierarchical linearmodels. The output of an HLM program provides both variance termsneeded to compute Equation 7. Current HLM programs do notcompute the ICC automatically, nor do they print the ICC in theoutput; the ICC must be computed by the user, using the variancecomponent terms that appear in the output and Equation 7.
Recall that HLM programs tend to have two options for theestimation of variance components: maximum likelihood andrestricted maximum likelihood. These two estimation routines leadto different variance estimates, but Equation 7 is used to compute theICC regardless of which estimation technique was used. The pairwiseICC that we reviewed in our previous work (Griffin & Gonzalez,1995; Gonzalez & Griffin, 1999) is identical to the maximumlikelihood ICC; the ANOVA ICC, which may be more familiar topsychologists (see, e.g., Kenny & La Voie, 1985), is identical to therestricted maximum likelihood ICC. Both of these exact equivalenceshold only when all groups of are equal size, such as couples of size 2,families of size 5, or juries of size 12.
Multivariate Latent Group Model
Our discussion of the intraclass correlation and its correspondinglinear model (e.g., Equation 4) focused on one dependent variable. Webegan the paper by discussing an example involving two traits(neuroticism and sociability), and, of course, psychological researchfrequently involves multiple dependent variables. Furthermore, wehave argued that the concept of a relationship personality isfundamentally based on a coherent network of shared tendencies (amultivariate concept). We now extend the models we have presentedto the multivariate case (for expositional clarity, we illustrate themodel for two variables, but any number of variables is possible).
Let’s look at a concrete example. Each individual in a study ofsame-sex roommate pairs is given an neuroticism scale and a self-report sociability scale. For each scale, we can compute the intraclasscorrelation using the techniques presented in the previous section. We
Modeling the Personality of Dyads and Groups 913
now seek to extend the HLM formulation to handle the multivariatelatent group model depicted in Figure 2.
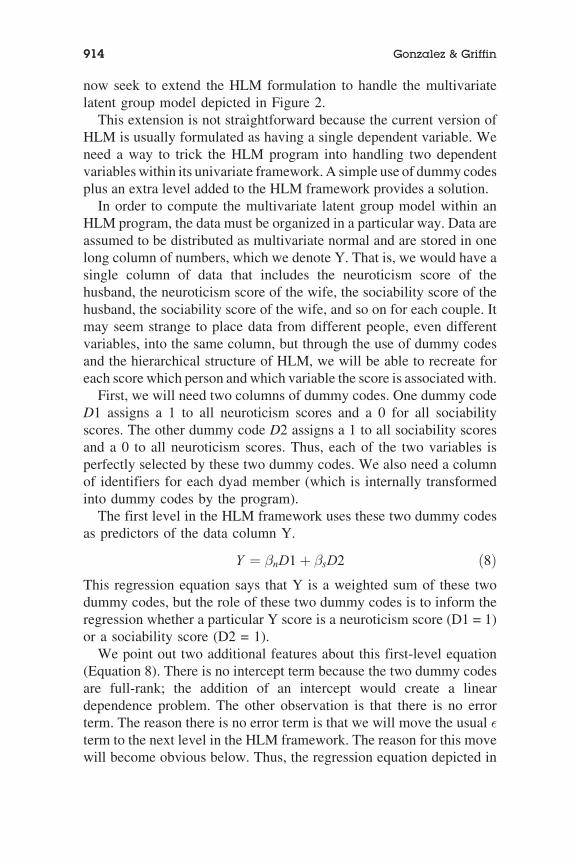
This extension is not straightforward because the current version ofHLM is usually formulated as having a single dependent variable. Weneed a way to trick the HLM program into handling two dependentvariables within its univariate framework. A simple use of dummy codesplus an extra level added to the HLM framework provides a solution.
In order to compute the multivariate latent group model within anHLM program, the data must be organized in a particular way. Data areassumed to be distributed as multivariate normal and are stored in onelong column of numbers, which we denote Y. That is, we would have asingle column of data that includes the neuroticism score of thehusband, the neuroticism score of the wife, the sociability score of thehusband, the sociability score of the wife, and so on for each couple. Itmay seem strange to place data from different people, even differentvariables, into the same column, but through the use of dummy codesand the hierarchical structure of HLM, we will be able to recreate foreach score which person and which variable the score is associated with.
First, we will need two columns of dummy codes. One dummy codeD1 assigns a 1 to all neuroticism scores and a 0 for all sociabilityscores. The other dummy code D2 assigns a 1 to all sociability scoresand a 0 to all neuroticism scores. Thus, each of the two variables isperfectly selected by these two dummy codes. We also need a columnof identifiers for each dyad member (which is internally transformedinto dummy codes by the program).
The first level in the HLM framework uses these two dummy codesas predictors of the data column Y.
Y ¼ �nD1 þ �sD2 ð8ÞThis regression equation says that Y is a weighted sum of these twodummy codes, but the role of these two dummy codes is to inform theregression whether a particular Y score is a neuroticism score (D1 = 1)or a sociability score (D2 = 1).
We point out two additional features about this first-level equation(Equation 8). There is no intercept term because the two dummy codesare full-rank; the addition of an intercept would create a lineardependence problem. The other observation is that there is no errorterm. The reason there is no error term is that we will move the usual �term to the next level in the HLM framework. The reason for this movewill become obvious below. Thus, the regression equation depicted in
914 Gonzalez & Griffin

Equation 8 can be viewed as a ‘‘switching regression’’ because the onlypurpose it serves is to estimate either �n if a particular Y score is anneuroticism score or �s if a particular Y score is a sociability score. Oneneeds to be careful when dealing with specific HLM programs. Forexample, note that in Equation 8 there is no error term. In the programMLwin, it is easy to omit the usual � term at level 1; whereas, in theHLM program, one needs to use the latent variable feature availablewithin the program in order to omit the � term at a level 1.
These two �’s from level 1 are then modeled as random effects,which is how the error term � works its way into the regression. Recallthe linear form of ‘‘group score + individual score’’ that we reviewedabove. Conceptually, each of the �s (one corresponding to neuroticismand the other corresponding to sociability) will be modeled in terms ofthis simple linear form. That is,
�n ¼ interceptn þ vng þ uni ð9Þ�s ¼ intercepts þ vsg þ usi ð10Þ
where v and u are random effects that code group and individual terms(respectively), each equation has its own fixed effect intercept term,the subscripts n, s, g, and i refer to neuroticism, sociability, group andindividual, respectively. The random effect v is defined with respect toa classification variable that codes group number and the randomeffect u is defined with respect to a classification variable that codesindividuals. In short, the switching regression (level 1) serves to isolatethe two variables; then, the next level builds a linear regressionseparately for each variable.
We next need to force a covariance structure on each of the randomeffects v (group level) and u (individual level). Let the group-level v’sbe bivariate normally distributed with covariance matrix
�v ¼�2vn
�vns �2vs
" #ð11Þ
where n and s denote neuroticism and sociability, respectively. Thismeans that the random effect v associated with neuroticism hasvariance svn
2 , random effect v associated with sociability has variancesvs
2, and the two v’s have covariance svns. Similarly, an analogouscovariance is imposed on the two individual-level u’s
�u ¼ �2un
�uns �2us
� �ð12Þ
Modeling the Personality of Dyads and Groups 915

This covariance matrix �u gives the variances and covariance betweenneuroticism and sociability at the individual level. In this formulation,we require equality of all individual-level correlations (i.e., referringback to Figure 2, this HLM implementation forces the two individual-level correlations to be identical). In sum, these two covariancematrices contain information about group level and individual levelvariance for, and covariance between, the two variables. We next showhow the information given in these matrices can be used to computethe terms in the latent group model.
While the notation of the model may appear complicated, the setupautomatically provides the four critical terms in the latent model: theintraclass correlations for each variable (which provide a measure ofagreement within each variable), the group level correlation rg, and theindividual level correlation ri. These four correlations are computedas follows:
intraclass correlation for neuroticism:
�2vn
�2vn þ �2
un
intraclass correlation for sociability:
�2vs
�2vs þ �2
us
individual level correlation between neuroticism and sociability:
�unsffiffiffiffiffiffiffiffiffiffiffiffiffi�2un�
2us
pdyad level correlation between neuroticism and sociability:
�vnsffiffiffiffiffiffiffiffiffiffiffiffi�2vn�
2vs
pThe two intraclass definitions are identical to what we presented in aprevious section. The form of the individual and dyad level
916 Gonzalez & Griffin

correlations is the usual correlation (a covariance divided by thesquare root of a product of variables). The individual-level correlationuses terms from the individual-level covariance matrix u, and thegroup-level correlation uses terms from the group-level covariancematrix v. Thus, these two covariance matrices yield the intraclasscorrelations, the variances of the individual and group-level latentvariables, and also yield the two doubleheaded arrows of Equation 2indicating individual and group-level correlation between twovariables, or traits. The HLM framework maps onto the latent grouprelationship model we presented earlier.
Technically, this is a three-level HLM model. The first level is theswitching regression (Equation 8). The way we wrote the next part(Equation 9) may suggest that it is only one level. But recall how weimplemented the intraclass correlation in the context of HLM above(Equation 5): the ‘‘group variance plus individual variance’’ logic itselfrequired two levels. Thus, the way we wrote the second level(Equation 9) implies two levels. In the context of the switchingregression (which is level 1), these two new levels become levels 2 and 3.
To provide some intuition to the various terms that are involved inthe model, we refer to Figure 3, which is designed to illustrate theconcepts with a demonstration data set of four couples. These plots
Figure 3Demonstration data set with four couples. Left panel has high
intraclass correlations on both variables (0.75), high individual-levelcorrelation (0.90) and high dyad-level correlation (0.80). Right
panel has high intraclass on neuroticism (0.75), zero intraclass onsociability, high individual-level correlation (0.95), and zerodyad-level correlation. Different symbols are used to indicate
couples. Line segments connecting symbols represent the sameindividual’s score on neuroticism and sociability.
Modeling the Personality of Dyads and Groups 917
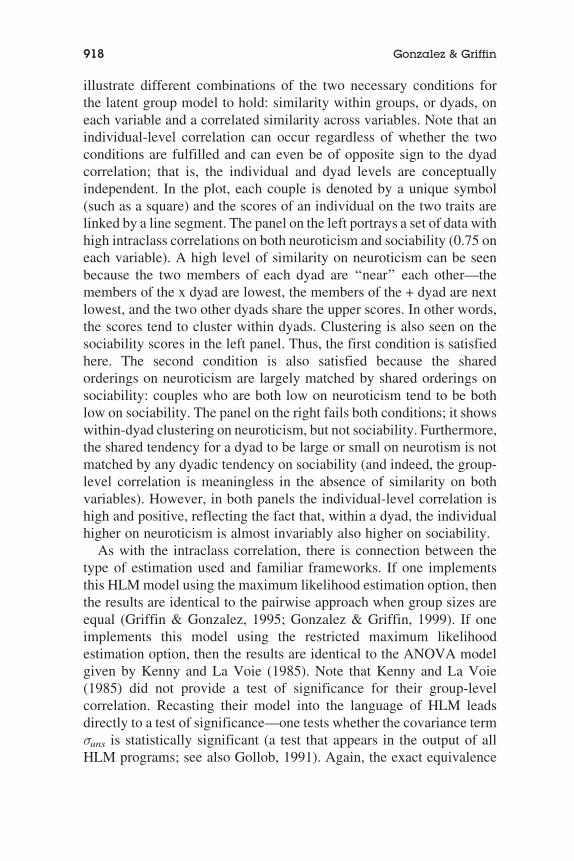
illustrate different combinations of the two necessary conditions forthe latent group model to hold: similarity within groups, or dyads, oneach variable and a correlated similarity across variables. Note that anindividual-level correlation can occur regardless of whether the twoconditions are fulfilled and can even be of opposite sign to the dyadcorrelation; that is, the individual and dyad levels are conceptuallyindependent. In the plot, each couple is denoted by a unique symbol(such as a square) and the scores of an individual on the two traits arelinked by a line segment. The panel on the left portrays a set of data withhigh intraclass correlations on both neuroticism and sociability (0.75 oneach variable). A high level of similarity on neuroticism can be seenbecause the two members of each dyad are ‘‘near’’ each other—themembers of the x dyad are lowest, the members of the + dyad are nextlowest, and the two other dyads share the upper scores. In other words,the scores tend to cluster within dyads. Clustering is also seen on thesociability scores in the left panel. Thus, the first condition is satisfiedhere. The second condition is also satisfied because the sharedorderings on neuroticism are largely matched by shared orderings onsociability: couples who are both low on neuroticism tend to be bothlow on sociability. The panel on the right fails both conditions; it showswithin-dyad clustering on neuroticism, but not sociability. Furthermore,the shared tendency for a dyad to be large or small on neurotism is notmatched by any dyadic tendency on sociability (and indeed, the group-level correlation is meaningless in the absence of similarity on bothvariables). However, in both panels the individual-level correlation ishigh and positive, reflecting the fact that, within a dyad, the individualhigher on neuroticism is almost invariably also higher on sociability.
As with the intraclass correlation, there is connection between thetype of estimation used and familiar frameworks. If one implementsthis HLM model using the maximum likelihood estimation option, thenthe results are identical to the pairwise approach when group sizes areequal (Griffin & Gonzalez, 1995; Gonzalez & Griffin, 1999). If oneimplements this model using the restricted maximum likelihoodestimation option, then the results are identical to the ANOVA modelgiven by Kenny and La Voie (1985). Note that Kenny and La Voie(1985) did not provide a test of significance for their group-levelcorrelation. Recasting their model into the language of HLM leadsdirectly to a test of significance—one tests whether the covariance term�uns is statistically significant (a test that appears in the output of allHLM programs; see also Gollob, 1991). Again, the exact equivalence
918 Gonzalez & Griffin

of the pairwise latent group model and maximum likelihood HLM onthe one hand and the equivalence of the ANOVA-based group-levelmodel and restricted maximum likelihood on the other hand holds onlywhen all groups have the identical size. A benefit of the HLMframework is that it can handle groups of unequal size.
Readers familiar with HLM may recognize another dummy codetechnique that has appeared in the literature (Barnett, Marshall,Raudenbush, & Brennan, 1993). Their method is a special case of theone proposed in this paper. In the Barnett et al. framework, eachmember of the couple provided two parallel scales of the same trait.Barnett et al. used the switching regression technique to have separateregression equations for each dyad member (unlike in our case, wherewe used the switching regression to code for variable). That is, theycreated a dummy code for women and another dummy code for men.Because their design had parallel scales they assumed the individualerror variances were the same for the two scales, and they placed theusual error term � at level 1 (the level of the switching regression).This forced men and women subjects to have the same error varianceon the scale (and the parallel versions of the scale to also have equaland independent variances). The effect of this assumption was toeliminate the individual v covariance matrix (i.e., the variances wereassumed equal, and errors were assumed independent, so thecovariance was fixed at zero). Thus, their model does not permit anestimation of the analog to the individual-level correlation. This is thereason the specification we suggest places the � terms at a higher level,so a covariance matrix can be estimated, thus allowing differentvariances and nonindependence of error terms.
Time Passages: Latent Variable DyadicModel Over Time
One of the fundamental contributions of personality theories has beento alert psychologists to the importance of measuring and theorizingabout stability. Stability, or temporal consistency, has become anecessary criterion for the establishment of a trait. Given that thepresent paper argues that there is psychological meaning to the grouplevel variance and covariance, it is important to establish the stabilityof the group level variance when doing empirical work.
A design feature that must be added in order to assess the stabilityof the group level variance is time—participants need to be assessed
Modeling the Personality of Dyads and Groups 919

more than once. For simplicity in exposition, we assume that theinvestigator has two time points and each member of the coupleresponds to neuroticism and sociability scales at each of those twopoints in time. Conceptually, we can estimate the latent group model(i.e., the model depicted in Figure 2) separately at each time. Butrather than doing two separate estimations (one for time 1 and onefor time 2), it is appropriate to estimate the entire modelsimultaneously (i.e., the latent group model at both times together).The benefit of such a simultaneous model is that one can estimatethe stability of the latent variable terms. This can be done byallowing correlations between all time 1 latent variables and all time2 latent variables.
Figure 4 shows the group-level subset of this complicated model.Note that at time 1 there is the group-level correlation between X andY, and at time 2 there is also a group-level correlation between X andY. Thus, within the two times separately, we are recreating the group-level portion we have already discussed (e.g., Figure 2). The newfeature in Figure 4 is that there are now across-time correlationsbetween group-level latent variables—a correlation between the two Xlatent variables and another correlation between the two Y latentvariables. These two correlations provide estimates of the group-levelstability for each variable. As is customary within the SEM framework,it is possible to perform additional analyses (such as moderation andmediation) to get a deeper understanding of the contributors to group-level stability. What we show here is how to measure stability of group-level variance, but once it is measured, then the usual statisticaltechniques can be used (e.g., testing whether different types of groupshave, or different manipulations lead to, more group-level stability).
Figure 4Stability of the Shared Variance Components.
Note: the Figure displays the group level variance for variables X and Y, for each oftwo times. The correlations rg1 and rg2 are the group level correlations betweenvariables X and Y at time 1 and time 2, respectively; the correlations rx and ry measurethe stability of the group-level variance for variables X and Y, respectively.
920 Gonzalez & Griffin

The analogous stability coefficients would also be estimated for theindividual-level variances, such as error for males’ sociability at time 1is allowed to be correlated with the error of males’ sociability at time 2,etc. (Figure 4 only displays the group-level stability estimates).
This model can also be placed into an HLM format. This appearscomplicated because an extra level needs to be added to handle time;however, an important advantage of estimating stability in the context ofHLM is the ability to handle missing data, which is one of the keymethodological advances to come out of research on HLM. The analysisof the latent group model can even be conducted when some groupshave data from only one member (e.g., Snijders & Bosker, 1999). TheseHLM techniques also permit ‘‘units’’ of unequal sizes. So, if the unit isthe individual with up to, say, four time points, then one way to handlemissing data would be to treat the ‘‘missingness’’ as something thatyields unequal sized units. The general HLM framework can thushandle missing observations in a longitudinal design as well as groupsof unequal sizes (as would be encountered, for example, in researchwhere family is the unit of analysis); for a complete discussion, seeBryk and Raudenbush (1992). For an example of a longitudinal designin HLM for couple research using a single dependent variable, seeBarnett, Raudenbush, Brennan, Pleck, and Marshall (1995).
Limitations and Complications
We have presented the latent group model as a formal checklist ofconditions that need to be satisfied to infer the existence of a ‘‘grouppersonality.’’ As we noted in the beginning, this logic corresponds to alay theory rather than to personality theory more generally. Inparticular, although we have considered whether the underlyingconstruct is a relatively enduring characteristic, we have neglectedthe second key question of whether that enduring characteristic isappropriately termed a disposition or even a predisposition. There is analternative explanation for the coherence that we sought, one thatcannot be dismissed with the types of data discussed so far—that is,that all members of a group respond similarly because of sharedsituational or environmental pressures. One particularly interestingversion of this model is that the key environmental pressure is thepresence of the other partner and that the observed coherence in factrepresents mutual influence rather than a shared underlying disposition.These and related models are discussed in the context of personal
Modeling the Personality of Dyads and Groups 921
relationships by Kenny (1996). Further, the source of the similarityneeds to be established. Is group-level variance present at the beginningof the relationship or does it emerge over time? Clearly, there arevariety of design tools that can be used to tease apart the varioustheoretical models of shared coherence (observations across multiplesituations, observations across multiple time periods, observationswhen group members are interacting within, versus outside of, thegroup), and these models and manipulations will only serve to enrichthe meeting point of personality theory and group theory.
The usual structural equations modeling considerations aboutsample size apply for the latent group model and its equivalent inthe HLM context (see, e.g., Bollen, 1989). Our simulations (Griffin &Gonzalez, 1995; Gonzalez & Griffin, 1999) suggest that sample sizesas small as 30 dyads perform well with respect to Type I error ratesand bias, but a complete analysis of sample size (especially underviolations of distributional assumptions) has not yet been completed.
Summary
Our goal for this paper was to present a methodology for assessing thepersonality of a relationship, a concept that is not equivalent to the‘‘sum’’ of the individuals who make up the relationship. We showed howthe logic of the MTMM technique, which is familiar in personalityresearch to measure the reliability and validity of constructs, can beextend to model the similarity of the members in the relationship.Following Campbell and Fiske (1959), such similarity is a necessarycondition for the measurement of a group-level personality. The latentgroup model permits the decomposition of individual-level and group-level variance. Once the latent variables at the different levels are iden-tified, then covariances between such latent variables across differenttraits can then be examined. Our exposition focused on covariancesbetween latent variables, but one can also model directed paths betweensuch latent variables (e.g., the group-level latent variable of one traitmediating the group-level latent covariance between two traits). For anexample of such an extension, see Gonzalez and Griffin (2000).
An important criterion in establishing the existence of a trait isthe concept of stability, which is second nature to personality theorists.The present framework permits the assessment of stability at both theindividual and group levels. We believe the capacity to assess stabilityat different levels will be a useful tool for researchers. For example,
922 Gonzalez & Griffin

longitudinal analyses following the development of an intimaterelationship (and perhaps the breakup) will be able to assess the timecourse of the individual-level and group-level variances. This willprovide theorists new patterns to explain and may push the envelope ofcurrent theory of interpersonal relationships. We hope this will promptresearchers to ask new questions, such as, Does group-level variance attime t predict individual-level variance at time t + 1? Does group-levelvariance, a measure of a particular relationship-level trait, predictsubsequent breakup? How does the magnitude of group-level varianceon a particular variable change as a nature of the relationship changes?
We presented several techniques and emphasized their similarity.For example, we showed how the latent group model can be estimatedin the context of hierarchical linear modeling. Our hope was that bydiscussing the various techniques in the same paper, highlighting thesimilarity of the underlying logic, the reader would gain a betterunderstanding of the methods. The reader should not be overwhelmedby the complexity of the menu of choices. Rather, our intention was toplace several techniques in a common language to provide clarity forpersonality researchers wishing to enter relationships research. Manyof the intuitions and techniques a personality researcher is familiar withfrom MTMM can be extended to the study of relationships. Armed withthis analogy, techniques and theories from the personality literature canbe applied to the study of relationship as well as to the study of whetherthere are separate individual-level and group-level personalities.
We hope that this paper has helped reframe the question ‘‘How shouldI analyze my relationship data’’ to the more meaningful question: ‘‘Howcan I bring personality methods and theory to bear in understandinginterpersonal relationships?’’ We showed how a standard tool frompersonality research, the MTMM, can be adapted to the study ofrelationships. We await the interesting empirical and theoretical insightsabout relationships that we hope will emerge from the application ofpersonality theory and its methodology to the study of relationships.
REFERENCES
Allport, F. H. (1924). The group fallacy in relation to social science. Journal of
Abnormal and Social Psychology, 19, 60–73.
Barnett, R. C., Marshall, N. L., Raudenbush, S. W., & Brennan, R. T. (1993). Gender
and the relationship between job experiences and psychological distress: A study of
dual-earner couples. Journal of Personality and Social Psychology, 64, 794–806.
Modeling the Personality of Dyads and Groups 923
Barnett, R. C., Raudenbush, S. W., Brennan, R. T., Pleck, J. H., & Marshall, N. L.
(1995). Change in job and marital experiences and change in psychological
distress: A longitudinal study of dual-earner couples. Journal of Personality and
Social Psychology, 69, 839–850.
Bollen, K. A. (1989). Structural equations with latent variables. New York:
John Wiley.
Bryk, A. S., & Raudenbush, S. W. (1992). Hierarchical linear models: Applications
and data analysis methods. Newbury Park: Sage.
Campbell, D. T. (1958). Common fate, similarity, and other indices of the status of
aggregates of persons as social entities. Behavioral Science, 3, 14–25.
Campbell, D. T., & Fiske, D. W. (1959). Convergent and discriminant validation by
the multitrait-multimethod matrix. Psychological Bulletin, 56, 81–105.
Cronbach, L. J., & Meehl, P. (1955). Construct validation in psychological tests.
Psychological Bulletin, 52, 281–302.
Gollob, H. F. (1991). Methods for estimating individual- and group-level correlations.
Journal of Personality and Social Psychology, 60, 376–381.
Gonzalez, R., & Griffin, D. (1999). The correlational analysis of dyad-level data in the
distinguishable case. Personal Relationships, 6, 449–469.
Gonzalez, R., & Griffin, D. (2000). The statistics of interdepenence: Treating dyadic
data with respect. In W. Ickes & S. W. Duck (Eds.), The social psychology of
personal relationships. Chichester, UK: Wiley.
Gonzalez, R., & Griffin, D. (2001). A statistical framework for modeling homogeneity
and interdependence in groups. In M. Clark & G. Fletcher (Eds.), Handbook of
social psychology, Vol 2: Interpersonal processes (pp. 505–534). Malden, MA:
Blackwell.
Griffin, D., & Gonzalez, R. (1995). The correlational analysis of dyad-level data:
Models for the exchangeable case. Psychological Bulletin, 118, 430–439.
Kenny, D. A. (1976). An empirical application of confirmatory factor analysis to the
multitrait-multimethod matrix. Journal of Experimental Social Psychology, 12,
247–252.
Kenny, D. A. (1996). Models of non-independence in dyadic research. Journal of
Social and Personal Relationships, 13, 279–294.
Kenny, D. A., & La Voie, L. (1985). Separating individual and group effects. Journal
of Personality and Social Psychology, 48, 339–348.
Mead, G. H. (1934). Mind, self, and society. Chicago: University of Chicago Press.
Snijders, T., & Bosker, R. (1999). Multilevel analysis: An introduction to basic and
advanced multilevel modeling. Thousand Oaks, CA: Sage.
Wothke, W. (1996). Models for multitrait-mulitmethod matix analysis. In G. A.
Marcoulides & R. E. Schumacker (Eds.), Advanced structural equation modeling:
Issues and techniques (pp. 7–56). Mahwah, NJ: Lawrence Erlbaum.
924 Gonzalez & Griffin


![Personality and Preference Modeling for Adaptive Storytelling€¦ · approach, Seif El -Nasr [8] presents an interactive storytelling system where both player behavior and personality](https://static.fdocuments.us/doc/165x107/5fd98d9e0d486e30bb329352/personality-and-preference-modeling-for-adaptive-approach-seif-el-nasr-8-presents.jpg)


