modeling the fourier transform near infrared spectrum of unreacted ...
68
MODELING THE FOURIER TRANSFORM NEAR INFRARED SPECTRA OF UNREACTED STARCH IN CORN FOR MONITORING APPLICATIONS BY BENJAMIN M. PLUMIER THESIS Submitted in partial fulfillment of the requirements for the degree of Master of Science in Agricultural and Biological Engineering in the Graduate College of the University of Illinois at Urbana-Champaign, 2013 Urbana, Illinois Thesis Committee: Assistant Professor Mary-Grace Danao, Chair and Director of Research Associate Professor Vijay Singh Associate Professor Kent Rausch
Transcript of modeling the fourier transform near infrared spectrum of unreacted ...

MODELING THE FOURIER TRANSFORM NEAR INFRARED SPECTRA OF UNREACTED STARCH IN CORN FOR MONITORING APPLICATIONS
BY
BENJAMIN M. PLUMIER
THESIS
Submitted in partial fulfillment of the requirements for the degree of Master of Science in Agricultural and Biological Engineering
in the Graduate College of the University of Illinois at Urbana-Champaign, 2013
Urbana, Illinois
Thesis Committee:
Assistant Professor Mary-Grace Danao, Chair and Director of Research Associate Professor Vijay Singh Associate Professor Kent Rausch
ii
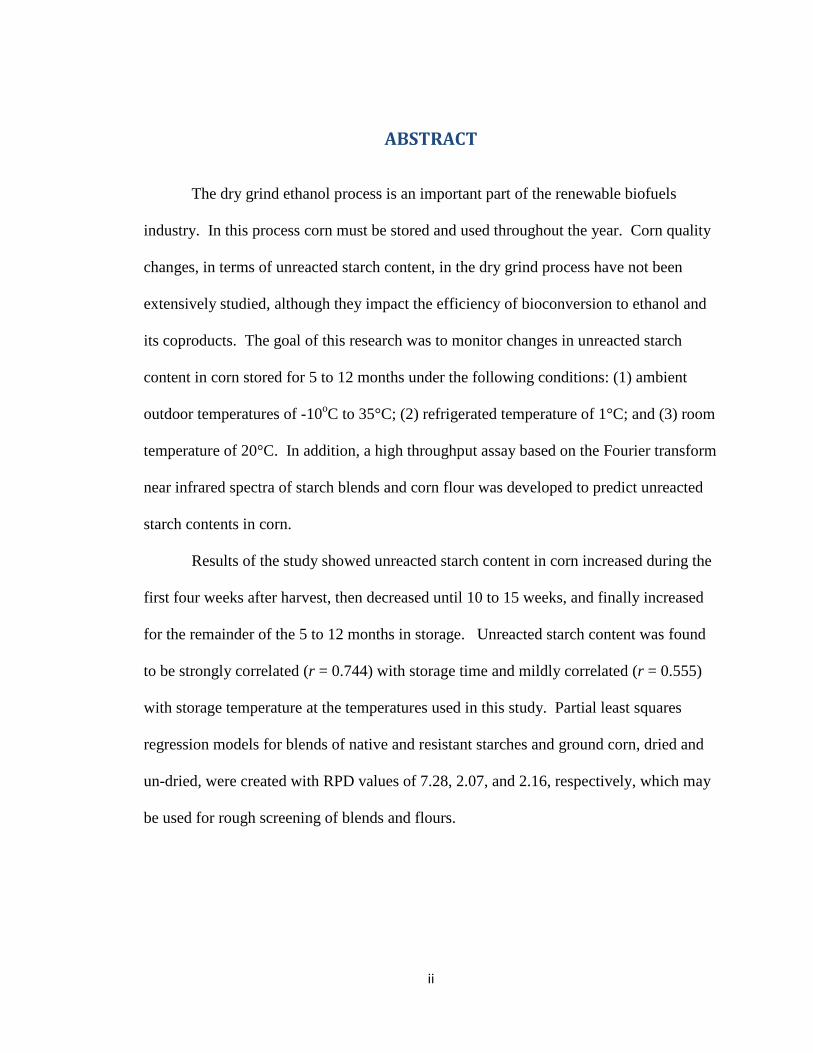
ABSTRACT
The dry grind ethanol process is an important part of the renewable biofuels
industry. In this process corn must be stored and used throughout the year. Corn quality
changes, in terms of unreacted starch content, in the dry grind process have not been
extensively studied, although they impact the efficiency of bioconversion to ethanol and
its coproducts. The goal of this research was to monitor changes in unreacted starch
content in corn stored for 5 to 12 months under the following conditions: (1) ambient
outdoor temperatures of -10oC to 35°C; (2) refrigerated temperature of 1°C; and (3) room
temperature of 20°C. In addition, a high throughput assay based on the Fourier transform
near infrared spectra of starch blends and corn flour was developed to predict unreacted
starch contents in corn.
Results of the study showed unreacted starch content in corn increased during the
first four weeks after harvest, then decreased until 10 to 15 weeks, and finally increased
for the remainder of the 5 to 12 months in storage. Unreacted starch content was found
to be strongly correlated (r = 0.744) with storage time and mildly correlated (r = 0.555)
with storage temperature at the temperatures used in this study. Partial least squares
regression models for blends of native and resistant starches and ground corn, dried and
un-dried, were created with RPD values of 7.28, 2.07, and 2.16, respectively, which may
be used for rough screening of blends and flours.

iii
Acknowledgments
A special thanks to the Jonathon Baldwin Turner Fellowship and to Novozymes
for providing funding to support my graduate thesis research. Special thanks to the
following individuals, including my thesis committee, for their technical assistance and
advice: Shih-Fang Chen, Mary-Grace Danao, Haibo Huang, Wei Liu, Kent Rausch, and
Vijay Singh. Thanks also to my family and friends for their continuous support.
iv
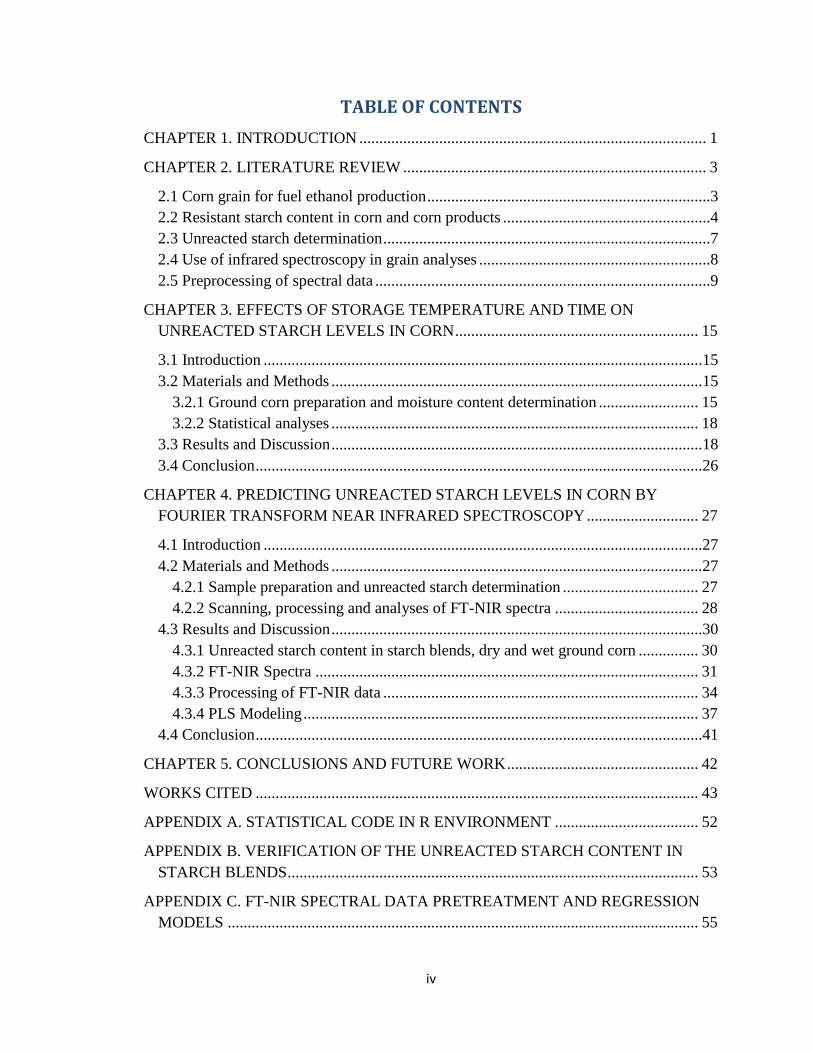
TABLE OF CONTENTS
CHAPTER 1. INTRODUCTION ....................................................................................... 1
CHAPTER 2. LITERATURE REVIEW ............................................................................ 3
2.1 Corn grain for fuel ethanol production .......................................................................3 2.2 Resistant starch content in corn and corn products ....................................................4 2.3 Unreacted starch determination ..................................................................................7 2.4 Use of infrared spectroscopy in grain analyses ..........................................................8 2.5 Preprocessing of spectral data ....................................................................................9
CHAPTER 3. EFFECTS OF STORAGE TEMPERATURE AND TIME ON UNREACTED STARCH LEVELS IN CORN ............................................................. 15
3.1 Introduction ..............................................................................................................15 3.2 Materials and Methods .............................................................................................15
3.2.1 Ground corn preparation and moisture content determination ......................... 15 3.2.2 Statistical analyses ............................................................................................ 18
3.3 Results and Discussion .............................................................................................18 3.4 Conclusion ................................................................................................................26
CHAPTER 4. PREDICTING UNREACTED STARCH LEVELS IN CORN BY FOURIER TRANSFORM NEAR INFRARED SPECTROSCOPY ............................ 27
4.1 Introduction ..............................................................................................................27 4.2 Materials and Methods .............................................................................................27
4.2.1 Sample preparation and unreacted starch determination .................................. 27 4.2.2 Scanning, processing and analyses of FT-NIR spectra .................................... 28
4.3 Results and Discussion .............................................................................................30 4.3.1 Unreacted starch content in starch blends, dry and wet ground corn ............... 30 4.3.2 FT-NIR Spectra ................................................................................................ 31 4.3.3 Processing of FT-NIR data ............................................................................... 34 4.3.4 PLS Modeling ................................................................................................... 37
4.4 Conclusion ................................................................................................................41
CHAPTER 5. CONCLUSIONS AND FUTURE WORK ................................................ 42
WORKS CITED ............................................................................................................... 43
APPENDIX A. STATISTICAL CODE IN R ENVIRONMENT .................................... 52
APPENDIX B. VERIFICATION OF THE UNREACTED STARCH CONTENT IN STARCH BLENDS ....................................................................................................... 53
APPENDIX C. FT-NIR SPECTRAL DATA PRETREATMENT AND REGRESSION MODELS ...................................................................................................................... 55

1
CHAPTER 1. INTRODUCTION
Production of ethanol from corn has become an essential fuel industry in the
United States of America. With the goal of an ethanol output of 15 billion gallons by
2022 (EPA, 2009), the ethanol industry is clearly of great economic importance. Greater
process efficiency could lead to increased production so it is important to understand and
be able to monitor corn quality and how it changes over time.
The most common method used for converting corn into ethanol is the dry grind
process, which is responsible for 86% of domestic production (Mueller, 2010). The dry
grind ethanol process involves grinding the corn, producing a slurry, then breaking down
starch molecules with alpha amylase in the presence of heat and water. Glucoamylase is
added to further break down the starch into glucose so that it can be consumed by yeast
and converted into ethanol. The conversion of starch into ethanol is not complete,
however, as distillers dried drains with solubles (DDGS), a coproduct of the process,
contains more than 5% starch (Belyea et al., 2004; Kim et al., 2008). Since 3.78 liters (1
U.S. gallon) of ethanol produces 2.7 kg of DDGS (Szulchyk, et al., 2010), this means that
for the 43 billion liters (11.4 billion gallons) of ethanol produced by the dry grind ethanol
process in the United States in 2011, 1.5 billion kg starch was unreacted or unused. This
represents inefficiencies in the dry grind ethanol process and reducing the amount of
unreacted starch is particularly important to improving the profitability of the ethanol
industry. Also, a decrease in unreacted starch content DDGS increases the protein
content, which translates into a higher value DDGS.
In order to minimize the amount of unreacted starch in the dry grind ethanol
process, it is important to understand the effects that storage temperature and time have
2
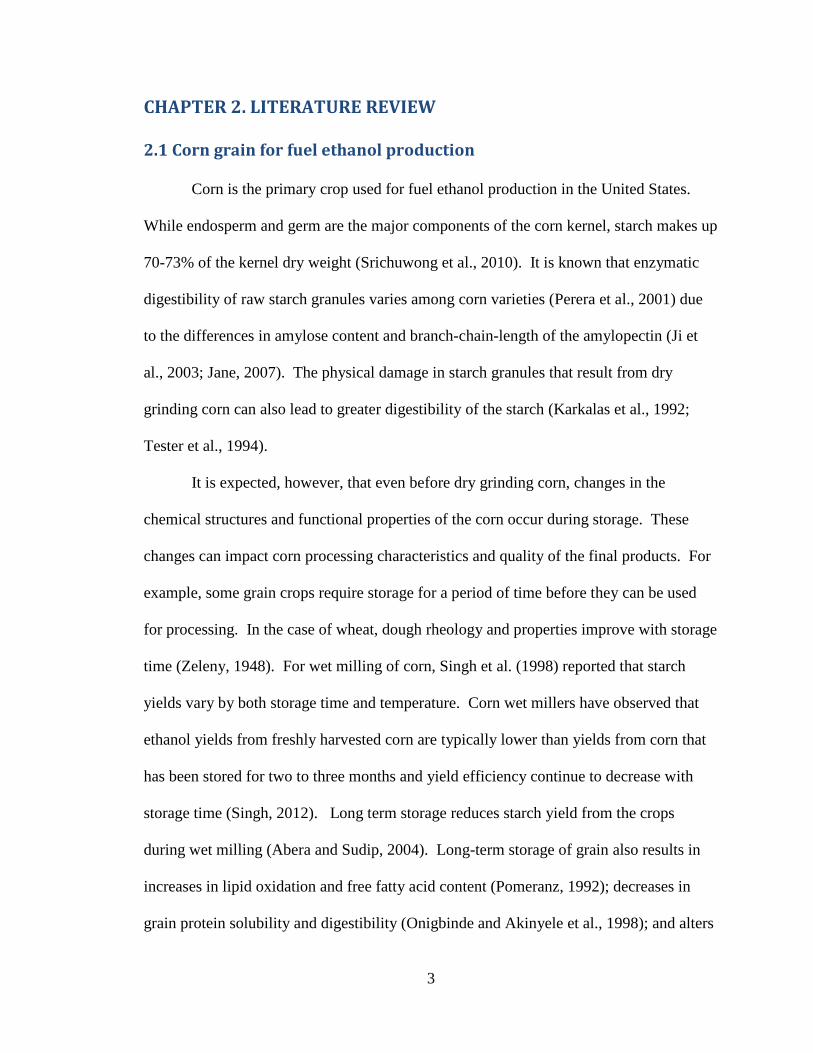
on the enzymatic digestibility of the corn starch and to develop a high throughput
procedure for monitoring unreacted starch levels. Correlations between unreacted starch
content in corn and storage temperature and time are not well understood, but starch yield
in the wet milling process have been shown to vary by both storage time and temperature
(Singh et al., 1998).
The objectives of this study were (1) to determine the changes in unreacted starch
content during storage and (2) to develop a high throughput assay based on Fourier
transform near infrared spectroscopy to provide a measure of unreacted starch content in
corn.
3
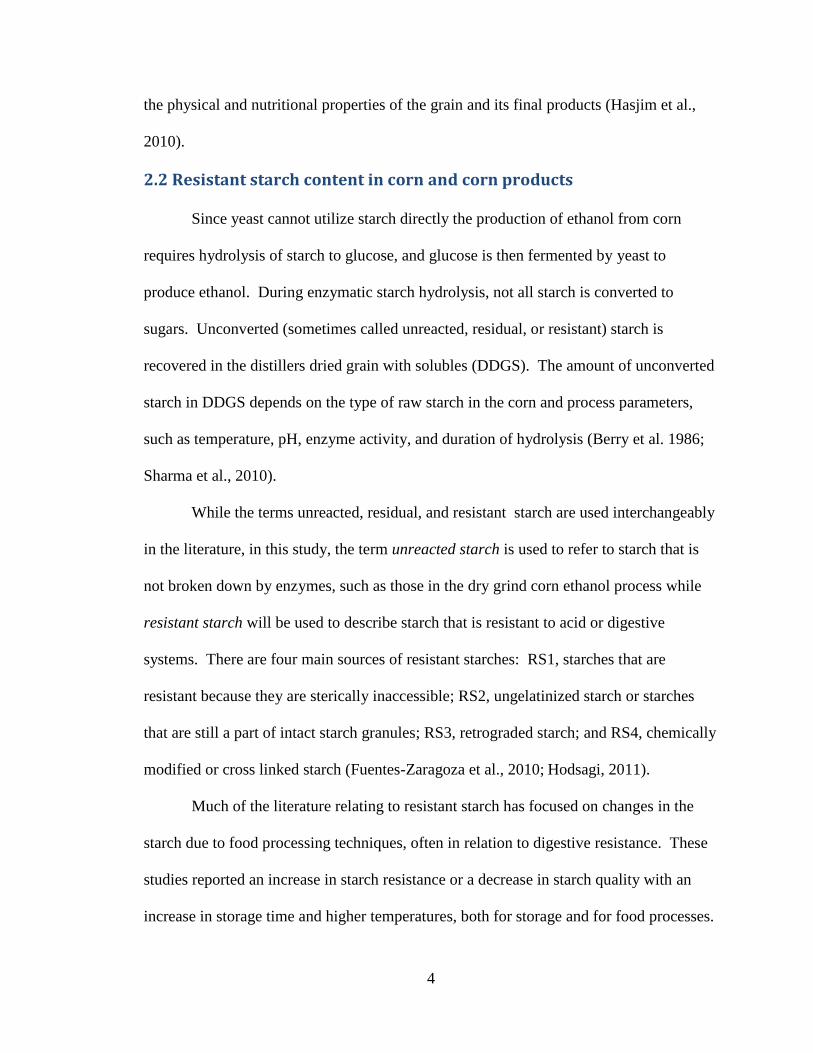
CHAPTER 2. LITERATURE REVIEW
2.1 Corn grain for fuel ethanol production
Corn is the primary crop used for fuel ethanol production in the United States.
While endosperm and germ are the major components of the corn kernel, starch makes up
70-73% of the kernel dry weight (Srichuwong et al., 2010). It is known that enzymatic
digestibility of raw starch granules varies among corn varieties (Perera et al., 2001) due
to the differences in amylose content and branch-chain-length of the amylopectin (Ji et
al., 2003; Jane, 2007). The physical damage in starch granules that result from dry
grinding corn can also lead to greater digestibility of the starch (Karkalas et al., 1992;
Tester et al., 1994).
It is expected, however, that even before dry grinding corn, changes in the
chemical structures and functional properties of the corn occur during storage. These
changes can impact corn processing characteristics and quality of the final products. For
example, some grain crops require storage for a period of time before they can be used
for processing. In the case of wheat, dough rheology and properties improve with storage
time (Zeleny, 1948). For wet milling of corn, Singh et al. (1998) reported that starch
yields vary by both storage time and temperature. Corn wet millers have observed that
ethanol yields from freshly harvested corn are typically lower than yields from corn that
has been stored for two to three months and yield efficiency continue to decrease with
storage time (Singh, 2012). Long term storage reduces starch yield from the crops
during wet milling (Abera and Sudip, 2004). Long-term storage of grain also results in
increases in lipid oxidation and free fatty acid content (Pomeranz, 1992); decreases in
grain protein solubility and digestibility (Onigbinde and Akinyele et al., 1998); and alters
4
the physical and nutritional properties of the grain and its final products (Hasjim et al.,
2010).
2.2 Resistant starch content in corn and corn products
Since yeast cannot utilize starch directly the production of ethanol from corn
requires hydrolysis of starch to glucose, and glucose is then fermented by yeast to
produce ethanol. During enzymatic starch hydrolysis, not all starch is converted to
sugars. Unconverted (sometimes called unreacted, residual, or resistant) starch is
recovered in the distillers dried grain with solubles (DDGS). The amount of unconverted
starch in DDGS depends on the type of raw starch in the corn and process parameters,
such as temperature, pH, enzyme activity, and duration of hydrolysis (Berry et al. 1986;
Sharma et al., 2010).
While the terms unreacted, residual, and resistant starch are used interchangeably
in the literature, in this study, the term unreacted starch is used to refer to starch that is
not broken down by enzymes, such as those in the dry grind corn ethanol process while
resistant starch will be used to describe starch that is resistant to acid or digestive
systems. There are four main sources of resistant starches: RS1, starches that are
resistant because they are sterically inaccessible; RS2, ungelatinized starch or starches
that are still a part of intact starch granules; RS3, retrograded starch; and RS4, chemically
modified or cross linked starch (Fuentes-Zaragoza et al., 2010; Hodsagi, 2011).
Much of the literature relating to resistant starch has focused on changes in the
starch due to food processing techniques, often in relation to digestive resistance. These
studies reported an increase in starch resistance or a decrease in starch quality with an
increase in storage time and higher temperatures, both for storage and for food processes.

5
Turning corn into tortillas increased the content of digestive resistant starch, as did
increased storage time of the tortilla (Garcia-Rosas et al., 2009). High temperature
processing techniques such as baking, boiling, roasting, or storage from 12 to 24 hours
increased resistant starch content (Rendon-Villalobos et al., 2002; Vaidya and Sheth,
2011). In addition warm holding at 65-70oC for 1 hr. increased digestive resistant starch
from 2.2 to 4.8% and slow cooling from 3.6 to 6.3% (Gormley and Walshe, 1999).
Starch extracted through the corn wet milling process typically decreased when higher
heat drying processes were used (Paulsen et al., 2003).
Similar trends were reported from enzyme based studies. Enzymatic starch
hydrolysis percentage generally decreased with an increase in storage time (Setiawan et
al., 2010), although these results were not as consistent as the results from acid hydrolysis
or digestibility studies. A 5% decrease in starch yield, the wet basis percentage of starch
that was recovered from wet milling, from dried cassava was reported after 8 months of
storage (Abera and Rakshit, 2004). The fiber content of the cassava was greater in the
samples stored at 30ºC than in the samples stored at 5ºC, although no reliable trend was
seen over storage time. Both peak viscosity and light transmittance decreased over time,
while syneresis increased for both storage temperatures and varieties.
Processing temperature of starch was shown to have an effect on alpha
amylase/pullulanase resistant starch content of wheat starch, with higher autoclaving
temperatures producing more resistant starch (Berry et al., 1986). Although higher
processing temperatures cause an increase in enzymatic resistant starch, higher
temperatures in the liquefaction stage of the dry grind ethanol process can have the
opposite effect. Processes that had higher temperature in the liquefaction stage were

6
shown to have lower final amounts of residual starch (Sharma et al., 2010). It has also
been theorized that high temperature processing with amylase may cause lipid-amylose
complexes to form, serving as competitive inhibition to resistant starch formation
(Gruchala and Pomeranz, 1992).
The amylose to amylopectin content of the starch is an important factor in the
development of enzymatically resistant starch, as waxy maize was shown to have around
1% enzymatic resistant starch across after autoclave treatments were applied, whereas
amylomaize starches ranged from 24% to 48% (Berry et al., 1986). This conclusion was
supported by the Singh et al. (1998) study, where the difference in the starch yield were
measured and may have been due to differences in amylose content. Alpha and
pullulanase resistant starches increased with starch gelatinization, implying enzymatic
resistance increased in the presence of water (Berry et al., 1986).
The size, shape, and frequency of pores in starch granules all affected the ability
of hydrolyzing enzymes to degrade the starch (Valetudie et al., 1993). These results may
explain differences in enzymatic digestibility across different starch sources. X-ray
diffraction measurements revealed starch structure has an effect on the enzymatic
digestibility of the starch molecule (Jane, 2009; Perez et al., 2009). Type A starch, which
typifies the starch found in cereal grains, structures consist of amylopectin molecules that
are 23 to 29 glucose units and characterized by a double helical outer structure with
hydrogen bonds between the hydroxyl groups, along with amylose chains packed in
between (Jane, 2009; Perez et al., 2009). Type B structures have longer amylopectin
chains with 30 to 44 glucose units infused with water instead of amylose, whereas type C
structures are a cross between A and B structures. Type V structures are amylose chains

7
that have crystallized with nonstarch compounds, such as alcohols or fatty acids (Jane,
2009). Studies have indicated that type B starch structures are less susceptible to
hydrolysis by alpha amylase and, therefore, my enzymatically resistant than type A
structures (Jane et al., 1997; Planchot et al., 1997). Type A starch molecules provide
more branch linkages and short chain double helices, which form weak points that allow
enzymatic pitting to occur (Jane et al., 1997).
2.3 Unreacted starch determination
Currently, resistant starch contents are determined by assays such as AOAC
Method 991.43 (Hollmann et al., 2013). This method requires incubation with alpha
amylase and protease, followed by chromatography. Vidal et al. (2009) developed a
procedure which involved carrying out a full fermentation and then using a GOPOD
assay to estimate the glucose content in the corn mash. Ethanol plants can determine the
unreacted starch content after fermentation by analyzing the DDGS or comparing
predicted yields to actual yields. All of these methods take several days to complete and
usually involve operating a wet chemistry lab and complex equipment. As such, there are
no reliable yet quick methods of predicting unreacted starch content of corn that can be
accomplished before the dry grind ethanol process is complete. In this study, the
development of a high throughput assay based on Fourier transform near infrared
spectroscopy (FT-NIR) to predict values of unreacted starch content in corn was explored
as a means to monitor corn quality during storage, blending, and processing operations in
ethanol facilities.

8
2.4 Use of infrared spectroscopy in grain analyses
Infrared spectroscopy is most commonly used in biological applications relating
to food and agricultural industries. Its popularity as an analytical technique expanded
rapidly in the 1960s since it can be conducted without with minimal sample preparation
(i.e., not requiring a pretreatment of the sample); can provide information on both
physical and chemical characteristics; does not require destroying or damaging the test
sample; and is relatively easy to use (Blanco and Bano, 1998; Tikuisis et al., 1993).
These factors made near infrared spectroscopy a common choice for agricultural, food,
pharmaceutical, and biological systems. Quantitative analyses of near infrared spectral
data require a calibration step with a set of standard samples (Blanco and Bano, 1998).
Several studies have been reported in the literature with regards to grain quality
and processing analyses. Qualitative changes in starch resistance to enzymes in
processed corn tortillas were analyzed using FT–NIR, where retrograded resistant starch
had broader peaks with fewer spectral details than the native starch (Garcia-Rosas et al.,
2009). Ruminant digestive resistant starches from a variety of plants, such as corn,
wheat, and potato, were modeled using mid IR spectroscopy with an R2 = 0.995 on a
model involving 98 samples (Uden, 2009). This study also included a calibration test
against chemical methods with a mean squared prediction error of 0.0076. Hydrolyzates
from the dry grind ethanol process were measured for sugar concentrations by FT–NIR as
well with under 5% error (Blanco and Bano, 2003). DDGS samples from operating corn
ethanol plants were analyzed by FT–NIR to predict the quantity of components. While a
prediction model was constructed for a variety of components, residual starch quantities
were among the least accurately predicted with R2 = 0.81 as compared to other

9
components whose R2 = 0.88 for protein and 0.87 for moisture (Paulsen et al., 2010). In
a separate study, FT–NIR was used on whole corn to predict protein, starch, and oil, but
again, starch values showed the lowest correlation values, with R2 = 0.86 for calibration,
and 0.89 for validation (Jiang et al., 2007). Calibration for the percentage of corn starch
that can be utilized in the corn wet milling process was conducted with R2 = 0.8 (Paulsen
et al., 2004). Although FT-NIR has been used to quantify starch content, the
differentiation among types of resistant starch has not been thoroughly explored in
literature.
2.5 Preprocessing of spectral data
When analyzing macromolecules such as starch with NIR spectroscopy, many
chemical bonds in the samples are stretched or vibrated. Each of these stretches can emit
multiple signals, called overtones, which overlap with each other, making the signal more
difficult to interpret. While overtones are necessary for analysis, specific overtones are
found over multiple ranges of wavelengths. The exact wavelength of the overtone may
change depending on environmental factors, potentially complicating analysis.
Fundamental bands correspond to the emitted energy from vibrational excitement from
the lowest energy position to the next lowest. Those bands tend to have a stronger signal
than either overtone bands, which are excitations from lowest energy level to an energy
level higher than the fundamental, or combination bands, which are bands that exist from
multiple simultaneous fundamental excitations (Stark et al., 1986).
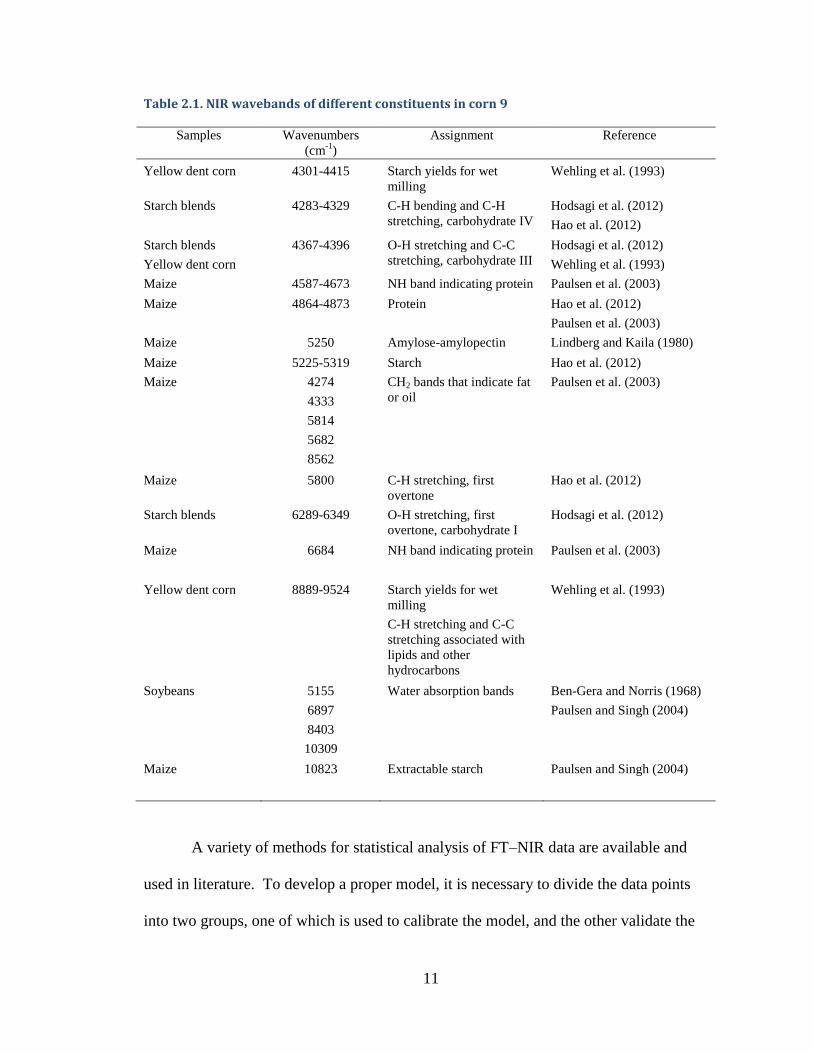
FT–NIR spectra of ground corn typically show water has strong absorption bands
which overlap with the absorption bands of sugars, proteins, oils, and starches (Table
2.1). Glucose, maltose and dextrins overlap between 2100 nm and 2350 nm, or

10
4762 cm-1 and 4255 cm-1 (Blanco and Bano, 2003). Other important spectral regions in
starch are absorption bands at 2276 nm (4394 cm-1) to 2100 nm (4762 cm-1), and 1400
nm (7143 cm-1) to 1600 nm (6250 cm-1), the last of which corresponds to the first
overtone of hydroxyl groups (Noah et al., 1997). The region around 2100 nm is
associated with C–O and O–H deformation vibrations, and the region at 2276 nm
corresponds to a combination band of O–H and C–C stretch vibrations (Noah et al.,
1997). Water absorption values are typically around 760, 970, 1190, 1450 and 1940 nm
(Paulsen and Singh, 2004). Strong water absorption can obscure starch spectra in similar
wavelengths, causing error in the model. For this reason, dry samples are preferred in
FT–NIR spectroscopy.
11
Table 2.1. NIR wavebands of different constituents in corn 9
Samples Wavenumbers (cm-1)
Assignment Reference
Yellow dent corn 4301-4415 Starch yields for wet milling
Wehling et al. (1993)
Starch blends 4283-4329 C-H bending and C-H stretching, carbohydrate IV
Hodsagi et al. (2012)
Hao et al. (2012)
Starch blends
Yellow dent corn
4367-4396 O-H stretching and C-C stretching, carbohydrate III
Hodsagi et al. (2012)
Wehling et al. (1993)
Maize 4587-4673 NH band indicating protein Paulsen et al. (2003)
Maize 4864-4873 Protein Hao et al. (2012)
Paulsen et al. (2003)
Maize 5250 Amylose-amylopectin Lindberg and Kaila (1980)
Maize 5225-5319 Starch Hao et al. (2012)
Maize 4274
4333
5814
5682
8562
CH2 bands that indicate fat or oil
Paulsen et al. (2003)
Maize 5800 C-H stretching, first overtone
Hao et al. (2012)
Starch blends 6289-6349 O-H stretching, first overtone, carbohydrate I
Hodsagi et al. (2012)
Maize 6684
NH band indicating protein Paulsen et al. (2003)
Yellow dent corn 8889-9524 Starch yields for wet milling
C-H stretching and C-C stretching associated with lipids and other hydrocarbons
Wehling et al. (1993)
Soybeans 5155
6897
8403
10309
Water absorption bands Ben-Gera and Norris (1968)
Paulsen and Singh (2004)
Maize 10823
Extractable starch
Paulsen and Singh (2004)
A variety of methods for statistical analysis of FT–NIR data are available and
used in literature. To develop a proper model, it is necessary to divide the data points
into two groups, one of which is used to calibrate the model, and the other validate the
12
model once it is derived (Esbensen, 2010). The percentage of data devoted to the
validation set varies, but is typically between 20% and 33% of the data in the study. It is
important, however, that the statistical distributions of the calibration and validation sets
are representative of the entire data set.
In many cases involving multiple variables, it is necessary to normalize data with
different magnitudes; however, since the only data analyzed are spectra and resistant
starch values, normalization is likely not required in this instance. Other forms of data
pretreatment are applicable for spectral data, such as multiplicative scatter correction
(MSC), or a derivative-based smoothing technique such the Savitzky–Golay (SG)
(Delwiche and Reeves, 2010). These pretreatment methods are used to minimize error,
such as baseline shifts, or overlapping peaks (Szlyk et al., 2005). The process of
derivation removes constant terms like baseline shift, but the second derivative is more
commonly used than the first derivative for NIR spectral analysis because it preserves
peak location (Naes et al., 2002). MSC attempts to correct for drift with a transformation
equation that removes additive effects so only multiplicative effects are seen (Naes et al.,
2002). The MSC pretreatment is most useful in readings that are not expected to have
much interference and, therefore, are not thought to need significant adjustment. MSC is
calculated by creating a mean centered data set by subtracting the mean from each of the
points. The mean centered data set is then divided by a correction factor that is
calculated using a reference mean centered spectrum, and then adding in the mean
centered reference value. The SG method, a numerical technique that estimates the
derivative of a curve is used commonly, it suffers from distortions if severe smoothing is
required (Stark et al., 1986). SG acts as a filter that combines derivation with a moving

13
point smoothing, where each point is the average of the points surrounding it, the number
of points being independent. MSC has an advantage over SG derivations in that it
simplifies the calibration model; however, it is heavily affected if the sum of all the light
absorbance constituents does not equal a constant amount (Naes et al., 2002).
Although MSC and SG derivations are the most common methods for analyzing
FT–NIR data, other methods do exist, such as independent modeling of class analogy
(SIMCA). Soft modeling is a technique that analyzes significance by separating data into
classes and is commonly used in the pharmaceutical industry because of its close
attention to error limits (Candolfi et al., 1999; De Maesschalck et al., 1999).
To understand the quality of models obtained from the data, a number of factors
can be analyzed, such as the number of iterations performed, percentage of variance
explained by the number of factors in the model, coefficient of determination (R2), root
mean square error of prediction (RMSEP), and ratio of performance to deviation (RPD).
The coefficient of determination is calculated using linear regression, the mean square
error is the sum of squares of differences between predicted y values and actual y values,
RPD is calculated as the standard deviation of the reference data set divided by the root
mean square error of prediction. The number of iterations is important to understand how
much transformation of the data was required to achieve the model. Having fewer
iterations is better as the data had to undergo less manipulation. The number of factors in
a partial least squares (PLS) regression model is typical minimized without
compromising the percentage of the variance in the spectral data that is explained by
model. The R2 value of the calibration and the validation shows how well the line of
prediction fits the data, with higher values signifying a more effective fit. RMSEP is
14
another commonly used measurement for how far off the models predictions are from the
data. The RPD used to sort the model into different categories of usefulness. An RPD
value of 2.5 to 2.9 is needed for rough screening, and good quality screening is possible
with models having an RPD values greater than 3.0.
In this study, changes in the unreacted starch content of corn stored under
different temperatures over a period of 5 to 12 mo. were corded and analyzed. Predictive
models of unreacted starch content based on the FT-NIR spectra of dry blends of native
and digestive resistant starches and ground corn (wet and dry) were developed using
partial least squares regression. The dry blends were used to determine which wavebands
of the FT-NIR spectra were most responsive to changes in unreacted starch content. The
FT-NIR spectra of dry ground corn were compared to the FT-NIR wavebands of dry
starch blends to see if the identified wavebands remained prominent, i.e., not masked by
other constituents in the corn flour, and useful in developing a PLS regression model for
dry corn flour. However, for in line monitoring of ground corn in storage, blending, and
ethanol processing, it will be most advantageous to have predictive models that can be
used with un-dried ground corn. Therefore, FT-NIR spectra of un-dried ground corn
were also collected, compared to the spectra of starch blends and dry ground corn
samples, and modeled using PLS. All regression models were compared and
recommendations for the use of FT-NIR spectroscopy as a high throughput assay for
monitoring unreacted starch content in corn were made.
15
CHAPTER 3. EFFECTS OF STORAGE TEMPERATURE AND TIME ON UNREACTED STARCH LEVELS IN CORN
3.1 Introduction
Since the dry grind ethanol process is an important component of the renewable
fuels industry, which relies upon corn stored for up to a year, it is necessary to understand
the aging process of stored corn and its effects the efficiency of the dry grind ethanol
industry. For wet-milling of corn, Singh et al. (1998) reported that starch yields vary by
both storage time and temperature. Dry millers have observed that ethanol yields from
freshly harvested corn are typically lower than yields from corn that has been stored for
two to three months and yield efficiency continue to decrease with storage time (Singh,
2012). In order to understand this aging process, the first goal of this research was to
monitor changes in unreacted starch content in corn stored for 5 to 12 mo. under differing
storage conditions, in order to determine unreacted starch trends over the course of the
storage year, and how they are affected by storage time and by storage temperature.
3.2 Materials and Methods
3.2.1 Ground corn preparation and moisture content determination
Pioneer P1395R yellow dent corn was harvested from the Agricultural and
Biological Engineering Farm in Urbana, IL in October 2011 and the same hybrid was
grown in Dupont Pioneer, Johnston, IA and provided by Pioneer in October 2012. The
corn was stored in sealed plastic pails (5 gallon capacity) either in a refrigerated room
(set at 1oC), under a sheltered awning outdoors (-10 to 37oC), or in the laboratory (14 to
24oC) for a period of 5 to 12 mo. Both relative humidity and temperature inside the pails
were monitored every 6 hr using wireless dataloggers (TrackIt®, MicroDAQ,

16
Contoocook, NH). Storage time was measured in weeks after harvest, and the first
reading is begun within a day of harvest.
Every two weeks during the first 3 mo. of storage and every 4 weeks thereafter,
200-300 g samples from each storage condition were removed and a 25 g subsample was
used to determine the moisture content of the whole corn using ASABE Standard S358.2
(2003). The rest of the corn samples were ground with a hammer mill using a 0.5 mm
sieve. A 10 g subsample from each storage condition was used to determine the ground
corn moisture content by gravimetric method and drying at 135oC for 2 hr (AACCI,
2000).
For corn harvested in 2011, ground corn was first liquefied for 1 hr with
Liquozyme SC alpha amylase (Novozymes, Franklinton, NC) at pH 5.7 and 85ºC
followed by saccharification with Spirizyme Ultraglucoamylase (Novozymes,
Franklinton, NC) for 72 hr at pH 5.0 and 65ºC (Figure 3.1). The samples were then
washed with 40 ml deionized water three times in a centrifuge set at 500 rpm for 20 min.
to remove glucose from the samples. The samples were dried at 49ºC overnight and
treated with either deionized water (blank) or 0.4 M HCl (test) to break apart the
remaining starch molecules. All blank and test samples were diluted 10X using
deionized water and the unreacted starch content was determined using a glucose
oxidase-peroxidase (GOPOD) colorimetric assay (Megazyme International, Wicklow,
Ireland). Estimates of the glucose content obtained were used to calculate the original
unreacted starch content remaining after saccharification based on a procedure developed
by Vidal et al. (2009). The GOPOD procedure relied on dilute HCl acid to measure the
enzymatic unreacted starch; acid-resistant starch was not measured in this study.

17
Figure 3.1. Test procedure for monitoring unreacted starch content in corn harvested in 2011
and 2012.
For corn harvested in 2012, the procedure was modified by conducting a
simultaneous saccharification and fermentation with Spirizyme Ultraglucoamylase at pH
4.5 and 32oC for 72 hr using dry red yeast, which is more representative of procedures in
modern dry grind ethanol facilities and complete removal of fermentable sugars in corn
mash samples. Ethanol was removed by distillation at 90oC for 3 hr and dried at 49oC for
72 hr. The GOPOD colorimetric assay was used to determine the amount of glucose
remaining in the sample and converted to unreacted starch content. Three replicates from
each storage condition were used, and in the GOPOD assay, each replicate was measured
with three repeated measures.
Corn harvested in Oct 2011
Storage conditions
Sample collection
Refrigerated (1oC)Outdoors (-10 to 35oC)
200-300 g corn samples removed from each storage condition
175-275 g sample ground in hammer mill
with 0.5 mm sieve
25 g subsamples used for moisture content
determination
10 g subsamples used for moisture content
determination
Sample preparation and moisture content determination
Corn harvested in Oct 2012
Refrigerated (1oC)Outdoors (-10 to 35oC)
Indoors (14 to 24oC)
200-300 g corn samples removed from each storage condition
175-275 g sample ground in hammer mill
with 0.5 mm sieve
25 g subsamples used for moisture content
determination
10 g subsamples used for moisture content
determination
Liquefaction
Saccharification
Wash 3X in centrifuge
Drying at 45oC overnight
GOPOD assay with 3 subsamples at each storage condition and blanks
Unreacted starch content determination
Liquefaction
Simultaneous saccharification and fermentation
Ethanol removal by distillation
Drying at 49oC for 72 hr
GOPOD assay with 3 subsamples at each storage condition and blanks
18
Storage Time (wks)
Unr
eact
ed S
tarc
h (%
)
-2 0 2 4 6 8 10 12 14 16 18 20 22 248
10
12
14
16
18
20
m0
m1
m3
2012 Harvest - Outdoors0,12,o
1,12,o
2,12,o
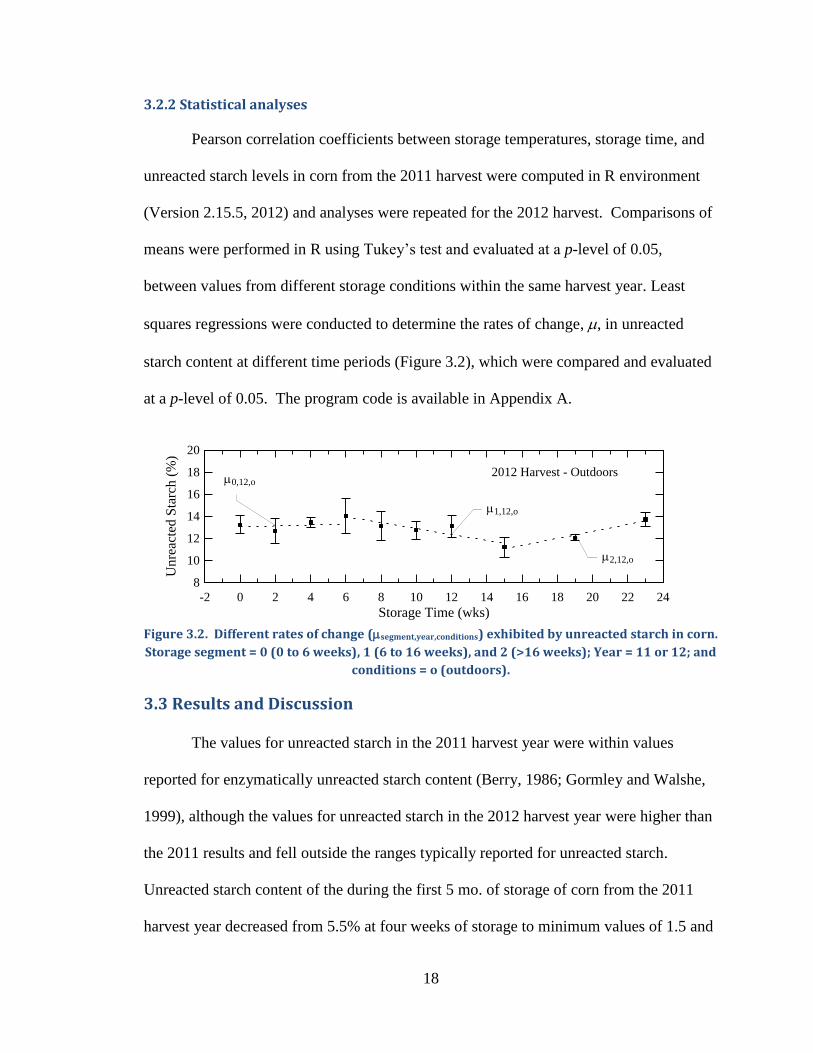
3.2.2 Statistical analyses
Pearson correlation coefficients between storage temperatures, storage time, and
unreacted starch levels in corn from the 2011 harvest were computed in R environment
(Version 2.15.5, 2012) and analyses were repeated for the 2012 harvest. Comparisons of
means were performed in R using Tukey’s test and evaluated at a p-level of 0.05,
between values from different storage conditions within the same harvest year. Least
squares regressions were conducted to determine the rates of change, , in unreacted
starch content at different time periods (Figure 3.2), which were compared and evaluated
at a p-level of 0.05. The program code is available in Appendix A.
Figure 3.2. Different rates of change (segment,year,conditions) exhibited by unreacted starch in corn.
Storage segment = 0 (0 to 6 weeks), 1 (6 to 16 weeks), and 2 (>16 weeks); Year = 11 or 12; and
conditions = o (outdoors).
3.3 Results and Discussion
The values for unreacted starch in the 2011 harvest year were within values
reported for enzymatically unreacted starch content (Berry, 1986; Gormley and Walshe,
1999), although the values for unreacted starch in the 2012 harvest year were higher than
the 2011 results and fell outside the ranges typically reported for unreacted starch.
Unreacted starch content of the during the first 5 mo. of storage of corn from the 2011
harvest year decreased from 5.5% at four weeks of storage to minimum values of 1.5 and

19
2.5% for corn stored at 1˚C and outdoors, respectively, for the corn harvested in 2011
(Figure 3.3).
The minima were obtained after 10 weeks of storage, on 19 January 2012, when
the midday outdoor temperature averaged -4˚C. The unreacted starch content increased
to 8% after 20 weeks of storage, when outdoor temperatures averaged 16˚C. Unreacted
starch contents in both outdoor and refrigerated storage conditions remained around 8%
until weeks 28-32 of storage. After the 32nd week, unreacted starch contents increased
steadily until month 12.
For the 2012 harvest year, corn stored in all three storage conditions had 13.5%
unreacted starch content at the time of harvest. This value was higher than that of the
2011 harvest year which might be due to the drought conditions during kernel
development during the summer months of 2012 (Below, 2013). In each of the storage
conditions, unreacted starch content increased for the first weeks of storage and then
decreased. By the 15th week of storage, all corn samples reached a minimum value of
11% unreacted starch content. This occurred at the same calendar date (19 January
2013), as the minimum readings from the 2011 harvest year, despite the fact the corn in
2012 was harvested earlier. Unreacted starch values then increased from the 15th to 23rd
week of storage.

20
Figure 3.3. Unreacted starch content () in corn harvested in 2011 and 2012 and temperature
conditions () during the first 5 mo. in storage. Storage time was equal to the number of
weeks after harvest.
Storage time (wks)
Unr
eact
ed S
tarc
h (%
)
Tem
pera
ture
(o C
)
-2 0 2 4 6 8 10 12 14 16 18 20 22 24-2 -10
2 0
6 10
10 20
14 30
18 402011 Harvest - Outdoors
Storage time (wks)
Unr
eact
ed S
tarc
h (%
)
Tem
pera
ture
(o C
)
-2 0 2 4 6 8 10 12 14 16 18 20 22 24-2 -10
2 0
6 10
10 20
14 30
18 402011 Harvest - Refrigerated
Storage Time (wks)
Unr
eact
ed S
tarc
h (%
)
Tem
pera
ture
(o C
)
-2 0 2 4 6 8 10 12 14 16 18 20 22 24-2 -10
2 0
6 10
10 20
14 30
18 402012 Harvest - Outdoors
Storage Time (wks)
Unr
eact
ed S
tarc
h (%
)
Tem
pera
ture
(o C
)-2 0 2 4 6 8 10 12 14 16 18 20 22 24
-2 -10
2 0
6 10
10 20
14 30
18 402012 Harvest - Refrigerated
Storage Time (week)
Unr
eact
ed S
tarc
h (%
)
Tem
pera
ture
(o C
)
-2 0 2 4 6 8 10 12 14 16 18 20 22 24-2 -10
2 0
6 10
10 20
14 30
18 402012 Harvest - Indoors

21
For corn harvested in 2011, the Pearson correlation coefficients between
unreacted starch content and time after harvest was r = 0.74, suggesting a strong
correlation between unreacted starch and storage time (Table 3.2). There was a moderate
correlation between unreacted starch content and temperature and between storage time
and temperature r = 0.55. For corn harvested in 2012, however, there were weaker
correlations among the three variables, r values ranging from -0.135 to -0.396.
Table 3.1. Pearson correlation coefficients for storage time, temperature, and unreacted
starch for corn harvested in 2011 and 2012.
2011 Corn 2012 Corn Temperature Unreacted starch Temperature Unreacted starch Storage time 0.449 0.744 -0.135 -0.396 Temperature 1 0.555 1 0.193
The correlations between unreacted starch and storage time have different signs
given the different lengths of storage times in the study. Corn harvested in 2012 was
only stored for five months, where the general trend was decreasing unreacted starch
contents; whereas data for 12 months of storage, as in 2011, where the general trend was
increasing unreacted starch contents. The correlations between unreacted starch and
temperature were also less significant than the correlations between unreacted starch and
storage time. From the literature, both temperature and time should be factors that are
generally influencing unreacted starch contents (Garcia-Rosas et al., 2009; Gormley and
Walshe, 1999; Onigbinde and Akinyele et al., 1998; Paulsen et al., 2003). In this study,
however, the differences between outdoor and refrigerated conditions were too small to
see the temperature effect.
Since the trends of unreacted starch content in corn stored in refrigerated and
outdoor conditions were similar for the first 5 mo. suggested that storage time had a
larger effect on unreacted starch content in corn than storage temperature (Table 3.2).

22
However, there was a late harvest time of the 2011 corn crop, due to the wet weather in
Illinois, causing the temperatures in the different storage locations to be similar for the
first few weeks of the study. Pronyk et al. (2004) reported that the “sweating” process
and postharvest ripening can be influenced by temperatures of the grain during the first 6
weeks of harvesting, which might explain why there would be similar trends in late fall
for corn stored outdoors and corn stored under refrigeration.
Variation in the first few months of the 2011 study could be caused by changes
within the corn due to variability in moisture contents (Table 3.2). Differences in
moisture content between corn stored outdoors and corn stored under refrigerated
conditions were larger, possibly due to moisture due to temperature gradients (Stewart,
1975). Therefore, in subsequent sampling, corn was thoroughly mixed to reduce
variation in moisture content.
In 2011, the standard deviations of the unreacted starch contents before the
removal of excess glucose ranged from 1.00 to 3.00% with the coefficient of variation
ranging from 3.00 to 8.5% of the measurement. In the published note on the acid
GOPOD method used for these measurements, Vidal et al. (2009) recorded standard
deviations of a six replicate sample at 3.4% coefficient of variation which was within the
range of standard deviations in this study. For the corn harvested in 2012, unreacted
starch was initially around 13%, higher than those observed at the beginning of the 2011
experiment. With drought conditions during the corn development period in 2012 and
the unreacted starch assay was modified to include a simultaneous saccharification and
fermentation, direct comparisons between years was difficult. For the 2012 harvest year
study, standard deviations ranged from 0.13 to 1.56%, which resulted in coefficients of
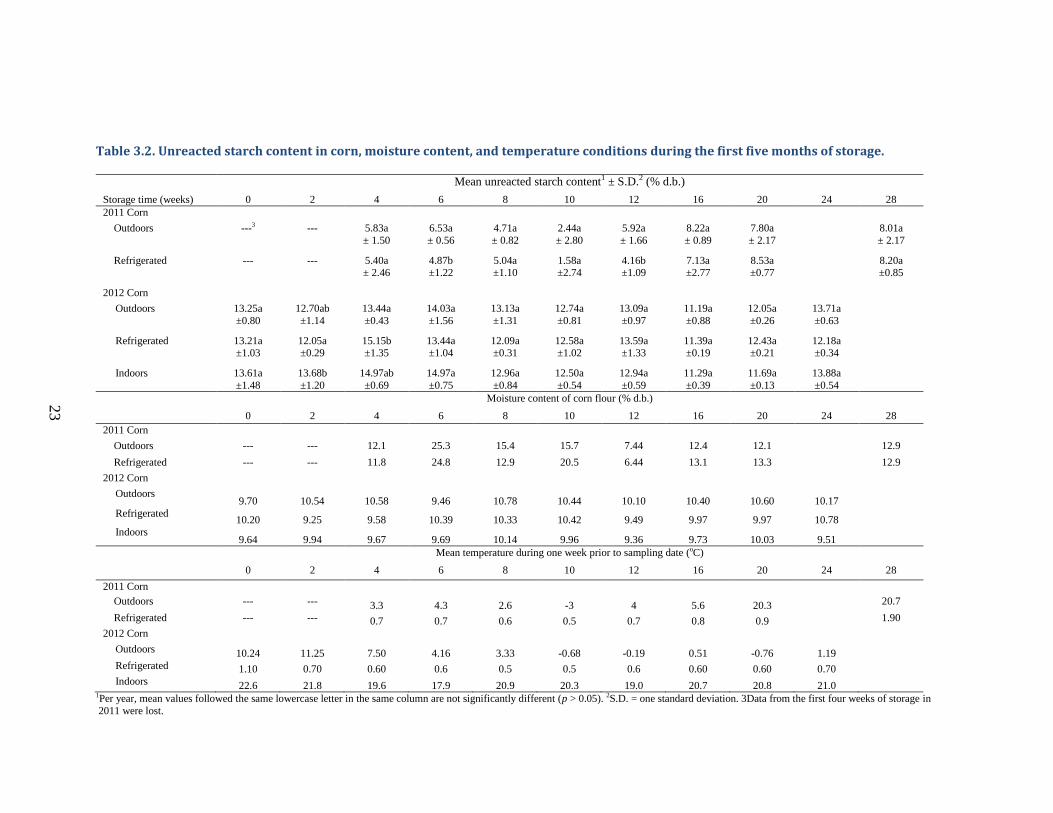
Table 3.2. Unreacted starch content in corn, moisture content, and temperature conditions during the first five months of storage.
Mean unreacted starch content1 ± S.D.2 (% d.b.) Storage time (weeks) 0 2 4 6 8 10 12 16 20 24 28 2011 Corn
Outdoors ---3 --- 5.83a ± 1.50
6.53a ± 0.56
4.71a ± 0.82
2.44a ± 2.80
5.92a ± 1.66
8.22a ± 0.89
7.80a ± 2.17
8.01a ± 2.17
Refrigerated --- --- 5.40a ± 2.46
4.87b ±1.22
5.04a ±1.10
1.58a ±2.74
4.16b ±1.09
7.13a ±2.77
8.53a ±0.77
8.20a ±0.85
2012 Corn
Outdoors 13.25a ±0.80
12.70ab ±1.14
13.44a ±0.43
14.03a ±1.56
13.13a ±1.31
12.74a ±0.81
13.09a ±0.97
11.19a ±0.88
12.05a ±0.26
13.71a ±0.63
Refrigerated 13.21a ±1.03
12.05a ±0.29
15.15b ±1.35
13.44a ±1.04
12.09a ±0.31
12.58a ±1.02
13.59a ±1.33
11.39a ±0.19
12.43a ±0.21
12.18a ±0.34
Indoors 13.61a ±1.48
13.68b ±1.20
14.97ab ±0.69
14.97a ±0.75
12.96a ±0.84
12.50a ±0.54
12.94a ±0.59
11.29a ±0.39
11.69a ±0.13
13.88a ±0.54
Moisture content of corn flour (% d.b.)
0 2 4 6 8 10 12 16 20 24 28 2011 Corn
Outdoors --- --- 12.1 25.3 15.4 15.7 7.44 12.4 12.1 12.9
Refrigerated --- --- 11.8 24.8 12.9 20.5 6.44 13.1 13.3 12.9
2012 Corn
Outdoors 9.70 10.54 10.58 9.46 10.78 10.44 10.10 10.40 10.60 10.17
Refrigerated 10.20 9.25 9.58 10.39 10.33 10.42 9.49 9.97 9.97 10.78
Indoors 9.64 9.94 9.67 9.69 10.14 9.96 9.36 9.73 10.03 9.51
Mean temperature during one week prior to sampling date (oC)
0 2 4 6 8 10 12 16 20 24 28
2011 Corn Outdoors --- --- 3.3 4.3 2.6 -3 4 5.6 20.3 20.7
Refrigerated --- --- 0.7 0.7 0.6 0.5 0.7 0.8 0.9 1.90
2012 Corn
Outdoors 10.24 11.25 7.50 4.16 3.33 -0.68 -0.19 0.51 -0.76 1.19
Refrigerated 1.10 0.70 0.60 0.6 0.5 0.5 0.6 0.60 0.60 0.70
Indoors 22.6 21.8 19.6 17.9 20.9 20.3 19.0 20.7 20.8 21.0 1Per year, mean values followed the same lowercase letter in the same column are not significantly different (p > 0.05). 2S.D. = one standard deviation. 3Data from the first four weeks of storage in 2011 were lost.
23
24
variation from 1.00 to 11.00%, though most were under 10%, with most of the variation
coming from differences in fermentation runs instead of the GOPOD assay, as the
repeated measures on each replicate generally within 0.5% of each other.
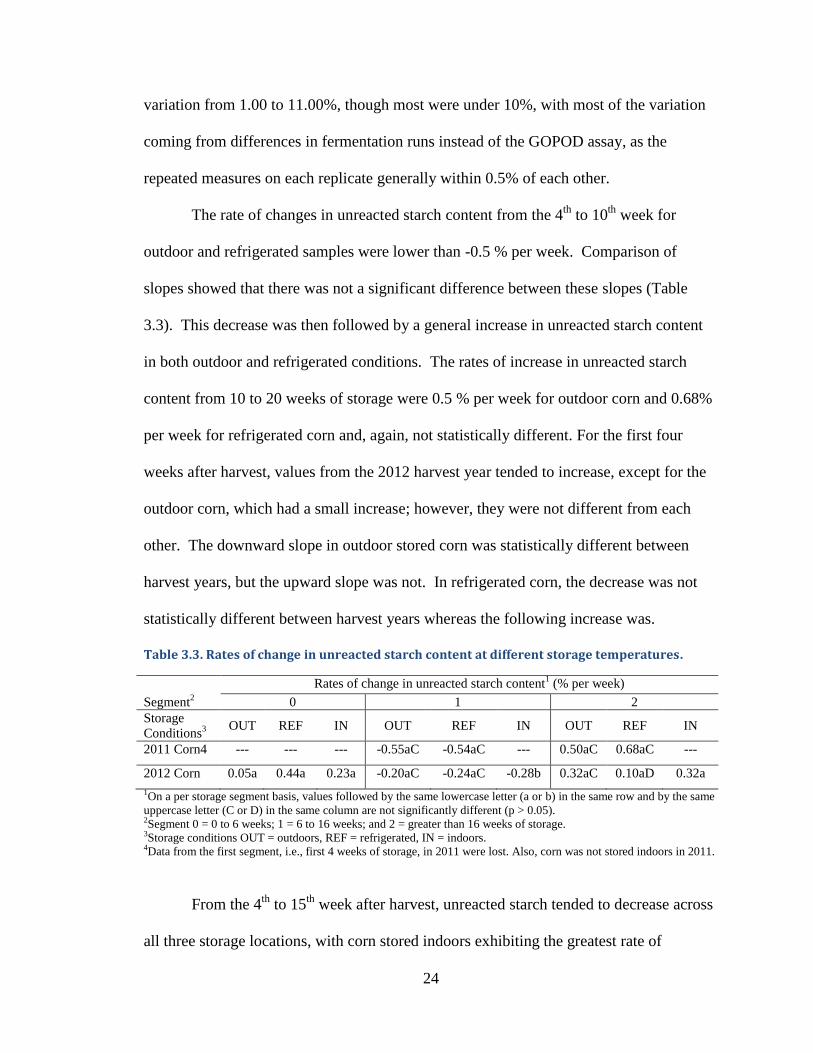
The rate of changes in unreacted starch content from the 4th to 10th week for
outdoor and refrigerated samples were lower than -0.5 % per week. Comparison of
slopes showed that there was not a significant difference between these slopes (Table
3.3). This decrease was then followed by a general increase in unreacted starch content
in both outdoor and refrigerated conditions. The rates of increase in unreacted starch
content from 10 to 20 weeks of storage were 0.5 % per week for outdoor corn and 0.68%
per week for refrigerated corn and, again, not statistically different. For the first four
weeks after harvest, values from the 2012 harvest year tended to increase, except for the
outdoor corn, which had a small increase; however, they were not different from each
other. The downward slope in outdoor stored corn was statistically different between
harvest years, but the upward slope was not. In refrigerated corn, the decrease was not
statistically different between harvest years whereas the following increase was.
Table 3.3. Rates of change in unreacted starch content at different storage temperatures.
Rates of change in unreacted starch content1 (% per week)
Segment2 0 1 2 Storage Conditions3
OUT REF IN OUT REF IN OUT REF IN
2011 Corn4 --- --- --- -0.55aC -0.54aC --- 0.50aC 0.68aC ---
2012 Corn 0.05a 0.44a 0.23a -0.20aC -0.24aC -0.28b 0.32aC 0.10aD 0.32a 1On a per storage segment basis, values followed by the same lowercase letter (a or b) in the same row and by the same uppercase letter (C or D) in the same column are not significantly different (p > 0.05). 2Segment 0 = 0 to 6 weeks; 1 = 6 to 16 weeks; and 2 = greater than 16 weeks of storage. 3Storage conditions OUT = outdoors, REF = refrigerated, IN = indoors. 4Data from the first segment, i.e., first 4 weeks of storage, in 2011 were lost. Also, corn was not stored indoors in 2011.
From the 4th to 15th week after harvest, unreacted starch tended to decrease across
all three storage locations, with corn stored indoors exhibiting the greatest rate of
25
decrease and different from the other stored corn. This behavior was likely related to the
decrease seen for corn harvested in 2011 during the 4th to 10th week, although the
decrease in unreacted starch content was not as steep. When comparing between years,
the rates of changes in corn harvested in 2012 were, in general, different from the rates of
changes seen with corn harvested in 2011 except for the corn stored under refrigerated
conditions.
The 2012 harvest year corn showed a general increase in unreacted starch content
from the 15th to the 23rd week of storage, which was also observed starting at the 10th
week of storage of the 2011 harvest year corn. Statistically, none of these slopes from
different storage conditions in the 2012 storage year were different from each other.
When this trend in 2012 corn was compared to storage conditions counterparts from
2011, the outdoor corn slopes were not statistically significant, but the refrigerated corn
slopes were considered statistically significant.
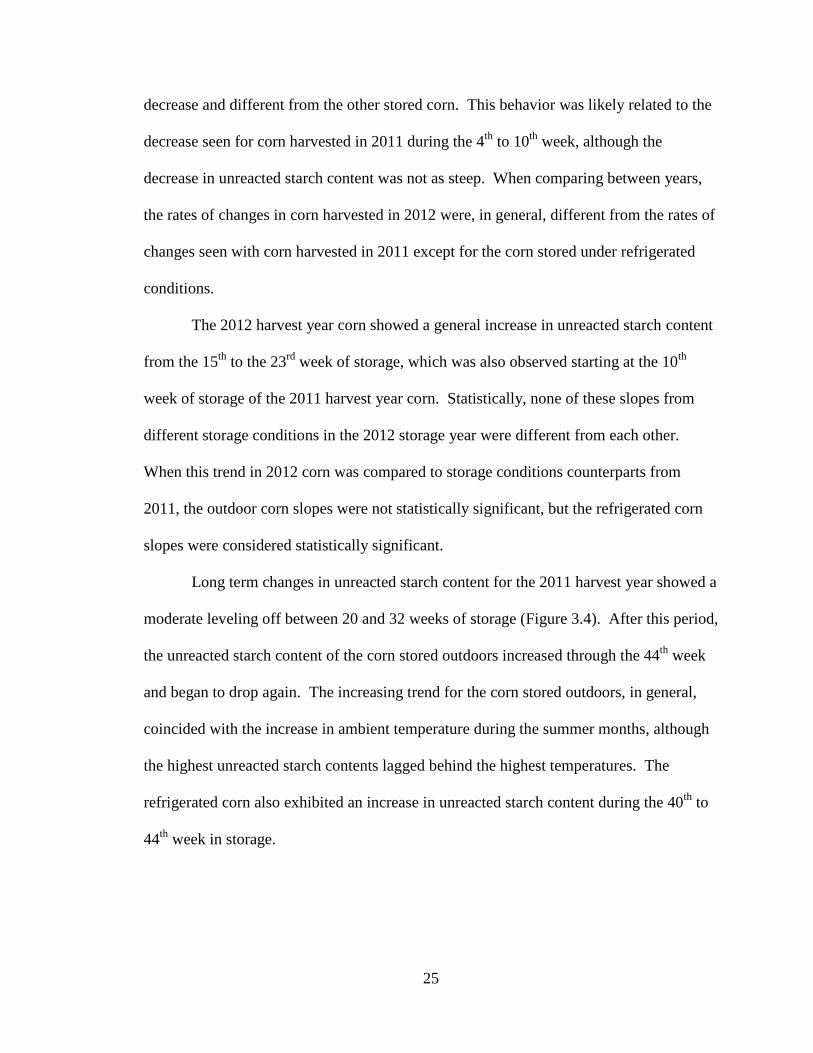
Long term changes in unreacted starch content for the 2011 harvest year showed a
moderate leveling off between 20 and 32 weeks of storage (Figure 3.4). After this period,
the unreacted starch content of the corn stored outdoors increased through the 44th week
and began to drop again. The increasing trend for the corn stored outdoors, in general,
coincided with the increase in ambient temperature during the summer months, although
the highest unreacted starch contents lagged behind the highest temperatures. The
refrigerated corn also exhibited an increase in unreacted starch content during the 40th to
44th week in storage.
26
Figure 3.4. Unreacted starch content () in corn harvested in 2011 and temperature storage
conditions () during the 48 weeks in storage.
3.4 Conclusion
This study showed that unreacted starch content in corn increased during the first
four weeks after harvest, then decreased until 10 to 15 weeks, and finally increased for
the remainder of the 5 to 12 months in storage. Unreacted starch content was strongly
correlated with storage time and mildly correlated with storage temperature. For the 4th
to15th week of storage, the corn stored indoors had a different rate of decrease in
unreacted starch content than the corn stored outdoors and under refrigerated conditions.
In each year of the study, at all other time periods of storage, there were no differences
amongst the rates of change in unreacted starch content. However, there was a difference
between rates of increase or decrease in unreacted starch content across years.
Storage Time (week)
Unr
eact
ed S
tarc
h (%
)
Tem
pera
ture
(o C
)
0 4 8 12 16 20 24 28 32 36 40 44 48 50-2 -10
2 0
6 10
10 20
14 30
18 402011 Harvest - Outdoors
Storage Time (week)
Unr
eact
ed S
tarc
h (%
)
Tem
pera
ture
(o C
)
0 4 8 12 16 20 24 28 32 36 40 44 48 50-2 -10
2 0
6 10
10 20
14 30
18 402011 Harvest - Refrigerated
27
CHAPTER 4. PREDICTING UNREACTED STARCH LEVELS IN CORN BY
FOURIER TRANSFORM NEAR INFRARED SPECTROSCOPY
4.1 Introduction
In order for ethanol companies to minimize the amount of unreacted starch in the
dry grind ethanol process and in the DDGS, it would be beneficial to develop a high
throughput procedure for monitoring unreacted starch levels in incoming corn. Preferably
the method would provide a rapid assessment of unreacted starch levels and
instrumentation be installed online at an ethanol facility. This method would allow dry
grind ethanol plants to have greater control of managing their corn inventory, provide a
better understanding of possible sources of error in the process, and increase processing
efficiency by adapting conditions and enzymes used to fit the corn. Given the fast speed
of near infrared spectroscopy and its usefulness in quantifying similar organic compound,
the second goal of this research was to develop a model for unreacted starch content in
ground corn flour using near infrared spectroscopy.
4.2 Materials and Methods
4.2.1 Sample preparation and unreacted starch determination
Starch blends (0 to 33% unreacted starch content) were prepared by mixing
weight proportions of Hi-maize resistant starch (Honeyville, Brigham City, UT) with
starch (Product No. S516-500, Fisher Scientific). Honeyville’s product contains Hi-
maize®260 (Ingredion, Bridgewater, NJ) resistant starch that has been isolated from high
amylose corn hybrids produced through traditional plant breeding and contains 33%
digestible, or glycemic, starch. The unreacted starch contents of the blends were verified
using the same liquefaction and saccharification procedure used with the ground corn

28
samples described in Section 3.2. Results of the verification tests are available Figure
B.1 in Appendix B.
Pioneer P1395R yellow dent corn was harvested from the Agricultural and
Biological Engineering Farm in Urbana, IL in October 2011 and the same hybrid was
provided from Pioneer directly in October 2012. Ground corn samples, dried and un-
dried (or “wet”), were prepared (Figure 4.1) and the procedures for determining their
unreacted starch contents were determined according to the procedures described in
Section 3.2. Note that the FT-NIR scans were conducted prior to the samples undergoing
the dry grind process, and those scans matched to the results of the GOPOD assay. Any
change in starch resistance that was a result of the dry grind process is not represented in
the NIR spectral scans.
4.2.2 Scanning, processing and analyses of FT-NIR spectra
A spectrophotometer (Perkin Elmer Spectrum One NTS Waltham, MA) was used
to scan 100 dry ground corn samples and 50 starch blend samples. Approximately a 5 g
subsample was poured in a smaller NIRA cup, leveled, and scanned 16 times with a
manual rotation between each scan. This procedure was repeated five times with separate
subsamples and the resulting spectral scans were averaged.
29
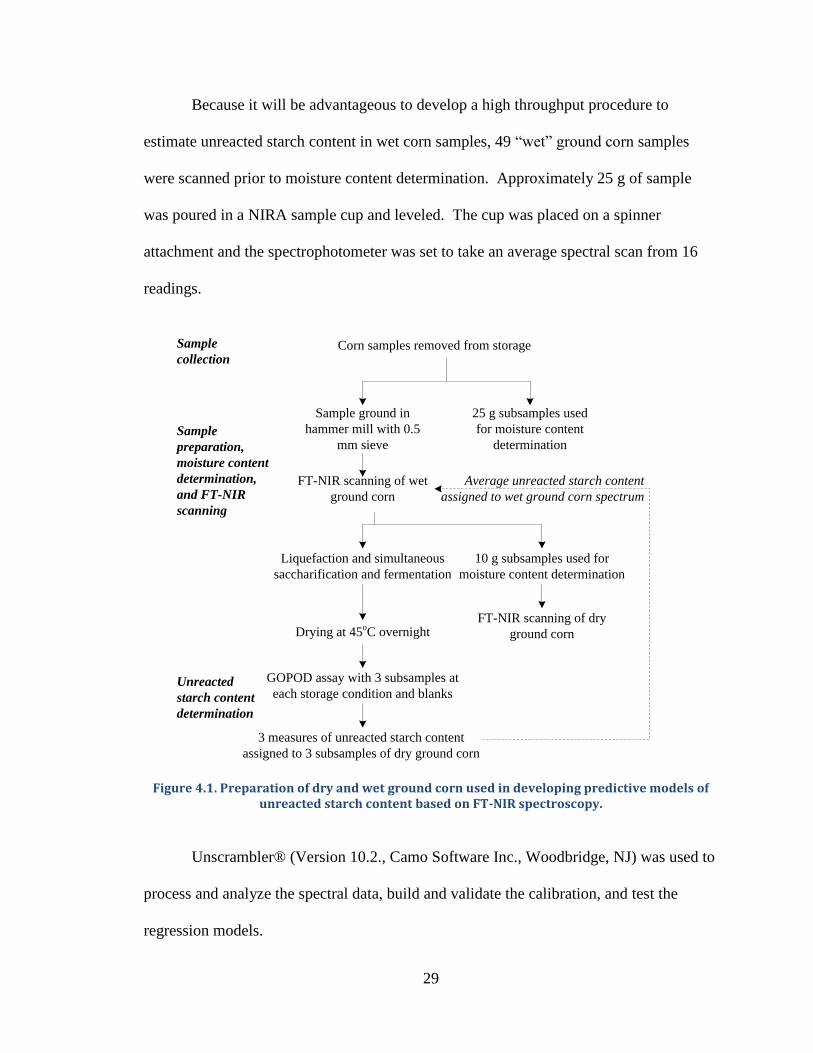
Because it will be advantageous to develop a high throughput procedure to
estimate unreacted starch content in wet corn samples, 49 “wet” ground corn samples
were scanned prior to moisture content determination. Approximately 25 g of sample
was poured in a NIRA sample cup and leveled. The cup was placed on a spinner
attachment and the spectrophotometer was set to take an average spectral scan from 16
readings.
Figure 4.1. Preparation of dry and wet ground corn used in developing predictive models of
unreacted starch content based on FT-NIR spectroscopy.
Unscrambler® (Version 10.2., Camo Software Inc., Woodbridge, NJ) was used to
process and analyze the spectral data, build and validate the calibration, and test the
regression models.
Sample collection
Corn samples removed from storage
Sample ground in hammer mill with 0.5
mm sieve
25 g subsamples used for moisture content
determination
10 g subsamples used for moisture content determination
Sample preparation, moisture content determination, and FT-NIR scanning
Unreacted starch content determination
FT-NIR scanning of dry ground corn
FT-NIR scanning of wet ground corn
Liquefaction and simultaneous saccharification and fermentation
Drying at 45oC overnight
GOPOD assay with 3 subsamples at each storage condition and blanks
3 measures of unreacted starch content assigned to 3 subsamples of dry ground corn
Average unreacted starch content assigned to wet ground corn spectrum

30
4.3 Results and Discussion
4.3.1 Unreacted starch content in starch blends, dry and wet ground corn
A total of 56 samples of unreacted starch blends were used to create unreacted
starch models. The histograms for the starch blends are shown in Figure 4.2. The
samples measured ranged from 0 to 33.3% resistant starch, with a mean of 16.69%.
There were 36 samples were used in the calibration set, 14 samples were used in the
validation set, and six samples were used in the test set.
Figure 4.2. Histograms of the calibration, validation, a30nd test sets used in developing
predictive models for the starch blends.
The dry ground corn models were made using 100 samples of corn from the 2011
and 2012 harvest years. For calibration, validation, and testing, 72, 20, and 8 samples
were used, respectively (Figure 4.3). The values of resistant starch ranged from 5.1% to
16.6%, with the mean value being 11.9%. The wet ground corn models were made using
49 samples of corn from the 2011 and 2012 harvest years. There were 36 samples were
No.
of
Sam
ples
0
1
2
3
4
5
6
7
8
0.0-
3.9
4.0-
7.9
8.0-
11.9
12.0
-15.
9
16.0
-19.
9
20.0
-23.
9
24.0
-27.
9
28.0
-31.
9
32.0
-36.
0
>36
.0
Starch blendsCalibration
0.0-
3.9
4.0-
7.9
8.0-
11.9
12.0
-15.
9
16.0
-19.
9
20.0
-23.
9
24.0
-27.
9
28.0
-31.
9
32.0
-36.
0
>36
.0
Validation
Test
Starch blends
Unreacted Starch (%)

31
used for calibration, 10 samples for validation, and three samples for the test set. The
values of resistant starch ranged from 1.6% to 15.1%, with the mean value being 10.1%.
Figure 4.3. Histograms of the calibration, validation, and test sets used in developing
predictive models for the dry and wet ground corn.
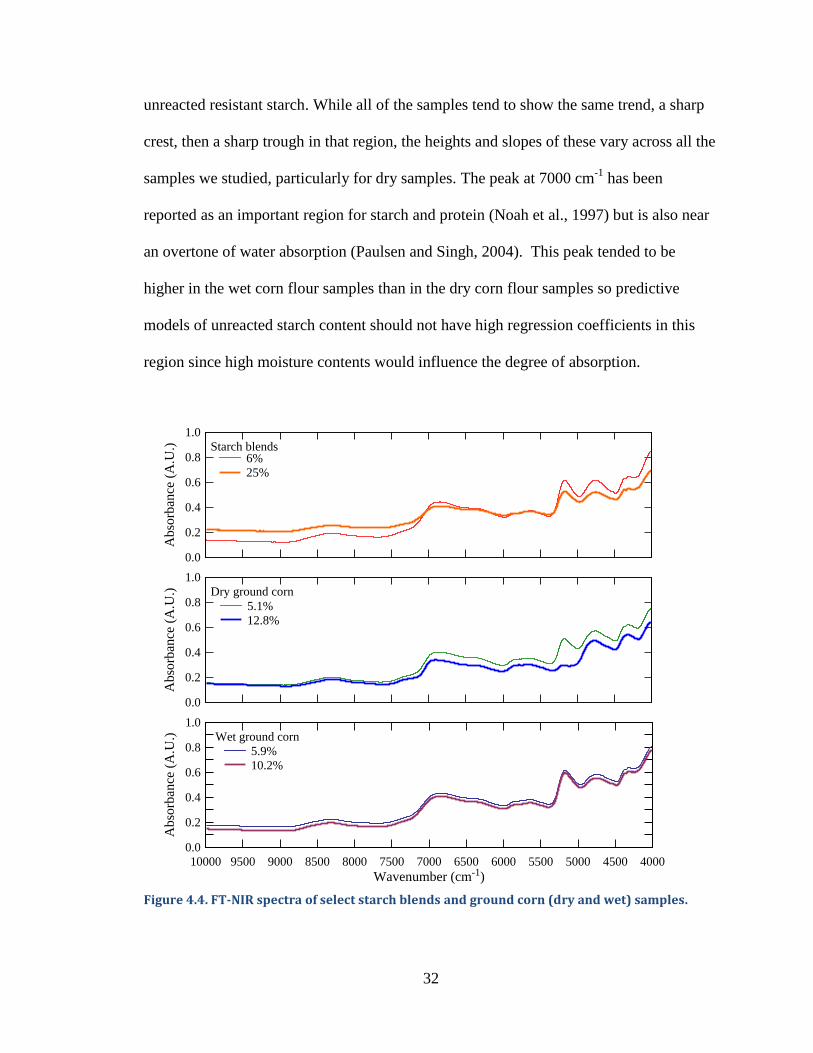
4.3.2 FT-NIR Spectra
The FT-NIR spectra of the starch blends, dry corn flour, and wet corn flour
showed prominent peaks, both crests and troughs, at around 5250 cm-1 and 7000 cm-1
(Figures 4.4). The region around 5250 cm-1 has been noted for O-H stretching and O-H
deformation and was discussed as a possible measure of the stability amylose and
amylopectin gel structures (Lindberg and Kiala, 1980), as both are components of
No.
of
Sam
ples
0
5
10
15
20
25
30
350.
0-1.
9
2.0-
3.9
4.0-
5.9
6.0-
7.9
8.0-
9.9
10.0
-11.
9
12.0
-13.
9
14.0
-15.
9
16.0
-18.
0
>18
.0
Dry ground cornCalibration
0.0-
1.9
2.0-
3.9
4.0-
5.9
6.0-
7.9
8.0-
9.9
10.0
-11.
9
12.0
-13.
9
14.0
-15.
9
16.0
-18.
0
>18
.0
Validation Test
Dry ground corn
No.
of
Sam
ples
0
5
10
15
0.0-
1.9
2.0-
3.9
4.0-
5.9
6.0-
7.9
8.0-
9.9
10.0
-11.
9
12.0
-13.
9
14.0
-15.
9
16.0
-18.
0
>18
.0Wet ground cornCalibration
0.0-
1.9
2.0-
3.9
4.0-
5.9
6.0-
7.9
8.0-
9.9
10.0
-11.
9
12.0
-13.
9
14.0
-15.
9
16.0
-18.
0
>18
.0
Validation Test
Wet ground corn
Unreacted Starch (%)
32
unreacted resistant starch. While all of the samples tend to show the same trend, a sharp
crest, then a sharp trough in that region, the heights and slopes of these vary across all the
samples we studied, particularly for dry samples. The peak at 7000 cm-1 has been
reported as an important region for starch and protein (Noah et al., 1997) but is also near
an overtone of water absorption (Paulsen and Singh, 2004). This peak tended to be
higher in the wet corn flour samples than in the dry corn flour samples so predictive
models of unreacted starch content should not have high regression coefficients in this
region since high moisture contents would influence the degree of absorption.
Figure 4.4. FT-NIR spectra of select starch blends and ground corn (dry and wet) samples.
Abs
orba
nce
(A.U
.)
0.0
0.2
0.4
0.6
0.8
1.0Starch blends
6%25%
Abs
orba
nce
(A.U
.)
0.0
0.2
0.4
0.6
0.8
1.0Dry ground corn
5.1%12.8%
Wavenumber (cm-1)
Abs
orba
nce
(A.U
.)
10000 9500 9000 8500 8000 7500 7000 6500 6000 5500 5000 4500 40000.0
0.2
0.4
0.6
0.8
1.0Wet ground corn
5.9%10.2%

33
NIR scans of waxy corn and high amylose corn were also conducted for reference
(Figure 4.5), as the difference in amylose and amylopectin ratios would mean that those
samples likely represent the opposite ends of theoretical unreacted starch content in corn.
From 4,000 cm-1 to 6,000 cm-1, the peak and trough for waxy corn were steeper than that
of high amylose corn, and the absorbance values were higher for waxy corn in both the
peak and the trough. Since higher amylose contents are known to correlate with an
increase in unreacted starch, one would expect higher unreacted starch contents to
correlate with higher values in this region. This trend held true for most samples as
samples with lower unreacted starch content had higher absorbance values in this region
and, beyond this region, samples with lower amounts of unreacted starch had higher
absorbances. In the 4,000 cm-1 to 4,500 cm-1 region, absorbance values increased with
decreasing unreacted starch content.
Figure 4.5. FT-NIR spectra of select starch blends with different unreacted starch content
(%) and ground samples of waxy and high amylose corn.
Wavenumber (cm-1)
Abs
orba
nce
(A.U
.)
10000 8000 6000 40000.0
0.1
0.2
0.3
0.4
0.5
0.6
0.7
0.8
0.9
1.0
Waxy corn
High amylose corn
Starch blends6%11%19%
Wavenumber (cm-1)
Abs
orba
nce
(A.U
.)
7250 6250 5250 42500.3
0.4
0.5
0.6
0.7
0.8
Waxy corn
High amylose corn
6%11%19%
34
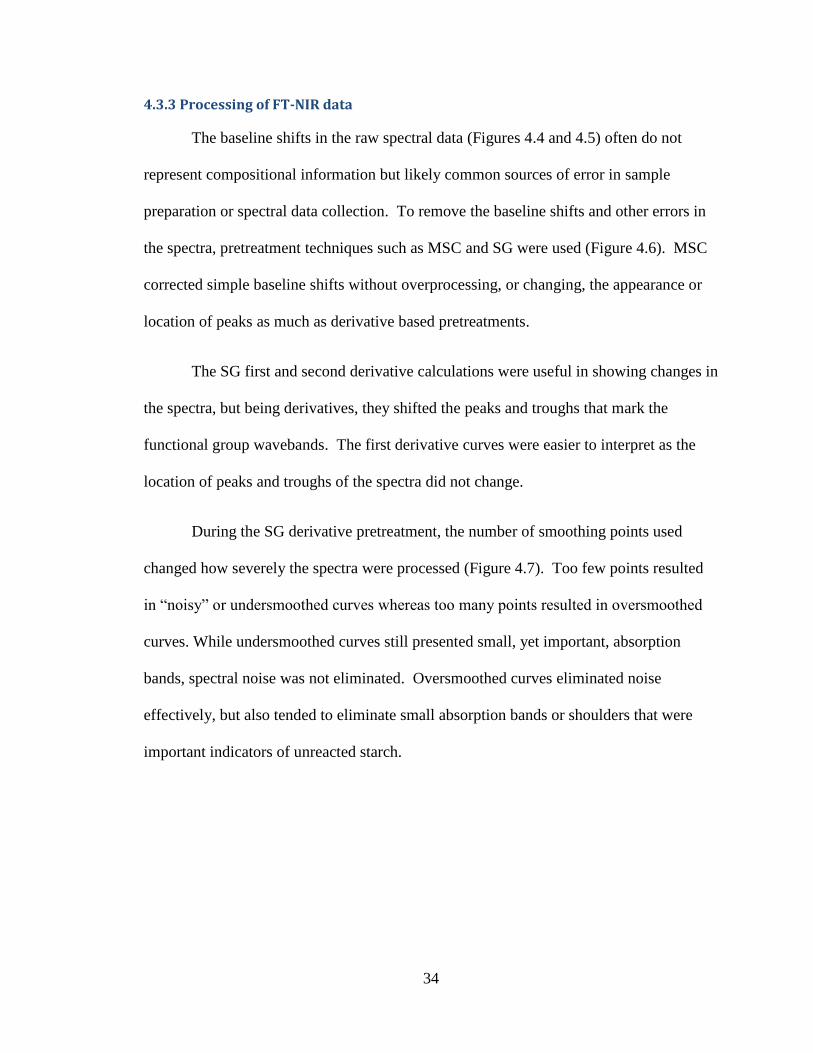
4.3.3 Processing of FT-NIR data
The baseline shifts in the raw spectral data (Figures 4.4 and 4.5) often do not
represent compositional information but likely common sources of error in sample
preparation or spectral data collection. To remove the baseline shifts and other errors in
the spectra, pretreatment techniques such as MSC and SG were used (Figure 4.6). MSC
corrected simple baseline shifts without overprocessing, or changing, the appearance or
location of peaks as much as derivative based pretreatments.
The SG first and second derivative calculations were useful in showing changes in
the spectra, but being derivatives, they shifted the peaks and troughs that mark the
functional group wavebands. The first derivative curves were easier to interpret as the
location of peaks and troughs of the spectra did not change.
During the SG derivative pretreatment, the number of smoothing points used
changed how severely the spectra were processed (Figure 4.7). Too few points resulted
in “noisy” or undersmoothed curves whereas too many points resulted in oversmoothed
curves. While undersmoothed curves still presented small, yet important, absorption
bands, spectral noise was not eliminated. Oversmoothed curves eliminated noise
effectively, but also tended to eliminate small absorption bands or shoulders that were
important indicators of unreacted starch.

35
Figure 4.6. Processing of the FT-NIR spectra of starch blends involved conducting a
multiplicative scatter correction (MSC), derivative calculations based on the Savitzky-Golay
(SG) algorithm, and combined smoothing and derivative calculation.
Wavenumber (cm-1)
Abs
orba
nce
(A.U
.)
10000 9500 9000 8500 8000 7500 7000 6500 6000 5500 5000 4500 40000.0
0.2
0.4
0.6
0.8
1.0
6%
25%
Wavenumber (cm-1)
1st D
eriv
ativ
e
10000 9500 9000 8500 8000 7500 7000 6500 6000 5500 5000 4500 4000-0.002
0.000
0.002
0.004
0.006
0.008
6%
25%
Savitzy-GolayPolynomial Order=2Left points=6Right points=6
Wavenumber (cm-1)
MS
C c
orre
cted
10000 9500 9000 8500 8000 7500 7000 6500 6000 5500 5000 4500 40000.0
0.2
0.4
0.6
0.8
1.0
5000 4750 45000.5
0.66% 25%
Wavenumber (cm-1)
2nd
Der
ivat
ive
10000 9500 9000 8500 8000 7500 7000 6500 6000 5500 5000 4500 4000-2.0E-4
0.0E+0
2.0E-4
4.0E-4
6%
25%
Savitzy-GolayPolynomial order=2Left points=6Right points=6
Wavenumber (cm-1)
MSC
+ 2
nd D
eriv
ativ
e
10000 9500 9000 8500 8000 7500 7000 6500 6000 5500 5000 4500 4000-4.0E-4
-2.4E-4
-8.0E-5
8.0E-5
2.4E-4
Savitzy-GolayPolynomial order=2Left points=6Right points=6
1st D
eriv
ativ
eM
SC
Cor
rect
edA
bsor
banc
e (A
.U.)
2nd
Der
ivat
ive
MS
C +
2nd
Der
ivat
ive

36
Figure 4.7. The size of the bandwidth used in the Savitzky-Golay (SG) algorithm determines
the smoothness of the resulting derivative curves. Undersmoothed curves were noisy while
certain features in the spectra are lost in oversmoothed curves.
Wavenumber (cm-1)
Abs
orba
nce
(A.U
.)
8000 7500 7000 6500 6000 5500 5000 4500 40000.0
0.2
0.4
0.6
0.8
1.0
6%25%
Wavenumber (cm-1)
2nd
Der
ivat
ive
8000 7500 7000 6500 6000 5500 5000 4500 4000-4.0E-4
-2.0E-4
0.0E+0
2.0E-4
4.0E-4
Polynomial order=2Left points=2Right points=2
6%25%
Wavenumber (cm-1)
2nd
Der
ivat
ive
8000 7500 7000 6500 6000 5500 5000 4500 4000-4.0E-4
-2.0E-4
0.0E+0
2.0E-4
4.0E-4
Polynomial order=2Left points=10Right points=10
6%25%
Wavenumber (cm-1)
2nd
Der
ivat
ive
8000 7500 7000 6500 6000 5500 5000 4500 4000-4.0E-4
-2.0E-4
0.0E+0
2.0E-4
4.0E-4
Polynomial order=2Left points=25Right points=25
6%25%
2nd
Der
ivat
ive
2nd
Der
ivat
ive
2nd
Der
ivat
ive
Abs
orba
nce
(A.U
.)

37
4.3.4 PLS Modeling
Partial least squares models using MSC, SG first and second derivatives, and a
combination of MSC with SG second derivate pretreated spectral data were developed for
starch blends and ground corn. Results of calibration, validation, and prediction are
presented in Table 4.1, Figure 4.8, and Appendix C.
Models for the unreacted starch blends outperformed the other models with RPD
values up to 7.28, R2 = 0.97 and 95% explained variance. The best model for the
unreacted starch blends was the model made with combined MSC and SG second
derivative pretreatments, although results of the MSC model were similar. The unreacted
starch blend models were expected to yield better results than the models developed for
corn, as these samples likely did not have large or varying amounts of other constituents
in corn, such as proteins, lipids, etc. The calibration and validation sets of the starch
blends also had a wider range compared to the corn flour sets.
The best model for dry ground corn was also based on the spectra pretreated with
a combined MSC and SG second derivative. It had 85% explained variance and an RPD
of 2.07. This model was based on the highest number of calibration and validation data
points, although the range of unreacted starch values was narrow, from 5.1% to 16.6%
with a standard deviation of 2.34%. This model could be improved with the addition of
more samples with a wider range of unreacted starch content and a more accurate
procedure for measuring glucose than the colorimetric GOPOD assay, such as high
performance liquid chromatography.
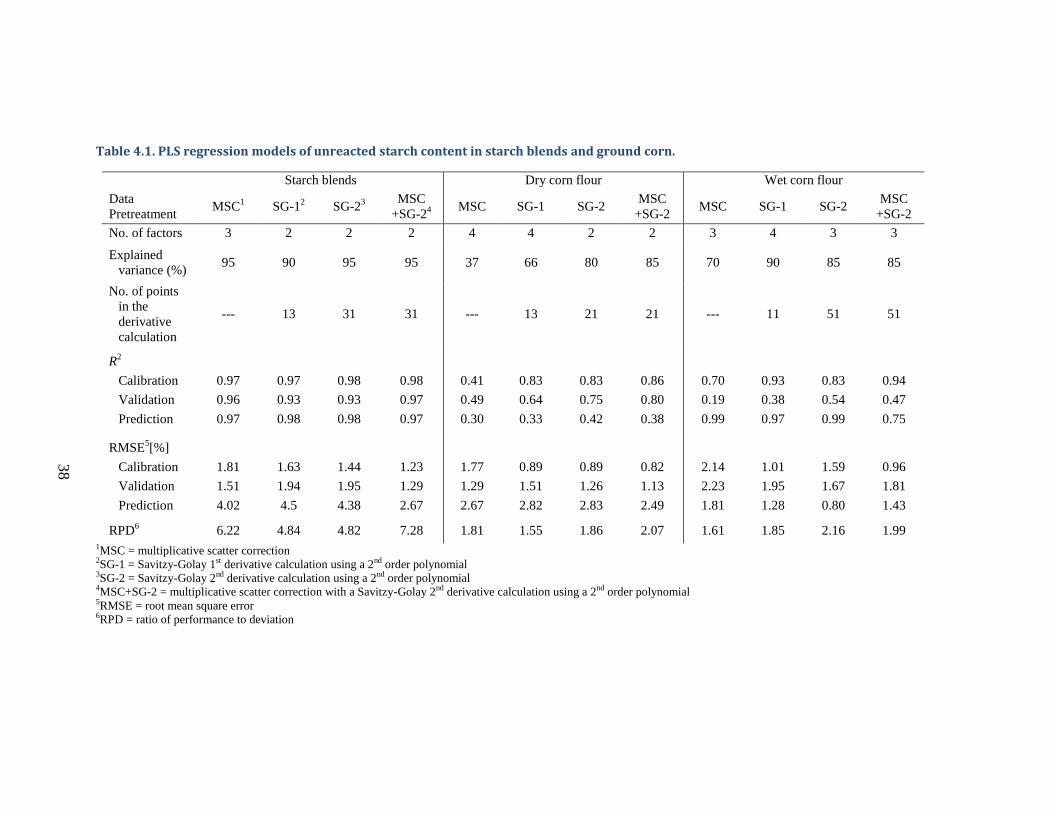
Table 4.1. PLS regression models of unreacted starch content in starch blends and ground corn.
Starch blends Dry corn flour Wet corn flour
Data Pretreatment
MSC1 SG-12 SG-23 MSC
+SG-24 MSC SG-1 SG-2
MSC +SG-2
MSC SG-1 SG-2 MSC
+SG-2
No. of factors 3 2 2 2 4 4 2 2 3 4 3 3
Explained variance (%)
95 90 95 95 37 66 80 85 70 90 85 85
No. of points in the derivative calculation
--- 13 31 31 --- 13 21 21 --- 11 51 51
R2
Calibration
Validation
Prediction
0.97
0.96
0.97
0.97
0.93
0.98
0.98
0.93
0.98
0.98
0.97
0.97
0.41
0.49
0.30
0.83
0.64
0.33
0.83
0.75
0.42
0.86
0.80
0.38
0.70
0.19
0.99
0.93
0.38
0.97
0.83
0.54
0.99
0.94
0.47
0.75
RMSE5[%]
Calibration
Validation
Prediction
1.81
1.51
4.02
1.63
1.94
4.5
1.44
1.95
4.38
1.23
1.29
2.67
1.77
1.29
2.67
0.89
1.51
2.82
0.89
1.26
2.83
0.82
1.13
2.49
2.14
2.23
1.81
1.01
1.95
1.28
1.59
1.67
0.80
0.96
1.81
1.43
RPD6 6.22 4.84 4.82 7.28 1.81 1.55 1.86 2.07 1.61 1.85 2.16 1.99 1MSC = multiplicative scatter correction 2SG-1 = Savitzy-Golay 1st derivative calculation using a 2nd order polynomial 3SG-2 = Savitzy-Golay 2nd derivative calculation using a 2nd order polynomial 4MSC+SG-2 = multiplicative scatter correction with a Savitzy-Golay 2nd derivative calculation using a 2nd order polynomial 5RMSE = root mean square error 6RPD = ratio of performance to deviation
38

39
Figure 4.8. Comparison of predicted to measured unreacted starch content using the
calibration (), validation (), and test () sets of starch blends and ground corn.
The best model for wet ground corn used the SG second derivative pretreated
spectra data. It had 85% explained variance and an RPD of 2.16. This was better than
the model for dry ground corn despite the fact that water would have interfered and
masked important absorption bands in the spectra. One possible explanation for this was
that the unreacted starch values for wet corn flour samples were based on was the average
Measured Unreacted Starch (%)
Pre
dict
ed U
nrea
cted
Sta
rch
(%)
0 5 10 15 200
5
10
15
20
Starch blendsMSC + 2nd Derivative Model
Measured Unreacted Starch (%)
Pre
dict
ed U
nrea
cted
Sta
rch
(%)
0 5 10 15 200
5
10
15
20
Starch blendsMSC + 2nd Derivative Model
Measured Unreacted Starch (%)
Pre
dict
ed U
nrea
cted
Sta
rch
(%)
0 5 10 15 200
5
10
15
20
Dry ground cornMSC + 2nd DerivativeModel
Measured Unreacted Starch (%)
Pre
dict
ed U
nrea
cted
Sta
rch
(%)
0 5 10 15 200
5
10
15
20
Dry ground cornMSC + 2nd DerivativeModel
Measured Unreacted Starch (%)
Pre
dict
ed U
nrea
cted
Sta
rch
(%)
0 5 10 15 200
5
10
15
20
Wet ground corn2nd Derivative Model
Measured Unreacted Starch (%)0 5 10 15 20
Wet ground corn2nd Derivative Model
Measured Unreacted Starch (%)
Pre
dict
ed U
nrea
cted
Sta
rch
(%)

40
of three replicates, unlike for dry ground corn samples, measures were based on one
replicate. The calibration set for wet ground corn also had a wider range than for dry
ground corn, from 1.6% to 15.1% with a standard deviation of 3.6%.
All of the models had high correlation coefficients in the important regions of
4000 to 5000 cm-1, 5250 cm-1, and 7000 cm-1 for starch (Figure 4.9). However, the 7000
cm-1 waveband likely was attributable to protein and water content in corn. The wet
ground corn model also relied on a peak around 5,100 cm-1, which is a known water
absorption band (Ben-Gera and Norris, 1968; Paulsen and Singh, 1994). Since the peaks
and valleys of regression coefficients coincided with the important starch regions
reported in the literature and in the starch blends, with high values at 5,250 cm-1, the
resulting regression models were accurate predicting unreacted starch content instead of
other constituents in the ground corn.

41
Figure 4.9. Regression coefficients of the best models developed for predicting unreacted
starch content in starch blends and ground corn.
4.4 Conclusion
Using FT-NIR spectroscopy to predict unreacted starch content in corn as an in
line monitoring tool in ethanol facilities is promising, as several models approached
rough screening quality and were based on the important regions known to correlate with
starch. The starch blend models had an RPD of 7.28. The models for dry ground corn
and wet ground corn had RPD values of 2.07 and 2.16, respectively, which is almost at a
rough screening level.
Wavenumber (cm-1)
Reg
ress
ion
Coe
ffic
ient
s
10000 9500 9000 8500 8000 7500 7000 6500 6000 5500 5000 4500 4000-25000
-15000
-5000
5000
15000
25000Starch blendsMSC + 2nd Derivative Model
Factor 1Factor 2
Wavenumber (cm-1)
Reg
ress
ion
Coe
ffic
ient
s
10000 9500 9000 8500 8000 7500 7000 6500 6000 5500 5000 4500 4000-500
-300
-100
100
300
500Dry ground cornMSC + 2nd Derivative
Factor 1
Wavenumber (cm-1)
Reg
ress
ion
Coe
ffic
ient
s
10000 9500 9000 8500 8000 7500 7000 6500 6000 5500 5000 4500 4000-8000.0
-4000.0
0.0
4000.0
8000.0Wet ground corn2nd Derivative
Factor 1Factor 2
Reg
ress
ion
Coe
ffic
ient
s
42
CHAPTER 5. CONCLUSIONS AND FUTURE WORK
This study showed that unreacted starch content in corn increased during the first
four weeks after harvest, then decreased until 10 to 15 weeks, and finally increased for
the remainder of the 5 to 12 months in storage. Unreacted starch content was strongly
correlated with storage time and mildly correlated with storage temperature. From the 4th
to15th week of storage, the corn stored indoors had a different rate of decrease in
unreacted starch content than the corn stored outdoors and under refrigerated conditions.
In each year of the study, at all other time periods of storage, there were no differences
amongst the rates of change in unreacted starch content. However, there was a difference
between rates of increase or decrease in unreacted starch content across years.
Using FT-NIR spectroscopy to predict unreacted starch content in corn as an in
line monitoring tool in ethanol facilities is promising, as several models approached
rough screening quality and were based on the important regions known to correlate with
starch. Models for starch blends, dry ground corn, and wet ground corn had RPD values
of 7.28, 2.07, and 2.16, respectively.
In the future, experiments could be conducted to determine the effect other
factors, such as corn variety, types of mixes of enzymes used, or processing conditions,
on unreacted starch content. The storage experiments could be expanded to include a
wider range of temperature differences between storage conditions, to see if larger
differences in temperature cause would have a larger impact on the unreacted starch
content. The predictive models developed in this study could be further improved by
increasing sample sizes and including different corn varieties, especially waxy and high
amylose corn to get a wider range of unreacted starch content.
43
WORKS CITED
AACC International. 2000. Approved Methods of the American Association of Cereal
Chemists, 10th Ed. Methods AACCI Method 44-19.01. The Association: St. Paul,
MN
Abera, S. and S. K. Rakshit. 2004. Effect of dry cassava chip storage on yield and
functional properties of extracted starch. Starch-Stärke 56: 232-240.
Adolphe, D. 1979. Canola: Canada's rapeseed crop. Rapeseed Association of Canada
(56).50-52.
Below, F. 2013. University of Illinois Crop Science Professor, in discussion with the
author, May 2013.
Belyea, R.L., K.D. Rausch, and M.E. Tumbleson. 2004. Composition of corn and
distillers dried grains with solubles from dry grind ethanol processing.
Bioresource Technology 94: 293-298.
Ben-Gera, I. and K.H. Norris. 1968. Direct spectrophotometric determination of fat and
moisture in meat products. Journal of Food Science 33: 64-67.
Berry, C.S. 1986. Resistant starch – formation and measurement of starch that survives
exhaustive digestion with amylolytic enzymes during the determination of dietary
fiber. Journal of Cereal Science 4: 301-314.
Blanco, M., J. Coello, H. Iturriaga, S. Maspoch, and C. De La Pezuela. 1998. Near-
infrared spectroscopy in the pharmaceutical industry. Analyst 123: 135R-50R.
Blanco, M. and R. González Bañó. 2003. Determination of sugars in starch hydrolysates
by IR spectroscopy. Analytical Letters 36: 1607-1619.

44
Candolfi, A., R. De Maesschalck, D.L. Massart, P.A. Hailey, and A.C.E. Harrington.
1999. Identification of pharmaceutical excipients using NIR spectroscopy and
SIMCA. Journal of Pharmaceutical and Biomedical Analysis 19: 923-935.
Chrastil, J. 1990. Influence of storage on enzymes in rice grains. Journal of Agricultural
and Food Chemistry 38: 1198-202.
Delwiche, S. R. and J. B. Reeves III. 2010. A graphical method to evaluate spectral
preprocessing in multivariate regression calibrations: Example with Savitzky-
Golay filters and partial least squares regression. Applied Spectroscopy 64: 73-82.
De Maesschalck, R., A. Candolfi, D.L. Massart, and S. Heuerding. 1999. Decision
criteria for soft independent modeling of class analogy applied to near infrared
data. Chemometrics and Intelligent Laboratory Systems 47: 65-77.
Dubois, M., K.A. Gilles, J.K. Hamilton, P.A. Rebers, and F. Smith. 1956. Colorimetric
method for determination of sugars and related substances. Analytical Chemistry
28: 350-356.
EPA. 2009. New regulations for the National Renewable Fuel Standard Program for 2010
and Beyond. Available at
http://www.epa.gov/OMS/renewablefuels/420f09023.html. Accessed on 30 May
2012.
Esbensen, K. 2010. An Introduction to Multivariate Data Analysis and Experimental
Design. Aalborg University. 5th edition.
Fuentes-Zaragoza, E., M. J. Riquelme-Navarrete, E. Sánchez-Zapata, and J. A. Pérez-
Álvarez. 2010. Resistant starch as functional ingredient: A review. Food Research
International 43: 931-942.

45
Galliard, T. 1986. Hydrolytic and oxidative-degradation of lipids during storage of whole
meal flour - effects of bran and germ components. Journal of Cereal Science 4:
179-192.
Garcia-Rosas, M., A. Bello-Perez, H. Yee-Madeira, G. Ramos, A. Flores-Morales, and R.
Mora-Escobedo. 2009. Resistant starch content and structural changes in maize
(Zea mays) tortillas during storage. Starch-Stärke 61: 414-421.
Gormley, R. and T. Walshe. 1999. Effects of boiling, warm-holding, mashing and
cooling on the levels of enzyme-resistant potato starch. International Journal of
Food Science & Technology 34: 281-286.
Gough, M.C. 1985. Physical changes in large-scale hermetic grain storage. Journal of
Agricultural Engineering Research 31: 55-65.
Gras, P.W., M.L. Bason, L.A. Esteves, G.C. Sabio, P.C. Annis, and J.E.V. Graver. 1990.
Quality changes in maize stored in sealed bag stacks. Journal of Stored Products
Research 26: 199-206.
Gruchala, L. and Y. Pomeranz. 1992. Raw-starch degrading amylase(s) affect enzyme-
resistant starch. Journal of Food Science 57: 1433-1434.
Hao, X., K. Thelen, and J. Gao. 2012. Prediction of the ethanol yield of dry-grind maize
grain using near infrared spectroscopy. Biosystems Engineering 112: 161-70.
Hasjim, J., and J.L. Jane. 2009. Production of resistant starch by extrusion cooking of
acid-modified normal-maize starch. Journal of Food Science 74: C556-562.
Hendra, P.J. 2002. How does FTIR work. Internet Journal of Vibrational Spectroscopy 5
vol 6:3. http://www.ijvs.com/volume6/edition3/section1.html

46
Hódsági, M., S. Gergely, T. Gelencsér, and A. Salgó. 2012. Investigations of native and
resistant starches and their mixtures using near-infrared spectroscopy. Food and
Bioprocess Technology 5 (1): 401-417.
Hollmann, J., H. Themeier, U. Neese, and M.G. Lindhauer. 2013. Dietary fibre fractions
in cereal foods measured by a new integrated AOAC method. Food Chemistry
140. 86-589.
Jane, J.L., K.S. Wong, and A.E. McPherson. 1997. Branch structure difference in
starches of A- and B-type X-ray patterns revealed by their Naegeli dextrins.
Carbohydrate Research 300: 219-227.
Jane, J.L. 2009. Structural features of starch granules II. Food Science and Technology-
International Series, ed. J. Whistler and R. BeMiller. Elsevier Academic Press
Inc.: San Diego, CA.
Ji, Y., K. Wong, J. Hasjim, L. M. Pollak, S. Duvick, J. Jane, and P. J. White. 2003.
Structure and function of starch from advanced generations of new corn lines.
Carbohydrate Polymers 54: 305-319.
Jiang, H.Y., Y.J. Zhu, L.M. Wei, J.R. Dai, T.M. Song, Y.L. Yan, and S.J. Chen. 2007.
Analysis of protein, starch and oil content of single intact kernels by near infrared
reflectance spectroscopy (NIRS) in maize (Zea mays L.). Plant Breeding 126:
492-497.
Kim, Y., N.S. Mosier, R. Hendrickson, T. Ezeji, H. Blaschek, B. Dien, M. Cotta, B. Dale,
and M.R. Ladisch. 2008. Composition of corn dry-grind ethanol by-products:
DDGS, wet cake, and thin stillage. Bioresource Technology 99: 5165-5176.

47
Lindberg, J.J. and T. Kaila. 1980. NIR and spin probe studies on amylose and
amylopectin. Acta Chemica Scandinavica, Series B – Organic Chemistry and
Biochemistry 34: 757-761.
Mueller, S. 2010. 2008 National dry mill corn ethanol survey. Biotechnology Letters 32:
1261-1264.
Naes, T., T. Isaksson, T. Fearn, and T. Davies, eds. 2002. Multivariate calibration and
classification. Chichester, UK: NIR Publications.
Noah, L., P. Robert, S. Millar, and M. Champ. 1997. Near-infrared spectroscopy as
applied to starch analysis of digestive contents. Journal of Agricultural and Food
Chemistry 45: 2593-2597.
Onigbinde, A.O., and I.O. Akinyele. 1988. Biochemical and nutritional changes in corn
(Zea mays) stored at three temperatures. Journal of Food Science 53: 117-119,
123.
Paulsen, M.R., S.W. Mbuvi, A.E. Haken, B. Ye, and R.K. Stewart. 2003. Extractable
starch as a quality measurement of dried corn. Applied Engineering in Agriculture
19: 211-217.
Paulsen, M.R., S.S.S. Rathore, R.W. Steffen, Y. Zhang, B. Wrenn, M. Schlicher, and
A.L. Kennay. 2010. Spectroscopic determination of chemical properties of
DDGS. Paper No. 1009113. American Society of Agricultural and Biological
Engineers Annual International Meeting, Pittsburgh, PA.
Paulsen, M.R. and M. Singh. 2004. Calibration of a near-infrared transmission grain
analyser for extractable starch in maize. Biosystems Engineering 89: 79-83.
48
Perera, C., Z. Lu, J. Sell, and J. Jane. 2001. Comparison of physicochemical properties
and structures of sugary-2 cornstarch with normal and waxy cultivars. Cereal
Chemistry 78: 249-256.
Perez, S., P. M. Baldwin, and D. J. Gallant. 2009. Structural features of starch granules 1.
Food Science and Technology-International Series, ed. J. Whistler and R.
BeMiller. Elsevier Academic Press Inc.: San Diego, CA.
Planchot, V., P. Colonna, and A. Buleon. 1997. Enzymatic hydrolysis of α-glucan
crystallites. Carbohydrate Research 298: 319-26.
Posner, E.S. and C.W. Deyeo. 1986. Changes in milling properties of newly harvested
hard wheat during storage. Cereal Chemistry 63: 451-456.
Pomeranz, Y. 1992. Research and development regarding enzyme-resistant starch (RS) in
the USA: A review. European Journal of Clinical Nutrition 46: S63-S68.
Pronyk, C., W.E. Muir, N.D.G. White, and D. Abramson. 2004. Carbon dioxide
production and deterioration of stored canola. Canadian Biosystems Engineering
46: 3.25-3.33.
R Development Core Team (2008). R: A language and environment for statistical
computing. R Foundation for Statistical Computing, Vienna, Austria. ISBN 3-
900051-07-0, URL http://www.R-project.org.
Rendon-Villalobos, R., L. A. Bello-Pérez, P. Osorio-Díaz, J. Tovar, and O. Paredes-
López. 2002. Effect of storage time on in vitro digestibility and resistant starch
content of nixtamal, masa, and tortilla. Cereal Chemistry 79: 340-344.
49
Setiawan, S., H. Widjaja, V. Rakphongphairoj, and J.L. Jane. 2010. Effects of drying
conditions of corn kernels and storage at an elevated humidity on starch structures
and properties. Journal of Agricultural and Food Chemistry 58: 12260-12267.
Sharma, V., K.D. Rausch, J.V. Graeber, S.J. Schmidt, P. Buriak, M.E. Tumbleson, and V.
Singh. 2010. Effect of resistant starch on hydrolysis and fermentation of corn
starch for ethanol. Applied Biochemistry and Biotechnology 160: 800-811.
Shelke, K., R.C. Hoseney, J.M. Faubion, and S.P. Curran. 1992. Age-related-changes in
the cake-baking quality of flour milled from freshly harvested soft wheat. Cereal
Chemistry 69: 141-144.
Singh, V. 2012. Effect of corn quality on bioethanol production. Biocatalysis and
Agricultural Biotechnology 1: 3553-355.
Singh, V., A.E. Haken, Y.X. Niu, S.H. Zou, and S.R. Eckhoff. 1998. Wet-milling
characteristics of selected yellow dent corn hybrids as influenced by storage
conditions. Cereal Chemistry 75: 235-240.
Sreenivasan, A. 1939. Availability of phosphorus in rice. Nature 143: 244-245.
Srichuwong, S., and J.L. Jane. 2011. Methods for characterization of residual starch in
distiller's dried grains with solubles (DDGS). Cereal Chemistry 88: 278-82.
Stark, E. and K. Luchter. 1986. Near-infrared analysis (NIRA): A technology for
quantitative and qualitative analysis. Applied Spectroscopy Reviews 22: 335-399.
Stewart, J.A. 1975. Moisture migration during storage of preserved, high moisture grains.
Transactions of the ASAE 18: 387.

50
Szłyk, E., A. Szydłowska-Czerniak, and A. Kowalczyk-Marzec. 2005. NIR spectroscopy
and partial least-squares regression for determination of natural α-tocopherol in
vegetable oils. Journal of Agricultural and Food Chemistry 53: 6980-6987.
Szulczyk, K.R., B.A. McCarl, and G. Cornforth. 2010. Market penetration of ethanol.
Renewable and Sustainable Energy Reviews 14: 394-403.
Tester, R. F., W. R. Morrison, M. J. Gidley, M. Kirkland, and J. Karkalas. 1994.
Properties of damaged starch granules. III. microscopy and particle size analysis
of undamaged granules and remnants. Journal of Cereal Science 20 (1): 59-67.
Tikuisis, T., D.E. Axelson, and A. Sharma. 1993. Nondestructive quantitative
determination of starch content in polyethylene by solid state NMR and FTIR.
Polymer Engineering & Science 33: 26-31.
Udén, P. 2009. Estimating residual starch from in vitro fermentations by Fourier
transform mid-IR transmission spectroscopy. Animal Feed Science and
Technology 152: 133-140.
Vaidya, R.H. and M.K. Sheth. 2011. Processing and storage of Indian cereal and cereal
products alters its resistant starch content. Journal of Food Science and
Technology-Mysore 48: 622-627.
Valetudie, J.C., P. Colonna, B. Bouchet, and D.J. Gallant. 1993. Hydrolysis of tropical
tuber starches by bacterial and pancreatic alpha-amylases. Starch – Stärke 45:
270-276.
Vidal, B.C., K.D. Rausch, M.E. Tumbleson, and V. Singh. 2009. Determining corn germ
and pericarp residual starch by acid hydrolysis. Cereal Chemistry 86: 133-135.

51
Wehling R. L., Jackson D. S., Hooper D. G., Ghaedian A. R. 1993. Prediction of wet-
milling starch yield from corn by near infrared spectroscopy. Cereal Chemistry.
70: 720-723.
Zeleny, L. 1948. Chemical and nutritive changes in stored grain. Transactions of the
American Association of Cereal Chemists 6: 112-125.

52
APPENDIX A. STATISTICAL CODE IN R ENVIRONMENT
Code for Statistical Significance and Tukey’s test mean18 <- read.table("U:/DanaoLab/Ben Plumier/mean18.csv", sep=",", header=T) attach(mean18) summary(aov(glm(US ~ factor(Cond)))) mean20 <- read.table("U:/DanaoLab/Ben Plumier/mean20.csv", sep=",", header=T) attach(mean20) amod <- aov(US ~ Cond) library(agricolae) HSD.test(amod, "Cond", group=TRUE)
Code to determine Pearson correlation coefficients pearson <- read.table("C:/2011pearson.csv", sep=",", header=T) attach(pearson) cor(pearson[,c("Weeks", "Temperature", "US")], use="complete.obs")
Code for least squares regression and comparison of slopes week <- c(4,4,4,6,6,8,8,10,10) us <- c(5.94, 5.85, 5.71, 6.86, 6.21, 4.66, 4.76, 2.19, 2.70 ) fit <- lm(us~week) summary(fit)
P values for comparisons of slopes were then calculated using slopes and standard error of the slopes by the equation
T = b1-b2/(((Sb1)2 +(Sb22).5)
where b1 and b2 are the slopes the lines and Sb1 and Sb2 are the standard errors of the slopes.

53
APPENDIX B. VERIFICATION OF THE UNREACTED STARCH
CONTENT IN STARCH BLENDS
In a small experiment to test the possibility of creating resistant starch standards,
commercial starch from Honeyville, advertised as one third digestibly resistant starch was
tested with the unreacted starch assay outlined in Section 2.2. Three samples were
prepared with unreacted starch content ranging from 16% to 34%. Results, however,
were misleading as nearly all of the digestible starch were converted to glucose and
removed, leaving nothing but the unreacted starch. The calculations lead to unreacted
starch contents of 80% and above. Based on dry weights of recovered hydrolyzate, the
relations could be graphed between expected unreacted starch and actual unreacted starch
(Figure B.1).
A small amount of glucose, ranging from 12 % to 17%, was found to remain after
centrifuge washing. The percentage of nonstarch in the hydrolyzate ranged from 4% to
9%. However, the amount of solid hydrolyzate apparent in the samples varied greatly
after centrifuge washing, and a strong correlation was found between the theoretical
resistant starch contents and the weights of the hydrolyzate, with an R2 value of 0.9982.
This test demonstrated that our unreacted starch procedure is effective at
differentiating between enzyme resistant and nonresistant starch, and that commercially
available digestive resistant starch is a reasonably adequate analogue for enzymatically
resistant starch.
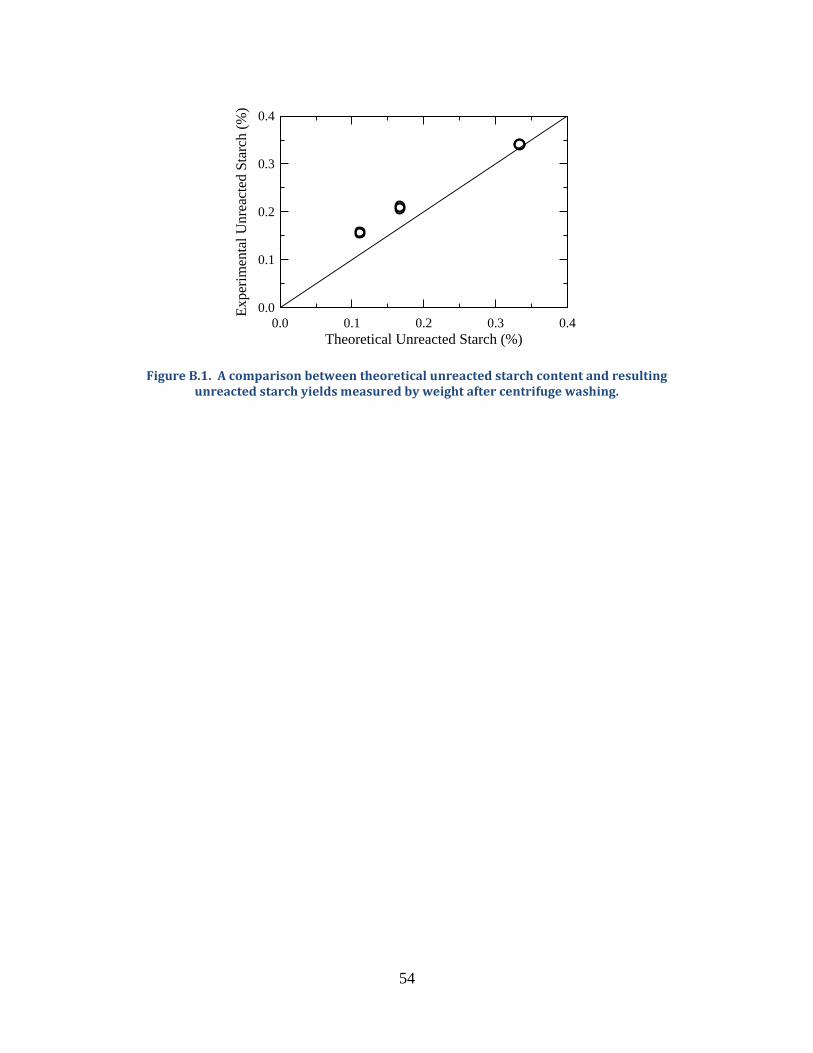
54
Figure B.1. A comparison between theoretical unreacted starch content and resulting unreacted starch yields measured by weight after centrifuge washing.
Theoretical Unreacted Starch (%)
Exp
erim
enta
l Unr
eact
ed S
tarc
h (%
)
0.0 0.1 0.2 0.3 0.40.0
0.1
0.2
0.3
0.4

55
APPENDIX C. FT-NIR SPECTRAL DATA PRETREATMENT AND
REGRESSION MODELS
Figure C.1. Raw and pretreated spectra of starch blends used in PLS regressions and analyses.
Wavenumber (cm-1)
Abs
orba
nce
(A.U
.)
10000 9500 9000 8500 8000 7500 7000 6500 6000 5500 5000 4500 40000.0
0.2
0.4
0.6
0.8
1.0
6%
25%
Wavenumber (cm-1)
1st D
eriv
ativ
e
10000 9500 9000 8500 8000 7500 7000 6500 6000 5500 5000 4500 4000-0.002
0.000
0.002
0.004
0.006
0.008
6%
25%
Savitzy-GolayPolynomial Order=2Left points=6Right points=6
Wavenumber (cm-1)
MS
C c
orre
cted
10000 9500 9000 8500 8000 7500 7000 6500 6000 5500 5000 4500 40000.0
0.2
0.4
0.6
0.8
1.0
5000 4750 45000.5
0.66% 25%
Wavenumber (cm-1)
2nd
Der
ivat
ive
10000 9500 9000 8500 8000 7500 7000 6500 6000 5500 5000 4500 4000-2.0E-4
0.0E+0
2.0E-4
4.0E-4
6%
25%
Savitzy-GolayPolynomial order=2Left points=6Right points=6
Wavenumber (cm-1)
MSC
+ 2
nd D
eriv
ativ
e
10000 9500 9000 8500 8000 7500 7000 6500 6000 5500 5000 4500 4000-4.0E-4
-2.4E-4
-8.0E-5
8.0E-5
2.4E-4
Savitzy-GolayPolynomial order=2Left points=6Right points=6
1st D
eriv
ativ
eM
SC
Cor
rect
edA
bsor
banc
e (A
.U.)
2nd
Der
ivat
ive
MS
C +
2nd
Der
ivat
ive
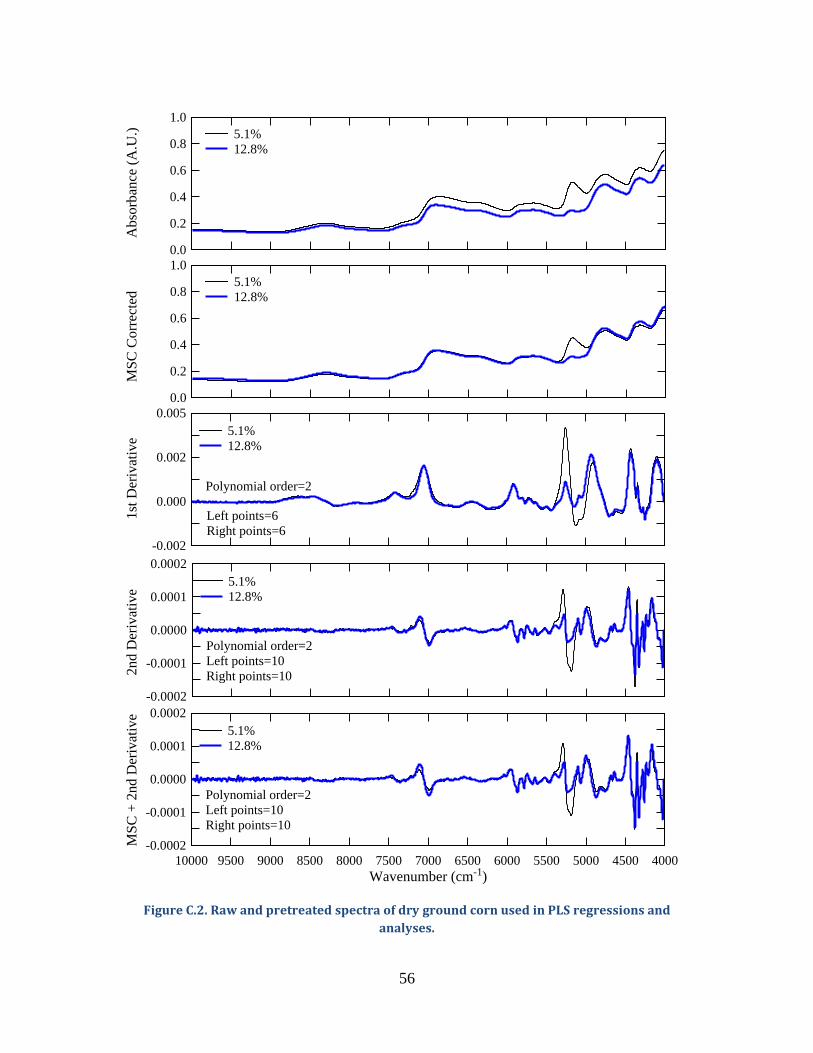
56
Figure C.2. Raw and pretreated spectra of dry ground corn used in PLS regressions and
analyses.
0.0
0.2
0.4
0.6
0.8
1.05.1%12.8%
0.0
0.2
0.4
0.6
0.8
1.05.1%12.8%
-0.002
0.000
0.002
0.005
Polynomial order=2
Left points=6Right points=6
5.1%12.8%
-0.0002
-0.0001
0.0000
0.0001
0.0002
Polynomial order=2Left points=10Right points=10
5.1%12.8%
Wavenumber (cm-1)10000 9500 9000 8500 8000 7500 7000 6500 6000 5500 5000 4500 4000
-0.0002
-0.0001
0.0000
0.0001
0.0002
Polynomial order=2Left points=10Right points=10
5.1%12.8%
MS
C +
2nd
Der
ivat
ive
2nd
Der
ivat
ive
1st D
eriv
ativ
eM
SC
Cor
rect
edA
bsor
banc
e (A
.U.)
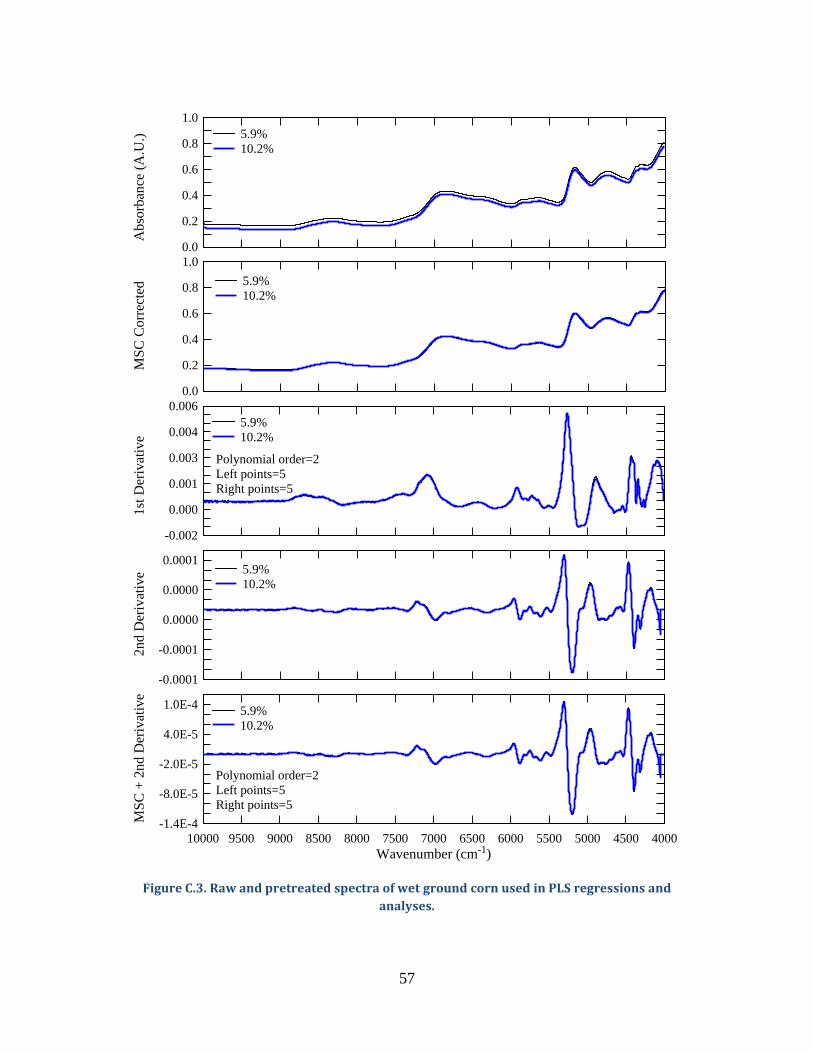
57
Figure C.3. Raw and pretreated spectra of wet ground corn used in PLS regressions and
analyses.
0.0
0.2
0.4
0.6
0.8
1.05.9%10.2%
-0.002
0.000
0.001
0.003
0.004
0.006
Polynomial order=2Left points=5Right points=5
5.9%10.2%
Wavenumber (cm-1)10000 9500 9000 8500 8000 7500 7000 6500 6000 5500 5000 4500 4000
-1.4E-4
-8.0E-5
-2.0E-5
4.0E-5
1.0E-4
Polynomial order=2Left points=5Right points=5
5.9%10.2%
0.0
0.2
0.4
0.6
0.8
1.0
5.9%10.2%
-0.0001
-0.0001
0.0000
0.0000
0.00015.9%10.2%
MS
C +
2nd
Der
ivat
ive
2nd
Der
ivat
ive
1st D
eriv
ativ
eM
SC
Cor
rect
edA
bsor
banc
e (A
.U.)

58
Figure C.4. Regression coefficients of the first two factors of the resulting PLS models for
unreacted starch content in starch blends.
-4
0
4
8 MSC Model
Factor 1Factor 2
-800
-400
0
400
8001st Derivative Model
Factor 1Factor 2
-25000
-15000
-5000
5000
15000
250002nd Derivative Model
Factor 1Factor 2
Wavenumber (cm-1)10000 9500 9000 8500 8000 7500 7000 6500 6000 5500 5000 4500 4000
-25000
-15000
-5000
5000
15000
25000MSC + 2nd Derivative Model
Factor 1Factor 2
Reg
ress
ion
Coe
ffic
ient
s

59
Figure C.5. Regression coefficients of the first two factors of the resulting PLS models for
unreacted starch content in dry ground corn.
-0.4
-0.2
0
0.2
0.4MSC Model
Factor 1Factor 2
-200
-100
0
100
2001st Derivative
Factor 1Factor 2
-10000
-5000
0
5000
100002nd Derivative
Factor 1Factor 2
Wavenumber (cm-1)10000 9500 9000 8500 8000 7500 7000 6500 6000 5500 5000 4500 4000
-8000
-5000
-2000
1000
4000
7000MSC + 2nd Derivative
Factor 1Factor 2
Reg
ress
ion
Coe
ffic
ient
s

60
Figure C.6. Regression coefficients of the first two factors of the resulting PLS models for
unreacted starch content in wet ground corn.
-1.2
-0.6
0.0
0.6
1.2MSC Model
Factor 1Factor 2
-200.0
-100.0
0.0
100.0
200.01st Derivative
Factor 1Factor 2
-8000.0
-4000.0
0.0
4000.0
8000.02nd Derivative
Factor 1Factor 2
Wavenumber (cm-1)10000 9500 9000 8500 8000 7500 7000 6500 6000 5500 5000 4500 4000
-12000.0
-8000.0
-4000.0
0.0
4000.0
8000.0 MSC + 2nd Derivative
Factor 1Factor 2
Reg
ress
ion
Coe
ffii
cent
s

61
Figure C.7. Cumulative variance explained by the different factors of the resulting PLS models
(MSC, black; SG 1st derivative, red; SG 2nd derivative, green; combined MSC and SG 2nd
derivative, blue).
0 1 2 3 4 5 6 70
20
40
60
80
100 Starch blends
MSC Model1st Derivative Model2nd Derivative ModelMSC + 2nd Derivative Model
-40
-10
20
50
80
110 Dry ground corn
MSC Model1st Derivative Model2nd Derivative ModelMSC + 2nd Derivative Model
No. of Factors0 1 2 3 4 5 6 7
0
20
40
60
80
100 Wet ground corn
MSC Model1st Derivative Model2nd Derivative ModelMSC + 2nd Derivative Model
Exp
lain
ed V
aria
nce
(%)

62
Figure C.8. Comparison of predicted to measured unreacted starch content using calibration
(), validation (), and test () sets of starch blend samples.
0 5 10 15 20 25 30 350
5
10
15
20
25
30
35
MSC Model
0 5 10 15 20 25 30 350
5
10
15
20
25
30
35
MSC Model
0
5
10
15
20
25
30
35
1st Derivative Model 1st Derivative Model
0
5
10
15
20
25
30
35
2nd Derivative Model 2nd Derivative Model
0 5 10 15 20 25 30 350
5
10
15
20
25
30
35
MSC + 2nd Derivative Model
0 5 10 15 20 25 30 35
MSC + 2nd Derivative Model
Measured Unreacted Starch (%)
Pre
dict
ed U
nrea
cted
Sta
rch
(%)

63
Figure C.9. Comparison of predicted to measured unreacted starch content using calibration
(), validation (), and test () sets of dry ground corn samples.
0
4
8
12
16
20
MSC Model MSC Model
0
4
8
12
16
20
1st Derivative Model 1st Derivative Model
0
4
8
12
16
20
2nd Derivative Model 2nd Derivative Model
0 4 8 12 16 200
4
8
12
16
20
MSC + 2nd DerivativeModel
0 4 8 12 16 20
MSC + 2nd DerivativeModel
Measured Unreacted Starch (%)
Pre
dict
ed U
nrea
cted
Sta
rch
(%)

64
Figure C.10. Comparison of predicted to measured unreacted starch content using calibration
(), validation (), and test () sets of wet ground corn samples.
0
4
8
12
16
20MSC Model MSC Model
0
4
8
12
16
201st Derivative Model 1st Derivative Model
0
4
8
12
16
20
2nd Derivative Model 2nd Derivative Model
0 4 8 12 16 200
4
8
12
16
20MSC + 2nd DerivativeModel
0 4 8 12 16 20
MSC + 2nd DerivativeModel
Measured Unreacted Starch (%)
Pre
dict
ed U
nrea
cted
Sta
rch
(%)