relationship factors influencing doctoral student retention and ...
LPU-Laguna Journal of Multidisciplinary Research
Vol. 4 No. 1 October 2020
31
Center for Research, Publication, and Intellectual Property
Modeling the Factors Influencing the Retention Decision of the Students of LPU-Laguna
and LPU-St. Cabrini using Students Integration Theory
Dr. Ryan Jeffrey Curbano, Dr. Noel B. Hernandez
College of Engineering and Computer Studies, Centro Escolar University Graduate School
ABSTRACT
The study was conducted to determine the factors that influence the student retention at LPU Laguna and
LPU-St. Cabrini. The study was guided by Tinto’s Student Integration Theory focusing the students view
on academic integration (faculty concern for student development and teaching and academic and
intellectual development), social integration (peer group interaction and faculty interaction), and
institutional and goal commitment. A total of 500 students were surveyed in this study. Stratified random
sampling was used as sampling design and quantitative descriptive statistics was used as research design.
The results revealed that majority of respondents were aged 20-22, female, 3rd year level, with more than
50,000 monthly income, and 2.01-2.50 general weighted average. In terms of assessment on factors
influencing the student retention, institutional and goal commitment had highest assessment while
academic and intellectual development had the lowest assessment. Findings showed that the measurement
model satisfies the requirement of exploratory and confirmatory factor analysis. Furthermore, faculty
concern for student development and teaching, peer group interaction, faculty interaction and
institutional and goal commitment were found significant factors of student retention. While in terms of
factors of retention decision and demographic profile, sex and GWA/GPA had significant relationship on
the student retention. The researchers suggested to continue faculty and student consultation, student’s
tutorial and enhanced student engagement activities to further improve the satisfaction level of the
students and longer stay in the institution.
Keywords: Student retention, social integration, academic integration, institutional and goal commitment
INTRODUCTION
For academic institutions, retention of students has become a challenging issue. One of the most
frequently researched topics in higher education is student retention (Seidman, 2005). Higher education
institutions have long been concerned with trying to ensure that students stay and finish their studies once
enrolled and that they get as much out of them as they can (Tight M., 2019). Institutions also talk about
levels of retention or graduation rates. Only if they know their students' intentions, the institution can
measure a realistic retention rate.
In many distinct aspects, including their academic and financial plans, low student retention rates
could impact tertiary institutions (Aljohani, 2016). Therefore, it is crucial for educators and policymakers
pursuing solutions to this issue to have an understanding of the context of the phenomenon of student
retention and the most common factors that lead students to leave their study programs.
The relevance of student retention problems is known to private higher education institutions
(HEIs) because the experience of students is a concrete demonstration of the validity and sense of the
institutional purpose (Scholder and Maguire, 2009). Therefore, it is important to request input from
students to determine retention factors about specific areas of the institution such as importance,
resources, academics, teachers, advisory / support services, social life, extracurricular activities,
educational objectives, and preparation for the future.
The process of student admission should be considered in order to see the retention rates in the
higher education institutions and this will be important in deciding how the students remain in the
university. Lyceum of the Philipines University-Laguna (LPU-Laguna) and LPU-St Cabrini School of
Health Sciences (LPU-St. Cabrini) are both higher education institutions in the Philippines that have an
average of 2500 undergraduate students per year and consistently competing with other nearby
LPU-Laguna Journal of Multidisciplinary Research
Vol. 4 No. 1 October 2020
32
Center for Research, Publication, and Intellectual Property
institutions. Similar with other institutions, LPU-Laguna and LPU-St Cabrini are private education
institutions generate their income mainly on the fees paid by the students. This income is largely
dependent on the number of enrollees it attracts and supports all the institution’s operations. Fortunately,
both institutions are ISO 9001:2015 certified and as part of the institutional quality objectives, the student
feedback and student retention rating have been monitored regularly. Both institutions had an overall
retention rate of 92 percent higher than the institutional target of 88 percent in the last academic year
2019-2020 and this was a product of the institutional mission of providing students with quality service.
This study aimed to develop a model based on factors that influenced the retention decisions of
the students in LPU-Laguna and LPU St. Cabrini School of Health Sciences. This study was guided by
Tinto’s student integration theory. The result of the study will guide the administrators of the institutions
in identifying the factors that would make students retain in the institutions using the variables suggested
in Tinto’s Model.
Review of Literature
The definition of retention in educational settings refers to “students' continued study until
successful completion” (Fowler & Luna, 2009). Student retention has been an issue facing higher
education for more than 70 years (J.M. Braxton, 2000). Tinto's (1993) Student Integration Model is one of
the oldest student retention models, in which he suggested an interaction model that laid the theoretical
basis for student attrition research (Weng et al., 2015). The main concept of Tinto’s model is the level of a
student’s integration into the social and academic systems of the college, which determines persistence or
dropout. Tinto (1993) has categorized student retention theories into three types: psychological,
environmental, and interactional. Psychological theories focus on individual personality attributes and
view student attrition as reflecting some shortcoming and/or weakness in the individual. Environmental
theories focus on the social, economic, and organizational forces impacting on student retention. Societal
theories emphasize the importance of social forces that are external to the higher education institution on
student retention such as social status, race, prestige, and opportunity.
As a result, they are insensitive to individual and institution specific forces that affect student
retention decisions. Economic theories emphasize the importance of individual finances and financial aid
in student retention. However, there is little empirical evidence to support the connection that financial
forces are primary influences for most students’ retention decisions. Tinto (1993) suggests that financial
variables appear to be of secondary significance to most students' choices. He suggests two reasons for
this; first the influence of finance on retention is more influential in college entry decisions than college
retention decisions. Secondly, while students often discuss financial reasons for leaving, other factors not
associated with finance are often their key reasons. When students have a positive experience at
university, they are often more likely to cope with financial problems in order to continue their study.
Organizational theories focus on the effect of organizational factors on student retention. Factors studied
within these theories include bureaucratic structure and size, faculty student ratios, and institutional
resources and goals. Organizational theories are useful in explaining student retention between higher
education institutions.
According to Tinto’s theory (1993), students enter university with a set of background
characteristics including: family backgrounds (e.g., family social status, parental formal education, and
parental expectations); individual attributes (e.g., gender, race, age, and academic aptitude); and, pre-
college schooling (e.g., high school achievement, academic course work). These background
characteristics combine to influence the initial goal and institutional commitments that the student brings
to the university environment. Goal commitments represent the degree to which the student is committed,
or motivated, to get a university degree in general. Institutional commitments represent the degree to
which the student is motivated to graduate from a specific university. These commitments change during
the student’s time at university as a result of the degree of integration into the academic and social
LPU-Laguna Journal of Multidisciplinary Research
Vol. 4 No. 1 October 2020
33
Center for Research, Publication, and Intellectual Property
systems of the university. In turn, these two types of integration lead to new levels of goal and
institutional commitments. In addition, the student’s initial goal and institutional commitments influence
their later goal and institutional commitments. Tinto states that ‘in the final analysis, it is the interplay
between the individual’s commitment to the goal of college completion, and his commitment to the
institution that determines whether or not the individual decides to drop out from college.
Another influential model is Bean’s model (1980) which was derived from theories of
organizational turnover and planned behavior. Student attrition is viewed as similar to turnover in
business organizations. A complex interaction of internal and external variables influences the direction
of the student’s intentions and ultimately the decision to leave or persist. The model recognized that
factors external to the institution can play a major role in affecting student decisions. Individual higher
education student attrition is viewed as resulting from the following variables: student background
variables, organizational variables, academic integration, social integration, environment variables,
attitudes, grade point average (GPA), institutional fit, institutional commitments/ loyalty, and intention to
leave or persist. Studies using Student Integration Theory suggest that academic integration, social
integration, institutional commitment and goal commitment have the strongest impact on student retention
Finally, an integrated model which combined both Tinto’s and Bean’s models, was developed
(Cabrera, et al, 1993) to offer an integrated framework for understanding the higher education persistence
process. The two models claimed that persistence was affected by the integration between the students
and the institution. Overall, the results of the integrated model support the propositions claimed in both
models. For example, the relationships among academic and social integration constructs, as well as those
among commitment constructs, are consistent in both models. Furthermore, support was also found for
external factors influencing.
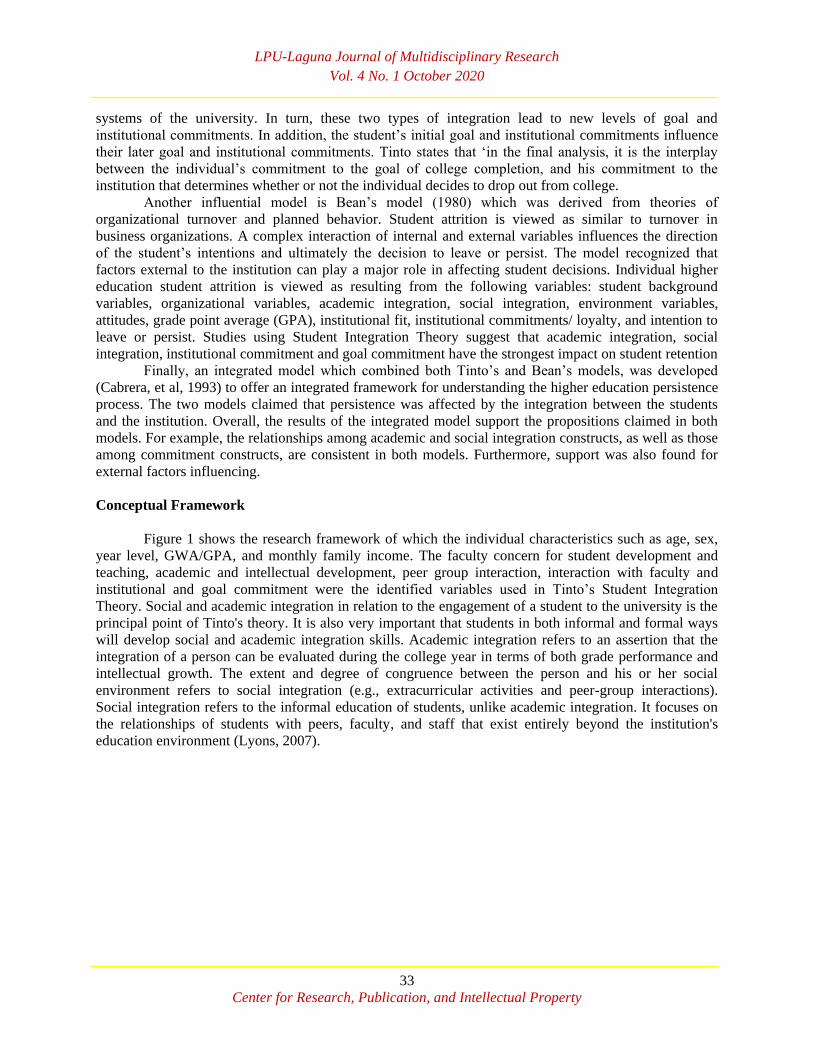
Conceptual Framework
Figure 1 shows the research framework of which the individual characteristics such as age, sex,
year level, GWA/GPA, and monthly family income. The faculty concern for student development and
teaching, academic and intellectual development, peer group interaction, interaction with faculty and
institutional and goal commitment were the identified variables used in Tinto’s Student Integration
Theory. Social and academic integration in relation to the engagement of a student to the university is the
principal point of Tinto's theory. It is also very important that students in both informal and formal ways
will develop social and academic integration skills. Academic integration refers to an assertion that the
integration of a person can be evaluated during the college year in terms of both grade performance and
intellectual growth. The extent and degree of congruence between the person and his or her social
environment refers to social integration (e.g., extracurricular activities and peer-group interactions).
Social integration refers to the informal education of students, unlike academic integration. It focuses on
the relationships of students with peers, faculty, and staff that exist entirely beyond the institution's
education environment (Lyons, 2007).
LPU-Laguna Journal of Multidisciplinary Research
Vol. 4 No. 1 October 2020
34
Center for Research, Publication, and Intellectual Property
Figure 1. Research Framework
While the target commitments of the students address the degree to which they are driven to enter
university, the institutional commitments of the students define the extent to which they are committed to
graduating from a specific university, resulting in the retention decision of the student to remain in the
institution.
Objectives of the Study
The main objective of the study is model the factors that influence the retention decision.
Specifically aimed to answer the following objectives: to present the demographic profile of the students;
assess the factors influencing the retention decision of the students; verify the factors that influence the
retention decision of the students and develop action plan based on the findings of the study.
METHODOLOGY
This research utilized a quantitative approach and descriptive method to determine the outcomes
of the study. The descriptive research design is a scientific method which involves describing the
behavior of a subject matter while not influencing it in any process. The survey questionnaire was used to
gather data to students from LPU-Laguna and LPU-St. Cabrini currently enrolled in flexible learning
scheme. In this research, stratified random sampling was used. The total surveyed was 500 respondents,
63 from College of Arts and Sciences (CAS), 94 from College of Business and Accountancy (CBA), 100
from College of Engineering and Computer Studies (COECS), 100 from College of International Tourism
and Hospitality Management (CITHM), abd 143 from LPU-St. Cabrini’s College of Allied Medicine
(CAM). The total number of respondents is acceptable since the minimum number of respondents for
structural equation modelling is 200 (Kline, 2011).
The survey questionnaire was divided into two parts. The first part encompassed the demographic
profile of the respondents such as age, sex, year level, general weighted average, and monthly income.
While the second part includes the factor variables of Tinto’s Students Integration Theory such as the
faculty concern for student development and teaching, academic and intellectual development, peer group
interaction, interaction with faculty, and institutional and goal commitment. The researchers asked the
approval of the management to conduct this study. The survey questionnaire was distributed to
respondents via Google forms. The results obtained were tabulated, organized, and analyzed using
LPU-Laguna Journal of Multidisciplinary Research
Vol. 4 No. 1 October 2020
35
Center for Research, Publication, and Intellectual Property
Statistical Package for Social Sciences (SPSS) software version 23 and AMOS version 24. The analysis
of the factors influencing the retention decision of the students utilized the structural equation modeling
as statistical treatment of the study. Structural equation modeling refers to a multivariate statistical
analysis technique that is used to analyze structural relationships. This technique is the combination of
factor analysis and multiple regression analysis, and it is used to examine the structural relationship
between measured variables and latent constructs.
RESULTS AND DISCUSSIONS
Demographic Profile of the Respondents
Demographic information provides data regarding the participants of the study. Hammer (2011)
noted that the thorough description of the participants allows the readers and researcherss to determine to
whom the research findings were generalized and the gap of the existing bodies of research can be
identified.
In this context, the researchers determined the profile of the respondents in terms of age, sex, year
level, monthly income, and general weighted average.
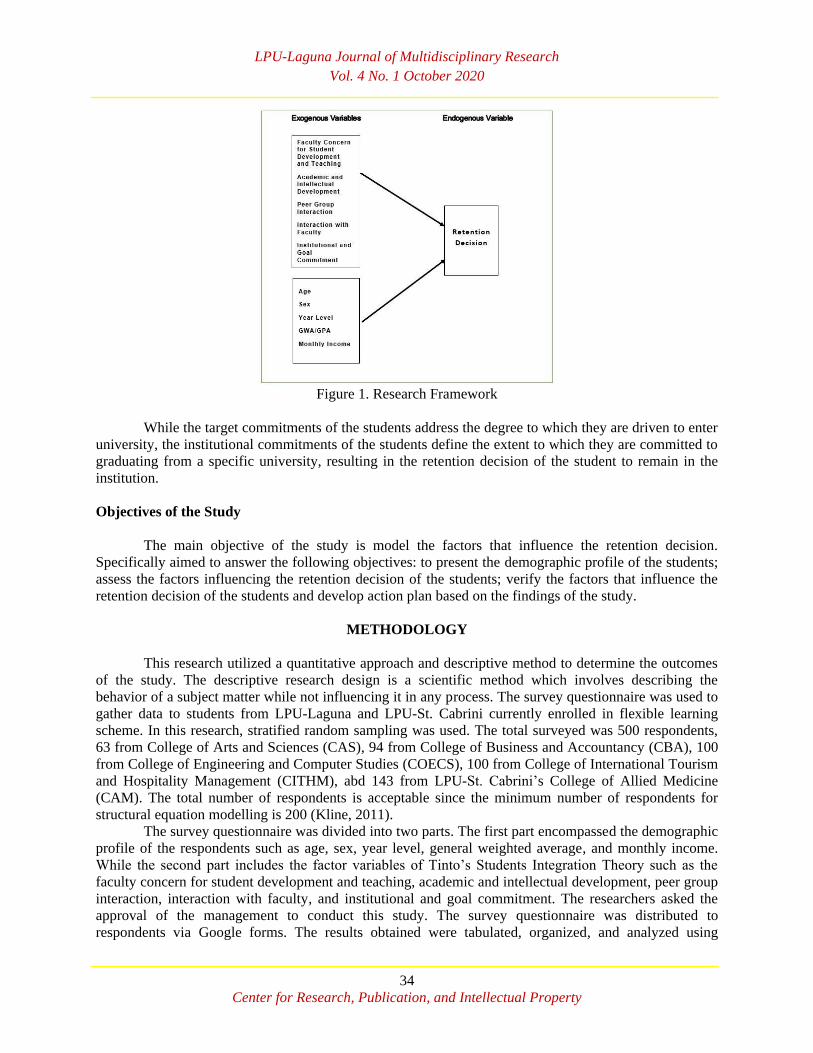
Table 1. Demographic profile of the respondents Frequency Percent
Age
17-19 125 25
20-22 349 70
23 and above 26 5
Total 500 100
Sex
Male 143 29
Female 357 71
Total 500 100
Year Level
2nd year 232 46
3rd year 234 47
5th year 34 7
Total 500 100
Monthly Income
10,000-20,000 98 20
20,001-30,000 87 17
30,001-40,000 95 19
40,001-50,000 80 16
more than 50,000 140 28
Total 500 100
General Weighted Average
1.00-1.50 106 21
1.51-2.00 190 38
2.01-2.50 153 31
2.51-3.00 51 10
Total 500 100
Table 1 shows the demographic profile of respondents. The results showed that in terms of age,
349 out of 500 or 70 percent were 20-22 years old, 125 out of 500 or 25 percent were 17-19 years old, and
LPU-Laguna Journal of Multidisciplinary Research
Vol. 4 No. 1 October 2020
36
Center for Research, Publication, and Intellectual Property
26 out of 500 or 5 percent were 23 years old and above. In terms of sex, 357 out 500 or 71 percent were
female, and 143 out of 500 or 29 percent were male. In terms of year level, 234 out of 500 or 47 percent
were 3rd year level, 232 out of 500 or 46 were 2nd year level and 34 out of 500 or 7 percent were 5th year
level. In terms of monthly income, 140 out of 500 or 28 percent had more than 50,000, 98 out of 500 or
20 percent had 10,000-20,000, 95 out of 500 or 19 percent had 30,001-40,000, 87 out of 500 or 17 percent
had 20,001-30,000, and 80 out of 500 or 16 percent had 40,001-50,000. In terms of general weighted
average, 190 out of 500 or 38 percent had 1.51-2.0, 153 out of 500 or 31 percent had 2.01-2.50, 106 out of
500 or 21 percent had 1.00-1.51 and 51 out of 500 or 10 percent had 2.51-3.00.
The results of individual characteristics interplay between the individual’s commitment to the
goal of college completion, and his commitment to the institution determines whether or not the
individual decides to drop out from college (Tinto, 1993). Stratton et al. (2007) used demographic
variables as potential explanatory variables for the variance in student retention in institutions of higher
education.
Factors Influencing the Retention Decision
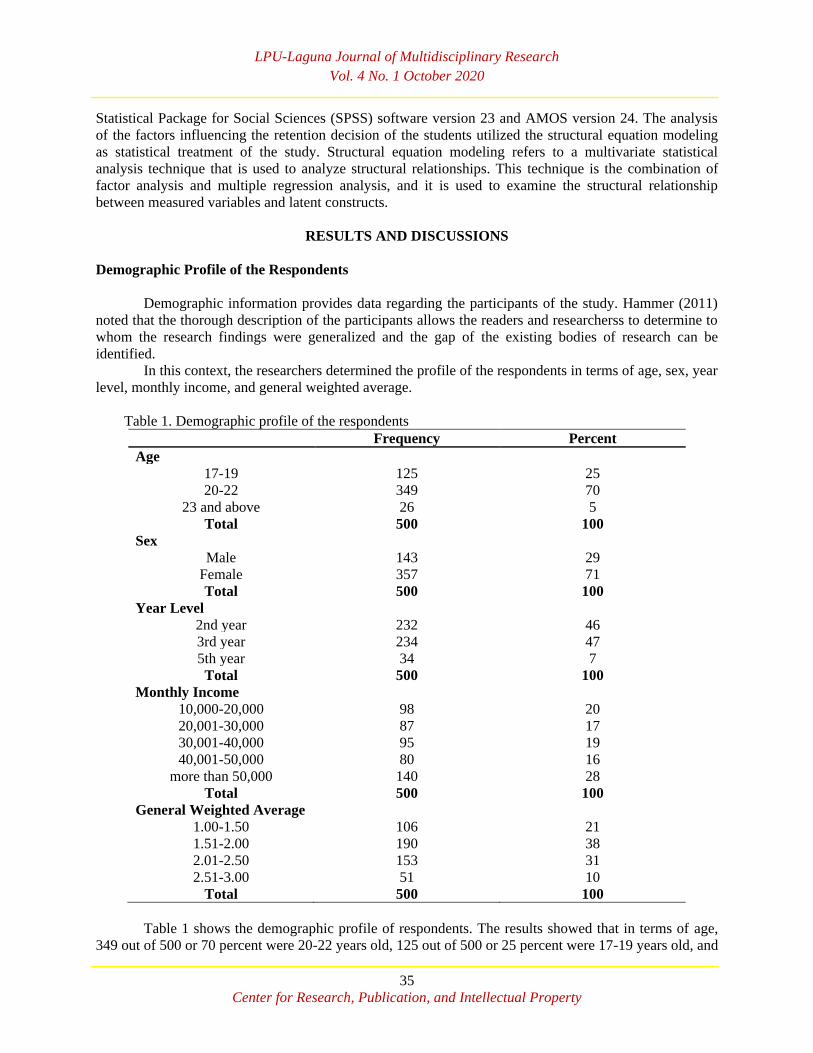
Table 2 shows the factors influencing the retention decision in terms of faculty concern for
student development and teaching. The results showed that the respondents agreed in the overall
assessment having a composite mean of 3.09. The indicator, “The faculty members I had encountered
with are genuinely interested in teaching” had highest mean of 3.15 and standard deviation of 0.64. While
the indicator, “The faculty members I had encountered with are willing to spend time outside of class to
discuss issues of interest and importance to students” had lowest mean of 2.97 and standard deviation of
0.66. The results supported the study of Cass, Cowie, and Campbell (2009), which says that the lecturer
attributes and abilities may influence the enthusiasm of the students to the subject and the decisions they
make for their future careers crucially important for retention. There is abundant evidence that informal
student-faculty contact outside the classroom correlates positively with student retention. Such
interactions can have a normalizing effect on students’ socialization to the attitudes and values of their
institution. Interactions like these can also lead to an increased bond between students and their university
(Cox, McIntosh, Terenzini, Reason, & Lutovsky Quaye 2010).
Table 2. Factors influencing the retention decision in terms of faculty concern for student
development and teaching
Faculty Concern for Student
Development and Teaching Mean SD Interpretation Rank
The faculty members I had encountered
with are…
generally interested in students 3.11 0.52 Agree 2.5
generally outstanding or superior teachers 3.10 0.57 Agree 4
willing to spend time outside of class to
discuss issues of interest and importance
to students
2.97 0.66 Agree 5
interested in helping students grow in
more than just academic areas 3.11 0.69 Agree 2.5
genuinely interested in teaching 3.15 0.64 Agree 1
Composite Mean 3.09 0.62 Agree
Legend: 1.00-1.74- Strongly Disagree; 1.75-2.49- Disagree; 2.50-3.24-Agree; 3.25-4.00 Strongly Agree
LPU-Laguna Journal of Multidisciplinary Research
Vol. 4 No. 1 October 2020
37
Center for Research, Publication, and Intellectual Property
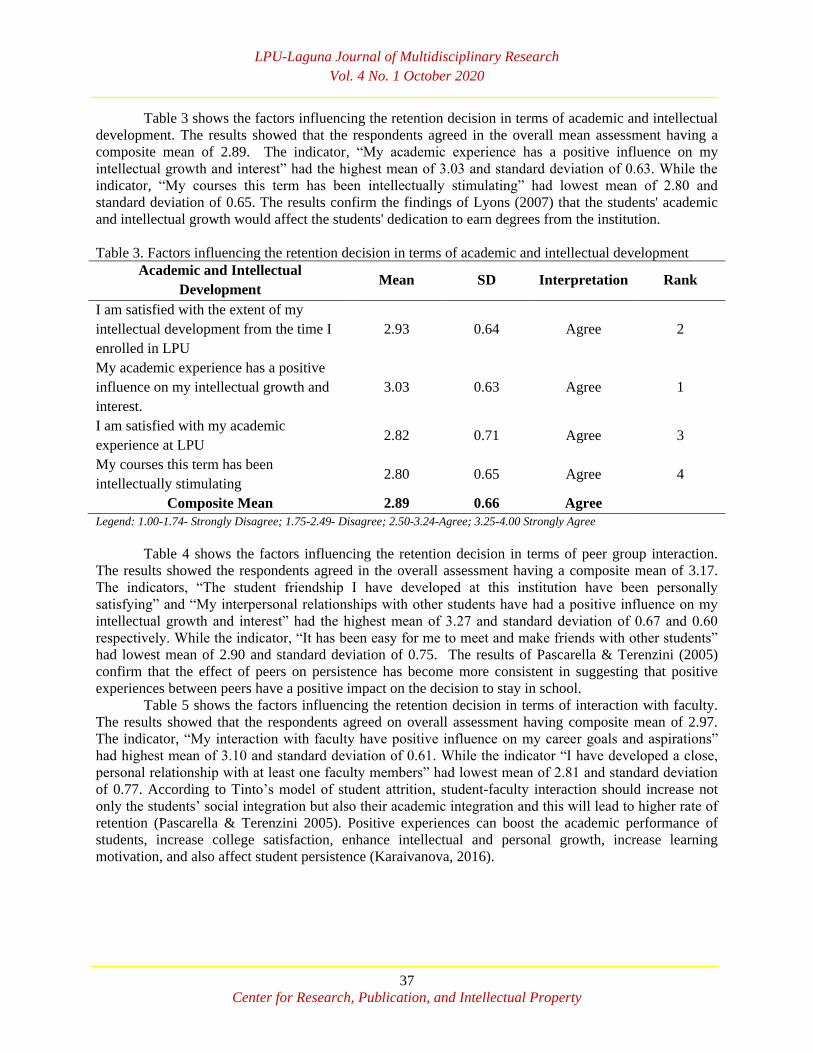
Table 3 shows the factors influencing the retention decision in terms of academic and intellectual
development. The results showed that the respondents agreed in the overall mean assessment having a
composite mean of 2.89. The indicator, “My academic experience has a positive influence on my
intellectual growth and interest” had the highest mean of 3.03 and standard deviation of 0.63. While the
indicator, “My courses this term has been intellectually stimulating” had lowest mean of 2.80 and
standard deviation of 0.65. The results confirm the findings of Lyons (2007) that the students' academic
and intellectual growth would affect the students' dedication to earn degrees from the institution.
Table 3. Factors influencing the retention decision in terms of academic and intellectual development
Academic and Intellectual
Development Mean SD Interpretation Rank
I am satisfied with the extent of my
intellectual development from the time I
enrolled in LPU
2.93 0.64 Agree 2
My academic experience has a positive
influence on my intellectual growth and
interest.
3.03 0.63 Agree 1
I am satisfied with my academic
experience at LPU 2.82 0.71 Agree 3
My courses this term has been
intellectually stimulating 2.80 0.65 Agree 4
Composite Mean 2.89 0.66 Agree
Legend: 1.00-1.74- Strongly Disagree; 1.75-2.49- Disagree; 2.50-3.24-Agree; 3.25-4.00 Strongly Agree
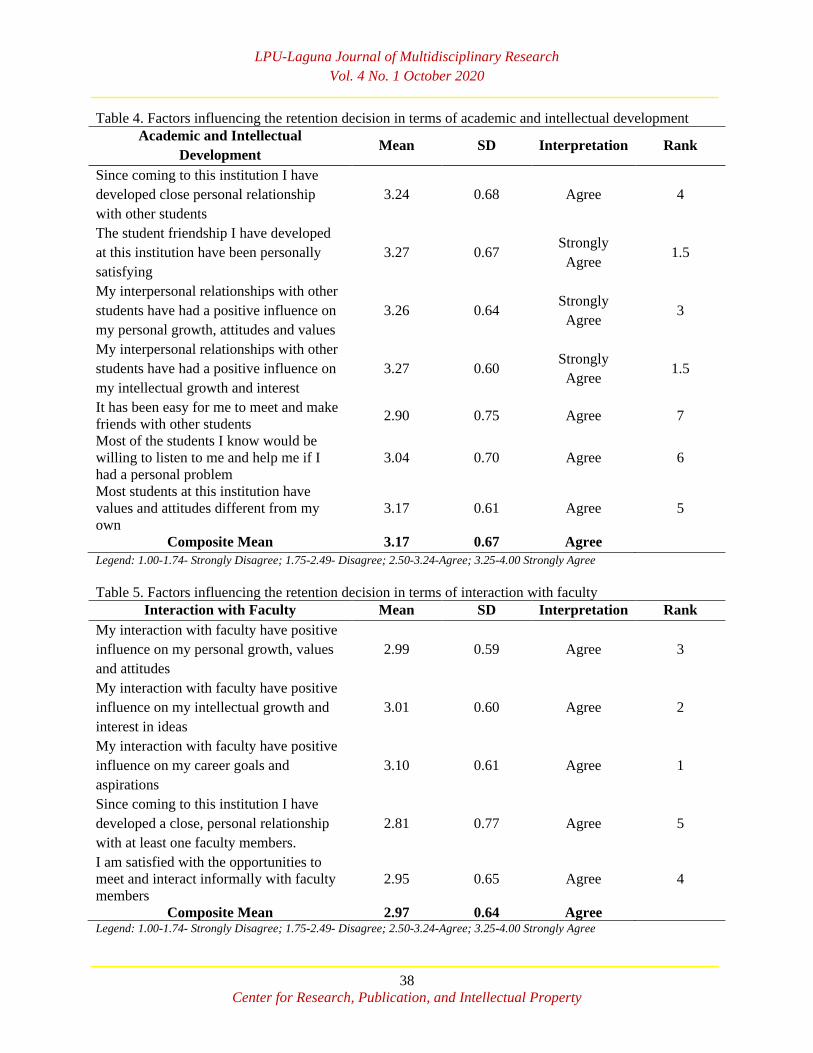
Table 4 shows the factors influencing the retention decision in terms of peer group interaction.
The results showed the respondents agreed in the overall assessment having a composite mean of 3.17.
The indicators, “The student friendship I have developed at this institution have been personally
satisfying” and “My interpersonal relationships with other students have had a positive influence on my
intellectual growth and interest” had the highest mean of 3.27 and standard deviation of 0.67 and 0.60
respectively. While the indicator, “It has been easy for me to meet and make friends with other students”
had lowest mean of 2.90 and standard deviation of 0.75. The results of Pascarella & Terenzini (2005)
confirm that the effect of peers on persistence has become more consistent in suggesting that positive
experiences between peers have a positive impact on the decision to stay in school.
Table 5 shows the factors influencing the retention decision in terms of interaction with faculty.
The results showed that the respondents agreed on overall assessment having composite mean of 2.97.
The indicator, “My interaction with faculty have positive influence on my career goals and aspirations”
had highest mean of 3.10 and standard deviation of 0.61. While the indicator “I have developed a close,
personal relationship with at least one faculty members” had lowest mean of 2.81 and standard deviation
of 0.77. According to Tinto’s model of student attrition, student-faculty interaction should increase not
only the students’ social integration but also their academic integration and this will lead to higher rate of
retention (Pascarella & Terenzini 2005). Positive experiences can boost the academic performance of
students, increase college satisfaction, enhance intellectual and personal growth, increase learning
motivation, and also affect student persistence (Karaivanova, 2016).
LPU-Laguna Journal of Multidisciplinary Research
Vol. 4 No. 1 October 2020
38
Center for Research, Publication, and Intellectual Property
Table 4. Factors influencing the retention decision in terms of academic and intellectual development
Academic and Intellectual
Development Mean SD Interpretation Rank
Since coming to this institution I have
developed close personal relationship
with other students
3.24 0.68 Agree 4
The student friendship I have developed
at this institution have been personally
satisfying
3.27 0.67 Strongly
Agree 1.5
My interpersonal relationships with other
students have had a positive influence on
my personal growth, attitudes and values
3.26 0.64 Strongly
Agree 3
My interpersonal relationships with other
students have had a positive influence on
my intellectual growth and interest
3.27 0.60 Strongly
Agree 1.5
It has been easy for me to meet and make
friends with other students 2.90 0.75 Agree 7
Most of the students I know would be
willing to listen to me and help me if I
had a personal problem
3.04 0.70 Agree 6
Most students at this institution have
values and attitudes different from my
own
3.17 0.61 Agree 5
Composite Mean 3.17 0.67 Agree
Legend: 1.00-1.74- Strongly Disagree; 1.75-2.49- Disagree; 2.50-3.24-Agree; 3.25-4.00 Strongly Agree
Table 5. Factors influencing the retention decision in terms of interaction with faculty
Interaction with Faculty Mean SD Interpretation Rank
My interaction with faculty have positive
influence on my personal growth, values
and attitudes
2.99 0.59 Agree 3
My interaction with faculty have positive
influence on my intellectual growth and
interest in ideas
3.01 0.60 Agree 2
My interaction with faculty have positive
influence on my career goals and
aspirations
3.10 0.61 Agree 1
Since coming to this institution I have
developed a close, personal relationship
with at least one faculty members.
2.81 0.77 Agree 5
I am satisfied with the opportunities to
meet and interact informally with faculty
members
2.95 0.65 Agree 4
Composite Mean 2.97 0.64 Agree Legend: 1.00-1.74- Strongly Disagree; 1.75-2.49- Disagree; 2.50-3.24-Agree; 3.25-4.00 Strongly Agree
LPU-Laguna Journal of Multidisciplinary Research
Vol. 4 No. 1 October 2020
39
Center for Research, Publication, and Intellectual Property
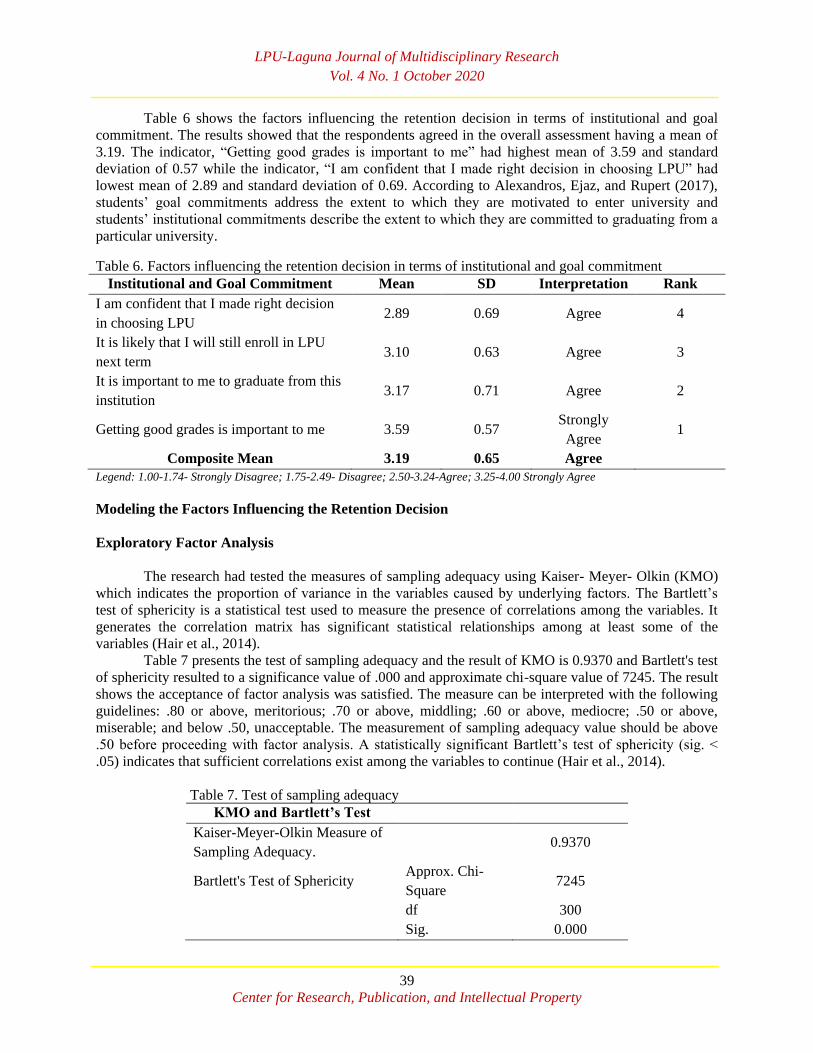
Table 6 shows the factors influencing the retention decision in terms of institutional and goal
commitment. The results showed that the respondents agreed in the overall assessment having a mean of
3.19. The indicator, “Getting good grades is important to me” had highest mean of 3.59 and standard
deviation of 0.57 while the indicator, “I am confident that I made right decision in choosing LPU” had
lowest mean of 2.89 and standard deviation of 0.69. According to Alexandros, Ejaz, and Rupert (2017),
students’ goal commitments address the extent to which they are motivated to enter university and
students’ institutional commitments describe the extent to which they are committed to graduating from a
particular university.
Table 6. Factors influencing the retention decision in terms of institutional and goal commitment
Institutional and Goal Commitment Mean SD Interpretation Rank
I am confident that I made right decision
in choosing LPU 2.89 0.69 Agree 4
It is likely that I will still enroll in LPU
next term 3.10 0.63 Agree 3
It is important to me to graduate from this
institution 3.17 0.71 Agree 2
Getting good grades is important to me 3.59 0.57 Strongly
Agree 1
Composite Mean 3.19 0.65 Agree
Legend: 1.00-1.74- Strongly Disagree; 1.75-2.49- Disagree; 2.50-3.24-Agree; 3.25-4.00 Strongly Agree
Modeling the Factors Influencing the Retention Decision
Exploratory Factor Analysis
The research had tested the measures of sampling adequacy using Kaiser- Meyer- Olkin (KMO)
which indicates the proportion of variance in the variables caused by underlying factors. The Bartlett’s
test of sphericity is a statistical test used to measure the presence of correlations among the variables. It
generates the correlation matrix has significant statistical relationships among at least some of the
variables (Hair et al., 2014).
Table 7 presents the test of sampling adequacy and the result of KMO is 0.9370 and Bartlett's test
of sphericity resulted to a significance value of .000 and approximate chi-square value of 7245. The result
shows the acceptance of factor analysis was satisfied. The measure can be interpreted with the following
guidelines: .80 or above, meritorious; .70 or above, middling; .60 or above, mediocre; .50 or above,
miserable; and below .50, unacceptable. The measurement of sampling adequacy value should be above
.50 before proceeding with factor analysis. A statistically significant Bartlett’s test of sphericity (sig. <
.05) indicates that sufficient correlations exist among the variables to continue (Hair et al., 2014).
Table 7. Test of sampling adequacy
KMO and Bartlett’s Test
Kaiser-Meyer-Olkin Measure of
Sampling Adequacy. 0.9370
Bartlett's Test of Sphericity Approx. Chi-
Square 7245
df 300
Sig. 0.000
LPU-Laguna Journal of Multidisciplinary Research
Vol. 4 No. 1 October 2020
40
Center for Research, Publication, and Intellectual Property
Construct Validity and Confirmatory Factor Analysis
Construct validity was used to determine the extent to which a set of measured items reflected the
latent theoretical, and it deal with the accuracy of measurement (Hair et al., 2014).
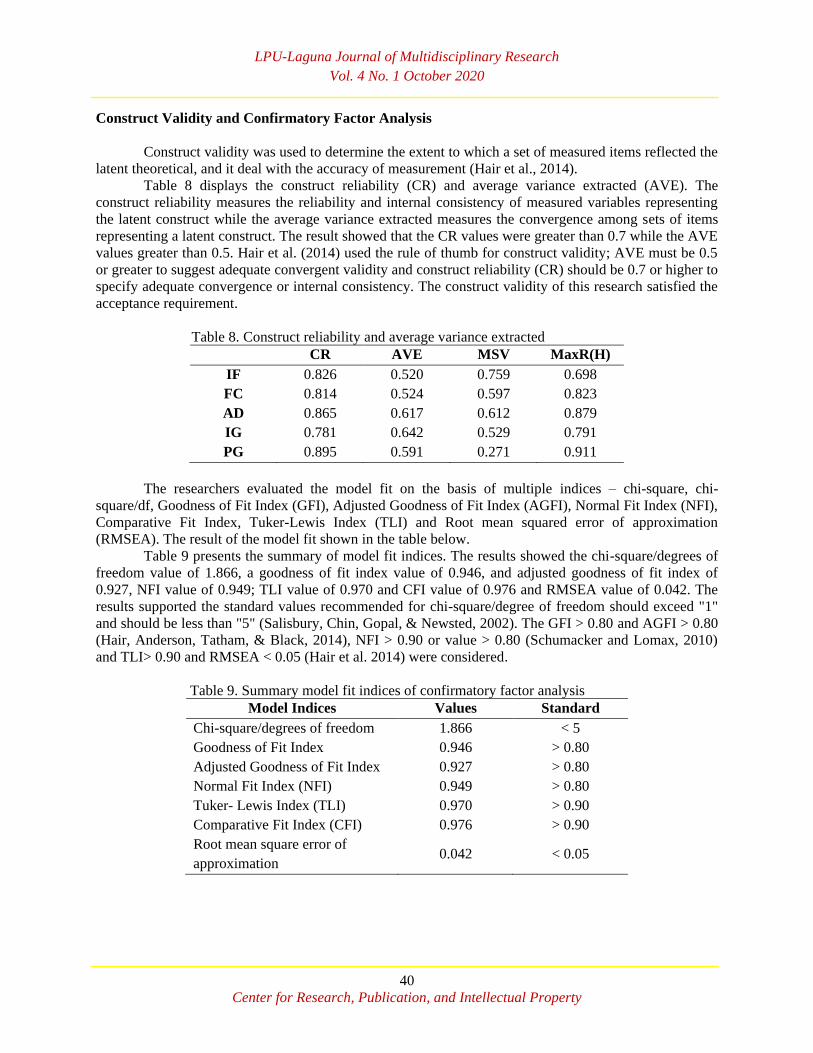
Table 8 displays the construct reliability (CR) and average variance extracted (AVE). The
construct reliability measures the reliability and internal consistency of measured variables representing
the latent construct while the average variance extracted measures the convergence among sets of items
representing a latent construct. The result showed that the CR values were greater than 0.7 while the AVE
values greater than 0.5. Hair et al. (2014) used the rule of thumb for construct validity; AVE must be 0.5
or greater to suggest adequate convergent validity and construct reliability (CR) should be 0.7 or higher to
specify adequate convergence or internal consistency. The construct validity of this research satisfied the
acceptance requirement.
Table 8. Construct reliability and average variance extracted
CR AVE MSV MaxR(H)
IF 0.826 0.520 0.759 0.698
FC 0.814 0.524 0.597 0.823
AD 0.865 0.617 0.612 0.879
IG 0.781 0.642 0.529 0.791
PG 0.895 0.591 0.271 0.911
The researchers evaluated the model fit on the basis of multiple indices – chi-square, chi-
square/df, Goodness of Fit Index (GFI), Adjusted Goodness of Fit Index (AGFI), Normal Fit Index (NFI),
Comparative Fit Index, Tuker-Lewis Index (TLI) and Root mean squared error of approximation
(RMSEA). The result of the model fit shown in the table below.
Table 9 presents the summary of model fit indices. The results showed the chi-square/degrees of
freedom value of 1.866, a goodness of fit index value of 0.946, and adjusted goodness of fit index of
0.927, NFI value of 0.949; TLI value of 0.970 and CFI value of 0.976 and RMSEA value of 0.042. The
results supported the standard values recommended for chi-square/degree of freedom should exceed "1"
and should be less than "5" (Salisbury, Chin, Gopal, & Newsted, 2002). The GFI > 0.80 and AGFI > 0.80
(Hair, Anderson, Tatham, & Black, 2014), NFI > 0.90 or value > 0.80 (Schumacker and Lomax, 2010)
and TLI> 0.90 and RMSEA < 0.05 (Hair et al. 2014) were considered.
Table 9. Summary model fit indices of confirmatory factor analysis
Model Indices Values Standard
Chi-square/degrees of freedom 1.866 < 5
Goodness of Fit Index 0.946 > 0.80
Adjusted Goodness of Fit Index 0.927 > 0.80
Normal Fit Index (NFI) 0.949 > 0.80
Tuker- Lewis Index (TLI) 0.970 > 0.90
Comparative Fit Index (CFI) 0.976 > 0.90
Root mean square error of
approximation 0.042 < 0.05
LPU-Laguna Journal of Multidisciplinary Research
Vol. 4 No. 1 October 2020
41
Center for Research, Publication, and Intellectual Property
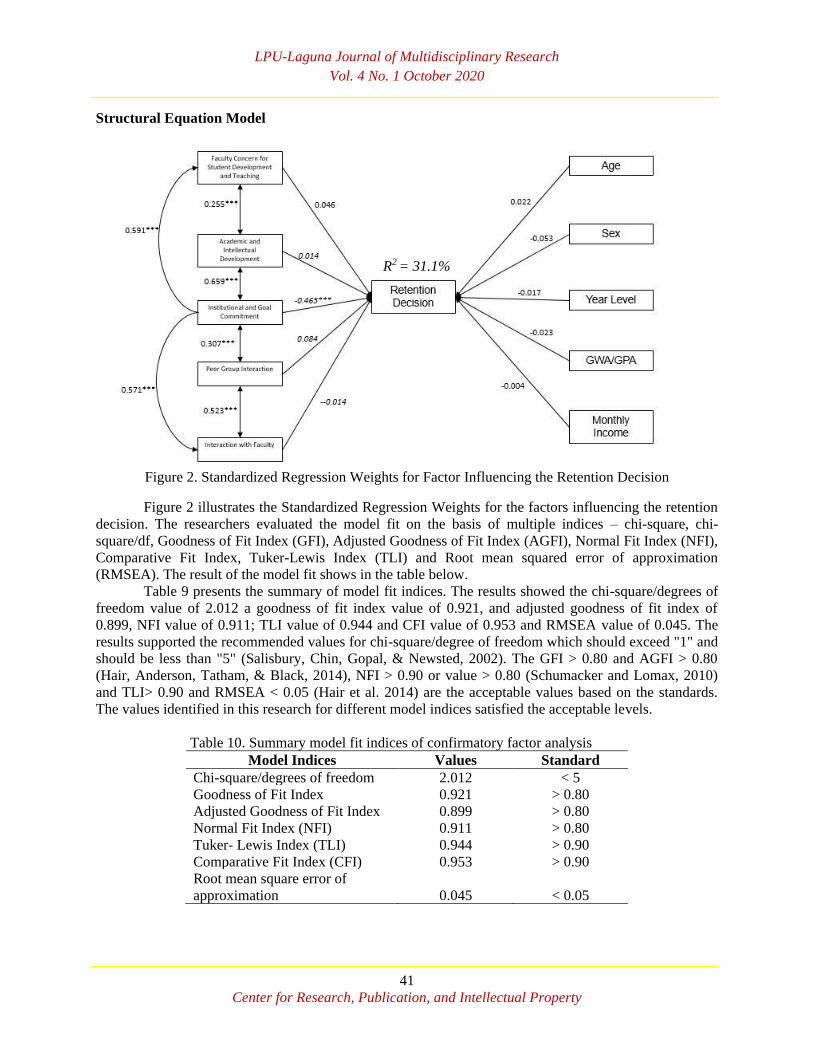
Structural Equation Model
R2 = 31.1%
Figure 2. Standardized Regression Weights for Factor Influencing the Retention Decision
Figure 2 illustrates the Standardized Regression Weights for the factors influencing the retention
decision. The researchers evaluated the model fit on the basis of multiple indices – chi-square, chi-
square/df, Goodness of Fit Index (GFI), Adjusted Goodness of Fit Index (AGFI), Normal Fit Index (NFI),
Comparative Fit Index, Tuker-Lewis Index (TLI) and Root mean squared error of approximation
(RMSEA). The result of the model fit shows in the table below.
Table 9 presents the summary of model fit indices. The results showed the chi-square/degrees of
freedom value of 2.012 a goodness of fit index value of 0.921, and adjusted goodness of fit index of
0.899, NFI value of 0.911; TLI value of 0.944 and CFI value of 0.953 and RMSEA value of 0.045. The
results supported the recommended values for chi-square/degree of freedom which should exceed "1" and
should be less than "5" (Salisbury, Chin, Gopal, & Newsted, 2002). The GFI > 0.80 and AGFI > 0.80
(Hair, Anderson, Tatham, & Black, 2014), NFI > 0.90 or value > 0.80 (Schumacker and Lomax, 2010)
and TLI> 0.90 and RMSEA < 0.05 (Hair et al. 2014) are the acceptable values based on the standards.
The values identified in this research for different model indices satisfied the acceptable levels.
Table 10. Summary model fit indices of confirmatory factor analysis
Model Indices Values Standard
Chi-square/degrees of freedom 2.012 < 5
Goodness of Fit Index 0.921 > 0.80
Adjusted Goodness of Fit Index 0.899 > 0.80
Normal Fit Index (NFI) 0.911 > 0.80
Tuker- Lewis Index (TLI) 0.944 > 0.90
Comparative Fit Index (CFI) 0.953 > 0.90
Root mean square error of
approximation 0.045 < 0.05
LPU-Laguna Journal of Multidisciplinary Research
Vol. 4 No. 1 October 2020
42
Center for Research, Publication, and Intellectual Property
Hypothesis 1: Factors of Student’s Integration Theory affects the Retention Decision
This hypothesis was aimed to test the influenced of student’s integration theory in the retention
decision.
Table 11 presents the relationship between the student’s integration theory and retention decision.
Results showed that the faculty concern for student development and teaching positively influenced the
retention decision and statistically significant (b = 0.078, p < 0.05). The sets of interactions among
students, faculty, and staff that take place largely outside of the formal academic setting (Tinto, 1993).
Academic and intellectual development positively influence the retention decision and not statistically
significant (b=0.025, p > 0.05). Peer group interaction positively influence the retention decision and
statistically significant (b= 0.152, p value < 0.05). The results of Pascarella & Terenzini (2005) confirm
that the effect of peers on persistence has become more consistent in suggesting that positive experiences
between peers have a positive impact on the decision to stay in school. Interaction with faculty negatively
influence retention decision and statistically significant (b= -0.019, p value < 0.05). According to Tinto’s
model of student attrition, student-faculty interaction should increase not only the students’ social
integration but also their academic integration and this will lead to higher rate of retention (Pascarella &
Terenzini 2005). Institutional and goal commitment negatively influence the retention decision and
statistically significant (b = -0.853, p value < 0.001). The stronger the goal and institutional commitment
the more likely the student will graduate. Research shows that congruence between student goals and
institutional mission is mediated by academic and social components, and that increased integration into
academic and social campus communities causes greater institutional commitment and student persistence
(Tintos, 1993).
Table 11. Relationship of students integration theory in the retention decision
Variables Unstandardized Standardized
Exogenous Endogenous Estimate S.E C.R P Estimate
H1a. Faculty Concern for
Student Development
and Teaching
Retention
Decision
-0.174 0.087 -1.989 0.047 0.078
H1b. Academic and
Intellectual Development -0.037 0.051 -0.728 0.467 0.025
H1c. Peer Group
Interaction 0.084 0.026 3.221 0.001 0.152
H1d. Interaction with
Faculty 0.395 0.128 3.076 0.002 -0.019
H1e. Institutional and
Goal Commitment -0.462 0.040 -11.615 *** -0.853
***p value < 0.001; p-value <0.05 - Significant
Hypothesis 2: Demographic Profile affects the Retention Decision
Table 12 presents the relationship between the demographic profile and retention decision.
Results showed that the Age positively influenced the retention decision and statistically significant (b =
0.034, p > 0.05).The findings supported by Purdie (2007) that age could be used as predictor of student
retention. The age of college students may impact retention in a variety of ways including maturity of
student, work and life requirements, teaching methods, and whether or not the student has time to be
engaged in the campus Sex negatively influence the retention decision and statistically significant (b= -
0.074, p < 0.05). Grebennikov and Skaines (2009) found that women find academic goals more important
than men and they place a greater value on higher education, mainly because women need to better
prepare themselves in order to have the same chances on the job market. Year Level negatively influence
LPU-Laguna Journal of Multidisciplinary Research
Vol. 4 No. 1 October 2020
43
Center for Research, Publication, and Intellectual Property
the retention decision and not statistically significant (b= -0.041 p value > 0.05). GWA/GPA negatively
influence retention decision and statistically significant (b= -0.065, p value < 0.05). This results
confirmed that grades is important predictor of student retention especially from first to second year
(Monday, 2015). Monthly income negatively influence the retention decision and not statistically
significant (b = -0.017, p value > 0.05). Higher annual and lifetime earnings are most frequently
compensated for attending college and continuing to complete a degree. But admission and persistence
decisions are guided by the availability of financial assistance for many low-income and minority students
(Educationalpolicy.org, 2004).
Table 12. Relationship of demographic profile and retention decision
Variables Unstandardized Standardized
Exogenous Endogenous Estimate S.E C.R P Estimate
H2a Age
Retention
Decision
0.022 0.023 0.947 0.343 0.034
H2b. Sex -0.054 0.023 -2.417 0.018 -0.074
H2c. Year Level -0.019 0.015 -1.248 0.261 -0.041
H2d. GWA/GPA -0.022 0.011 -1.917 0.041 -0.065
H2e. Monthly Income -0.003 0.007 -0.423 0.566 -0.017
***p value < 0.001; p-value <0.05 - Significant
CONCLUSIONS
Based on the findings of the study, the following conclusion were drawn: Majority of the
respondents were aged 20-22, female, 3rd year level, more than 50,000 monthly income and 2.01-2.50
general weighted average.
In the assessment of the factors influencing the retention decision of the respondents, institutional
and goal commitment had highest assessment while academic and intellectual development had the
lowest assessment. This means that means that students with high level of commitments were more likely
to stay. Using the exploratory and confirmatory factor analysis, the results were found to be acceptable
based on the standard requirements of the model indices. In terms of construct validity, all latent variables
satisfy the acceptance requirement of the model.
Faculty concern for student development and teaching, peer group interaction, interaction with
faculty and institutional and goal commitment were found to be the significant factors affecting the
retention decision of the students. The results supported by (Tinto’s, 1993) using student integration
theory suggest that academic integration, social integration, institutional commitment and goal
commitment have the strongest impact on student retention. While, sex and GWA/GPA in the
demographic profile of respondents were found to be significant factors that influence the retention
decision of the students.
Recommendations
Based on the conclusion of the study, the researchers suggested to strengthen the faculty and
student academic consultation and student tutorial services. The consultation will serve as venue between
the students and faculty to discuss matters related to academic difficulties of the students and also to
motivate the students to finish their degree on time while the student tutorial will help in motivating
students to complete their schooling and stay until they graduate. The researchers also suggested to the
Guidance Office in coordination with the faculty members to conduct regularly counseling to the students
especially in this time of pandemic. Regular checking of student feedback is also suggested to further
enhance the services offered by institution and to make the students fully satisfied during their entire stay
in the institution
LPU-Laguna Journal of Multidisciplinary Research
Vol. 4 No. 1 October 2020
44
Center for Research, Publication, and Intellectual Property
REFERENCES
Alexandros Chrysikos, Ejaz Ahmed, Rupert Ward, (2017) Analysis of Tinto’s student integration theory
in first-year undergraduate computing students of a UK higher education institution,
International Journal of Comparative Education and Development, Vol. 19 Issue: 2/3, pp.97-121,
https://doi.org/10.1108/IJCED-10-2016-0019
Aljohani, O. (2016). A Comprehensive Review of the Major Studies and Theoretical Models of Student
Retention in Higher Education. Higher Education Studies, 6(2), 1. doi:10.5539/hes.v6n2p1
Cox, B. E., McIntosh, K. L., Terenzini, P. T., Reason, R. D., & Lutovsky Quaye, B. R. (2010).
Pedagogical Signals of Faculty Approachability: Factors Shaping Faculty–Student Interaction
Outside the Classroom. Research in Higher Education, 51(8), 767–788. doi:10.1007/s11162-010-
9178-z
Fowler, M., & Luna, G. (2009). High school and college partnerships: Credit-based transition programs.
American Secondary Education, 38(1), 62-76. doi: 1898877321
Fumei Weng, France Cheong & Christopher Cheong (2010) Modelling IS Student Retention in Taiwan:
Extending Tinto and Bean’s Model with Self-Efficacy, Innovation in Teaching and Learning in
Information and Computer Sciences, 9:2, 1-12
Grebennikov, L., & Skaines, I. (2009). Gender and higher education experience: A case study. Higher
Education Research & Development, 28(1), 71–84.
Hair, J. F., Anderson R.E, Tatham R. L., Black W.(2014) Multivariate Data Analysis with Readings, 7th
ed. Prentice-Hall, Upper Saddle River, NJ.
Karaivanova, Katerina, (2016), The Effects of Encouraging Student-Faculty Interaction on Academic
Success, Identity Development, and Student Retention in the First Year of College. Doctoral
Dissertations. 1355.
Kline, R. B.(2011) Principles and Practice of Structural Equation Modelling, 3rd edition, The Guilford
Press, New York NY 10012
Lyons, Aundrea L (2007), An Assessment Of Social And Academic Integration Among Track And Field
Student-Athletes Of The Atlantic Coast Conference, Dissertation, The Florida State University
Monday, Eric N. (2015) The Impact of Financial Knowledge on Student Retention from the Second to the
Third Year at a Public Research University LSU Doctoral Dissertations. 2263
Otrel-Cass, K., Cowie, B., & Campbell, A. (2009). What determines perseverance in studying science?.
Pascarella, E. T., & Terenzini, P. T. (2005). How College Affects Students: A Third Decade of Research.
Volume 2. Indianapolis, IN: Jossey-Bass Publishing
Powell, P. (2009). Retention and writing Instruction: Implications for access and pedagogy. College
Composition and Communication, 60(4), 664-682. doi: 1775753881
Schumacker, R. E.(2010), & Lomax, R. G., A beginner's guide to structural equation modeling (3rd ed.).
New York, NY, US: Routledge/Taylor & Francis
Seidman, A, (2005). College Student Retention, Westport, CT: American Council on Education and
Praeger Publishers.
Severiens, S., & ten Dam, G. (2011). Leaving College: A Gender Comparison in Male and Female-
Dominated Programs.
Tight, M. (2019). Student retention and engagement in higher education. Journal of Further and Higher
Education, 1–16. doi:10.1080/0309877x.2019.1576860
Tinto, V. (1975). Dropout from higher education: A theoretical synthesis of recent research. Review of
Educational Research, 45, 89-125.