MODELING THE DETERMINANTS OF JOB …...Nguyen Thi Ha Trang Nguyen Ngoc Minh Doan Quang Hung Dao Ngoc...
31
1 MODELING THE DETERMINANTS OF JOB SATISFACTION IN VIETNAM Nguyen Thi Phuong Mai Nguyen Tuong Anh Nguyen Thi Ha Trang Nguyen Ngoc Minh Doan Quang Hung Dao Ngoc Tien Abstract: Job satisfaction is taken into consider in developing countries since people’s living standards have improved in recent years. The aim of our paper is to identify the determinants of job satisfaction in Vietnamese context using both ordered logit and generalized ordered logit models to deal with the invalidity of the parallel-lines assumption. In general, crucial predictors of job satisfaction include education, job status, job tenure, wage, relative income compared to others in the same sector, and wage policy. Meanwhile, we also clarify the different determinants that affect workers’ job satisfaction in local versus FDI sectors thanks to the unique employer-employee matched survey provided by Center of Analysis and Forecasting, the Vietnam Academy of Social Sciences.
Transcript of MODELING THE DETERMINANTS OF JOB …...Nguyen Thi Ha Trang Nguyen Ngoc Minh Doan Quang Hung Dao Ngoc...
1
MODELING THE DETERMINANTS OF JOB
SATISFACTION IN VIETNAM
Nguyen Thi Phuong Mai
Nguyen Tuong Anh
Nguyen Thi Ha Trang
Nguyen Ngoc Minh
Doan Quang Hung
Dao Ngoc Tien
Abstract: Job satisfaction is taken into consider in developing countries since
people’s living standards have improved in recent years. The aim of our paper is to
identify the determinants of job satisfaction in Vietnamese context using both
ordered logit and generalized ordered logit models to deal with the invalidity of the
parallel-lines assumption. In general, crucial predictors of job satisfaction include
education, job status, job tenure, wage, relative income compared to others in the
same sector, and wage policy. Meanwhile, we also clarify the different determinants
that affect workers’ job satisfaction in local versus FDI sectors thanks to the unique
employer-employee matched survey provided by Center of Analysis and Forecasting,
the Vietnam Academy of Social Sciences.
2
TABLE OF CONTENT
I. INTRODUCTION ....................................................................................................... 3
II. LITERATURE REVIEW ............................................................................................... 5
III. DATA AND METHODOLOGY ................................................................................. 9
IV. ESTIMATION RESULT AND DISCUSSION ............................................................. 14
V. CONCLUSION ......................................................................................................... 20
VI. REFERENCES ....................................................................................................... 21
________________
Acknowledgements: Nguyen Phuong Mai is a senior researcher at NISTPASS and
ANCE ([email protected]). Nguyen Tuong Anh, Doan Quang Hung and Dao Ngoc
Tien are lecturers at Hanoi Foreign Trade University. Nguyen Ngoc Minh and Nguyen
Thi Ha Trang are researchers at DEPOCEN. We would like to thank supervisors to
helpful comments. Financial support from Mekong Economic Research Network is
gratefully acknowledged. Several previous versions of the paper were presented at
Mekong Economic Research Network in Hanoi (2013), Vientiane (2013), and Phnom
Penh (2014); we would like to thank participants of this network meeting for helpful
comments.
3
I. INTRODUCTION
There has been a growing concern about job satisfaction, especially in developing
countries such as Vietnam, since people’s living standards have improved a lot over
time; in other words, their basic needs have been met to some extent. According to
Maslow hierarchy of needs (1943), people would like to fulfill higher needs when
they have their basic needs satisfied, including physiological, safety, and belonging
needs. Baghaei (2011) assumed the condition to satisfy these higher needs, which
are esteem and self-actualization, should be present at work; meaning that, the job
itself should be meaningful and motivating. Therefore, while there are confusions
and debates about whether satisfied employees are productive employees (Saari &
Judge, 2004), quality of jobs should be taken into considerations to not only meet the
employees’ needs but also to create motivation that may encourage them to
perform better at work.
There are compelling reasons why economists should draw their attention to job
satisfaction. Firstly, job satisfaction has been found to be a strong predictor of a
worker's behavior and performance; for example, reported job satisfaction has been
used to predict separations, resignations, and productivity of workers (Clark, Osward,
& Warr, 1996; Freeman, 1978; Hamermesh, 1977; and Shields & Price, 2002).
Secondly, job satisfaction is one of the three most crucial predictors of overall well-
being (Argyle & Martin, 1989; Clark, 1997; and A Sousa-Poza & AA Sousa-Poza, 2001).
Freeman (1978) says that job satisfaction is a major determinant of labor market
mobility because it reflects aspects of the work place that are not captured by
standard objective variables. He points out that the subjective level of job
satisfaction is a significant determinant of the probability of resignation. However,
when he includes the intention of resigning in the model, the results show that
depending on different samples, the impact of job satisfaction is either clearer or
more blurred than the impact of the intention to resign. In a larger space when
4
socially identifiable exogenous variation is assumed not to affect job satisfaction, the
impact of observed variables on mobility may make job satisfaction less significant
because of the multicollinearity problem. In general, job satisfaction still contains
much information about mobility in labor market.
Thirdly, considering the consequences of job dissatisfaction, Aziri (2011) postulates
that it could lead to a wide range of negative impacts such as lack of loyalty,
increased absenteeism, increasing number of accidents, and so on; as a result, the
importance of job satisfaction is specially acknowledged.
It could be said that job satisfaction is one of the main positive emotional conditions
stemming from pleasure (Crossman and Abou-Zaki, 2003). In developing country
context, job satisfaction could affect the growth potential of organizations as well as
of these countries; in other words, job satisfaction is considered as crucial feature of
workers that has both direct and indirect impacts on the productivity,
competitiveness, technology upgrading capacity of firms, and the integration
capacity of countries.
Recently, the report on the labor market, “Vietnam Employment Trends Report
2010,” also suggests that a greater focus on quality jobs is needed to broaden
economic development, as well as to reduce vulnerability and poverty.1 However,
there has been still a paucity of research in this topic that could be efficient input and
convincing evident for labor-relevant policies of Vietnamese government. The
primary purpose of this study is to fill the gap in the literature for Vietnam by
investigating the determinants of job satisfaction.
In our research paper we set out to study the key determinants of job satisfaction for
Vietnamese workers. We not only focus on a number of important policy-relevant
variables such as wage policy and training plan for workers, but also attempt to
investigate other important potential variables which may affect job satisfaction in
1http://vietnamnews.vnagency.com.vn/Economy/172057/decent-work-key-for-development.html and http://www.un.org.vn/en/ilo-
agencypresscenter1-97/1689-ilo-and-molisa-release-the-vietnam-employment-trends-report-2010.html
5
Vietnam, such as absolute and relative wage (as commonly asked in the literature),
union membership, and job position. Meanwhile, we attempt to disentangle the
possible differences in job satisfaction of workers in domestic versus FDI firms.
The previous studies relied on labor force surveys, however, a number of important
job-characteristics are missing, i.e. job-environment, peer workers, and human
resource practices. Our research will utilize a unique employer-employee matched
survey conducted by the North-South Institute (Canada) to investigate the
determinants of job satisfaction.
By using this employer-employee matched survey, we expect to shed light on many
work-related characteristics that influence the job satisfaction of workers in Vietnam.
The rest of this paper is organized as follows. Section 2 discusses the effect of several
crucial and interesting elements that may affect job satisfaction of workers, as
presented in previous studies. Section 3 presents our data as well as the
methodology we use in our paper. The results and some discussions are in Section 4.
Section 5 summarizes and concludes.
II. LITERATURE REVIEW
As shown by previous researches, job satisfaction is often considered as a function of
(i) the individual's personal characteristics, and (ii) the characteristics of the job itself
(Khalid, Salim, & Loke, 2011). Job/employment characteristics may include hours of
work, union membership, size of establishment, self-employment status, earnings,
and job tenure. Meanwhile, individual characteristics such as age, gender, education,
and marital status are also examined in previous studies (Belfield & Harris, 2002;
Borjas, 1979; Clark & Oswald, 1996; Clark, 1997; Dipboye, Smith, & Howell, 1994;
Freeman, 1978; Shields & Price, 2002; Witt & Nye, 1992). This subsection is an initial
attempt to discuss the impact of several crucial and interesting elements that may
affect job satisfaction of workers, as presented in previous studies.
6
Regarding job characteristics, from the literature review, women are found to be
more satisfied with their jobs than men (Blanchflower & Oswald, 2001; and Clark,
1996). Literature indicates that there is a difference between males and females in
terms of job satisfaction due to several assumptions. While normally we expect that
female workers face more disadvantages than their male colleagues in the labor
market, for instance, lower wage rate, worse promotion possibilities, which causes
lower levels of job satisfaction, the "differential job inputs" hypothesis suggests that
job-satisfaction levels between genders are equal, as the lower rewards for women
are matched with lower inputs, such as education, or working time (A Sousa-Poza &
AA Sousa-Poza, 2007). The "differential entitlement" hypothesis predicts that women
have higher levels of job satisfaction due to different expectations, i.e., women may
have learned to expect less than men for their inputs. In addition, the "own-gender
referents" hypothesis suggests further that women use other women as their
comparison group, therefore, female's job satisfaction levels do not need to relate to
those of men. Finally, the "subjective rewards" hypothesis assumes that job
satisfaction is determined by intrinsic aspects of a job such as perceived autonomy
and variety, and since these features do not vary much between genders, job-
satisfaction levels will be similar in spite of different objective rewards (A Sousa-Poza
& AA Sousa-Poza, 2007). However, Phelan (1994) only found partial support for the
"subjective rewards" hypothesis.
A U-shaped relationship between job satisfaction and age are reported (Clark,
Osward, & Warr, 1996; Sloane & Ward, 2001; Blanchflower & Oswald, 2001). In more
detail, U-shape linkage between job satisfaction and age means that in the very first
years of employments, workers’ job satisfaction generally decrease, and after
reaching a minimum point, it steadily increase up to retirement (Clark, Osward, &
Warr, 1996). To emphasize, older workers move to a job with more desirable
characteristics and specific work values that are less desirable to younger workers.
Additionally, older workers may hold lower expectations of their job than their
younger colleagues do. Based on theoretical model of the job-matching mechanism
7
of Jovanovic, Borjas (1979) suggests that the older people seem to have higher job
satisfaction due to having more experience in job sampling and likely to have a
successful match more easily.
Empirical evidence about the link between education and satisfaction is not
conclusive. “A higher educational level is expected to lead to high wages and good
quality jobs, which are positively related to job satisfaction” (Albert & Davia, 2005).
But education might also increase expectations about both wages and job features,
and consequently reduce the level of job satisfaction. Meanwhile, higher job
satisfaction is also found to be associated with marital status (Blanchflower &
Oswald, 2001; and Clark, 1997).
Job characteristics are taken into account in previous research as important
determinants of job satisfaction. To clarify, the impact of unions on job satisfaction
may be a matter of empirical validation. Unions has been found to be associated with
a lower level of job satisfaction since unions are often considered to be a “voice”
institution, which encourages worker to express discontent during contract
negotiation and to make formal grievances rather than resign. Meanwhile, there is
an explanation of “reserve causation”. This means that dissatisfied workers select
themselves into unions or form unions (Parlow, 2006). However, there may be some
positive impacts of unions since it could help improve the work conditions, fringe
benefits, and remuneration (Hammer & Avgar, 2005).
Job tenure and experience have also been studied in the literature. Freeman (1978)
found these elements, however, have no effect on job satisfaction. Conversely,
Hamermesh (1977) proposes that with the increase in years of experience, workers
become more certain about their abilities, so their expectations could be met more
easily, leading to higher levels of happiness.
According to Hamermesh (1977), job specific training is a part of the human capital
model; therefore, it should be introduced in the job satisfaction equation. In detail,
8
the more a worker participates in training courses, the higher probability he is locked
into the occupation, and hence, the level of uncertainty of his future wage is
reduced. Moreover, training courses could not only improve the worker’s ability and
make him more confident in his job; but also gives better opportunities to increase
his income or to have promotion. As a result, he reaches higher levels of job
satisfaction than his colleagues who do not participate in any training course and
could not get any benefit.
Among job characteristics that affect job satisfaction, wage (in terms of absolute and
relative values) is considered as a crucial determinant that has been extensively
investigated in the literature (Clark & Oswald, 1996; and Hamersmesh, 2001). The
importance of absolute wage is obvious as it is an important factor when individuals
decide whether or not to take up job offers. At the same time, the larger gap
between offered wage and reservation wage, the higher probability workers take the
job. Similarly, relative wage may also be important as individuals often compare their
wage with certain benchmarks, i.e. their potential earnings, the salary of coworkers
in the same factory or the industry average wage. Hamersmesh (2001) suggests that
job satisfaction is affected by relative wage due to their differences in expectation.
In addition to the mentioned factors, there are a number of other factors that have
been investigated in the non-economic literature, including (i) the relationship
between the employees and their superiors and other co-workers: the social climate
among co-workers, the degree of professional cooperation, and the sense of social
belonging are believed to have influence on employees satisfaction; (ii) the
organizational vision, culture, and ethical aspects of the organization, the ability of
corporate management; and (iii) the number of working hours.
In the case of Vietnam, there are only a few studies on determinants of job
satisfaction (Hoang, 2010; Thang et al., 2007; Thang & Napier, 2000; and
Wachsberger et al., 2011). Using survey data that was collected in 1995 in Vietnam,
Thang & Napier (2000) find high levels of commitment to organizations and job
9
satisfaction held by Vietnamese employees in spite of low wages. In the research
conducted by Thang et al. (2007), job satisfaction was only mentioned as a small
component of management practices relating to employee empowerment. While
Hoang (2010) gives a general descriptive study on job satisfaction, Wachsberger et al.
(2011) focuses on job satisfaction in informal sector.2 By using household-based
survey data, Wachsberger et al. (2011) creates a model covering a wide range of
determinants of job satisfaction, such as institutional sector, job status, income,
regions, job characteristics, workplace, and socio demographics.
In general, our paper aims to contribute solid findings towards the limited literature
on determinants of job satisfaction in the Vietnamese context. This will be done
based on a quantitative analysis, using data from a unique employer-employee
matched survey. In addition, we also clarify the different determinants that affect
workers’ job satisfaction in local versus FDI sectors.
III. DATA AND METHODOLOGY
In our empirical model, job satisfaction can be described by the following latent
variable model:
S* = xi’β1+zi’β2+ εi
where S* is a latent variable measuring level of job satisfaction that is assumed to be
linearly related to the vector of explanatory variables xi which influence an
individual’s utility from being in a job and the vector of firm characteristics zi. In our
data, job satisfaction is described as an ordinal response variable, indicating
individuals are either very satisfied (S=2), rather satisfied/somewhat satisfied (S=1) or
dissatisfied/extreme disatisfied (S=0) with their job. With this ordinal response
variable, an ordinal logit/probit model is appropriate.3
2http://gracc.recherche.univ-lille3.fr/attachments/communications_perso_21/II.4.6%20WACHSBERGER%202.pdf
3 The estimation of ordinal logit/probit model is performed using STATA software.
10
In order to use results of an ordinal logit/probit model, the most essential condition
is the validity of parallel-lines assumption. The parallel-lines assumption states that
the ordered logit coefficients in the model are the same across the level of response
variable. Unfortunately, this assumption is often violated (i.e. the estimated
coefficient would be biased); and in our paper, the assumption is not held. To solve
this problem, we use generalized ordered logit models for ordinal dependent
variables instead of the normal ordinal logit model, following William (2006).
As discussed above, most previous studies relied on labor force surveys, where a
number of important job-characteristics are missing, especially job-environment,
peer workers, and human resource practices. In our paper, we rely on an employer-
employee matched survey that is provided by the Center of Analysis and Forecasting,
Vietnam Academy of Social Sciences. As such, in our model, we explicitly specify two
groups of variables. The vector xi may include (i) earning; (ii) worker’s characteristics
that are collected from employees’ questionnaire, and the vector zi covers (iii) firm’s
characteristics from questionnaires on FDI and non-FDI firms in Vietnam.
With respect to earnings, previous studies have gone beyond relating job satisfaction
to a person's own earnings as a primary determinant of job satisfaction. Among the
factors believed to influence job satisfaction, relative income has attracted
considerable attention since it is widely asserted that individuals are not only simply
interested in the absolute wage they themselves receive, but also their wage relative
to some reference group. This opinion derives from the view that an individual’s
happiness does not depend only on his/her own income but also on some reference
level. Several studies have tested the hypothesis that this 'reference' or 'relative'
income is an important determinant of job satisfaction. In our study, we follow an
approach implemented by Hamermesh (1977, 2001) to derive relative income. In
particular, Hamermesh (1977, 2001) defines ‘relative income’ as the difference
between current income (y) and expected income (y*), which is obtained from an
11
estimated Mincerian earnings equation. Relative income is treated as a standard that
makes individual workers relatively better or worse off.
In order to estimate the influence of job characteristics on job satisfaction, it is
necessary to control for the personal characteristics of each worker. The data set
contains a number of commonly used variables such as education, gender, marital
status, and age. These variables are used in the literature as control variables.
The interesting part of our analysis may come from firm level characteristics. Thanks
to the unique data set, we are able to match a number of firm level information, such
as human resource practices and policies to information about individual workers, in
order to assess whether these job-related firm level characteristics have any
influence on the job satisfaction of workers. In comparison with previous literature
which relies only on worker’s characteristics to model worker’s job satisfaction, this
data set allows us to directly assess the firm level characteristics such as efficiency
wage policy and cost of training courses as percentage of revenue.
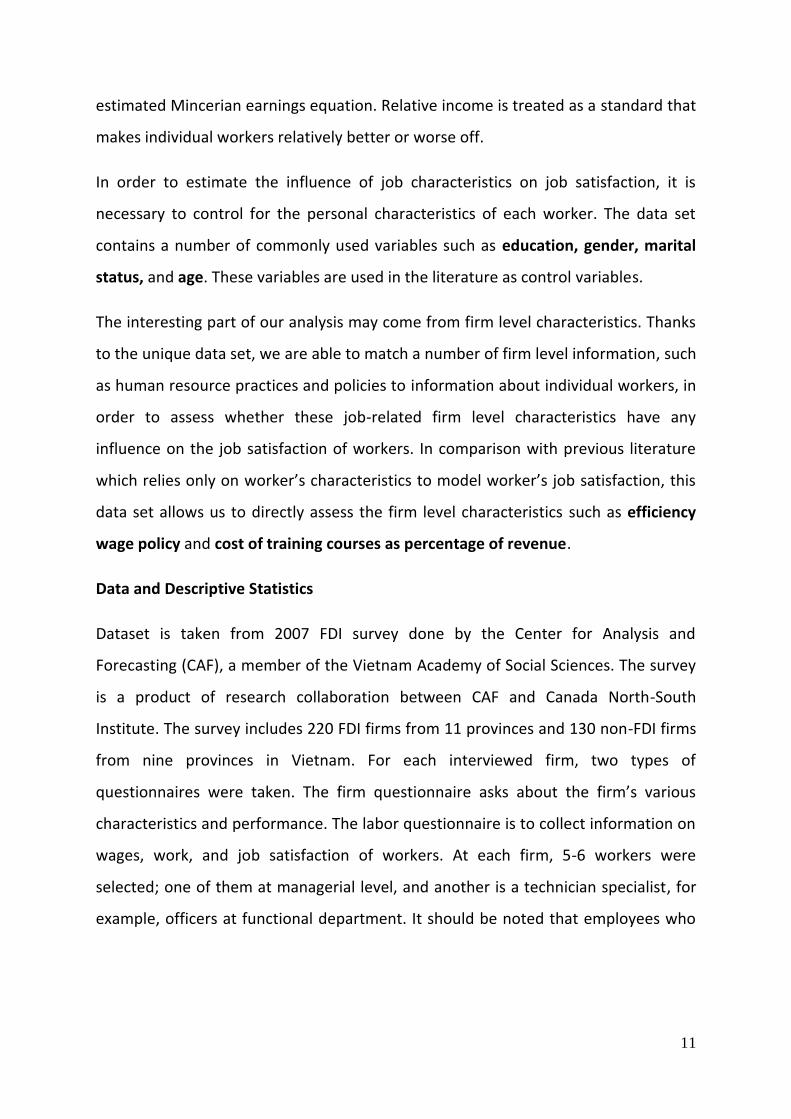
Data and Descriptive Statistics
Dataset is taken from 2007 FDI survey done by the Center for Analysis and
Forecasting (CAF), a member of the Vietnam Academy of Social Sciences. The survey
is a product of research collaboration between CAF and Canada North-South
Institute. The survey includes 220 FDI firms from 11 provinces and 130 non-FDI firms
from nine provinces in Vietnam. For each interviewed firm, two types of
questionnaires were taken. The firm questionnaire asks about the firm’s various
characteristics and performance. The labor questionnaire is to collect information on
wages, work, and job satisfaction of workers. At each firm, 5-6 workers were
selected; one of them at managerial level, and another is a technician specialist, for
example, officers at functional department. It should be noted that employees who
12
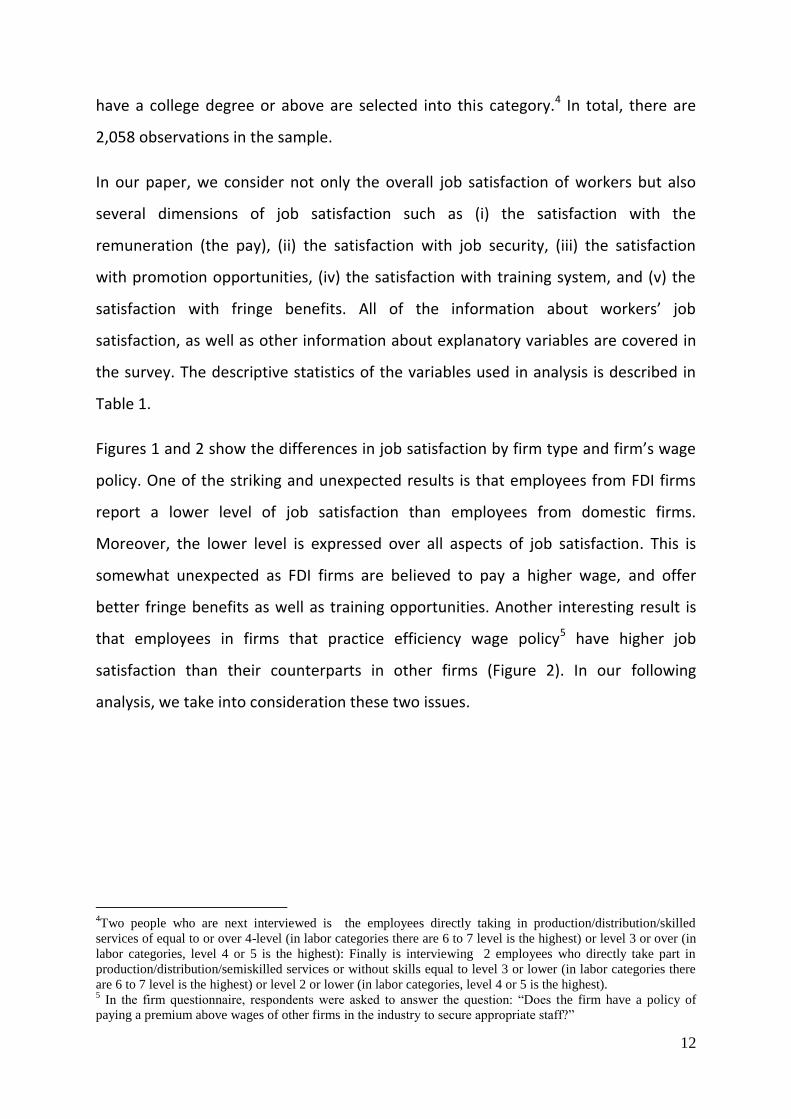
have a college degree or above are selected into this category.4 In total, there are
2,058 observations in the sample.
In our paper, we consider not only the overall job satisfaction of workers but also
several dimensions of job satisfaction such as (i) the satisfaction with the
remuneration (the pay), (ii) the satisfaction with job security, (iii) the satisfaction
with promotion opportunities, (iv) the satisfaction with training system, and (v) the
satisfaction with fringe benefits. All of the information about workers’ job
satisfaction, as well as other information about explanatory variables are covered in
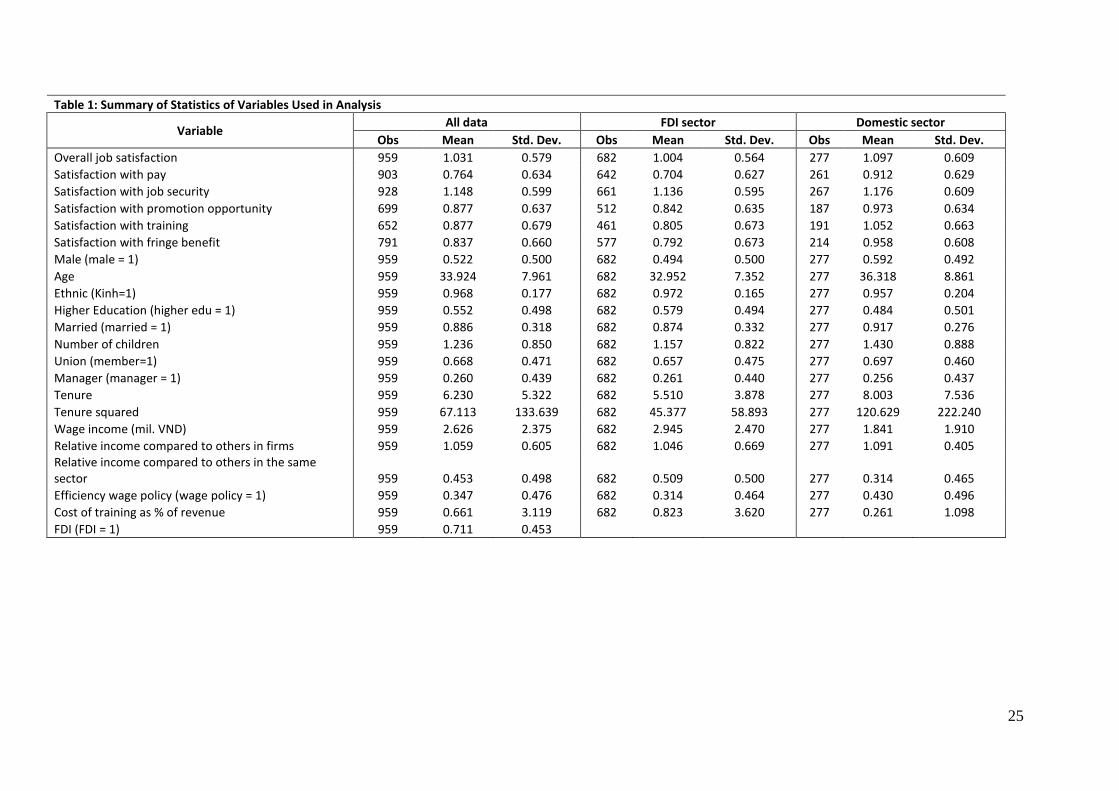
the survey. The descriptive statistics of the variables used in analysis is described in
Table 1.
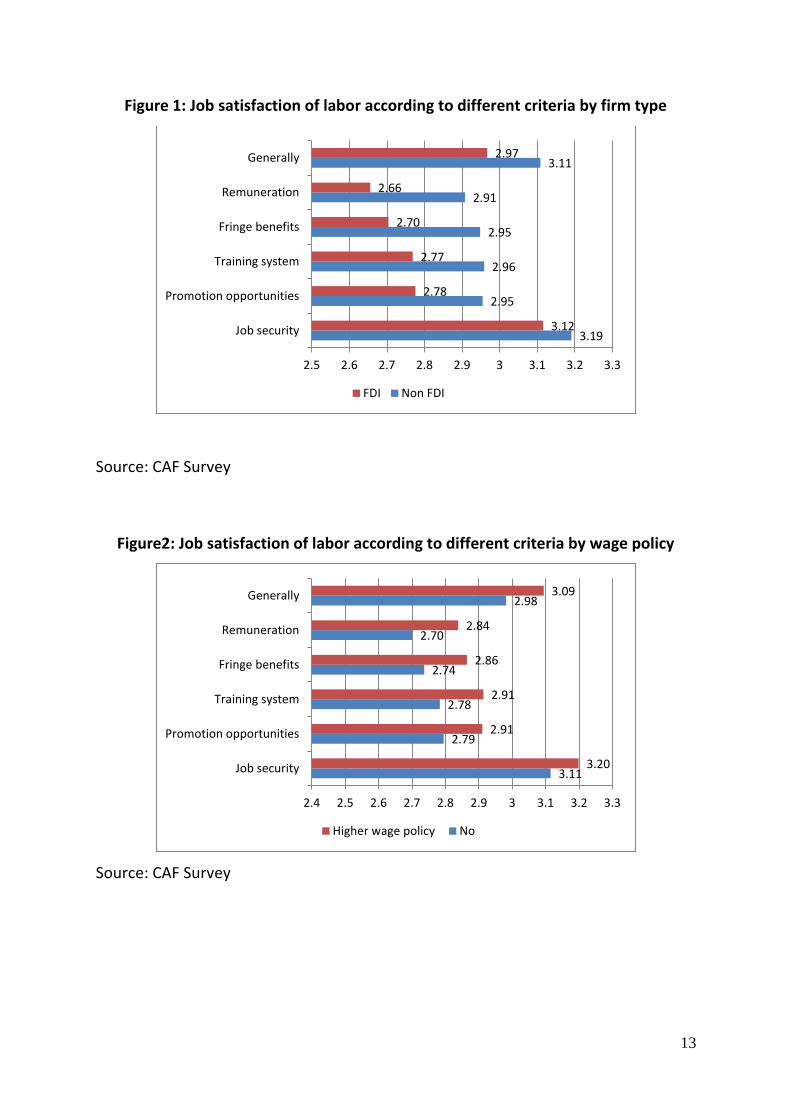
Figures 1 and 2 show the differences in job satisfaction by firm type and firm’s wage
policy. One of the striking and unexpected results is that employees from FDI firms
report a lower level of job satisfaction than employees from domestic firms.
Moreover, the lower level is expressed over all aspects of job satisfaction. This is
somewhat unexpected as FDI firms are believed to pay a higher wage, and offer
better fringe benefits as well as training opportunities. Another interesting result is
that employees in firms that practice efficiency wage policy5 have higher job
satisfaction than their counterparts in other firms (Figure 2). In our following
analysis, we take into consideration these two issues.
4Two people who are next interviewed is the employees directly taking in production/distribution/skilled
services of equal to or over 4-level (in labor categories there are 6 to 7 level is the highest) or level 3 or over (in
labor categories, level 4 or 5 is the highest): Finally is interviewing 2 employees who directly take part in
production/distribution/semiskilled services or without skills equal to level 3 or lower (in labor categories there
are 6 to 7 level is the highest) or level 2 or lower (in labor categories, level 4 or 5 is the highest). 5 In the firm questionnaire, respondents were asked to answer the question: “Does the firm have a policy of
paying a premium above wages of other firms in the industry to secure appropriate staff?”
13
Figure 1: Job satisfaction of labor according to different criteria by firm type
Source: CAF Survey
Figure2: Job satisfaction of labor according to different criteria by wage policy
Source: CAF Survey
3.19
2.95
2.96
2.95
2.91
3.11
3.12
2.78
2.77
2.70
2.66
2.97
2.5 2.6 2.7 2.8 2.9 3 3.1 3.2 3.3
Job security
Promotion opportunities
Training system
Fringe benefits
Remuneration
Generally
FDI Non FDI
3.11
2.79
2.78
2.74
2.70
2.98
3.20
2.91
2.91
2.86
2.84
3.09
2.4 2.5 2.6 2.7 2.8 2.9 3 3.1 3.2 3.3
Job security
Promotion opportunities
Training system
Fringe benefits
Remuneration
Generally
Higher wage policy No
14
IV. ESTIMATION RESULT AND DISCUSSION
Determinants of Job Satisfaction in the Vietnamese Context
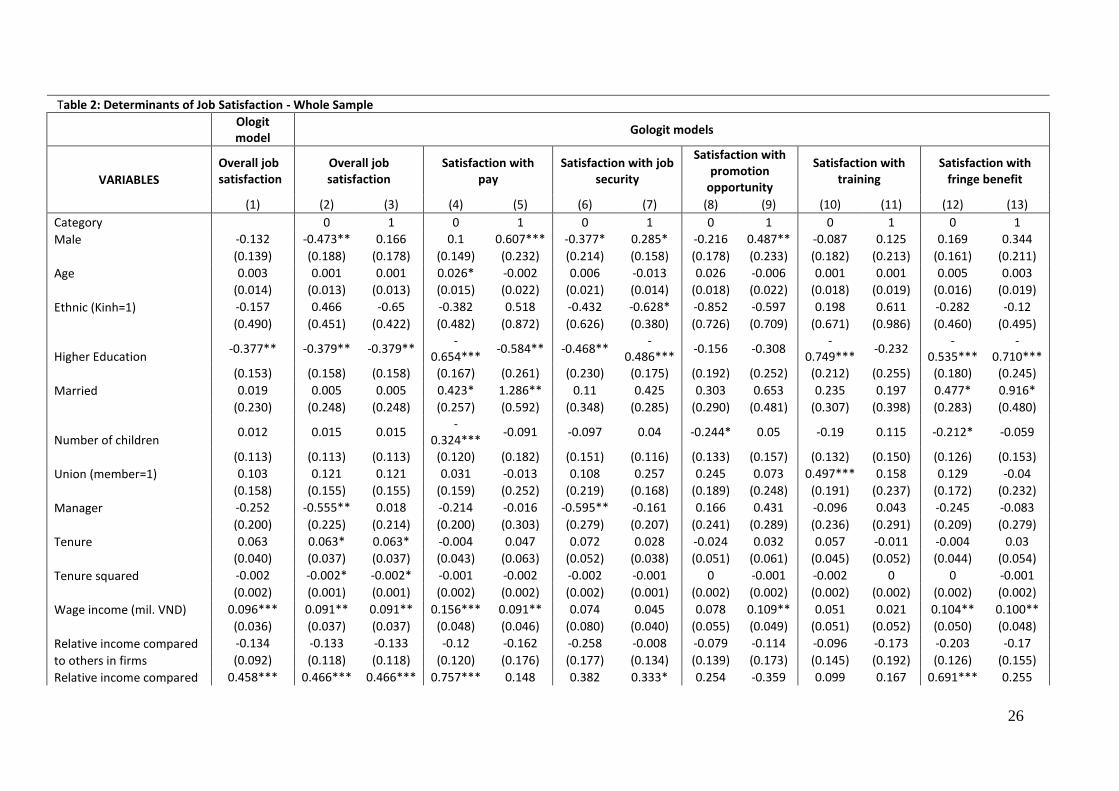
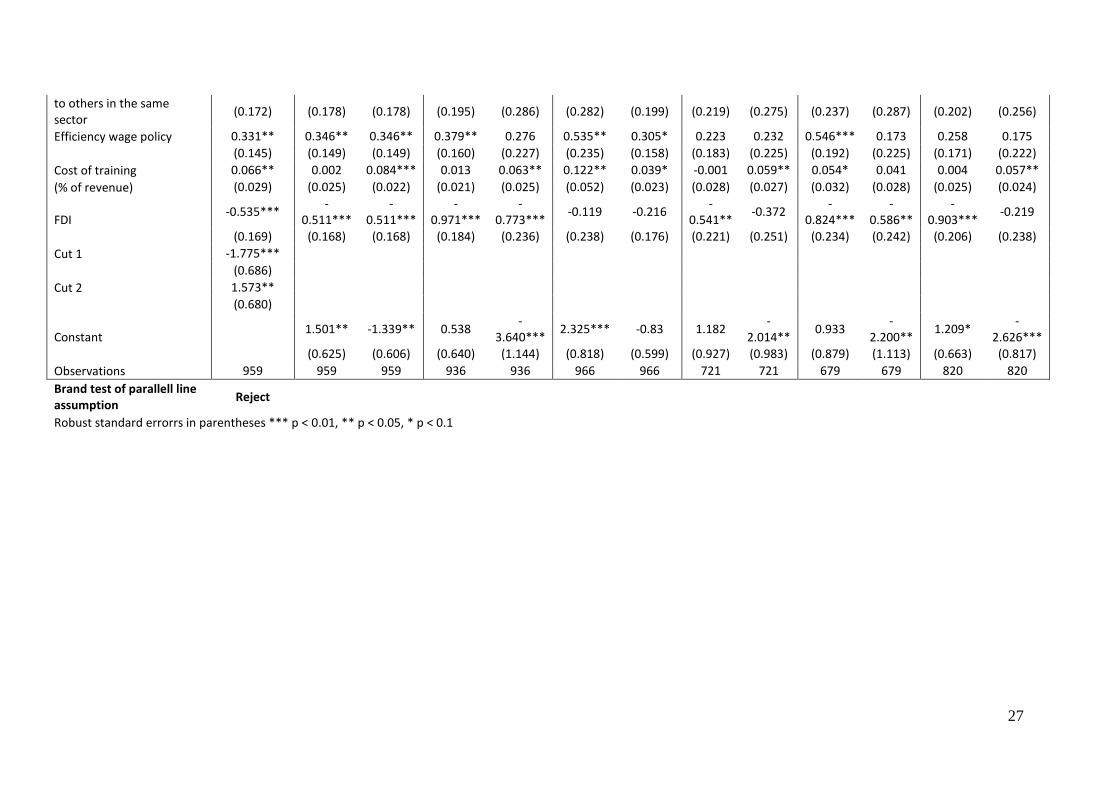
The estimation results for the whole sample are presented in Table 2. We firstly
estimate model of overall job satisfaction for the whole sample using normal ordered
logit method (NOLM) (Model 1, Table 2). And hence, considering the validity of the
parallel-lines assumption, we used the Brant command in Stata to test the null
hypothesis. The validity of Model 1, Table 2 is held if and only if the Brant test
confirms that the parallel-lines assumption is satisfied. Unfortunately, the result of
the test shows that the assumption is violated, and the main problems is with the
variables of gender (Male), ethnicity (Ethnic), union membership (Union), job status
(Manager), and the expense that firm uses for training (Cost of training as % of
revenue).
To address the invalidity of the parallel-lines assumption, we used the generalized
ordered logit method (GOLM) instead of the NOLM. The method frees “all variables
from the parallel-lines constraint, even though the assumption may be violated only
by one or few of them” (Williams, 2006). The result achieved from the GOLM can be
interpreted is a series of binary logistic regressions. For example, in case of overall
job satisfaction, Model 2, Table 2 contrast category 0 (Dissatisfied) with categories 1
(Rather Satisfied) and 2 (Very Satisfied); Model 3, Table 2 contrast categories 0 and 1
with category 2.
As there are different sub-domains of job satisfaction (e.g. satisfaction with pay, with
fringe benefits, with promotion, with job security, and with training opportunities) in
our data, we also estimate a separate model for each type of satisfaction using
GOLM. The similar explanation is applied to these dimensions.
In term of personal characteristics, our estimation results suggest that the effects of
gender are different among dimensions of job satisfaction. Firstly, the estimated
coefficient of the gender variable is statistically insignificant in case of worker’s
15
satisfaction with training and fringe benefit. Secondly, male workers seem to be
more dissatisfied with their job satisfaction in general (Model 2, Table 2). Thirdly,
they tend to report a higher satisfaction level than female colleagues in cases of pay
and promotion opportunity (Models 5 and 9, Table 2). Finally, regarding satisfaction
with job security, men often choose extreme dissatisfaction (category 0) or very
satisfaction (category 2) rather than somewhat satisfaction (category 1).
Meanwhile, age and ethnicity do not seem to be important factors in determining job
satisfaction. By contrast, education is found to be statistically significant and
negatively related to job satisfaction. Individuals with higher education level are
found to be more dissatisfied with their job. However, the influence of education
differs across each type of job satisfaction. This is quite consistent with the literature
for other countries, where more educated people seem to have higher expectations,
thus lower satisfaction.
In terms of family background, the coefficients of marital status and number of
children are statistically significant at the same time in cases of satisfaction with pay
and fringe benefit. Our regression outputs show that workers who are married are
often more satisfied with their wage, as well as fringe benefits than single workers
(Models 4, 5, 12, and 13, Table 2). However, workers with more children tend to
report that they are really dissatisfied with their pay, their promotion opportunity,
and their benefit (Model 4, 8, and 12, Table 2). The results are plausible since the
financial burden that affects the level of workers’ satisfaction with wage (and fringe
benefits also) is often shared between spouses, and increases when a worker has his
own children.
In terms of job characteristics, there are a number of interesting results. Using
NOLM, union membership, job status (being a manager) and job tenure are found
not to have any association with job satisfaction. However, the results received from
using GOLM change to some extent: (i) members of trade union seem to be more
satisfied with training course (Model 10, Table 2); (ii) but managers tend to complain
16
about their work more than other workers in general (Model 2, Table 2), as well as
their job security in particular (Model 6, Table 2); and (iii) job tenure affects positively
overall job satisfaction of workers, the marginal effect of this factor, however, is
decrease as the coefficient of variable tenure squared is negative (Models 2, and 3,
Table 2).
Here, we focus on a number of variables of interest. Firstly, in terms of income, our
estimation results provide evidence to suggest that in the case of Vietnam, both
absolute income and relative income matter for job satisfaction. Absolute income
variable is highly significant in the models of overall job satisfaction, job satisfaction
with pay, job satisfaction with promotion opportunity, and job satisfaction with
fringe benefits. Moreover, we have two types of “reference income” in our models.
We hypothesize that individual workers may use the average income within the same
firm/factory as a benchmark, and they may also use average wage in the sector as
another one. The estimated results suggest that relative income matters, but in the
case of Vietnam, individual workers tend to rely only on sectoral income/wage as
their only benchmark.
Secondly, workers in FDI firms tend to report lower job satisfaction level than their
peers working in Vietnamese domestic firms. This estimation result is consistent with
the illustration in Figure 1, despite the fact that FDI firms tend to offer higher wage. It
could be explained as the compensation, working environment, and other conditions
that workers in FDI firms receive are not good enough to make them satisfied with
their job. The more detailed analysis on the determinants of job satisfaction in the
case of FDI firms in Vietnam will be presented at the next subsection.
Last but not least, we consider the effects of two important elements at the firm
level that we attempt to investigate in this study: (i) efficiency wage policy, i.e. firms
willing to pay higher salary to keep their staffs, and (ii) the expense they use for
training. Both of these variables are statistically significant in our models. Employees
working in firms that employ efficiency wage tend to report a higher level of job
17
satisfaction; likewise, working in firms that spend more in training (as a percentage
of their revenue) is associated with higher job satisfaction. These two variables, we
believe, are strongly associated with the human resource policy being employed at
the firm level. Therefore, the implication is such that to improve workers welfare,
wage is important, but non-wage benefits and wage policy may matter.
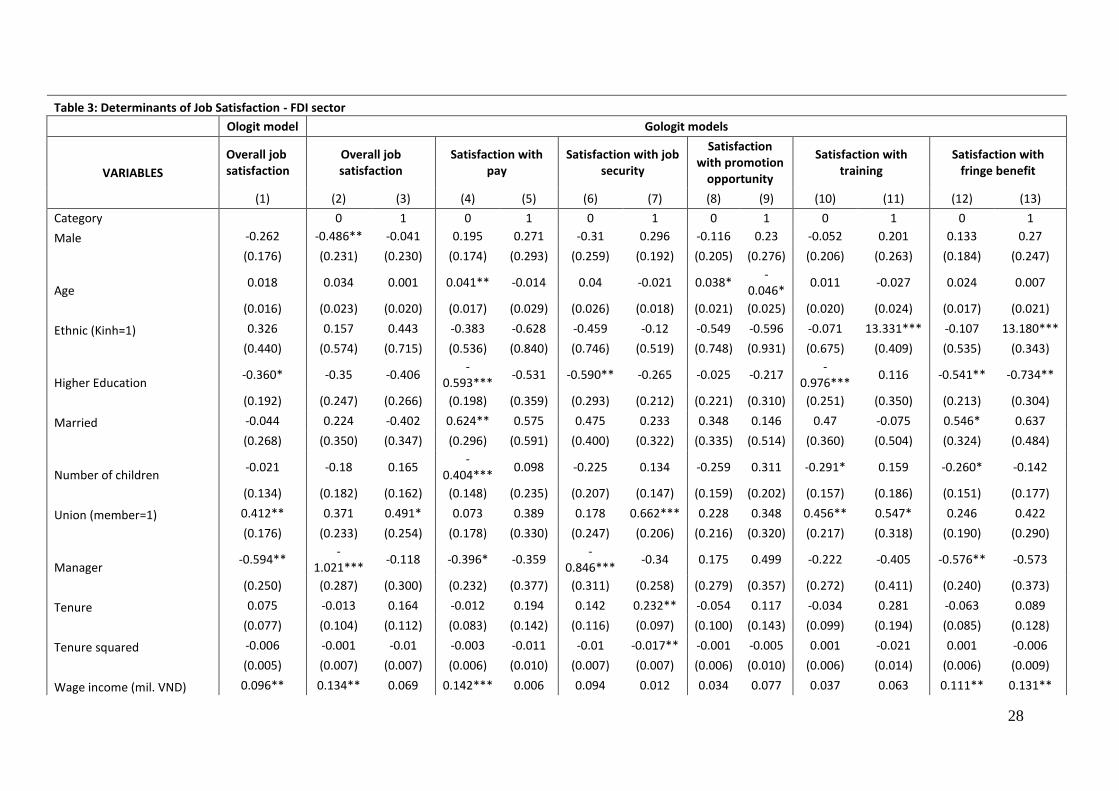
Determinants of Job Satisfaction in Cases of FDI and Domestic Firms
The significant difference between FDI firms and domestic firms in Table 2 suggests
that we should explore these two groups of firms further. We, therefore, estimated
job satisfaction models for FDI firms and domestic firms separately. Tables 3 and 4
present the corresponding estimation research. Estimating FDI and domestic firms
separately reveals a number of important and interesting findings.
Similar to the case of whole sample, the Brant test continues rejecting the validity of
parallel-lines assumption in both cases of FDI and domestic sectors. Under these
circumstances, we use GOLM to estimate the impact of explanatory variables on all
types of job satisfaction.
In general, personal characteristics such as gender, age, and ethnicity have different
impacts on job satisfaction of workers in FDI sector versus domestic sector. Gender
only impacts overall job satisfaction of workers in FDI sector (Model 2, Table 3),
whilst this factor has impacts on several types of job satisfaction of workers in
domestics sector. In more detail, male workers in local firms often report that they
are (i) very satisfied with their pay rather than satisfied or dissatisfied (Model 5,
Table 4); (ii) extremely dissatisfied with their job security rather than satisfied or very
satisfied (Model 6, Table 4); and (iii) extremely dissatisfied or very satisfied rather
than somewhat satisfied with their promotion opportunity (Models 8, and 9, Table
4).
Age affects satisfaction with pay and with promotion opportunity of workers in FDI
sector, but affects satisfaction with job security, promotion opportunity, and fringe
18
benefit of workers in domestic sector. Ethnicity has impact only on satisfaction of
training and fringe benefit of workers in local firms, while it affects all types of job
satisfaction in FDI firms, except fringe benefit. Although higher education does not
affect overall job satisfaction, it negatively impacts all other dimensions of job
satisfaction, except satisfaction with promotion opportunities in the FDI sector.
However, this factor only negatively affects workers’ satisfaction with wage and job
security in domestic sector.
In term of family background, marital status only affects workers’ satisfaction with
pay and benefit in FDI firms; but it affects all dimensions of job satisfaction in
domestic firms except training part. While number of children affects several type of
workers’ satisfaction in FDI firms such as wage, training, and fringe benefit, it does
not make any impact on in domestic sector.
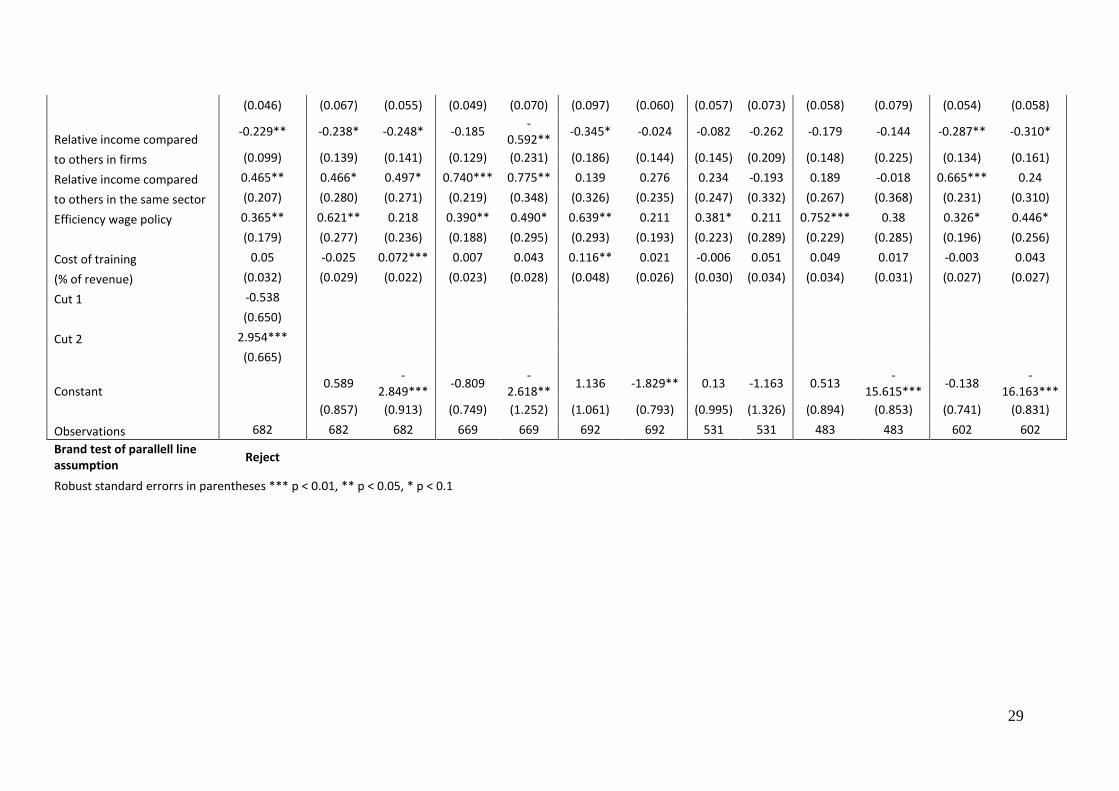
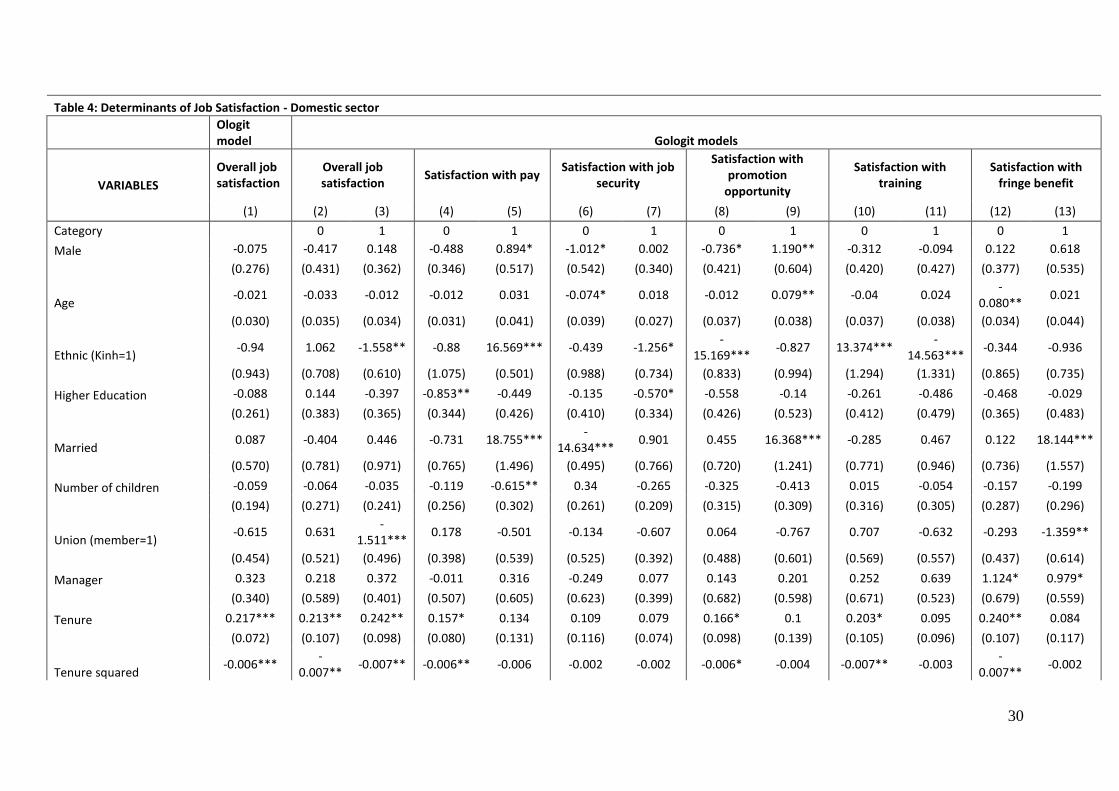
In general, the effects of job characteristics are extremely different between the two
types of firms. The first striking finding is the effect of union membership.
Considering both FDI and domestic sector as a whole sample, we were unable to find
the impact of union membership on workers’ job satisfaction, except satisfaction
with training system (i.e., employees participating in a union are more satisfied with
their firm’s training system). However, when estimating separately, we detect
heterogeneity in the impact of union membership for different types of firms. Whilst
union membership has a negative impact on job satisfaction of employees working in
domestic firms, it has a positive impact for employees in FDI firms. These opposite
impacts of union membership may suggest that the operation of unions within two
sectors differ from each other. In other words, it seems to be that trade unions in FDI
firms are more effective, and help to ensure the benefit of participants rather than in
domestic sector.
Managers in FDI firms are less satisfied with their job in general, as well as their
wage, job security, and fringe benefits in particular. The results imply that even
though FDI firms often offer higher salary and incentives than domestic firms do,
19
managers in FDI firms may face more uncertainty, more responsibility, as well as
more competitiveness than their colleagues in domestics firms. This could lead to
greater dissatisfaction with job in general as well as compensation in particular. By
contrast, managers in domestic firms seem to be more satisfied with their fringe
benefits. In addition, in the FDI sector, job tenure has only effect on workers’
satisfaction with job security; meanwhile, in domestic sector, it has an effect on all
types of job satisfaction except job security. In general, the effect of tenure on job
satisfaction is positive in both sectors; however, the marginal effect of this factor is
decrease as the coefficient of variable tenure squared is negative.
Asides from overall job satisfaction and satisfaction with pay, wage also positively
impacts other dimensions of job satisfaction of workers in FDI firms as well as
domestic firms. For workers in FDI firms, wage raises the level of satisfaction with
fringe benefits. While for workers in domestic firms, it increases the level of all other
types of job satisfaction. However, relative income tends to impact on only the
satisfaction of workers in FDI firms. The results suggest that there could exist the
competitive wage in FDI sector; by contrast, the wage levels among domestic firms
are relatively similar.
The next striking result is the impact of the efficiency wage policy. It seems that this
policy works only for FDI firms. While the estimated impact of efficiency wage policy
for FDI firms is strong, positive and statistically significant, the impact of this policy in
domestic sector is not statistically significant. It may imply that either domestic firms
do not have this practice (few observations) or workers select themselves differently
into these two types of firms, i.e., workers who consider the efficiency wage policy
prefer to work in FDI sector.
The final important determinant of job satisfaction is the cost of training as
percentage of firm’s revenue. In general, training is statistically significant in case of
domestic firms; it may have huge effect on workers in this sector, and help them
improve their productivity, leading to higher level job satisfaction they could get. By
20
contrast, training courses create effect only on overall job satisfaction and
satisfaction with job security of worker in FDI sector.
V. CONCLUSION
In this paper, we have investigated the determinants of job satisfaction for
Vietnamese workers. As this concept is still relatively new in Vietnam, it is not
captured in labor force surveys, household survey, or enterprise survey. Our research
is made possible thanks to the unique data from the Center of Analysis and
Forecasting, the Vietnam Academy of Social Sciences. This survey, although not
focusing on workers’ job satisfaction, allows us to match employee information with
employer data, and to consequently determine the job characteristics as well as the
firm characteristics that affect job satisfaction of workers.
Our estimation results indicate that in the Vietnamese context, age, ethnicity, union
membership and relative income compared to others in firms generally do not affect
workers’ job satisfaction. Important predictors of job satisfaction include education,
job status, job tenure, wage, relative income compared to others in the same sector,
and wage policy. However, when we separate the firms into FDI and domestic
sectors, the determinants in each sector are different. For example, gender and job
tenure affect only job satisfaction of workers in domestic sector, but not of workers
in FDI sectors; while several elements such as number of children, relative income,
and wage policy only affect workers’ satisfaction in FDI firms. Even in cases of
common determinants that impact both sectors, the ways that determinants affect
workers’ job satisfaction in each firm type are also dissimilar. While union
membership has a negative impact on job satisfaction of employees working in
domestic firms, it has a positive and significant impact for employees in FDI firms.
Our results, thus, suggest detailed policy implications for each sector are necessary
to raise the level of job satisfaction of Vietnamese workers as well as to encourage
them to work more efficient.
21
VI. REFERENCES
1. Albert, C., & Davia, MA., 2005, “Education, wages and job satisfaction”, Paper
presented at Epunet Conference 2005, Colchester
2. Argyle, M, & Martin, M. A., 1989, “The psychological causes of happiness”. In
F. Strack, M. Argyle, & N. Schwartz (Eds.), Subjective well-being (pp. 77-100).
Oxford, UK: Pergamon
3. Aziri, B., 2011, “Job satisfaction: A Literature Review”, Management Research
and Practice, Vol.3 Issue 4 (2011), pp 77-86
4. Baghaei, R., 2011, “A comparative study of human resource management
practices in private and public hospitals of Iran with special reference to job
satisfaction of nurses”, University of Pune
5. Belfield, CR. & Harris, R.D.F., 2002, “How well do theory of job matching
explain variations in job satisfaction across education levels?”, Applied
economics, Vol 34, Issue 5, pp 535 – 548
6. Blanchflower D. & Oswald A., 2000, “The rising well-being of the young, in
Youth Employment and Joblessness in Advanced Countries”, edited by
Blanchflower D and Freeman R, Chicago: The University of Chicago Press
7. Borjas, G.J., 1979, “Job satisfaction wages and unions”, The Journal of Human
Resources, Vol. 14, pp. 21-40. 4
8. Clark A.E. & Oswald, A.J., 1996, “Satisfaction and comparison income”, Journal
of Public Economics 61, pp 359-381
9. Clark A.E., Oswald, A.J., & Warr, PB., 1996, “Is job satisfaction u-shaped in
age?”, Journal of Occupational and Organizational Psychology, 69, pp 57-81
10. Clark, A.E., 1997, “Job satisfaction and gender: Why are women so happy at
work?” Labour Economics, 4, 341-372
11. Clark, S. & Pringle, T., 2009, “Can party – led trade unions represent their
members?”, Post-Communist Economies, Vol. 21, Issue 1, pp. 85 – 101
22
12. Crossman, A. & Abou-Zaki, B., 2003, “Job satisfaction and employee
performance of Lebanese banking staff”. Journal of Managerial Psychology,
18(4), pp. 368-376.
13. Dipboye, R.L., Smith, C.S., & Howell, W.C., 1994, “Understanding industrial and
organizational psychology: an integrated approach”, Harcourt Brace College
Publishers, Fort Worth, TX
14. Freeman, R.B., 1978, “Job satisfaction as an economic variable”, American
Economic Association, Vol. 6, pp 135 - 141
15. George, J.M. & Jones, G.R., (2008), “Understanding and Managing
Organizational behavior”, Fifth Edition, Upper Saddle River, NJ: Pearson
Prentice Hall
16. Hamermesh, D.S., 2001, “The Changing Distribution of Job Satisfaction”,
Journal of Human Resources, 36, pp 1-30
17. Hammer, T.H. & Avgar, A., 2005, “The Impact of Union on Job Satisfaction,
Organizational Commitment, and Turnover”, Journal of Labour Research,
Spring 2005, Vol.26, Issue 2, pp. 241-266.
18. Hoang T.H., 2010, “FDI and Wages: Evidence from Vietnam’s FDI Employee
Survey”, Working paper
19. Hoppock, R., 1935, “Job satisfaction”, Harper and Brothers, New York, p. 47
20. Kaliski, B.S. (2007). “Encyclopedia of Business and Finance”, Second edition,
Thompson Gale, Detroit, p. 446
21. Khalid K., Salim, H.M., & Loke, S.P., 2011, “Demographic profiling on job
satisfaction in Malaysian utility sector”, International Journal of Academic
Research, Vol. 3. No. 4. July, 2011
22. Koehler, L.S., 1998, “Job satisfaction and corporate fitness managers: an
organizational behaviour approach to sport management”, Journal of Sport
Management (1988), Vol. 2, No. 2, pp. 100-105
23
23. Lydon, R. & Chevalier A., 2002, “Estimates of the Effect of Wages on Job
Satisfaction London”, Centre for Economic Performance, London School of
Economics and Political Science
24. Maslow, A.H., 1943, “A Theory of Human Motivation”, Psychological Review,
50, 370 – 396
25. Parlow A., 2006, “Job Satisfaction in the Economic Science: An Overview
Master”, The University of Wisconsin-Milwaukee, Master thesis
26. Phelan, J., 1994, “The Paradox of the Contented Female Worker: An
Assessment of Alternative Explanations”. Social Psychology Quarterly 57: 13 -
30
27. Saari, L.M. & Judge, T.A., 2004, “Employee attitudes and job satisfaction”, The
Contributions of Psychological Research to Human Resource Management, Vol
43, Issue 4, pp 396 – 407
28. Sloane, P.J. & Ward, M.E., 2001, “Cohort effects and job satisfaction of
academics”, Applied economics letters, Vol. 8, Issue 12, pp. 787 – 791
29. Sousa-Poza, A. & Sousa-Poza, AA., 2003, “Job satisfaction and labor turnover:
Does gender matter?”, Discussion Paper, No. 94
30. Sousa-Poza, A. & Sousa-Poza, AA., 2007, “The effect of job satisfaction on
labor turnover by gender: An analysis for Switzerland”, The Journal of Socio-
Economics 36, pp 895–913
31. Spector, P.E., 1997, “Job satisfaction: application, assessment, causes and
consequences”, Thousand Oaks, CA: SAGE Publications
32. Shields, M.A. & Price, S.W., 2002, “Racial harassment, job satisfaction and
intentions to quit: evidence from the British nursing profession”, Economica,
69, pp. 295 - 326
33. Thang, L.C., Rowley, C., Quang, T., & Warner, M., 2007, “To what extent can
management practices be transferred between countries? The case of human
resource management in Vietnam”, Journal of World Business, 42 (2007), pp.
113–127
24
34. Thang, N.V. & Napier, N.K., 2000, “Work attitudes in Vietnam”, Academy of
Management Executive, Nov 2000, Vol. 14 Issue 4
35. Theodossiou, I. & Zangelidis, A., 2006, "Do Career Prospects Make Happy
Workers? Evidence from Panel Data." Business School Working Paper Series
2006-04, Universtiy of Aberdeen Business School
36. Vroom, V.H., 1964, “Work and motivation”, New York, NY: John Wiley and
Sons
37. Wachsberger, J.-M. & Razafindrakoto, M., 2013, "Job satisfaction and the
informal sector in Vietnam. The informal sector and informal employment:
statistical measurement, economic implications and public policies”, Paper
presented at International Conference: The Informal Sector and Informer
Employment, Hanoi
38. Williams, R., 2006, “Generalized ordered logit/partial proportional odds
models for ordinal dependent variables”, The Stata Journal 6, No 1, pp. 58- 82.
39. Witt, L.A. & Nye, L.G., 1992, “Gender and the relationship between perceived
fairness of pay or promotion and job satisfaction”, Journal of Applied
Psychology, Vol. 77(6), Dec 1992, pp. 910-917.
25
Table 1: Summary of Statistics of Variables Used in Analysis
Variable All data FDI sector Domestic sector
Obs Mean Std. Dev. Obs Mean Std. Dev. Obs Mean Std. Dev.
Overall job satisfaction 959 1.031 0.579 682 1.004 0.564 277 1.097 0.609
Satisfaction with pay 903 0.764 0.634 642 0.704 0.627 261 0.912 0.629
Satisfaction with job security 928 1.148 0.599 661 1.136 0.595 267 1.176 0.609
Satisfaction with promotion opportunity 699 0.877 0.637 512 0.842 0.635 187 0.973 0.634
Satisfaction with training 652 0.877 0.679 461 0.805 0.673 191 1.052 0.663
Satisfaction with fringe benefit 791 0.837 0.660 577 0.792 0.673 214 0.958 0.608
Male (male = 1) 959 0.522 0.500 682 0.494 0.500 277 0.592 0.492
Age 959 33.924 7.961 682 32.952 7.352 277 36.318 8.861
Ethnic (Kinh=1) 959 0.968 0.177 682 0.972 0.165 277 0.957 0.204
Higher Education (higher edu = 1) 959 0.552 0.498 682 0.579 0.494 277 0.484 0.501
Married (married = 1) 959 0.886 0.318 682 0.874 0.332 277 0.917 0.276
Number of children 959 1.236 0.850 682 1.157 0.822 277 1.430 0.888
Union (member=1) 959 0.668 0.471 682 0.657 0.475 277 0.697 0.460
Manager (manager = 1) 959 0.260 0.439 682 0.261 0.440 277 0.256 0.437
Tenure 959 6.230 5.322 682 5.510 3.878 277 8.003 7.536
Tenure squared 959 67.113 133.639 682 45.377 58.893 277 120.629 222.240
Wage income (mil. VND) 959 2.626 2.375 682 2.945 2.470 277 1.841 1.910
Relative income compared to others in firms 959 1.059 0.605 682 1.046 0.669 277 1.091 0.405 Relative income compared to others in the same sector 959 0.453 0.498 682 0.509 0.500 277 0.314 0.465
Efficiency wage policy (wage policy = 1) 959 0.347 0.476 682 0.314 0.464 277 0.430 0.496
Cost of training as % of revenue 959 0.661 3.119 682 0.823 3.620 277 0.261 1.098
FDI (FDI = 1) 959 0.711 0.453
26
Table 2: Determinants of Job Satisfaction - Whole Sample
Ologit model
Gologit models
VARIABLES
Overall job satisfaction
Overall job satisfaction
Satisfaction with pay
Satisfaction with job security
Satisfaction with promotion
opportunity
Satisfaction with training
Satisfaction with fringe benefit
(1) (2) (3) (4) (5) (6) (7) (8) (9) (10) (11) (12) (13)
Category 0 1 0 1 0 1 0 1 0 1 0 1
Male -0.132 -0.473** 0.166 0.1 0.607*** -0.377* 0.285* -0.216 0.487** -0.087 0.125 0.169 0.344
(0.139) (0.188) (0.178) (0.149) (0.232) (0.214) (0.158) (0.178) (0.233) (0.182) (0.213) (0.161) (0.211)
Age 0.003 0.001 0.001 0.026* -0.002 0.006 -0.013 0.026 -0.006 0.001 0.001 0.005 0.003
(0.014) (0.013) (0.013) (0.015) (0.022) (0.021) (0.014) (0.018) (0.022) (0.018) (0.019) (0.016) (0.019)
Ethnic (Kinh=1) -0.157 0.466 -0.65 -0.382 0.518 -0.432 -0.628* -0.852 -0.597 0.198 0.611 -0.282 -0.12
(0.490) (0.451) (0.422) (0.482) (0.872) (0.626) (0.380) (0.726) (0.709) (0.671) (0.986) (0.460) (0.495)
Higher Education -0.377** -0.379** -0.379**
-0.654***
-0.584** -0.468** -
0.486*** -0.156 -0.308
-0.749***
-0.232 -
0.535*** -
0.710***
(0.153) (0.158) (0.158) (0.167) (0.261) (0.230) (0.175) (0.192) (0.252) (0.212) (0.255) (0.180) (0.245)
Married 0.019 0.005 0.005 0.423* 1.286** 0.11 0.425 0.303 0.653 0.235 0.197 0.477* 0.916*
(0.230) (0.248) (0.248) (0.257) (0.592) (0.348) (0.285) (0.290) (0.481) (0.307) (0.398) (0.283) (0.480)
Number of children 0.012 0.015 0.015
-0.324***
-0.091 -0.097 0.04 -0.244* 0.05 -0.19 0.115 -0.212* -0.059
(0.113) (0.113) (0.113) (0.120) (0.182) (0.151) (0.116) (0.133) (0.157) (0.132) (0.150) (0.126) (0.153)
Union (member=1) 0.103 0.121 0.121 0.031 -0.013 0.108 0.257 0.245 0.073 0.497*** 0.158 0.129 -0.04
(0.158) (0.155) (0.155) (0.159) (0.252) (0.219) (0.168) (0.189) (0.248) (0.191) (0.237) (0.172) (0.232)
Manager -0.252 -0.555** 0.018 -0.214 -0.016 -0.595** -0.161 0.166 0.431 -0.096 0.043 -0.245 -0.083
(0.200) (0.225) (0.214) (0.200) (0.303) (0.279) (0.207) (0.241) (0.289) (0.236) (0.291) (0.209) (0.279)
Tenure 0.063 0.063* 0.063* -0.004 0.047 0.072 0.028 -0.024 0.032 0.057 -0.011 -0.004 0.03
(0.040) (0.037) (0.037) (0.043) (0.063) (0.052) (0.038) (0.051) (0.061) (0.045) (0.052) (0.044) (0.054)
Tenure squared -0.002 -0.002* -0.002* -0.001 -0.002 -0.002 -0.001 0 -0.001 -0.002 0 0 -0.001
(0.002) (0.001) (0.001) (0.002) (0.002) (0.002) (0.001) (0.002) (0.002) (0.002) (0.002) (0.002) (0.002)
Wage income (mil. VND) 0.096*** 0.091** 0.091** 0.156*** 0.091** 0.074 0.045 0.078 0.109** 0.051 0.021 0.104** 0.100**
(0.036) (0.037) (0.037) (0.048) (0.046) (0.080) (0.040) (0.055) (0.049) (0.051) (0.052) (0.050) (0.048)
Relative income compared -0.134 -0.133 -0.133 -0.12 -0.162 -0.258 -0.008 -0.079 -0.114 -0.096 -0.173 -0.203 -0.17
to others in firms (0.092) (0.118) (0.118) (0.120) (0.176) (0.177) (0.134) (0.139) (0.173) (0.145) (0.192) (0.126) (0.155)
Relative income compared 0.458*** 0.466*** 0.466*** 0.757*** 0.148 0.382 0.333* 0.254 -0.359 0.099 0.167 0.691*** 0.255
27
to others in the same sector
(0.172) (0.178) (0.178) (0.195) (0.286) (0.282) (0.199) (0.219) (0.275) (0.237) (0.287) (0.202) (0.256)
Efficiency wage policy 0.331** 0.346** 0.346** 0.379** 0.276 0.535** 0.305* 0.223 0.232 0.546*** 0.173 0.258 0.175
(0.145) (0.149) (0.149) (0.160) (0.227) (0.235) (0.158) (0.183) (0.225) (0.192) (0.225) (0.171) (0.222)
Cost of training 0.066** 0.002 0.084*** 0.013 0.063** 0.122** 0.039* -0.001 0.059** 0.054* 0.041 0.004 0.057**
(% of revenue) (0.029) (0.025) (0.022) (0.021) (0.025) (0.052) (0.023) (0.028) (0.027) (0.032) (0.028) (0.025) (0.024)
FDI -0.535***
-0.511***
-0.511***
-0.971***
-0.773***
-0.119 -0.216 -
0.541** -0.372
-0.824***
-0.586**
-0.903***
-0.219
(0.169) (0.168) (0.168) (0.184) (0.236) (0.238) (0.176) (0.221) (0.251) (0.234) (0.242) (0.206) (0.238)
Cut 1 -1.775***
(0.686)
Cut 2 1.573**
(0.680)
Constant 1.501** -1.339** 0.538
-3.640***
2.325*** -0.83 1.182 -
2.014** 0.933
-2.200**
1.209* -
2.626***
(0.625) (0.606) (0.640) (1.144) (0.818) (0.599) (0.927) (0.983) (0.879) (1.113) (0.663) (0.817)
Observations 959 959 959 936 936 966 966 721 721 679 679 820 820
Brand test of parallell line assumption
Reject
Robust standard errorrs in parentheses *** p < 0.01, ** p < 0.05, * p < 0.1
28
Table 3: Determinants of Job Satisfaction - FDI sector
Ologit model Gologit models
VARIABLES
Overall job satisfaction
Overall job satisfaction
Satisfaction with pay
Satisfaction with job security
Satisfaction with promotion
opportunity
Satisfaction with training
Satisfaction with fringe benefit
(1) (2) (3) (4) (5) (6) (7) (8) (9) (10) (11) (12) (13)
Category 0 1 0 1 0 1 0 1 0 1 0 1
Male -0.262 -0.486** -0.041 0.195 0.271 -0.31 0.296 -0.116 0.23 -0.052 0.201 0.133 0.27
(0.176) (0.231) (0.230) (0.174) (0.293) (0.259) (0.192) (0.205) (0.276) (0.206) (0.263) (0.184) (0.247)
Age 0.018 0.034 0.001 0.041** -0.014 0.04 -0.021 0.038*
-0.046*
0.011 -0.027 0.024 0.007
(0.016) (0.023) (0.020) (0.017) (0.029) (0.026) (0.018) (0.021) (0.025) (0.020) (0.024) (0.017) (0.021)
Ethnic (Kinh=1) 0.326 0.157 0.443 -0.383 -0.628 -0.459 -0.12 -0.549 -0.596 -0.071 13.331*** -0.107 13.180***
(0.440) (0.574) (0.715) (0.536) (0.840) (0.746) (0.519) (0.748) (0.931) (0.675) (0.409) (0.535) (0.343)
Higher Education -0.360* -0.35 -0.406
-0.593***
-0.531 -0.590** -0.265 -0.025 -0.217 -
0.976*** 0.116 -0.541** -0.734**
(0.192) (0.247) (0.266) (0.198) (0.359) (0.293) (0.212) (0.221) (0.310) (0.251) (0.350) (0.213) (0.304)
Married -0.044 0.224 -0.402 0.624** 0.575 0.475 0.233 0.348 0.146 0.47 -0.075 0.546* 0.637
(0.268) (0.350) (0.347) (0.296) (0.591) (0.400) (0.322) (0.335) (0.514) (0.360) (0.504) (0.324) (0.484)
Number of children -0.021 -0.18 0.165
-0.404***
0.098 -0.225 0.134 -0.259 0.311 -0.291* 0.159 -0.260* -0.142
(0.134) (0.182) (0.162) (0.148) (0.235) (0.207) (0.147) (0.159) (0.202) (0.157) (0.186) (0.151) (0.177)
Union (member=1) 0.412** 0.371 0.491* 0.073 0.389 0.178 0.662*** 0.228 0.348 0.456** 0.547* 0.246 0.422
(0.176) (0.233) (0.254) (0.178) (0.330) (0.247) (0.206) (0.216) (0.320) (0.217) (0.318) (0.190) (0.290)
Manager -0.594**
-1.021***
-0.118 -0.396* -0.359 -
0.846*** -0.34 0.175 0.499 -0.222 -0.405 -0.576** -0.573
(0.250) (0.287) (0.300) (0.232) (0.377) (0.311) (0.258) (0.279) (0.357) (0.272) (0.411) (0.240) (0.373)
Tenure 0.075 -0.013 0.164 -0.012 0.194 0.142 0.232** -0.054 0.117 -0.034 0.281 -0.063 0.089
(0.077) (0.104) (0.112) (0.083) (0.142) (0.116) (0.097) (0.100) (0.143) (0.099) (0.194) (0.085) (0.128)
Tenure squared -0.006 -0.001 -0.01 -0.003 -0.011 -0.01 -0.017** -0.001 -0.005 0.001 -0.021 0.001 -0.006
(0.005) (0.007) (0.007) (0.006) (0.010) (0.007) (0.007) (0.006) (0.010) (0.006) (0.014) (0.006) (0.009)
Wage income (mil. VND) 0.096** 0.134** 0.069 0.142*** 0.006 0.094 0.012 0.034 0.077 0.037 0.063 0.111** 0.131**
29
(0.046) (0.067) (0.055) (0.049) (0.070) (0.097) (0.060) (0.057) (0.073) (0.058) (0.079) (0.054) (0.058)
Relative income compared -0.229** -0.238* -0.248* -0.185
-0.592**
-0.345* -0.024 -0.082 -0.262 -0.179 -0.144 -0.287** -0.310*
to others in firms (0.099) (0.139) (0.141) (0.129) (0.231) (0.186) (0.144) (0.145) (0.209) (0.148) (0.225) (0.134) (0.161)
Relative income compared 0.465** 0.466* 0.497* 0.740*** 0.775** 0.139 0.276 0.234 -0.193 0.189 -0.018 0.665*** 0.24
to others in the same sector (0.207) (0.280) (0.271) (0.219) (0.348) (0.326) (0.235) (0.247) (0.332) (0.267) (0.368) (0.231) (0.310)
Efficiency wage policy 0.365** 0.621** 0.218 0.390** 0.490* 0.639** 0.211 0.381* 0.211 0.752*** 0.38 0.326* 0.446*
(0.179) (0.277) (0.236) (0.188) (0.295) (0.293) (0.193) (0.223) (0.289) (0.229) (0.285) (0.196) (0.256)
Cost of training 0.05 -0.025 0.072*** 0.007 0.043 0.116** 0.021 -0.006 0.051 0.049 0.017 -0.003 0.043
(% of revenue) (0.032) (0.029) (0.022) (0.023) (0.028) (0.048) (0.026) (0.030) (0.034) (0.034) (0.031) (0.027) (0.027)
Cut 1 -0.538
(0.650)
Cut 2 2.954***
(0.665)
Constant 0.589
-2.849***
-0.809 -
2.618** 1.136 -1.829** 0.13 -1.163 0.513
-15.615***
-0.138 -
16.163***
(0.857) (0.913) (0.749) (1.252) (1.061) (0.793) (0.995) (1.326) (0.894) (0.853) (0.741) (0.831)
Observations 682 682 682 669 669 692 692 531 531 483 483 602 602
Brand test of parallell line assumption
Reject
Robust standard errorrs in parentheses *** p < 0.01, ** p < 0.05, * p < 0.1
30
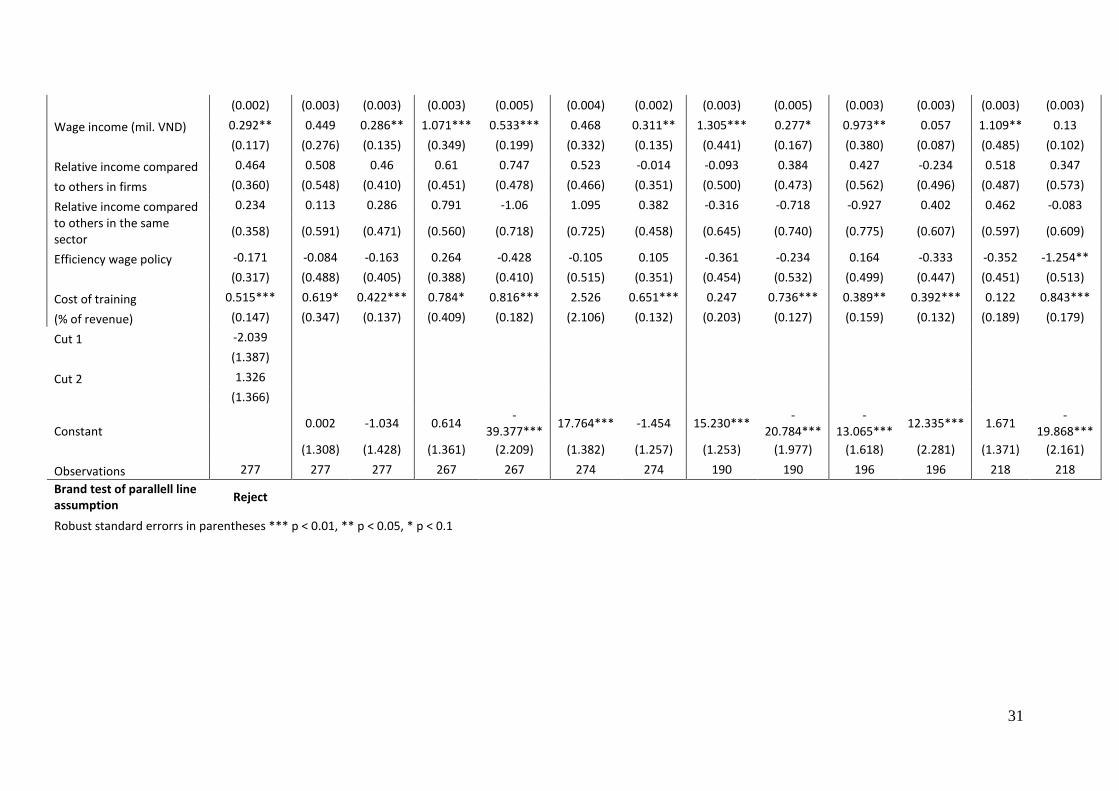
Table 4: Determinants of Job Satisfaction - Domestic sector
Ologit model Gologit models
VARIABLES
Overall job satisfaction
Overall job satisfaction
Satisfaction with pay Satisfaction with job
security
Satisfaction with promotion
opportunity
Satisfaction with training
Satisfaction with fringe benefit
(1) (2) (3) (4) (5) (6) (7) (8) (9) (10) (11) (12) (13)
Category 0 1 0 1 0 1 0 1 0 1 0 1
Male -0.075 -0.417 0.148 -0.488 0.894* -1.012* 0.002 -0.736* 1.190** -0.312 -0.094 0.122 0.618
(0.276) (0.431) (0.362) (0.346) (0.517) (0.542) (0.340) (0.421) (0.604) (0.420) (0.427) (0.377) (0.535)
Age -0.021 -0.033 -0.012 -0.012 0.031 -0.074* 0.018 -0.012 0.079** -0.04 0.024
-0.080**
0.021
(0.030) (0.035) (0.034) (0.031) (0.041) (0.039) (0.027) (0.037) (0.038) (0.037) (0.038) (0.034) (0.044)
Ethnic (Kinh=1) -0.94 1.062 -1.558** -0.88 16.569*** -0.439 -1.256*
-15.169***
-0.827 13.374*** -
14.563*** -0.344 -0.936
(0.943) (0.708) (0.610) (1.075) (0.501) (0.988) (0.734) (0.833) (0.994) (1.294) (1.331) (0.865) (0.735)
Higher Education -0.088 0.144 -0.397 -0.853** -0.449 -0.135 -0.570* -0.558 -0.14 -0.261 -0.486 -0.468 -0.029
(0.261) (0.383) (0.365) (0.344) (0.426) (0.410) (0.334) (0.426) (0.523) (0.412) (0.479) (0.365) (0.483)
Married 0.087 -0.404 0.446 -0.731 18.755***
-14.634***
0.901 0.455 16.368*** -0.285 0.467 0.122 18.144***
(0.570) (0.781) (0.971) (0.765) (1.496) (0.495) (0.766) (0.720) (1.241) (0.771) (0.946) (0.736) (1.557)
Number of children -0.059 -0.064 -0.035 -0.119 -0.615** 0.34 -0.265 -0.325 -0.413 0.015 -0.054 -0.157 -0.199
(0.194) (0.271) (0.241) (0.256) (0.302) (0.261) (0.209) (0.315) (0.309) (0.316) (0.305) (0.287) (0.296)
Union (member=1) -0.615 0.631
-1.511***
0.178 -0.501 -0.134 -0.607 0.064 -0.767 0.707 -0.632 -0.293 -1.359**
(0.454) (0.521) (0.496) (0.398) (0.539) (0.525) (0.392) (0.488) (0.601) (0.569) (0.557) (0.437) (0.614)
Manager 0.323 0.218 0.372 -0.011 0.316 -0.249 0.077 0.143 0.201 0.252 0.639 1.124* 0.979*
(0.340) (0.589) (0.401) (0.507) (0.605) (0.623) (0.399) (0.682) (0.598) (0.671) (0.523) (0.679) (0.559)
Tenure 0.217*** 0.213** 0.242** 0.157* 0.134 0.109 0.079 0.166* 0.1 0.203* 0.095 0.240** 0.084
(0.072) (0.107) (0.098) (0.080) (0.131) (0.116) (0.074) (0.098) (0.139) (0.105) (0.096) (0.107) (0.117)
Tenure squared -0.006***
-0.007**
-0.007** -0.006** -0.006 -0.002 -0.002 -0.006* -0.004 -0.007** -0.003 -
0.007** -0.002
31
(0.002) (0.003) (0.003) (0.003) (0.005) (0.004) (0.002) (0.003) (0.005) (0.003) (0.003) (0.003) (0.003)
Wage income (mil. VND) 0.292** 0.449 0.286** 1.071*** 0.533*** 0.468 0.311** 1.305*** 0.277* 0.973** 0.057 1.109** 0.13
(0.117) (0.276) (0.135) (0.349) (0.199) (0.332) (0.135) (0.441) (0.167) (0.380) (0.087) (0.485) (0.102)
Relative income compared 0.464 0.508 0.46 0.61 0.747 0.523 -0.014 -0.093 0.384 0.427 -0.234 0.518 0.347
to others in firms (0.360) (0.548) (0.410) (0.451) (0.478) (0.466) (0.351) (0.500) (0.473) (0.562) (0.496) (0.487) (0.573)
Relative income compared 0.234 0.113 0.286 0.791 -1.06 1.095 0.382 -0.316 -0.718 -0.927 0.402 0.462 -0.083
to others in the same sector
(0.358) (0.591) (0.471) (0.560) (0.718) (0.725) (0.458) (0.645) (0.740) (0.775) (0.607) (0.597) (0.609)
Efficiency wage policy -0.171 -0.084 -0.163 0.264 -0.428 -0.105 0.105 -0.361 -0.234 0.164 -0.333 -0.352 -1.254**
(0.317) (0.488) (0.405) (0.388) (0.410) (0.515) (0.351) (0.454) (0.532) (0.499) (0.447) (0.451) (0.513)
Cost of training 0.515*** 0.619* 0.422*** 0.784* 0.816*** 2.526 0.651*** 0.247 0.736*** 0.389** 0.392*** 0.122 0.843***
(% of revenue) (0.147) (0.347) (0.137) (0.409) (0.182) (2.106) (0.132) (0.203) (0.127) (0.159) (0.132) (0.189) (0.179)
Cut 1 -2.039
(1.387)
Cut 2 1.326
(1.366)
Constant 0.002 -1.034 0.614
-39.377***
17.764*** -1.454 15.230*** -
20.784*** -
13.065*** 12.335*** 1.671
-19.868***
(1.308) (1.428) (1.361) (2.209) (1.382) (1.257) (1.253) (1.977) (1.618) (2.281) (1.371) (2.161)
Observations 277 277 277 267 267 274 274 190 190 196 196 218 218
Brand test of parallell line assumption
Reject
Robust standard errorrs in parentheses *** p < 0.01, ** p < 0.05, * p < 0.1