
Modeling the Boise Reservoir System with Climate Change Leslie Stillwater, Pacific NW Region.
25
Modeling the Boise Reservoir System with Climate Change Leslie Stillwater, Pacific NW Region
-
date post
21-Dec-2015 -
Category
Documents
-
view
214 -
download
0
Transcript of Modeling the Boise Reservoir System with Climate Change Leslie Stillwater, Pacific NW Region.
Modeling the Boise Reservoir System
with Climate Change
Leslie Stillwater, Pacific NW Region

Picture Source: CIG (2007)
Intergovernmental Panel on Climate Change Scenarios (Year 2040)

Approach• T and P Adjustments obtained from
Climate Impacts Group• T and P Adjustments applied to NWS Extended Streamflow
Prediction Model to produce daily local inflows (WY1949-1996)
• Each Climate Scenario was compared to the No Adjustment Scenario to produce daily local gain adjustments
• Daily local gain adjustments were aggregated into monthly gain adjustments for input to the Snake River revised BA monthly planning model (WY1949-1996)
• Daily gain adjustments were applied to the Daily Boise Operations Model (WY1949-1996)

Average Unregulated Daily Flows at Lucky Peak Damfor Scenarios with
Temperature Adjustments Only
0
1,000
2,000
3,000
4,000
5,000
6,000
7,000
8,000
9,000
10,000
1-O
ct
1-N
ov
1-D
ec
1-Ja
n
1-F
eb
1-M
ar
1-A
pr
1-M
ay
1-Ju
n
1-Ju
l
1-A
ug
1-S
ep
cfs
No Adjustment
echam T
giss T
ipsl T

Average Unregulated Daily Flows at Lucky Peak Damfor Scenarios with
Temperature and Precipitation Adjustments
0
1,000
2,000
3,000
4,000
5,000
6,000
7,000
8,000
9,000
10,000
1-O
ct
1-N
ov
1-D
ec
1-Ja
n
1-F
eb
1-M
ar
1-A
pr
1-M
ay
1-Ju
n
1-Ju
l
1-A
ug
1-S
ep
cfs
No Adjustment
echam TP
giss TP
ipsl TP
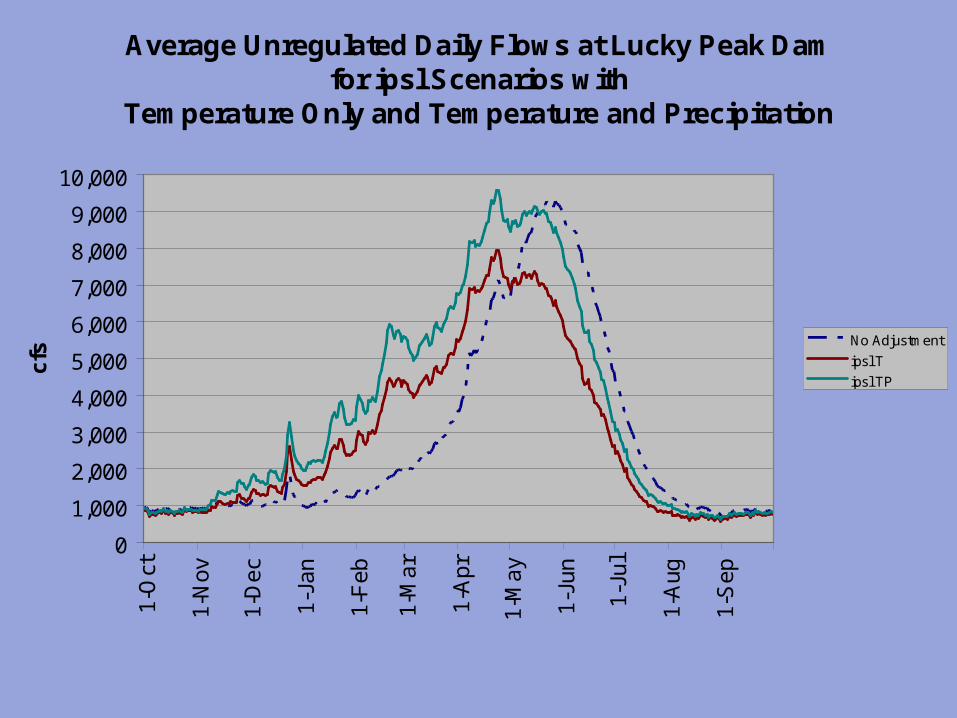
Average Unregulated Daily Flows at Lucky Peak Damfor ipsl Scenarios with
Temperature Only and Temperature and Precipitation
0
1,000
2,000
3,000
4,000
5,000
6,000
7,000
8,000
9,000
10,000
1-O
ct
1-N
ov
1-D
ec
1-Ja
n
1-F
eb
1-M
ar
1-A
pr
1-M
ay
1-Ju
n
1-Ju
l
1-A
ug
1-S
ep
cfs No Adjustment
ipsl T
ipsl TP
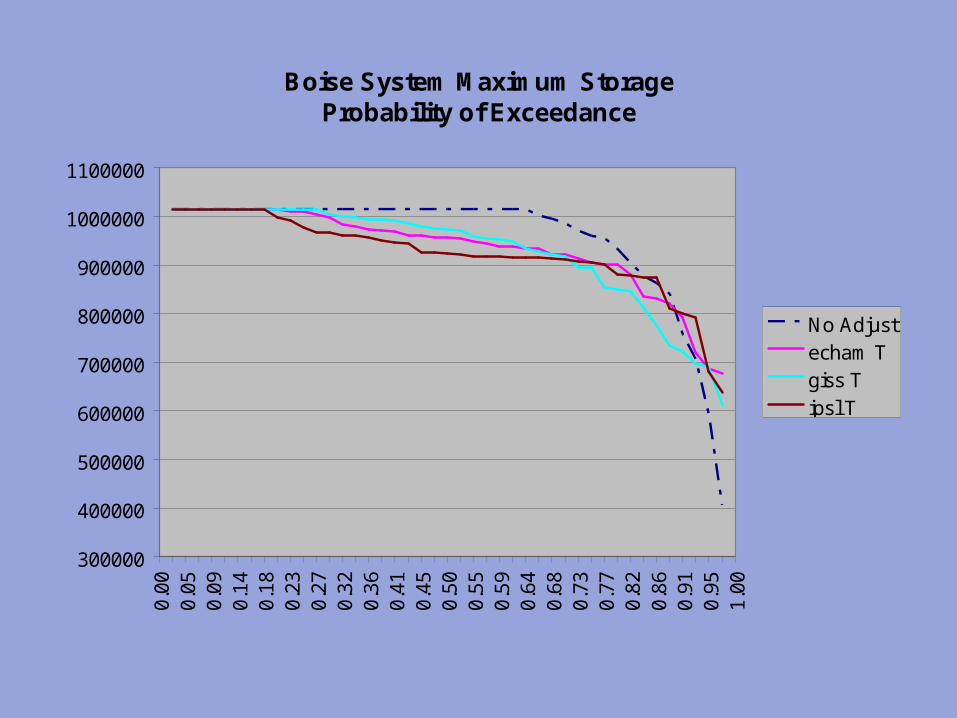
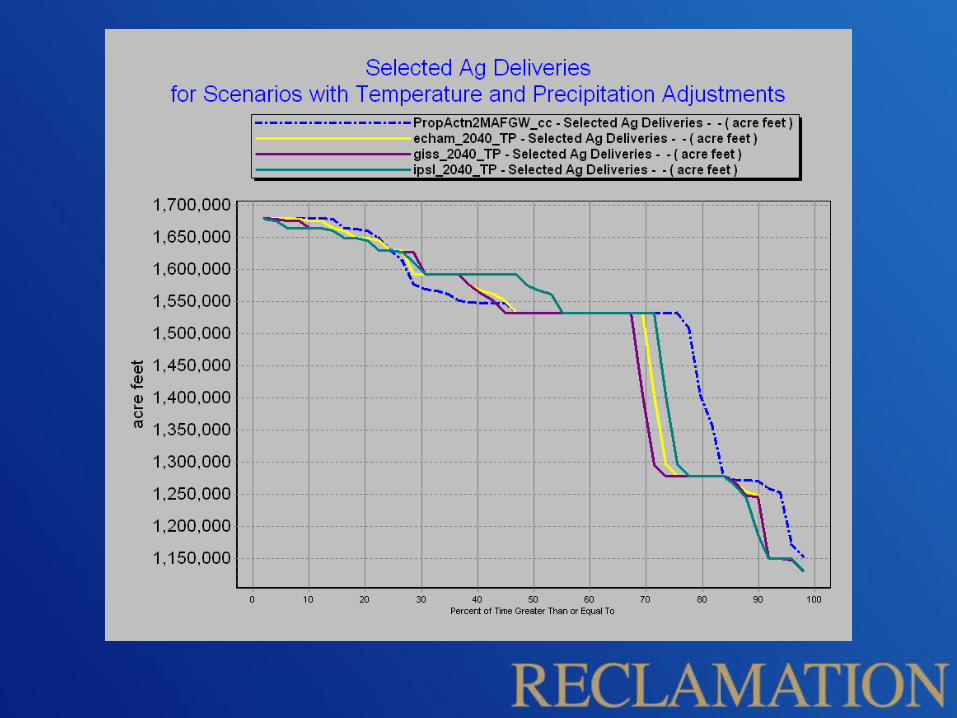
Boise System Maximum StorageProbability of Exceedance
300000
400000
500000
600000
700000
800000
900000
1000000
11000000
.00
0.0
50
.09
0.1
40
.18
0.2
30
.27
0.3
20
.36
0.4
10
.45
0.5
00
.55
0.5
90
.64
0.6
80
.73
0.7
70
.82
0.8
60
.91
0.9
51
.00
No Adjustecham Tgiss Tipsl T
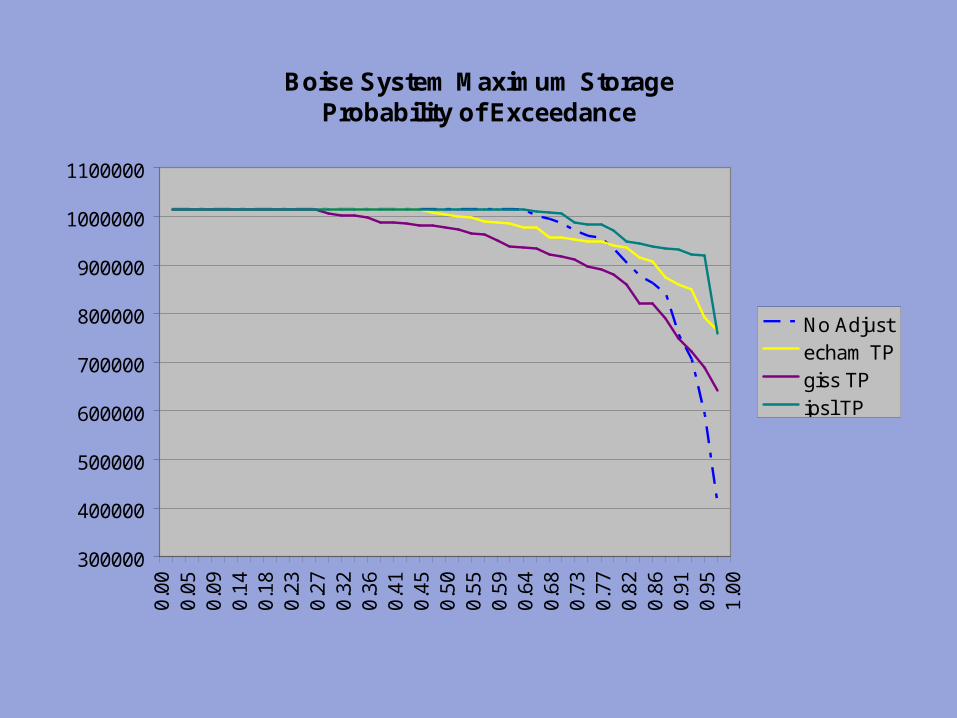
Boise System Maximum StorageProbability of Exceedance
300000
400000
500000
600000
700000
800000
900000
1000000
11000000
.00
0.0
50
.09
0.1
40
.18
0.2
30
.27
0.3
20
.36
0.4
10
.45
0.5
00
.55
0.5
90
.64
0.6
80
.73
0.7
70
.82
0.8
60
.91
0.9
51
.00
No Adjustecham TPgiss TPipsl TP


Comments on the Monthly Planning Studies
• Assumptions drive the study results– A2 IPCC scenarios (aggressive emissions)– T and P results are scalable to PN Region and to the Boise
Basin– Present level diversions– Present level groundwater influences
• Your point of view influences how you interpret results
• We addressed uncertainties by employing results from a range of IPCC models

Monthly Planning Study Results
• Probability of Refill is not significantly impacted by the Climate Change scenarios studied
• Present level Deliveries are not significantly impacted by the Climate Change scenarios studied

Daily Operations Studies
• COE Water Control Manual is followed
• Each hydrology year (WY1949-1996) starts with
Nov 2001 reservoir contents
• Starting on Jan 1, perfect forecast (Apr – July) ->
Apr 1 space requirements (rule curves)
• Starting on Jan 1, perfect forecast (Jan – Apr) -> release to get to Apr 1 space requirements
• After Apr 1, go to the rule curves every 2 weeks with perfect forecasts
• Measure of success is discharge < 7,200 cfs at Glenwood Bridge

No Adjustment
1970/1971
Apr 1 Space (AF)
required = 950,150
achieved = 885,780

Echam T
1970/1971
Apr 1 Space (AF)
required = 664,530
achieved = 663,780

Giss T
1970/1971
Apr 1 Space (AF)
required = 822,790
achieved = 820,390
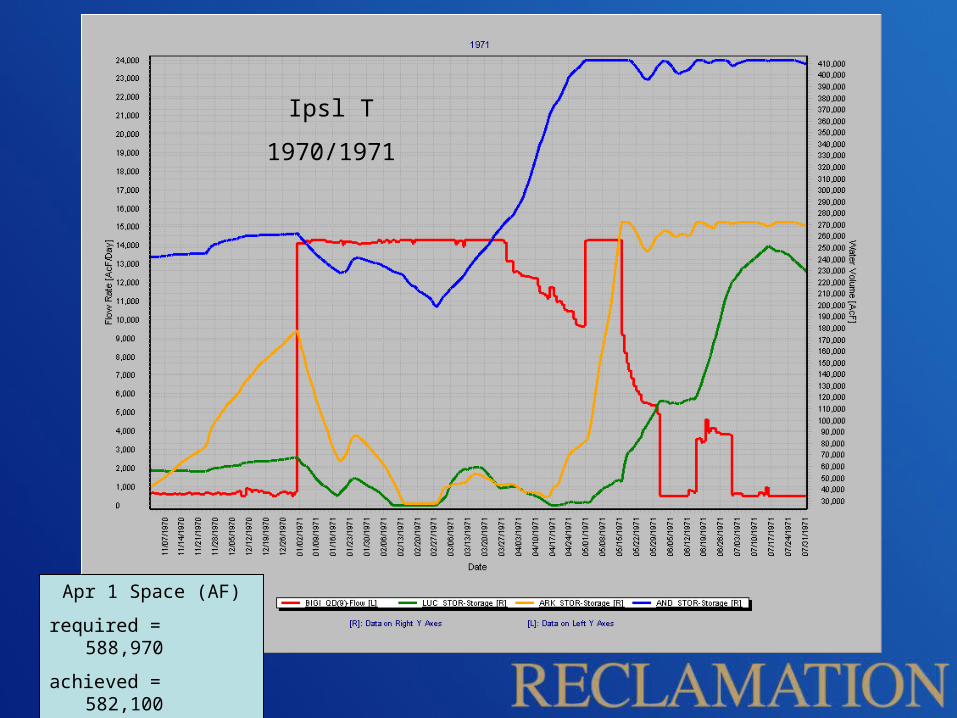
Ipsl T
1970/1971
Apr 1 Space (AF)
required = 588,970
achieved = 582,100

Echam TP
1970/1971
Apr 1 Space (AF)
required = 784,410
achieved = 613,210

Giss TP
1970/1971
Apr 1 Space (AF)
required = 834,650
achieved = 831,930

Ipsl TP
1970/1971
Apr 1 Space (AF)
required = 852,310
achieved = 244,280

No Adjustment
1970/1971
Apr 1 Space (AF)
required = 950,150
achieved = 885,780
Comments on the Daily Operations Studies
• Assumptions drive the study results– A2 IPCC scenarios (aggressive emissions)– T and P results are scalable to PN Region and to the Boise
Basin– Historic groundwater influences not removed – Starting storage conditions of Nov 2001 (historic median)– Perfect forecasts
• We addressed uncertainties by employing results from a range of IPCC models
Daily Operations Study Results
• Reliable forecasts will be even more critical• Early forecasts (prior to Jan 1) will be required• Drawdown needs to start before Jan 1• Space requirements need to start earlier than Apr 1• Maintaining 55% space in Lucky Peak and Arrowrock
may not be possible• Glenwood Bridge discharge Jan – Apr will be higher• Glenwood Bridge discharge > 7,200 cfs can be
anticipated if the wettest scenario is realized