Modeling sequence dependence of microarray probe signals Li Zhang Department of Biostatistics and...
22
Modeling sequence dependence of microarray probe signals Li Zhang Department of Biostatistics and Applied Mathematics MD Anderson Cancer Center
-
Upload
jarvis-olney -
Category
Documents
-
view
216 -
download
0
Transcript of Modeling sequence dependence of microarray probe signals Li Zhang Department of Biostatistics and...

Modeling sequence dependence of microarray probe signals
Li Zhang
Department of Biostatistics and Applied Mathematics
MD Anderson Cancer Center

Wide use of short oligonucleotide microarrays
• Gene expression assay
• Genotyping (SNP detection)
• Comparative genome hybridization
• DNA methylation detection
• Gene structure discovery
• Genome reseqeuncing

Protocol of a microarray experiment

Affymetrix GeneChip® Probe Arrays
24µm
Each probe cell or feature containsmillions of copies of a specificoligonucleotide probe
Image of Hybridized Probe Array
Over 250,000 different probes complementary to geneticinformation of interest
Single stranded, fluorescentlylabeled DNA target
Oligonucleotide probe
**
**
*
1.28cm
GeneChip Probe Array
Hybridized Probe Cell
*

Double helix on microarrays
The probe is a 25-mer DNA oligo:
ATCAGCATACGAGAGAATGATGGAT|||||||||||||||||||||||||
AAUAGUCGUAUGCUCUCUUACUACCUAGC
cRNA fragment from solution
ATCAGCATACGACAGAATGATGGAT
Average distance between probes is 80Å

Technical factors affecting gene expression measurements
• Interaction between base pairs (stacking)
• Interaction with microarray surface
• Interaction with unintended targets (cross hybridization)
• Kinetic process (equilibration & washing)
• Physical properties of RNA sample Degradation (missing 5’ ends)
Alternative splicing (missing exons)Secondary structure (RNA hairpins & loops)Biotinylation
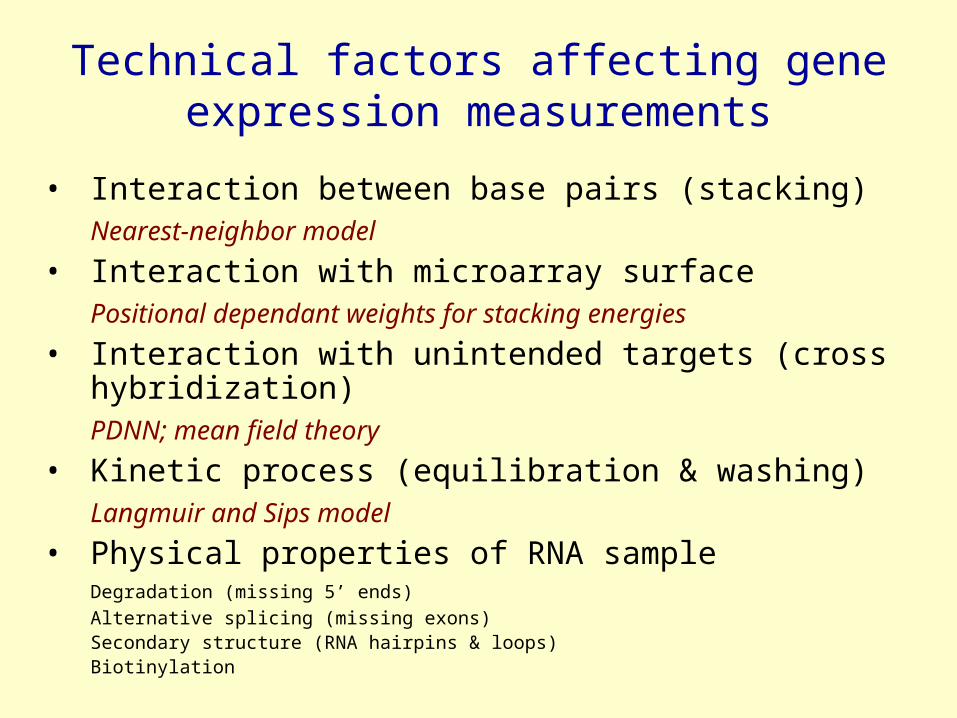
Technical factors affecting gene expression measurements
• Interaction between base pairs (stacking)Nearest-neighbor model
• Interaction with microarray surfacePositional dependant weights for stacking energies
• Interaction with unintended targets (cross hybridization)PDNN; mean field theory
• Kinetic process (equilibration & washing)Langmuir and Sips model
• Physical properties of RNA sample Degradation (missing 5’ ends)
Alternative splicing (missing exons)Secondary structure (RNA hairpins & loops)Biotinylation
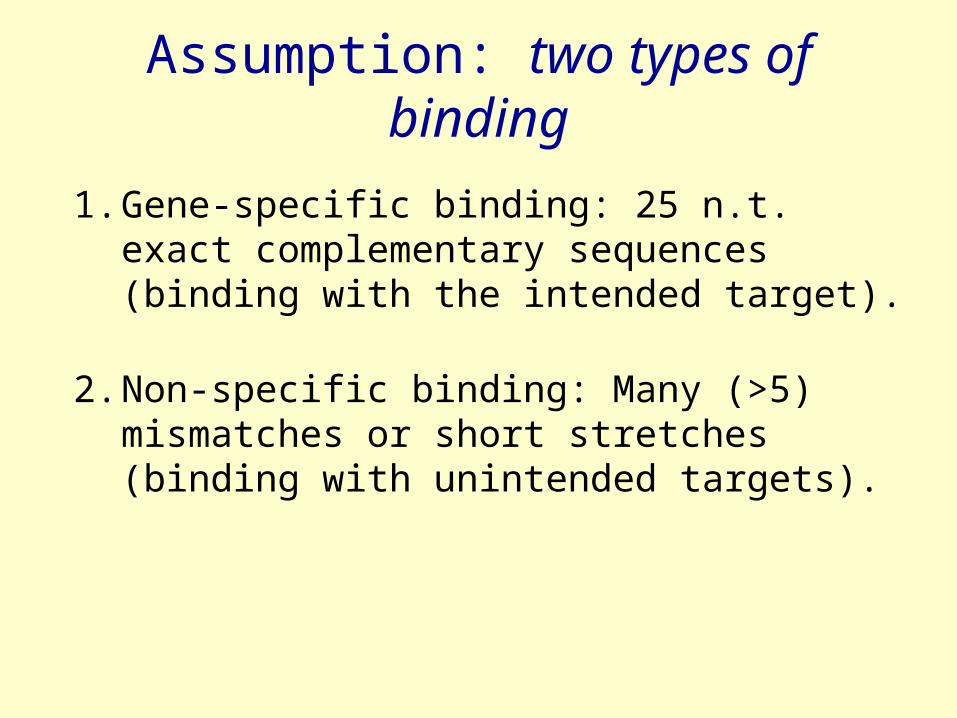
Assumption: two types of binding
1. Gene-specific binding: 25 n.t. exact complementary sequences (binding with the intended target).
2. Non-specific binding: Many (>5) mismatches or short stretches (binding with unintended targets).

Gene-specific binding energy:
Non-specific binding energy:
Weighted sum base-pair stacking energies:
Positional Dependant Nearest-Neighbor (PDNN) model of molecular interactions
),( 1 iiibb
),(*** 1 iii bb
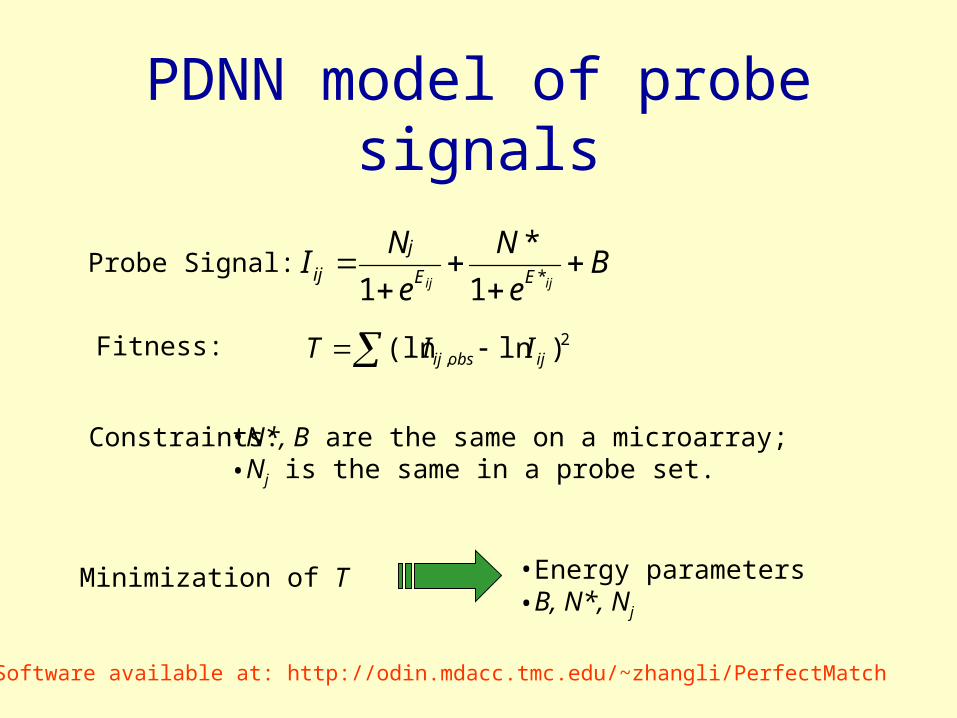
PDNN model of probe signals
2, )ln(ln ijobsij IIT
Be
N
e
NI
ijij EE
j
ij
*1
*
1
Minimization of T •Energy parameters•B, N*, Nj
•N*, B are the same on a microarray; •Nj is the same in a probe set.
Probe Signal:
Fitness:
Constraints:
Software available at: http://odin.mdacc.tmc.edu/~zhangli/PerfectMatch
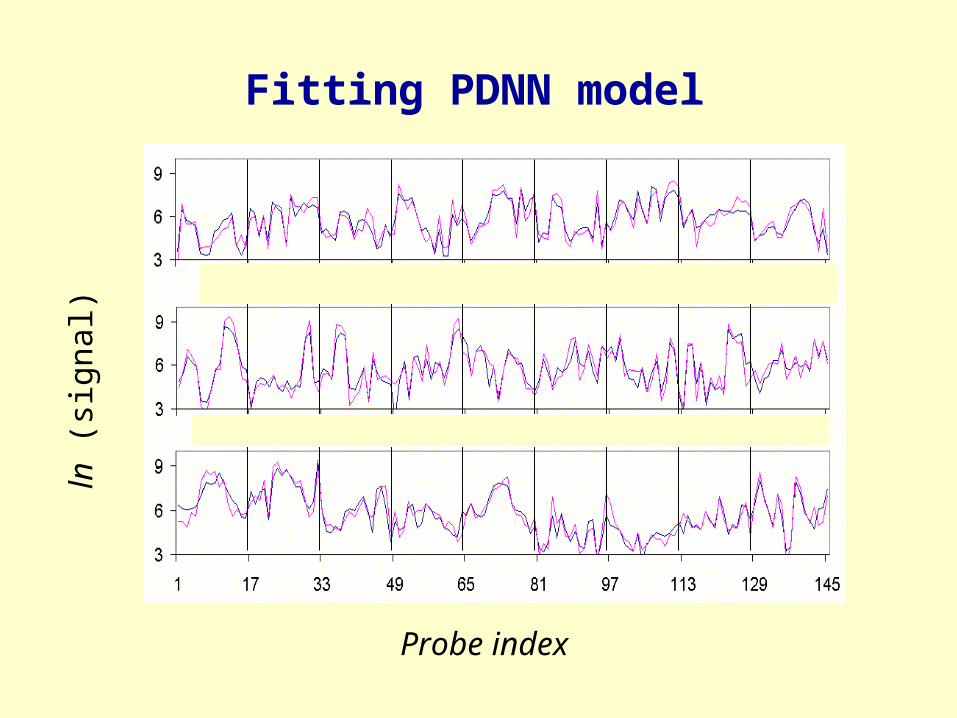
Fitting PDNN modelln
(si
gnal
)
Probe index

Energy parameters in PDNN model
Weight factors Stacking energy terms
-0.8
-0.4
0.0
0.4
0.8
1.2
aa ac ag at ca cc cg ct ga gc gg gt ta tc tg tt
Dinucleotide
Sta
ckin
g e
ner
gy
GenomeTiling
Expr_U133A
SNP_50k
-0.2
0.2
0.6
1.0
1.4
1.8
1 3 5 7 9 11 13 15 17 19 21 23
Dinucleotide position on probe
Wei
gh
t
GenomeTiling
Expr_U133A
SNP_50k

Baseline of non-specific binding
Non-specific binding energy

Effects of Mismatches
•A Mismatch disrupts the double helix formation.•Energetically, it is unfavorable for binding.•It depends on the context of DNA sequences.
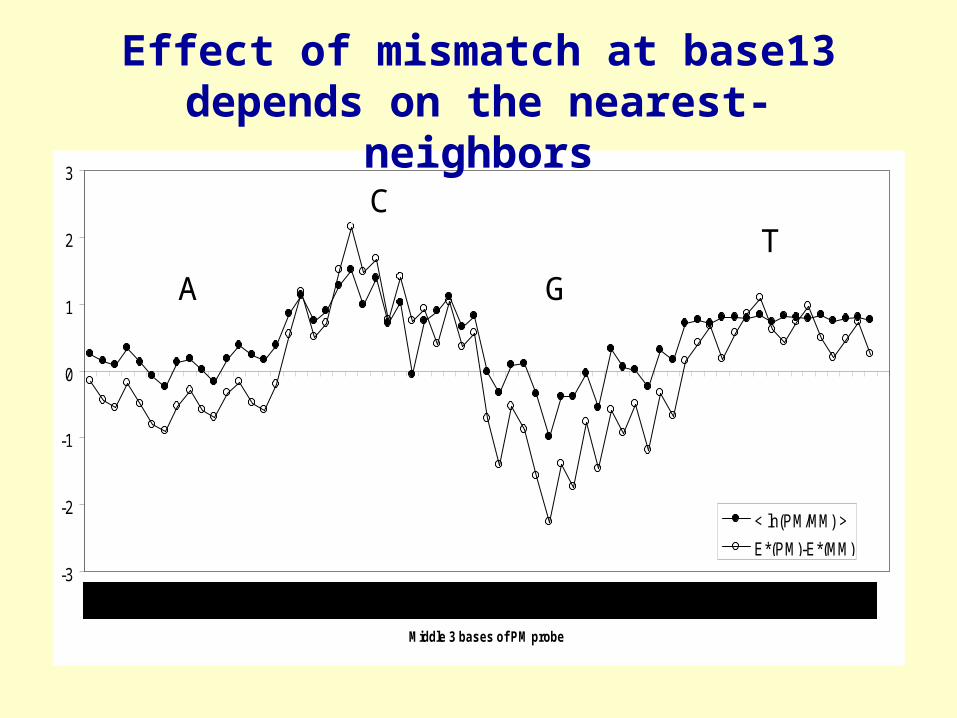
-3
-2
-1
0
1
2
3
Middle 3 bases of PM probe
< ln(PM/MM) >
E*(PM)-E*(MM)
A
C
G
T
Effect of mismatch at base13 depends on the nearest-neighbors
AA
C
G
T

Sequence dependence of free energy cost of single mismatch in DNA duplexes
R2 = 0.35
1
2
3
4
5
6
0.5 1 1.5 2
microarray mismatch G
So
luti
on
mis
mat
ch
G

Pattern of cross hybridization: MM and PM probes bind to different molecules
Var(ln PM)
Var
(ln
MM
)
Data source: Affymetrix HG-U133 spike-in data set. Large variation indicates resonse to spike-ins. Number of arrays: 42. Number of probes on an array: ~ 0.5 million.

Microarray surface effects
• DNA and RNA are negatively charged.
• Glass surface also charged
• Repulsion

Pattern of cross hybridization: bias towards the 5’ end
0
0.25
0.5
0 10 20
Nucleotide position on the probe
wei
gh
t
5’ end
Sense and antisense
• Upon binding, sense and antisense probes form the same double helix structure.
• The same interactions should lead to the same binding energy.
• The observed data contradict with this prediction.
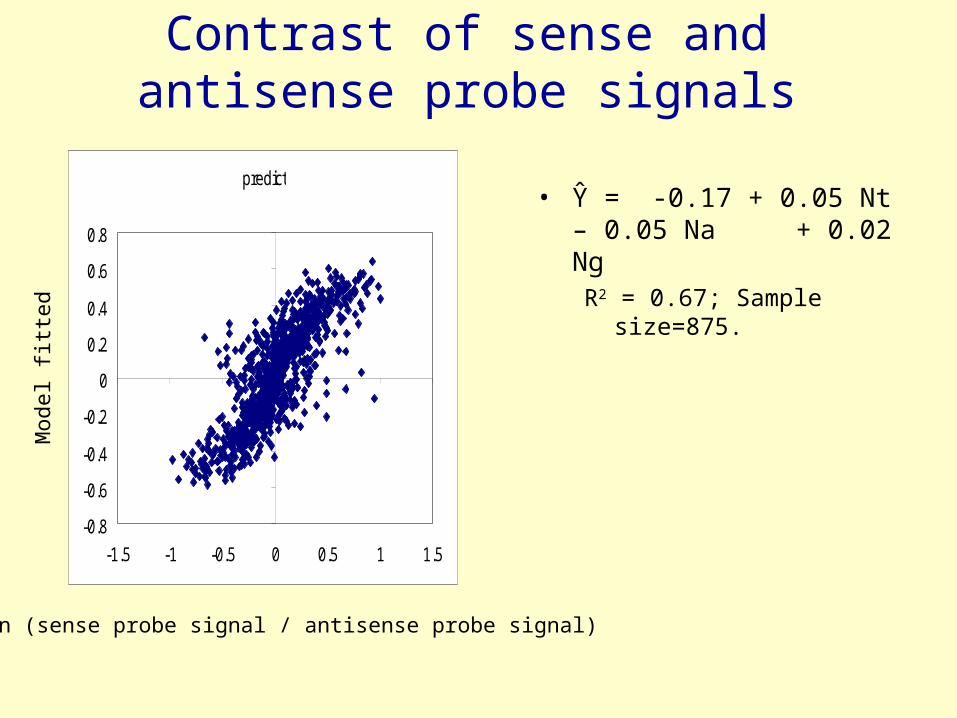
Contrast of sense and antisense probe signals
• Ŷ = -0.17 + 0.05 Nt – 0.05 Na + 0.02 NgR2 = 0.67; Sample size=875.
predict
-0.8
-0.6
-0.4
-0.2
0
0.2
0.4
0.6
0.8
-1.5 -1 -0.5 0 0.5 1 1.5
Ln (sense probe signal / antisense probe signal)
Mod
el fi
tted

Summary
•Binding on array surface: Probe binding free energy can be approximated by a weighted sum of base-pair stacking energies, with the probe ends having less contributions.
•Mismatches: Mismatches disrupt hybridization, especially in cross hybridization. The effects of mismatches depend on sequences. The surface also an effect.
•Surface effects: Cross hybridization is biased towards the 5’ end of the probes. Repulsion of surface depends on nucleotides.