Modeling planktonic dynamics in the Mississippi River ... · physical parameters specified ......
53
Modeling the response of primary production and sedimentation to variable nitrate loading in the Mississippi River plume Rebecca E. Green 1 Ocean Sciences Division, Naval Research Laboratory, Stennis Space Center, Mississippi 39529; Phone: 228-688-5576; Fax: 228-688-4149; Email: [email protected] Greg A. Breed Department of Biology, Dalhousie University, Halifax, Nova Scotia B3H 4J1, Canada; Email: [email protected] Michael J. Dagg Louisiana Universities Marine Consortium, Chauvin, Louisiana 70344; Phone: 985-851-2856; Fax: 985-851-2874; Email: [email protected] Steven E. Lohrenz Department of Marine Science, The University of Southern Mississippi, Stennis Space Center, Mississippi 39529; Phone: 228-688-3177; Fax: 228-688-1121; Email: [email protected] Left running head: R.E. Green et al. Right running head: Ecosystem model for the Mississippi River plume _______________________ 1 Corresponding author 1
Transcript of Modeling planktonic dynamics in the Mississippi River ... · physical parameters specified ......

Modeling the response of primary production and sedimentation to variable nitrate loading
in the Mississippi River plume
Rebecca E. Green1
Ocean Sciences Division, Naval Research Laboratory, Stennis Space Center, Mississippi 39529;
Phone: 228-688-5576; Fax: 228-688-4149; Email: [email protected]
Greg A. Breed
Department of Biology, Dalhousie University, Halifax, Nova Scotia B3H 4J1, Canada;
Email: [email protected]
Michael J. Dagg
Louisiana Universities Marine Consortium, Chauvin, Louisiana 70344; Phone: 985-851-2856;
Fax: 985-851-2874; Email: [email protected]
Steven E. Lohrenz
Department of Marine Science, The University of Southern Mississippi, Stennis Space Center,
Mississippi 39529; Phone: 228-688-3177; Fax: 228-688-1121; Email: [email protected]
Left running head: R.E. Green et al.
Right running head: Ecosystem model for the Mississippi River plume
_______________________
1 Corresponding author
1
Abstract
Increases in nitrate loading to the Mississippi River watershed during the last 50 years are
considered responsible for the increase in hypoxic zone size in Louisiana-Texas shelf bottom
waters. There is currently a national mandate to decrease the size of the hypoxic zone to 5,000
km2 by 2015, mostly by a 30% reduction in annual nitrogen discharge into the Gulf of Mexico.
We developed an ecosystem model for the Mississippi River plume to investigate the response of
organic matter production and sedimentation to variable nitrate loading. The nitrogen-based
model consisted of 9 compartments (nitrate, ammonium, labile dissolved organic nitrogen,
bacteria, small phytoplankton, diatoms, micro- and mesozooplankton, and detritus), and was
developed for the spring season, when sedimentation of organic matter from plume surface
waters is considered important in the development of shelf hypoxia. The model was forced by
physical parameters specified along the river-ocean salinity gradient, including residence time,
light attenuation by dissolved and particulate matter, mixed layer depth, and dilution. The model
was developed using measurements of biological biomasses and nutrient concentrations across
the salinity gradient, and model validation was performed with an independent dataset of primary
production measurements for different riverine NO3 loads. Based on simulations over the range
of observed springtime NO3 loads, small phytoplankton contributed on average 80% to primary
production for intermediate to high salinities (>15), and the main contributors to modeled
sedimentation at these salinities were diatom sinking, microzooplankton egestion, and small
phytoplankton mortality. We investigated the impact of limiting factors on the relationship
between NO3 loading and ecosystem rates. Model results showed that primary production was
primarily limited by physical dilution of NO3, followed by abiotic light attenuation, light
attenuation due to mixing, and diatom sinking. Sedimentation was mainly limited by the first
three of these factors. Neither zooplankton grazing or plume residence times acted as limiting
factors of ecosystem rates. Regarding nutrient reductions to the watershed, simulations showed
that about half of the percent decrease in NO3 load was reflected in decreased plume
sedimentation. For example, a 30% decrease in NO3 load resulted in a 19% decrease in average
plume primary production and a 16% decrease in sedimentation. Finally, our model results
indicated that the fraction of primary production exported from surface waters is highly variable
with salinity (7 - 87%), a finding which has important implications for predictive models of
hypoxic zone size that assume a constant value for this ratio.
2
Introduction
The Mississippi River delivers high concentrations of inorganic nutrients to coastal
waters of the northern Gulf of Mexico, currently the second largest zone of coastal hypoxia in
the world (Rabalais et al., 2002). Hypoxic bottom waters (dissolved oxygen concentrations < 2
mg L-1) are a concern primarily because of the lack of catchable demersal fish, shrimp, and crabs
in these waters (Leming and Stuntz, 1984). It is conventionally understood that a fraction of
production sinks from surface waters to below a pycnocline - a barrier for oxygen exchange with
the atmosphere - where it is consumed by aerobic bacteria leading to hypoxic conditions in
bottom waters. However, the linkage between nutrient delivery to surface waters and organic
matter sedimentation to bottom waters is complex due to the interplay of numerous physical and
biological factors controlling vertical flux. In the 1990's, several observational research
programs endeavored to better understand the oceanographic processes controlling organic
sedimentation and ecosystem variability on the Louisiana-Texas (LATEX) shelves. These
programs produced a suite of ecosystem data, and the first ecosystem-scale attempt to quantify
how primary productivity and sedimentation were linked. Factors regulating phytoplankton
biomass and primary production near the Mississippi River delta include riverine nutrient flux,
low irradiance in low salinity waters, nutrient limitation at high salinities, mixing and advection,
and grazing (e.g., Lohrenz et al., 1990, 1999; Dagg, 1995). The fraction of production exported
from the euphotic zone was observed to vary widely on the Louisiana Shelf, dependent in part on
phytoplankton species composition and on the grazing activities of microzooplankton and
mesozooplankton (Redalje et al., 1994).
Numerical models have been developed for predicting the areal extent of hypoxia
formation on the LATEX shelf, as a function of nutrient loading. Three models were used to
3

predict interannual variations in hypoxic zone size and resulted in suggestions for the regulation
of nutrient inputs to the Mississippi River, including a two-box, oxygen flux model (Justić et al.,
2002) and 3-dimensional (Bierman et al., 1994) and 1-dimensional mass balance models (Scavia
et al., 2003, 2004). Management plans for reducing the size of regional hypoxia involve
reducing nitrogen inputs to the Mississippi River watershed by a certain percentage. A task force
convened to recommend policy actions and forwarded to the U.S. Congress in 2002 the
suggestion that nitrogen inputs to the watershed be reduced by 30% (Rabalais et al., 2002).
Based on their model results, Scavia et al. (2004) proposed that this percentage be increased to
40% if the goal of decreasing the areal extent of the hypoxic zone by two-thirds is to be
achieved. Though these models roughly succeed at predicting hypoxic zone size based on
nutrient inputs, they provide little mechanistic understanding of the relationship between surface
water food web processes in the plume and how these processes change under variable riverine
nutrient loadings. For example, several of the models assume that a constant 50% of primary
production is exported vertically (Scavia et al., 2003; Justić et al., 1997; Rabalais et al., 1991).
This assumption has important implications, because the measured export ratio is known to vary
greatly both spatially and temporally on the Louisiana shelf due to changes in physical and
biological forcing (Redalje et al., 1994).
The development of food web models to describe organic matter cycling on the Louisiana
shelf is still in its’ infancy. Recently, an inverse food web model was developed and employed
for the Mississippi River plume to better understand ecosystem dynamics and organic carbon
flows between bacteria, small and large phytoplankton, protozoans, microzooplankton,
mesozooplankton, dissolved organic carbon (DOC), and detritus (Breed et al., 2004). This
model helped illuminate spatial and temporal variability in the relationship between primary
4
productivity and vertical export. It was also used to construct an organic carbon budget for the
Mississippi River turbidity plume and to calculate plume contributions to the development of
shelf hypoxia (Green et al., 2006). The inverse analysis technique used in the food web model is
only applicable to hindcasting, and hence there is a clear need for a predictive food web model
that can forecast ecosystem response to variable nitrate loading. Such a nitrogen-based model of
planktonic dynamics was originally presented by Fasham et al. (1990). Their nitrogen-
phytoplankton-zooplankton (NPZ) model was used to describe the annual cycle of planktonic
dynamics and nitrogen cycling in the oceanic mixed layer near Bermuda. Following
modification for more eutrophic waters, variations of their model have since been applied in
more coastal regimes (e.g., Huret et al., 2005). The NPZ model accounts for nutrient and light
limitation, computes flows between living (bacteria, phytoplankton, and zooplankton) and non-
living (detrital) compartments, and assigns detrital sinking rates for the computation of organic
matter sedimentation.
Our goal was to model the relationship between riverine NO3 loading and ecosystem
processes in surface waters of the Mississippi River plume (MRP). There is currently little
understanding of the relationship between NO3 loading and organic matter sedimentation from
the river plume, and our intention was to develop a predictive model to better quantify this
relationship. We developed a 9-compartment ecosystem model to simulate planktonic dynamics
and response to variable nitrate loading in the buoyant surface plume. The original Fasham et al.
(1990) NPZ model was modified to include more biological compartments (two groups each for
phytoplankton and zooplankton) and to describe processes along a salinity transect of the plume
during the spring season. Physical and biological components of the ecosystem model were
developed based on previous observational studies in the MRP. Our model was developed by
5

comparison of model results and measurements across the salinity gradient, and the model was
validated through comparison with independent measurements of primary production for
different nitrate loads. We then applied the model to answering our main question: How do
changes in riverine nitrate inputs affect food web structure and sedimentation of particulate
organic nitrogen (PON) from the surface plume? We also determined the primary factors
limiting the effect of riverine nitrogen loading on primary production, phytoplankton community
structure, and sedimentation.
Methods
We constructed a 9-compartment coupled differential equation model to simulate
biological and chemical dynamics in the Mississippi River plume. The model included a number
of simple physical dynamics which were constrained by field data (Fig. 1). Whereas time is
often an annual cycle in an NPZ model (Fasham et al., 1990), we defined time as transport
through the river plume from the river mouth to the high salinity plume edge; this is a zero-D,
lagrangian model in which time is equivalent to moving across the salinity gradient when the
plume is in steady state. Physical and biological processes were modeled to represent average
springtime conditions, a season during which primary production in LATEX shelf surface waters
is considered important to hypoxia development.
Physical Model
The ecosystem model was forced by a simple physical model which included plume
residence times and parameterizations of the abiotic in-water light field. Previous estimates of
6

plume residence times were made by Breed et al. (2004) based on flow velocities in the plume
determined from drifter data. They calculated residence times in three plume salinity subregions
of 1 day in subregion 1 (salinity 0-18), 1.5 days in subregion 2 (18-27), and 6 days in subregion 3
(27-32). We have adopted these values, in addition to assuming a residence time of 6 days for
the highest salinity subregion (32-36), equal to the residence time for subregion 3. We modeled
the relationship between transit time and salinity using these residence times and a sigmoidal
function (Fig. 2A). The resulting relationship between time and salinity was:
ta
ta
eaaeaa
asalinity /65
/32
1 7
4
−
−
×−×−
×= , (1)
where a1 to a7 are coefficients that were optimized to best fit estimated residence times, with
values of a1 = 1.178, a2 = 6.757x10⁻⁶, a3 = -9.49x10⁻⁶, a4 = 45.4, a5 = 1.3729200894, a6 = -
1.3729198727, and a7 = 2.084x10⁻⁷ (for each coefficient, these were the minimum number of
significant figures needed to reproduce the relationship). Measured transects of NO3 along the
plume have shown the importance of conservative mixing in controlling NO3 concentrations
(e.g., Lohrenz et al., 1999). Nitrate dilution in the model was calculated using two-endmember
mixing, with zero nitrate concentration at the high salinity endmember as:
36/1 saldil −= . (2)
The equation used in the model for dilution as a function of time is then calculated by
substituting equation 1 into equation 2. We assumed that diffusion of NO3 into surface waters
from below the mixed layer was negligible. We did not include dilution effects on either NH4 or
dissolved organic nitrogen (DON), because biological activity seems to play the predominant
role in controlling their concentrations in the plume (Pakulski et al., 2000).
7

Photosynthetically active radiation (PAR) in the water column was calculated from
incident solar radiation, mixed layer depths, and diffuse attenuation by optically-active
components in the water. Average daily incident solar radiation was calculated from the latitude
(28.9° N), time of year (May 1), daylength, cloud cover (5 oktas; J. Yuan, personal
communication), solar constant (1368 W m-2), and solar declination and zenith angle. Constant
factors were used for the ratio of PAR to total irradiance (0.43; Jerlov, 1976) and the
transmittance of light through the water surface (0.96; Gordon et al., 1988). Light is attenuated
in the water column by phytoplankton, colored dissolved organic matter (CDOM), and
suspended particulate matter (SPM). Attenuation due to phytoplankton is a dynamic term in the
biological model, based on the concentration of phytoplankton and a cell self-shading term
(Table 1). Our physical model included a parameterization of light attenuation by abiotic (non-
chlorophyllous) material, which contributes to high light attenuation in low salinity plume
waters. We used the model of Lohrenz et al. (1999) to calculate Kabiotic from springtime
measurements of SPM, as follows:
d
sabiotic
SPMkK
μ×
= , (3)
where ks is the specific extinction coefficient for SPM (0.03 m-1 (mg L-1)-1) and μd is the average
cosine of solar zenith angle over the daylight period (0.55). The impacts of CDOM are roughly
included in this parameterization, because CDOM has been shown to covary with SPM in the
plume (Lohrenz et al., 1999). The relationship between Kabiotic and salinity was modeled using a
2nd order polynomial which best fit the measured data (Kabiotic = 2.20x10⁻³ S2 – 1.58x10⁻¹ S +
3.03, where Kabiotic is in units of m-1 and S is salinity; Fig. 2B). Additionally, light limitation of
8

phytoplankton in the model was forced by mixed layer depths (MLDs) throughout the plume.
We estimated MLDs from springtime measurements (Lohrenz et al., 1999) as 2 m at low
salinities increasing to 5 m at intermediate to high salinities (Fig. 2C).
Biological Model
The biological model included the 5 living compartments of bacteria (B), small
phytoplankton (P1), large phytoplankton (diatoms; P2), microzooplankton (Z1), and
mesozooplankton (Z2), and the 4 non-living compartments of detrital nitrogen (DN), nitrate
(NO3), ammonium (NH4), and labile dissolved organic nitrogen (DON). The inter-
compartmental flows are shown schematically in Figure 1; flows in the biological model are in
units of μM-N m-3. The non-diatom phytoplanktonic group covers all non-siliceous forms
including cyanobacteria, flagellates, and dinoflagellates, although in the plume Synechococcus
are likely the dominant group (e.g., Wawrik and Paul, 2004). The detrital compartment consists
of fecal materials, dead phytoplankton, and dead zooplankton, and sinks at a set rate (νD = 5 m d-
1; Table 1); the sum of sinking detritus and sinking diatoms determines the modeled
sedimentation of organic matter to bottom waters. Biological concentrations are assumed to be
homogenous within the mixed layer, such that the physical mixing rate is fast compared to the
growth rates of organisms, and there is no diffusive mixing with waters below the mixed layer.
Large and small phytoplankton differed in their maximum growth rates and in their
ability to compete for NO3 and NH4, based on different Michaelis-Menten constants for nutrient
uptake. Phytoplankton growth rate (σ) was modeled as a function of both light and nutrient
limitation of cell growth, as represented by:
9

σ = μmax x min(J, Q), (4)
where J and Q are non-dimensional terms that determine light and nutrient limitation,
respectively. Small and large phytoplankton growth rates ( 1Pσ and 2Pσ ) were defined by J and
Q terms that were distinct for each phytoplankton group. The equation for J is the same as in
Fasham et al. (1990). The nutrient limitation factor as a function of NO3 and NH4 was
parameterized using an expanded Monod equation as follows:
,)1()1(
43
4
43
3
43
4
43
3
NHNONH
NHNONO K
NHKNO
K
NH
KNH
KNO
K
NOQ
++×+
++×= (5)
where, as with the light limitation term, Q is separately defined for both small and large
phytoplankton. The grazer compartments were differentiated by the type of potential prey, half-
saturation constants and maximum grazing rates, and grazer preferences dependent on the type of
prey item. The P1 phytoplankton class is quickly grazed by microzooplankton, whose grazing
rate nears that of the small phytoplankton growth rate. The P2 phytoplankton class are
consumed both by micro- and mesozooplankton (Z1 and Z2), and at a slower rate than Z1 feeds
on P1. In addition to phytoplankton, both Z1 and Z2 graze on detrital nitrogen, Z1 grazes on
bacteria, and Z2 grazes on Z1. Grazing rates were defined using a Michaelis-Menten type
equation as in Fasham et al. (1990), relating growth to prey concentration, a half saturation
constant for grazing, and food preferences.
10

Equations
A series of coupled differential equations described model flows, the basic structure of
which was provided by Fasham et al. (1990) with several modifications. Model flows were
modified to include two sizes each of phytoplankton and zooplankton (Table 2). Diatom sinking
was added as a loss term to large phytoplankton and a contributor to vertical export. As well, the
zooplankton equations were modified to accommodate advances in parameterization, specifically
applying a quadratic mortality term to increase model stability (e.g., Steele and Henderson, 1992;
Edwards and Yool, 2000). Bacterial growth rates on NH4 (4,NHBσ ) and labile DON ( DONB ,σ )
were defined as in Fasham et al. (1990), but a mortality term was added for bacteria (mB) which
contributed to DON (Anderson and Williams, 1998). The concentration of sedimenting particles
from the plume was quantified as the sum of sinking detritus and sinking diatoms. The models
were integrated with Matlab 7.1 using the ode45 function – a numerical variable time step
differential equation solver using a 5 order Runge-Kutta method.
B
th
Biological Model Parameters
When available, biological model parameters were determined from measurements in the
Mississippi River plume (Table 1). The initial slope of the photosynthesis-irradiance (P-E) curve
(α) for phytoplankton was estimated by converting measurements in units of mg C (mg Chl a)-1
(Ein m-2)-1 to modeled values in units of d-1 (W m-2)-1. For April 1988, Lohrenz et al. (1990)
reported mean α values in the three salinity subregions <20, 20-30, and >30 of 7.9, 11.6, and
16.6 mg C (mg Chl a)-1 (Ein m-2)-1. We calculated an average α across salinities of 0.15 d-1 (W
m-2)-1, assuming phytoplankton carbon biomass to chlorophyll weight ratios (C:Chl) of 20, 30,
11

and 50 in each salinity region (Breed et al., 2004), the Redfield ratio for C:N = 6.6 (Redfield et
al., 1963), and a PAR conversion factor of 1 W m-2 = 4.15 μEin m-2 s-1 (Morel, 1991). Several
model parameters were obtained from an April 2004 cruise in the plume (H. Liu and M. Dagg,
unpublished data), including maximum specific small and large phytoplankton growth rates
(3.12 and 3.36 d-1), and a maximum Z1 grazing rate on P1 (2.17 d-1). A maximum Z1 grazing
rate on P2 of 1.26 d-1 was measured by Liu and Dagg (2003) on a March 2002 plume cruise.
Initial values at zero salinity for certain compartments were chosen from springtime datasets as
follows. The initial NH4 concentration was set to 0.25 μM based on plume measurements
(Gardner et al., 1997). An initial labile DON concentration of 0.47 μM was determined from an
average spring concentration of total DON in the Mississippi River of 22.86 μM (USGS data),
assuming 2% lability (Benner and Opsahl, 2001). Unless otherwise noted, USGS data presented
in this paper are for the St. Francisville, LA site for 1988-2003. Detrital concentration at zero
salinity was calculated as 0.3 μM, as determined from mean Mississippi River particulate
nitrogen concentrations (14.7 μM; Duan and Bianchi, 2006) and a rough estimate of 2% lability,
as for DON. Certain biological parameters and initial values were determined based on the fit
between model results and a dataset of measurements collected during springtime.
Parameter values were obtained from the literature when measurements were not
available (Table 1). Half-saturation constants for phytoplankton NO3 and NH4 uptake were
chosen from Walsh et al.’s (2001) modeling study of the West Florida Shelf. This choice
assumed that our large and small phytoplankton groups were represented by large diatoms (KNO3
= 1.7; KNH3 = 2.0) and Synechococcus (KNO3 = 0.2; KNH3 = 0.1), respectively. Other parameter
choices are summarized in Table 1, and were chosen from Huret et al.’s (2005) ecological model
for the Río de la Plata plume, Kelly-Gerreyn et al.’s (2004) model for the Irish Channel, and
12

Anderson and William’s (1998) model for the English Channel. Although we attempted to
choose parameters from models for continental shelf regions, certain parameters in these models
are still often obtained from Fasham et al. (1990) and we did the same (Table 1). Preferences for
mesozooplankton feeding on diatoms, microzooplankton, and detritus (0.7, 0.2, and 0.1) were
chosen from Chai et al. (2002). We adopted the same preferences for microzooplankton feeding
on small phytoplankton, bacteria, and detritus.
Model Development and Application
The model was developed through an iterative process by comparison of model results
with plume measurements compiled from numerous springtime cruises. We refer to this
measured data as the “Optimization Dataset”, since it was used to help develop the model and,
hence, was not independent from model results. The model was initially developed for an
average riverine NO3 loading of 112 μM, the long-term mean (USGS data). This is a scenario
for which several data sets of plume measurements exist and against which model results were
verified. Springtime measurements of chlorophyll a and NO3 along a salinity transect were
obtained from an April 1988 cruise for which riverine NO3 was 107 μM (Lohrenz et al., 1999).
Chlorophyll a was converted to phytoplankton biomass by assuming the same Chl:C ratios as
described above. Plume bacterial concentrations were available from 3 cruises: May 1992
(Amon and Benner, 1998), April 2000 (Liu et al., 2004), and April 2004 (current study; methods
as in Porter and Feig, 1980) for which riverine NO3 concentrations were 214, 76 and 150 μM,
respectively. Bacterial concentration was relatively insensitive to riverine NO3 inputs, as
indicated by maxima at mid-salinities in all 3 datasets which were not significantly different (1.5
± 0.2 μM-N). Hence, all three datasets were used in our comparison with the 112 μM riverine
13

NO3 model output. Bacterial cell numbers were converted to nitrogen biomass using conversion
factors of 20 fg C cell-1 and a C:N weight ratio of 5 (Lee and Fuhrman, 1987). Measurements of
micro- and mesozooplankton biomass were obtained from cruises in May 1993 (Strom and
Strom, 1996), March 2002 (Liu and Dagg, 2003), and April 2004 (H. Liu, unpublished data; M.
Sutor, unpublished data). The riverine NO3 concentrations for these cruises were 114, 120, and
150 μM, respectively. Zooplankton biomass was converted to nitrogen biomass assuming 40%
of dry weight as carbon and a C:N molar ratio of 6.625. Lastly, measurements of NH4 along a
salinity transect were obtained from a May 1992 cruise (Gardner et al., 1997) for which riverine
NO3 concentration was particularly high (214 μM). However, we felt that the careful
methodology by which these samples were measured was most important in our choice of the
dataset. Ammonium concentrations for this cruise were measured on board ship soon after
sampling so that regeneration would not cause a problem in assessing the amounts that are
actually in the water.
A partial validation of our model was performed through comparison of modeled and
measured primary production at various riverine NO3 loads. For comparison to measurements,
modeled values of primary production were converted to gC m-2 d-1 using the Redfield ratio. In
previous work, a relationship was demonstrated between measurements of primary production
and riverine NOx loading (Lohrenz et al., 1997), based on mean values of primary productivity
calculated for a region around the delta. Although these measurements were from several
seasons (spring – fall), we used them for comparison to model results, because there are
currently not enough primary productivity measurements from only the spring to develop such a
relationship with NO3 loading. For comparison to measurements, an average value of modeled
14

primary production was calculated across intermediate to high salinities (>15), the region in
which most measurements were made.
Our analysis of variable NO3 loading on ecosystem functioning involves certain
assumptions. First, it assumes changing nitrate concentrations under conditions of constant
riverine discharge and constant initial conditions for the other 8 nitrogen compartments. Second,
using a nitrogen-based model assumes that other nutrients are not limiting. Although nitrogen
often controls primary production in shelf waters near the Mississippi River delta, various studies
provide evidence for limitation by phosphorus and silicate as well (e.g., Lohrenz et al., 1999 and
references therein). More complicated multinutrient models would be useful for the plume, but
they require data to parameterize which are not available, more assumptions, and are more
difficult to interpret. While other nutrients may also be limiting in spring, our focus was to
explore a simple nitrogen-based model first, and to provide a framework for more complex
future models.
Our goal was to study the relationships between riverine NO3 loading, primary
production and sedimentation and to determine the main factors limiting these relationships. We
studied the effects of NO3 loading over a large range of riverine NO3 inputs (0 – 300 μM); the
observed springtime range is 64 – 213 μM (USGS data). At all NO3 inputs, we analyzed
changes in biomass, primary production, and sedimentation through the plume from zero salinity
to the high salinity endmember; examples of this analysis are presented. As well, based on these
modeled values, we calculated average values of biomass and rates of primary production and
sedimentation over intermediate to high salinities (> 15), because we are primarily interested in
plume contributions to organic matter cycling, rather than riverine. Average biomasses and rates
were calculated by gridding modeled values to an evenly-spaced salinity scale, followed by
15

averaging of these gridded values from salinity 15 to 36. We simulated the specific case of a
30% decrease in NO3 input to better understand the effects of the policy-mandated decrease in
nitrogen loading to the Mississippi River watershed. The primary physical and biological factors
regulating the relationship between NO3 loading and rates were analyzed, including light
limitation, nutrient limitation, residence time, diatom sinking, and grazing. Our approach was to
decrease the role of each potential limiting factor and to observe it’s effect on the resulting
relationships between NO3 loading and ecosystem functioning. Specifically, five scenarios were
modeled as follows: (1) dilution of NO3 concentration was removed, (2) light attenuation by
SPM and CDOM was removed by setting Kabiotic to that of water alone (0.046 m-1), (3) light
attenuation by mixing was reduced by setting mixed layer depths to 1 m throughout the plume
(4) residence time was increased by 50%, (5) diatom sinking was set to zero, and (6) all grazing
rates were set to zero.
A sensitivity analysis was performed to determine which model parameters most affected
modeled primary production and sedimentation. For 112 μM riverine NO3 input, the sensitivity
of both rates (in gN m-2 d-1) to small perturbations (± 10%) in biological and physical model
parameters (61 total) was assessed. An indicator of parameter sensitivity was calculated as s =
(Δr/r)/( Δp/p), where r is the rate of primary production (or sedimentation) at 112 μM riverine
NO3, Δr is the change in primary production (or sedimentation) associated with a parameter
change Δp, and p is the original parameter value. Values of |s| > 1 were considered to be
sensitive to changes in the parameter.
16
Results
Model Performance
The model was developed for a 112 μM riverine NO3 scenario through comparison with
plume measurements (the Optimization Dataset; Fig. 3). Certain biological parameters,
primarily for grazers, were determined based on which values gave an appropriate fit between
model results and measurements (Table 1). For example, the highest measured mesozooplankton
grazing rate on the March 2002 cruise was 0.156 d-1 (Liu and Dagg, 2003). However, this value
was not high enough to reproduce measured mesozooplankton biomasses and so we assumed a
higher maximum mesozooplankton grazing rate of 1.5 d-1 (Table 1). Similarly, we adopted a
higher microzooplankton mortality rate (0.3 (d mmol m-3)-1) than in previous studies (e.g., 0.05
(d mmol m-3)-1; Merico et al., 2004), and a slightly higher mortality rate for mesozooplankton
(0.1 (d mmol m-3)-1), compared to 0.05 (d mmol m-3)-1 in Fasham et al. (1990). The initial
concentrations of micro- and mesozooplankton at zero salinity were chosen to give appropriate
model results at higher salinities, because no measurements of zooplankton biomass at low
salinities are currently available. Initial concentrations of small and large phytoplankton (0.60
μM each) and bacteria (0.34 μM) were chosen slightly above measured values so that peak
biomass concentrations would be reached at intermediate, rather than high, salinities in the
plume.
Excretion rates of NH4 by bacteria, micro- and mesozooplankton were chosen based on
the model’s fit to plume measurements of NH4 regeneration rates, NH4 ambient concentrations,
and biomasses. Mesozooplankton NH4 excretion was set at 0.20 d-1, which is twice that of the
previously published value (0.1 d-1; Fasham et al., 1990). Significantly higher regeneration rates
17

were adopted for bacteria and microzooplankton equal to 0.50 d-1 and 1.2 d-1, respectively, based
on reports of high regeneration in the plume region (Gardner et al., 1997). Isotope dilution
experiments have shown that bacteria can contribute 7 to 50% of NH4 regeneration in the plume
in summer (Cotner and Gardner, 1993), such that grazers generally contribute more to
regeneration except at intermediate salinities. Bacterial regeneration measurements in the spring
plume showed that 20 to 50% of bacterial production can go to NH4 regeneration (Jochem et al.,
2004), so our 0.50 d-1 regeneration rate for bacteria is probably reasonable, given maximum
bacterial growth rates of 2 d-1 in the model.
Model results for biomasses and nutrients generally fit measured values from the
Optimization Dataset (112 μM riverine NO3 input; Fig. 3). In particular phytoplankton biomass
was within range of measurements up to mid-salinities, but were at the upper end of
measurements or above measured values at higher salinities (Fig. 3A). Modeled phytoplankton
growth rates ranged from 0 to 1.52 d-1 and peaked at mid-salinities, comparing well with
measured growth rates which ranged from –0.05 to 1.60 d-1 in March 2002 (Liu and Dagg, 2003)
and from –0.13 to 3.15 d-1 in April 2004 (Liu and Dagg, unpublished). Modeled bacteria
biomass was within range of measurements across all salinities (Fig. 3B). Modeled
concentrations for mesozooplankton were slightly above measurements for the mid- to high
salinities where they were available (Fig. 3C). Modeled microzooplankton biomass was within
range of measurements through intermediate salinities, but was higher than measurements at
high salinities (Fig. 3D). The precise location of the modeled microzooplankton peak relative to
measurements is not particularly important, since the salinity at which biomass peaks can vary
between cruises (even in the same season). At certain salinities, model results were at the
extreme limits of measured data. Modeled phytoplankton biomass was towards the high end of
18
measurements at higher salinities, causing NO3 values to be at the low end of measured values
due to phytoplankton uptake (Fig. 3E). Although NH4 measurements were sparse, modeled
concentrations of NH4 were similar to measured values where data were available, including
reproduction of a peak in concentration at intermediate salinities and a drop to undetectable
levels at high salinities (Fig. 3F).
We compared modeled and measured primary production for a range of riverine NO3
inputs. This comparison allowed for a partial validation of our model, showing good comparison
between modeled water-column integrated primary production and an independent dataset of
measurements (Fig. 4; Lohrenz et al., 1997). Modeled values suggested a decreasing change in
primary productivity with increasing NO3 loads, well fit by a 2nd order polynomial (Fig. 4; PP = -
3.80x10⁻⁵ [NO3]2 + 1.92x10⁻² [NO3] + 0.141, where [NO3] is in μM-N and PP is primary
productivity in gC m-2 d-1). This leveling off of modeled primary production at high NO3 inputs
was caused by the leveling off of phytoplankton growth rates. Measured data points consisted of
a single average value calculated for each cruise from a set of locations which varied between
cruises (Lohrenz et al., 1997). We included all available productivity measurements in our
analysis which encompassed data from spring through fall. There are currently not enough
spring measurements to know the exact relationship between primary production and NO3,
across a large range of riverine NO3 inputs for that particular season. Our modeled primary
productivities also resulted in small phytoplankton contributing from 77-80% of average
productivity (salinity > 15) for NO3 inputs of 10 to 250 μM. This contribution by small
phytoplankton is at the high end of measurements of productivity which showed they contributed
40-70% in March 1991 (Redalje et al., 1994). Although aspects of the model could be improved,
the relatively good fit between modeled and measured datasets gave us confidence in applying
19

our ecosystem model to studying the impact of variable riverine NO3 loading on primary
productivity and sedimentation in the plume.
Effects of Variable Nitrate Loading
The model was forced with variable riverine NO3 concentrations to analyze the effects on
ecosystem functioning. Decreased NO3 loading resulted in substantial reductions in
phytoplankton biomass, primary production, and sedimentation at salinities >20 (Fig. 5), where
nutrient limitation becomes more important than light limitation in determining phytoplankton
growth. Variable NO3 loading also affected the spatial location of biomass and primary
production maxima, shifting them towards lower salinities with decreasing NO3 concentrations;
this shift was less pronounced for sedimentation (Fig. 5). For an order of magnitude decrease in
NO3 loading (from 250 to 25 μM), average biomasses for small phytoplankton (for salinity > 15)
decreased by ~4 times, and all other biomasses decreased by ≤2 times. Substantial decreases
were also observed in rates with average primary production decreasing by 4 times and
sedimentation by 3 times. Changes in phytoplankton size structure with variable NO3 loading
were observed for biomass, primary production, and sedimentation (Fig. 5D-F). Small increases
in the contribution of large phytoplankton to average primary production and sedimentation were
observed at higher NO3 inputs. However, the observed impacts of NO3 loading on size structure
were dampened due to diatom sinking. Removal of diatom sinking from our model resulted in
more pronounced contributions by large phytoplankton to biomass, primary production, and
sedimentation at higher NO3 loads.
Depending on salinity, different biological processes are the primary contributors to
vertical export of labile PON from the plume mixed layer. For a riverine NO3 input of 112 μM,
20

total vertical export peaked at intermediate to high salinities due to high primary productivity and
grazing in the plume, followed by a secondary peak at zero salinity from riverborne PON (Fig.
6). Primary contributions to sedimentation were diatom sinking and microzooplankton egestion,
followed by small phytoplankton mortality. At low salinities, both diatom sinking and
microzooplankton egestion played a role in determining vertical export, with microzooplankton
removing riverborne particles from the mixed layer. At intermediate salinities, diatom sinking
was the main contributor to sedimentation from the plume. Following a peak in primary
production, microzooplankton egestion became the most important contributor to sedimentation
at higher salinities and small phytoplankton mortality was the second most important contributor.
Other biological processes played a more minor role in determining sedimentation, including
mesozooplankton egestion, mortality of diatoms, micro- and mesozooplankton, and detrital
breakdown to DON (Fig. 6).
Our primary goal was to model the relationship between riverine NO3 loading, primary
production and sedimentation, and to study the factors controlling this relationship. For the NO3
loadings that we analyzed (0 – 300 μM), both primary production and sedimentation continued
to increase throughout the entire range (Fig. 7A). However, primary production increased
significantly more than did sedimentation, resulting in a ratio of sedimentation to primary
production that ranged from 65% at a 1 μM NO3 input to 17% at a 300 μM NO3 input (Fig. 7B).
For the range of measured springtime NO3 loads (65 – 215 μM), changes in the ratio of
sedimentation to primary production were small (19 – 23%). Recall that these percentages are an
average over intermediate to high salinities (>15). Significant variability in the ratio was
observed with salinity. For example for a 112 μM NO3 load, the ratio ranged from 7 to 87% at
intermediate salinities, and was fairly constant (~53%) at higher salinities where nitrogen limited
21

phytoplankton growth (Fig. 7C). We also compared modeled ratios to May 1992 measurements
(Redalje et al., 1994), for the same NO3 input and salinity range as the measurements. The
modeled ratio of sedimentation to primary production averaged 34%, which was somewhat less
than the measured ratio in this region of 50%, but modeled values also varied widely in this
salinity range (8 – 67%). For the range of measured springtime NO3 loads, the following
equations well described relationships between NO3 load and average rates: PP = -5.34x10⁻⁶
[NO3]2 + 3.07x10⁻³ [NO3] + 3.30x10⁻² and Sed = 6.93x10⁻³ [NO3]0.455 , where PP and Sed are
primary production and sedimentation, respectively, in gN m-2 d-1 and [NO3] is in μM-N. With
relevance to nitrogen loading reductions to the Mississippi River watershed, a 30% decrease in
NO3 input to the plume (below 112 μM NO3 loading) decreased average primary production by
19% and average sedimentation by 14% (Fig. 7D). A 40% decrease in NO3 loading, as proposed
by Scavia et al. (2003), decreased modeled primary production and sedimentation by 28% and
20%, respectively.
We analyzed the importance of several limiting factors on determining the relationships
between NO3 loading and ecosystem rates. The original model was compared to model runs in
which the effects of various physical factors and grazing were altered, including the effects of
NO3 dilution, abiotic light attenuation, light attenuation by mixing, residence time, diatom
sinking, and grazing (see Methods for details). Dilution of NO3 via physical mixing of riverine
and oceanic endmembers had the greatest impact on limiting average phytoplankton biomass,
primary production, and sedimentation (Fig. 8A-C). Over the measured range of springtime NO3
loads, removal of NO3 dilution resulted in average increases in modeled biomass, production,
and sedimentation of 2.8, 2.1, and 1.6 times, respectively. The next most important factors
limiting primary production were abiotic light attenuation, light attenuation by mixing, and
22

diatom sinking. Only the first two of these factors limited sedimentation. For a 112 μM riverine
NO3 input, removal of NO3 dilution resulted in increased primary production and sedimentation
at higher salinities (>25), whereas decreased light limitation mainly resulted in increased rates at
lower salinities (<30) (Fig. 8D-F). Although removal of diatom sinking increased average
primary production (Fig. 8B), it had little effect on average values of sedimentation (Fig. 8C).
This was the result of no diatom sinking initially decreasing sedimentation at lower salinities, but
later resulting in higher sedimentation supported by higher rates of nutrient regeneration at a
salinity of ~30 (Fig. 8F).
Grazing and residence time had more minimal impacts on ecosystem rates, and did not
appear to be important limiting factors. The removal of grazing actually resulted in a slight
decrease in average primary production across salinities (Fig. 8B). Although phytoplankton
biomass increased at all salinities with grazing removed (Fig. 8A), phytoplankton growth rates
and primary production decreased at higher salinities compared to the original model (Fig. 8E).
The decrease in average primary production with grazing removed was due to nutrient limitation
of phytoplankton growth at higher salinities in the absence of NH4 regeneration by
microzooplankton. The increase in phytoplankton biomass at all salinities with grazing removed
(Fig. 8A) generally resulted in a slight increase in average sedimentation (Fig. 8C). Increased
residence times lead to a decrease in biomass, productivity, and sedimentation (Fig. 8A-C),
primarily caused by an increased amount of time spent at low to mid salinities where light
limitation of growth decreased phytoplankton growth rates and biomass, in comparison to the
original model.
23

Sensitivity Analysis
A sensitivity analysis was performed to determine the effect of small changes in each
model variable on modeled outputs. For a 112 μM NO3 load, the sensitivity factor, s, was
calculated to describe the effect on modeled rates of a ±10% change in a parameter (see
Methods). Rates were considered sensitive to a parameter for values of |s| > 1 anywhere along
the salinity gradient. A negative s value indicates that the change in rate has the opposite sign as
the parameter change. For example, a sensitivity of s = 2 shows that a 10% increase in the
parameter results in a 20% increase in the rate, and a sensitivity of s = -0.5 shows that a 10%
increase in the parameter results in a 5% decrease in the rate.
Primary production was generally more sensitive to perturbations in model parameters
than was sedimentation. Of the 61 physical and biological parameters in the model, primary
production was sensitive to 7 and sedimentation was sensitive to 4, with higher values of |s|
observed for primary production (Fig. 9). Highest sensitivities for both primary production and
sedimentation were observed at intermediate to high salinities. Both modeled rates were
sensitive to abiotic light attenuation (Kabiotic), microzooplankton excretion rate (regZ1), maximum
growth rate of large phytoplankton (μP2,max), and maximum grazing rate of microzooplankton on
P1, B, and D (gZ1a,max). In addition, primary production was sensitive to mixed layer depth
(MLD), maximum growth rate of small phytoplankton (μP1,max), and the assimilation efficiency
of microzooplankton grazing on small phytoplankton (βZ1 on P1). The sensitivity of primary
production to parameter changes varied with salinity, such that changes in Kabiotic resulted in the
highest sensitivity at low salinity, whereas perturbations in βZ1 on P1 were most important at high
salinity (maximum |s| = 3.8). The most sensitive parameter for sedimentation was μP2,max
(maximum |s| = 2.6); sensitivity to this parameter peaked at the same salinity as peak
24

contributions of diatom sinking to sedimentation (Fig. 6). The second most sensitive parameter
for sedimentation was gZ1a,max, and its’ peak sensitivity likewise coincided with the peak
contribution of microzooplankton egestion to sedimentation (Fig. 6). The highest sensitivities
for both primary production and sedimentation were to biological parameters (e.g.,
microzooplankton grazing and phytoplankton growth) rather than to physical parameters (e.g.,
MLD, Kabiotic, or residence time).
For the majority of model parameters, low sensitivity (|s| < 1) of modeled rates was
observed. For example, low sensitivity was observed for all initial concentrations,
mesozooplankton and bacterial growth parameters, and half-saturation constants for
phytoplankton nutrient uptake. Though neither diatom or detrital sinking speeds were sensitive
parameters, we wanted to analyze their impacts on sedimentation further because of the range of
values reported in the literature. When we adopted an alternative diatom sinking speed of 0.5 m
d-1 (e.g., Anderson and Williams, 1998) versus the 1 m d-1 in our model, then average
sedimentation at intermediate to high salinities (>15) increased by 8% compared to the original
model. We also adopted two alternative detrital sinking speeds of 1 m d-1 (e.g., Merico et al.,
2004) and 10 m d-1 (e.g., Anderson and Williams, 1998). For these two scenarios, average
sedimentation decreased by 48% and increased by 4%, respectively, such that significantly more
sensitivity was observed in decreases to the detrital sinking speed than to increases. Hence, large
decreases in detrital sinking speed from what we have assumed in the model, but within a
plausible range of literature values, can have significant effects on sedimentation. Ideally,
different detrital sinking speeds would be adopted depending on particle size and composition,
however significantly more data will be needed to constrain such parameterizations in ecosystem
models.
25

Discussion
Implications for Nitrate Loading Reduction
Ecosystem model results for the Mississippi River plume indicated that for a given
percent decrease in riverine NO3 loading, about half of that decrease could be expected in
average plume sedimentation of organic matter. For example, a 30% reduction in NO3 loading
lead to decreases in average primary production (for salinity > 15) of 19% and sedimentation of
14%, and for a 40% reduction in NO3 loading, primary production and sedimentation decreased
by 28% and 20%, respectively (Fig. 7D). The importance of this finding is to illustrate the
dampening effects that physical processes (e.g., light attenuation and dilution) and food web
interactions have on the conversion of riverborne nutrients to sedimenting organic matter in
Louisiana shelf waters. Similarly, other modeling studies have shown the effects of limiting
factors on the relationship between nutrient loading and organic matter production in coastal
ecosystems. For example, a biophysical model for the North Sea demonstrated that a 50%
reduction in nitrogen and phosphorus loads could result in decreases of 5-30% in primary
production depending on location (Skogen et al., 2004). A study of nutrient abatement in the
Baltic Sea, using a 3-D ecosystem model, showed that a reduction of riverine nitrogen and
phosphorus loading by 50% ultimately lead to a 10% decrease in chlorophyll concentration in the
Central Baltic (Neumann and Schernewski, 2005). As observed for the North Sea, natural
variability due to forcing fields other than nutrients (e.g., changing weather) can often exceed the
modeled changes in primary productivity that are expected following nutrient reduction (Skogen
et al., 2004). This is likely the case in the Mississippi River plume for the proposed 30%
reductions in NO3 loading to the watershed. Modeled changes in plume primary production (-
26

19%) are relatively small compared to natural variability in plume primary productivity
measurements, as seen in April 1988 when measurements often showed a 2-fold variation at any
given salinity (Lohrenz et al., 1990). Mixed layer depth and abiotic light attenuation are
examples of two forcing fields in the plume that show variability (Fig. 2B-C) and for which rates
were sensitive (Fig. 8) that could potentially mask the effects of 30% reductions in NO3 loading.
The fraction of organic matter production that sediments from plume surface waters is an
important quantity in relating nutrient loading to hypoxic zone size, however this ratio is highly
variable in river-dominated waters. For a 112 μM NO3 input, our model showed that the ratio of
sedimentation to primary production ranged widely (7 - 87%) at intermediate to high salinities in
springtime. Such a large range in ratios for the plume has previously been reported in both
modeling studies (Green et al., 2006) and measured data (Redalje et al., 1994), though at coarser
scales of salinity resolution. Our current model shows that this large range of ratios was
primarily caused by the lag between high rates of primary production in the plume and high rates
of sedimentation (Figs. 5, 7). Predictive models of the relationship between riverine NO3
loading and Louisiana-Texas shelf hypoxic zone size, often assume that a constant 50% of
primary production is exported below the pycnocline regardless of season or salinity (e.g.,
Rabalais et al., 1991; Scavia et al., 2003). Our results indicate that sensitivity analyses should be
performed with these predictive models of hypoxia size to better understand the effect of
variability in this ratio. Results from our current model suggest that the mean ratio of export to
primary production is ~14% at intermediate salinities where nitrogen is available to support
primary production and diatom sinking is the major contributor to sedimentation (Figs. 6-7).
However, this modeled ratio is higher and averages ~53% at higher salinities (>27) where
phytoplankton growth is nitrogen limited and contributions from microzooplankton egestion and
27

small phytoplankton mortality are most important to sedimentation (Fig. 6). Hence, at higher
salinities predictive models of hypoxia size may be right in assuming a ratio of 50%, but care
needs to be taken regarding which salinities are most pertinent in these models. For example, if
a broader range of salinities (>15) is most important to such modeling efforts, then our results
suggest that a lower ratio of ~20% is more representative of organic matter export from the
plume’s food web.
Factors Limiting Phytoplankton Growth and Sedimentation
One of our objectives was to better understand the primary controls on relationships
between NO3 loading and plume ecosystem functioning. While it is generally known that
phytoplankton growth is limited by light availability at low salinities and nutrient availability at
high salinities in the plume, the role of these processes in concert with biological factors, such as
grazing, has not been quantitatively studied. Based on our model results, physical attributes of
the plume were most important in shaping the response of changes in primary production and
sedimentation to variable NO3 loading. The primary limiting factor of average biomass, primary
production, and sedimentation was the physical dilution of NO3 (Fig. 8A-C). The effects of
dilution on ecosystem response to nutrient loading were also documented in a modeling study of
waters in the archipelago off Helsinki, where nutrient transport and dilution into a large area
contributed to negligible impacts on algal biomass of proposed reductions in nutrient loads
(Korpinen et al., 2004). In our plume model, secondary controlling factors of average primary
production were abiotic light attenuation, light attenuation due to mixing, and diatom sinking,
with only the first two of these factors playing a role in limiting sedimentation. The importance
of physical factors such as nutrient and light limitation in controlling phytoplankton growth in
28
the plume has previously been documented. Lohrenz et al. (1990) presented several lines of
evidence for nitrogen limitation of primary production at high salinities, including: (1) the
depletion of nitrogen at salinities less than the Gulf water end member, (2) maxima in
phytoplankton production and biomass occurring at salinities just below the range of nitrogen
depletion, and (3) approximate calculations of mixed layer integrated production which
suggested that biological consumption was comparable to riverine nitrogen inputs. In a
comparison of observed chlorophyll concentrations and those predicted using a steady-state light
limitation model, the authors also showed that light availability constrained levels of primary
production in some regions of the plume. In an analysis of springtime (March – May)
Mississippi river suspended sediment loads (USGS data, 1980-2005), we found evidence that
suspended sediment concentrations have decreased since 1980, which according to our model
should have increased plume primary production and been a contributing factor to increased
hypoxia size during that time.
In addition to nutrient and light limitation, we explored the importance of other factors in
controlling primary production and sedimentation in the plume. Lohrenz et al. (1990) found that
both light and nutrients were adequate to support growth beyond observed levels at intermediate
and low salinities, such that other factors were required to explain observed patterns of biomass
and production along the Mississippi River plume/oceanic gradient. The authors suggested that
these other factors might include limitation by trace elements (such as Fe) needed for
phytoplankton growth, higher phytoplankton mortality due to grazing, respiration, or sinking,
and the inhibition of growth due to metal toxicity or steep salinity gradients. The only additional
limiting factor of plume primary production that we were able to identify with our model was
that of diatom sinking. With diatom sinking removed, average primary production increased by
29
20 - 24% in the plume for the observed range of riverine NO3 loads (Fig. 8B), whereas the
effects on sedimentation were more minor, with increases of 0 - 9% (Fig. 8C). Zooplankton
grazing, as parameterized in our current model, did not have a limiting effect on primary
production or sedimentation, but rather acted to increase both rates. The primary reason for
decreased primary production with grazing removed from the model was due to the removal of
NH4 excretion by microzooplankton which otherwise supports small phytoplankton growth at
higher salinities (Fig. 8E). Regarding plume residence times, Lohrenz et al. (1990) previously
suggested that short plume residence times might act to limit phytoplankton growth, however we
did not find evidence that residence time, as parameterized in our model, limited primary
productivity or sedimentation in the plume. There are few measurements of plume transit times,
and the current model would certainly change if substantially different transit times were found
to be more accurate for the spring season. However, in our model neither primary production
nor sedimentation were sensitive to small changes in residence time (Fig. 9).
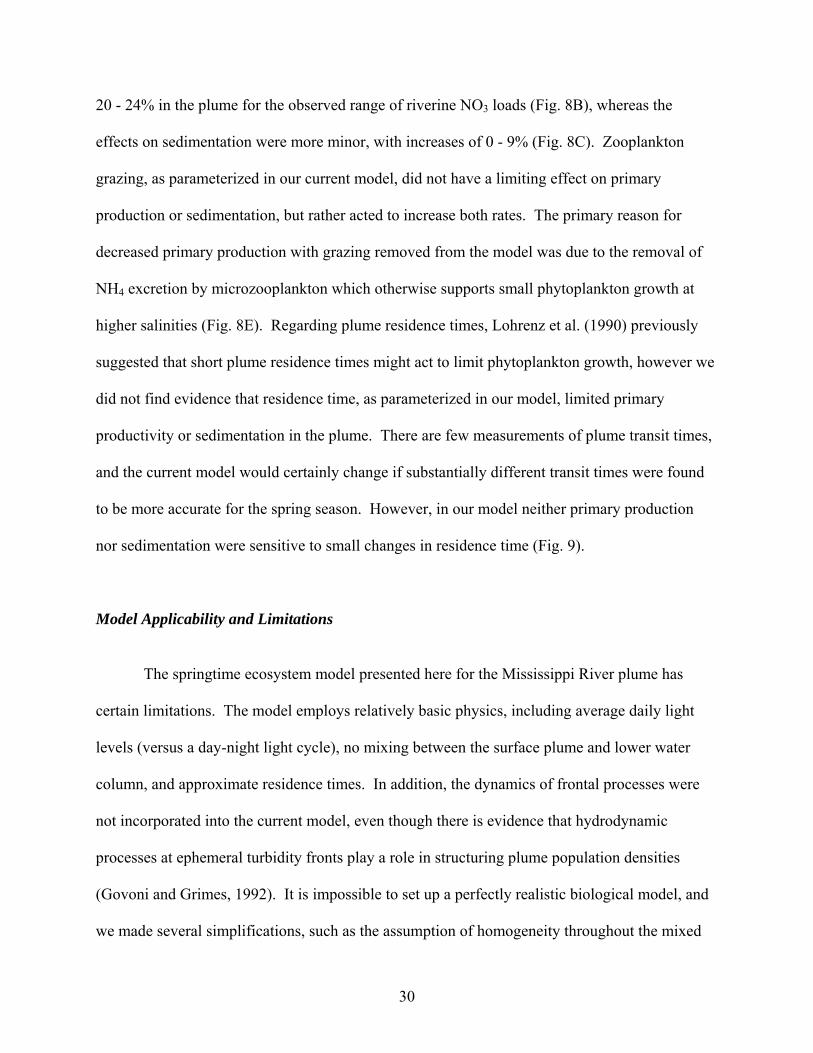
Model Applicability and Limitations
The springtime ecosystem model presented here for the Mississippi River plume has
certain limitations. The model employs relatively basic physics, including average daily light
levels (versus a day-night light cycle), no mixing between the surface plume and lower water
column, and approximate residence times. In addition, the dynamics of frontal processes were
not incorporated into the current model, even though there is evidence that hydrodynamic
processes at ephemeral turbidity fronts play a role in structuring plume population densities
(Govoni and Grimes, 1992). It is impossible to set up a perfectly realistic biological model, and
we made several simplifications, such as the assumption of homogeneity throughout the mixed
30

layer. Subsurface biomass maxima have been observed in regions of strong vertical density
gradients in the plume (Lohrenz et al., 1999), however, their impact on nutrient cycling and food
web dynamics were averaged into the current model. Incorporating such features would require
more data and a vertically-resolved physical model. We assumed continuity in biological species
composition across the salinity regime (0 to 36). In reality, at low salinities there would be a
change in community composition from freshwater to saltwater tolerant species. Most likely,
those species that lack saltwater tolerance sink out of the plume at low salinities and are replaced
by living marine species that mix upward from bottom waters. However, since there is no
evidence of an abrupt loss of freshwater cells followed by slow replacement of marine cells, our
assumption of continuity must suffice in the current model.
Aggregation processes resulting in floc formation can be an important contributor to
vertical export from surface waters. Flocculation occurs when particles in suspension clump
together into rapidly sinking aggregates of many particles called “flocs”. Aggregation was not
incorporated into our current ecosystem model though there are indications that this process may
be particularly important during phytoplankton blooms. As well, phytoplankton biomasses
obtained from our model were at the high end of measurements for intermediate to high salinities
(Fig. 3A), suggesting there is a process at work, such as aggregation, which has not been
included in the current model. Jackson (1990) modeled the dynamics of an algal bloom using
coagulation theory and algal growth kinetics, and the results described a two-state system in
which coagulation processes were unimportant at low algal concentration, but dominated at high
algal concentrations. A coagulation dynamics model was also combined with the food web
model of Fasham et al. (1990), and showed that coagulation can have an important effect on
particle flux even in the low particle concentration oligotrophic environment (Jackson, 2001).
31

Integration of the coagulation and NPZ models relied upon incorporation of many new variables
into the ecosystem model, including, for example, those related to particle size spectra and mass,
collision rates based on Brownian motion, shear, and differential sedimentation, and the
subdivision of dissolved organic matter release into a colloidal fraction and a truly dissolved
fraction. Based on model results, one of the author’s conclusions was that it is premature to use
simple parameterizations, such as those relating particle concentration and removal rate, to
represent the effect of coagulation in planktonic food webs. For these reasons, we have not
incorporated aggregation processes into our current ecosystem model, though they are likely to
be important.
Despite known simplifications, the ecosystem model generally represented measured
population dynamics in the Mississippi River plume. The model was forced by the best
estimates of residence time, light attenuation, and mixed layer depths currently available (Fig. 1).
Modeled biomasses of bacteria, phytoplankton, and micro- and mesozooplankton across the
salinity gradient well matched the measured values from which model parameters were
developed (Fig. 3). Additionally, modeled changes in primary production with variable NO3
loading were within range of measured values from an independent dataset (Fig. 4). Perhaps the
least data were available for grazers, and future model development would benefit from
measurement of zooplankton densities at lower salinities (<20; Fig. 3C-D), as well as a better
understanding of grazing as a function of food concentration in high turbidity environments (e.g.,
ingestion half-saturation constants and maximum grazing rates). However, the availability of
both micro- and mesozooplankton biomasses and grazing rates for the Mississippi River plume is
unique in comparison to the three other river plumes discussed in this special volume, those of
the Pearl, Yangtze, and Rhone. Although microzooplankton measurements are lacking in the
32

other river plumes, measurements of mesozooplankton do exist and have shown, for example,
large variations between the flood and dry seasons in the Pearl River estuary (Tan et al., 2004)
and the Yangtze River plume (see Dagg et al., 2004 for references), and the importance of
mesozooplankton migration in the Rhone River plume (Pagano et al., 1993). We suggest that
measurement of microzooplankton grazing would be a key factor in the development of similar
ecosystem models for the Pearl, Yangtze, and Rhone River plumes.
Conclusions
We developed a springtime, nitrogen-based ecosystem model for the immediate
Mississippi River plume. The model incorporated 9 biological compartments and physical
forcing by PAR, in water light attenuation, residence time, mixed layer depth, and dilution. The
model reproduced a dataset of biological measurements from which the model was developed, as
well as an independent dataset of primary productivity measured at variable riverine NO3
loadings. Three major conclusions were drawn from application of this model to better
understanding the relationship between riverine NO3 loading and organic carbon production and
sedimentation in the plume. First, the percent decrease in primary production and sedimentation
from the plume was significantly less than the percent decrease in riverine NO3 input, such that a
30% decrease in NO3 resulted in a 19% decrease in primary production and a 14% decrease in
sedimentation. Second, the limiting factors of the relationship between NO3 and primary
production were NO3 dilution primarily, followed by abiotic light attenuation, light attenuation
due to mixing, and diatom sinking. Sedimentation was primarily limited by the first three of
these factors. Third, our model results indicate that the fraction of primary production exported
from the mixed layer is highly variable with salinity, and that predictive models of hypoxic zone
33

size should consider this when assuming a constant value for this ratio. Interesting future
directions with ecosystem models for the Mississippi River plume would be to incorporate
limitation by nutrients other than nitrogen (e.g., phosphorus and silicate), include aggregation
processes, and integrate a fully 3-D physical model, as mixing and dilution are clearly major
factors regulating ecosystem functioning.
34
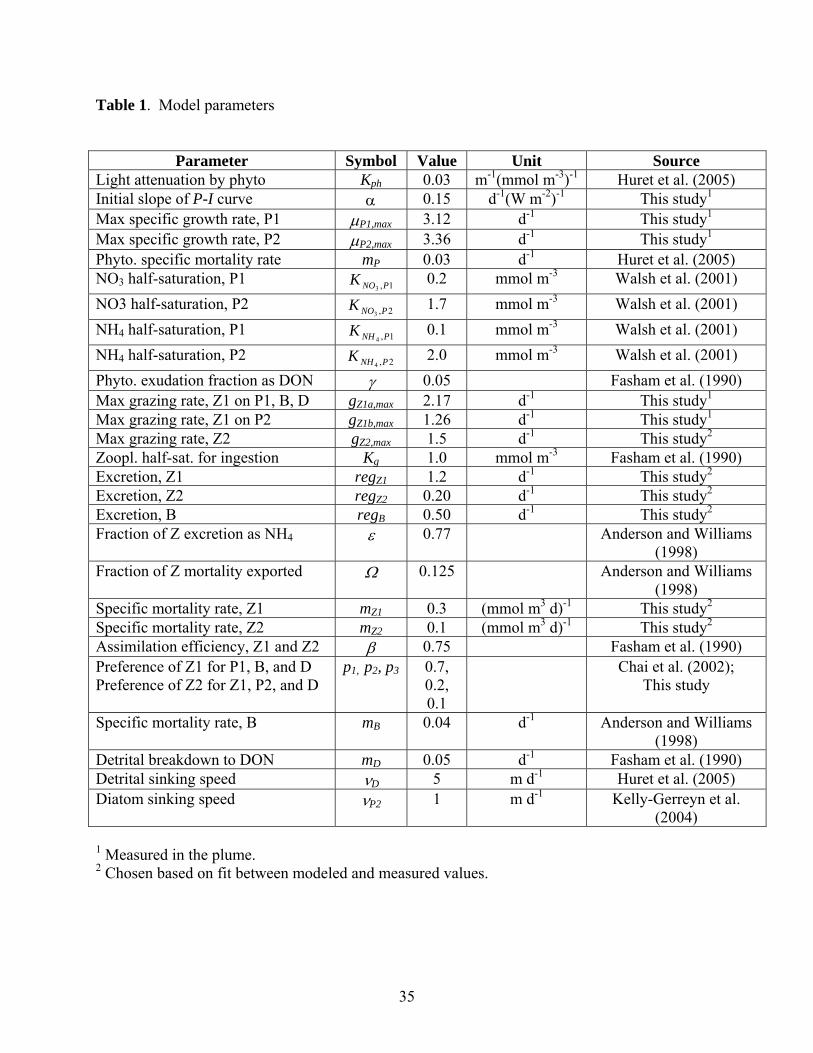
Table 1. Model parameters
Parameter Symbol Value Unit Source
Light attenuation by phyto Kph 0.03 m-1(mmol m-3)-1 Huret et al. (2005) Initial slope of P-I curve α 0.15 d-1(W m-2)-1 This study1
Max specific growth rate, P1 μP1,max 3.12 d-1 This study1
Max specific growth rate, P2 μP2,max 3.36 d-1 This study1
Phyto. specific mortality rate mP 0.03 d-1 Huret et al. (2005) NO3 half-saturation, P1 1,3 PNOK 0.2 mmol m-3 Walsh et al. (2001) NO3 half-saturation, P2 2,3 PNOK 1.7 mmol m-3 Walsh et al. (2001) NH4 half-saturation, P1 1,4 PNHK 0.1 mmol m-3 Walsh et al. (2001) NH4 half-saturation, P2 2,4 PNHK 2.0 mmol m-3 Walsh et al. (2001) Phyto. exudation fraction as DON γ 0.05 Fasham et al. (1990) Max grazing rate, Z1 on P1, B, D gZ1a,max 2.17 d-1 This study1
Max grazing rate, Z1 on P2 gZ1b,max 1.26 d-1 This study1
Max grazing rate, Z2 gZ2,max 1.5 d-1 This study2
Zoopl. half-sat. for ingestion Kg 1.0 mmol m-3 Fasham et al. (1990) Excretion, Z1 regZ1 1.2 d-1 This study2
Excretion, Z2 regZ2 0.20 d-1 This study2
Excretion, B regBB 0.50 d-1 This study2
Fraction of Z excretion as NH4 ε 0.77 Anderson and Williams (1998)
Fraction of Z mortality exported Ω 0.125 Anderson and Williams (1998)
Specific mortality rate, Z1 mZ1 0.3 (mmol m3 d)-1 This study2
Specific mortality rate, Z2 mZ2 0.1 (mmol m3 d)-1 This study2
Assimilation efficiency, Z1 and Z2 β 0.75 Fasham et al. (1990) Preference of Z1 for P1, B, and D Preference of Z2 for Z1, P2, and D
p1, p2, p3 0.7, 0.2, 0.1
Chai et al. (2002); This study
Specific mortality rate, B mBB 0.04 d-1 Anderson and Williams (1998)
Detrital breakdown to DON mD 0.05 d-1 Fasham et al. (1990) Detrital sinking speed νD 5 m d-1 Huret et al. (2005) Diatom sinking speed νP2 1 m d-1 Kelly-Gerreyn et al.
(2004)
1 Measured in the plume. 2 Chosen based on fit between modeled and measured values.
35

Table 2. Differential equations describing model flows
( )[ ] 11111,11 ZGPm
dtdP
PZPP ×−×−×−= σγ
( )⎣ ⎦ 212/122,22,122 ZGZGPMm
dtdP
PZPZPPP ×−×−×−−×−= νσγ
21)1(11,211,1,12,11,1 ZGZZmregGGGG
dtdZ
ZZZZDZBZPZPZ −×−−+++= ββββ
2)2(222,21,22,2 ZZmregGGG
dtdZ
ZZDZZZPZ ×−−++= βββ
( ) 1,1,, 4ZGBmreg
dtdB
BZBBDONBNHB −×−−+= σσ
3,2,13 21
33NOdilPP
dtdNO
NOPNOP ×−−−= σσ
BregZZm
regZZmregPPdt
dNH
NHBBZ
ZZZNHPNHP
×−+××Ω−
+×+××Ω−+×+−−=
)(2)2)1(
...(1)1)1((21
4
44
,2
211,2,14
σ
εεσσ
BBm
DmZregZregPPdt
dDON
DONBB
DZZPP
×−×
+×+××−+××−++=
,
2121 ...2)1(1)1(21
σ
εεγσγσ
DMmPmPmZZmGGG
ZZmGGGGdtdD
DD
PPZDZZZPZ
ZDZBZPZPZ
×+−
+×+×+×Ω+−×−+×−
+Ω+×−×−+×−+×−=
)/(...212)2)1()1((
...1)1)1()1()1((
212,21,22,2
1,1,12,11,1
νβββ
ββββ
M = mixed layer depth (MLD). G refers to the grazing of microzooplankton (Z1) or mesozooplankton (Z2) on respective prey items.
36
NO3
NH4
DON
SmallPhytoplankton
MicroZooplankton
Detritus
LargePhytoplankton
MesoZooplankton
Bacteria
sinking
Mixing
Biological Model Physical Model
Mixed layerdepth
Solar radiation
Light attenuation
PARat depth
Residencetime
sinking
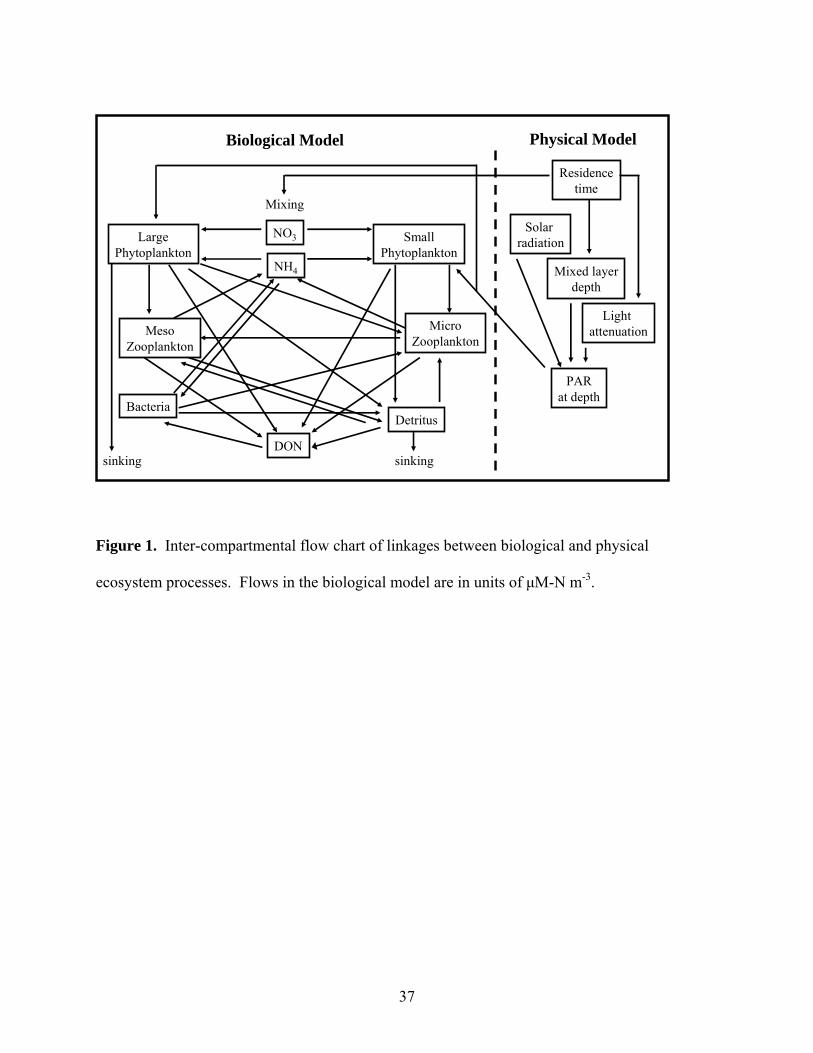
Figure 1. Inter-compartmental flow chart of linkages between biological and physical
ecosystem processes. Flows in the biological model are in units of μM-N m-3.
37

Figure 2. Physical model parameterizations of salinity versus (A) residence time, (B) abiotic
light attenuation (by CDOM and non-chlorophyllous SPM), and (C) mixed layer depth, based on
comparison to measured values. These are the physical values that were used to force the model.
Plume transit times were estimated from Breed et al. (2004).
38

Figure 3. Model verification for a 112 μM riverine NO3 scenario through comparison with
plume measurements of (A) phytoplankton, (B) bacteria, (C) mesozooplankton, (D)
microzooplankton, (E) NO3, and (F) NH4 concentrations. In the case of phytoplankton biomass,
modeled values are a sum of the small (dashed line) and large phytoplankton groups. The
conservative mixing relationship is shown for NO3 (dashed line).
39

Figure 4. Comparison of modeled and measured water column-integrated primary production
for variable riverine NO3 loading. Modeled values are an average over intermediate to high
salinities (>15), the region in which most measurements were made. Measurements are an
average of data collected around the delta in multiple years and seasons (Lohrenz et al., 1997);
spring (March – May) measurements are indicated by asterisks. Error bars on measured values
indicate ±1 SE.
40

Figure 5. Property-salinity relationships showing the effect of variable NO3 loading on (A)
phytoplankton biomass, (B) primary production (PP), and (C) sedimentation (Sed). As well, the
percent contribution of large phytoplankton to (D) biomass and (E-F) rates is shown. Two NO3
loading scenarios of 25 and 250 μM are compared.
41

Figure 6. Vertical export of PON from the mixed layer, and contributions of various processes
to sedimentation, for 112 μM riverine NO3 input. Diatom sinking contributes directly to vertical
export, whereas the other processes (mortality and zooplankton feeding losses) all contribute to
the detrital pool, a fraction of which is exported vertically. Contributions to vertical export by
mesozooplankton mortality and detrital breakdown to DON were not included in the figure,
because they were relatively minor compared to other processes. The contribution of
mesozooplankton egestion to detrital vertical export can be negative, because mesozooplankton
consume detritus and so remove particles from the sinking particulate pool.
42

Figure 7. Effect of variable riverine NO3 loading on average rates of (A) primary production
(PP) and sedimentation (Sed), and the ratio Sed/PP versus (B) NO3 loads and (C) salinity. The
example in panel C is for a NO3 load of 112 μM (the long-term mean). As well, the relationship
between decreasing NO3 load and decreases in average primary production and sedimentation
are shown (panel D). These decreases were calculated relative to a 112 μM NO3 load scenario
for which average primary production and sedimentation equaled 0.31 and 0.063 gN m-2 d-1,
respectively. This panel addresses the potential impacts of mandated reductions in NO3 loading
to the Mississippi River watershed. For example, a 30% decrease in NO3 below 112 μM would
decrease average PP by 19% and average Sed by 14%. All average values of primary production
and sedimentation were calculated for intermediate to high salinities (>15).
43
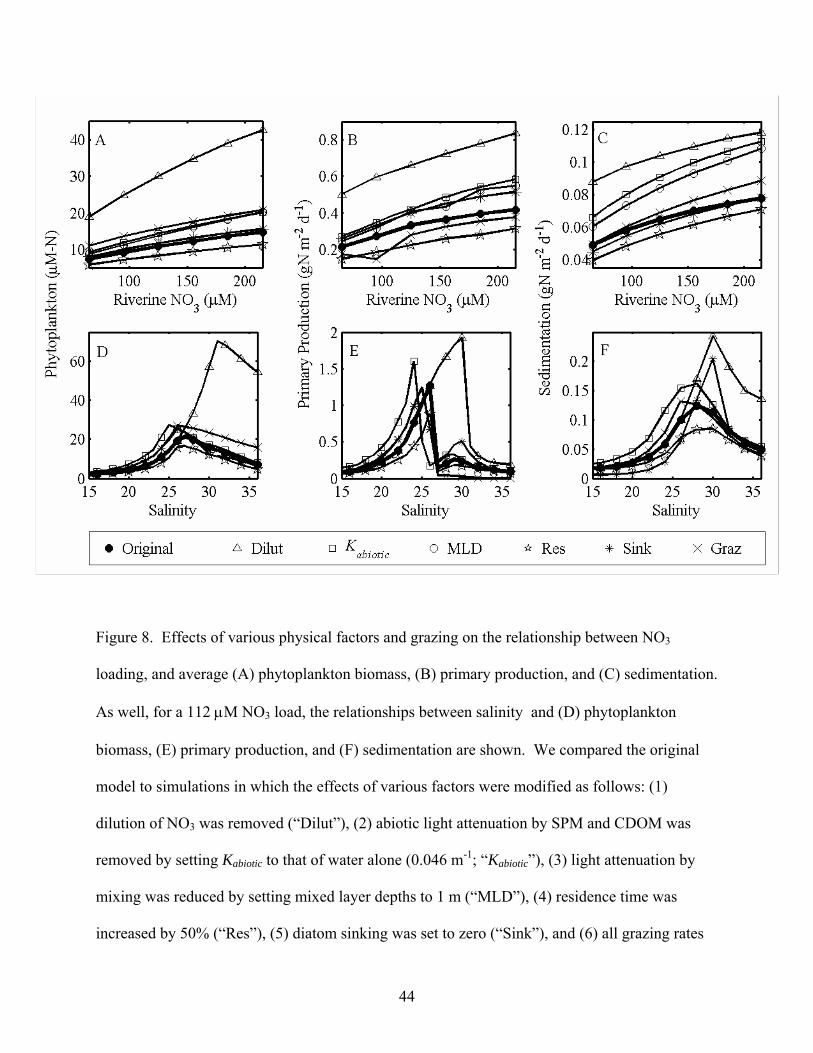
Figure 8. Effects of various physical factors and grazing on the relationship between NO3
loading, and average (A) phytoplankton biomass, (B) primary production, and (C) sedimentation.
As well, for a 112 μM NO3 load, the relationships between salinity and (D) phytoplankton
biomass, (E) primary production, and (F) sedimentation are shown. We compared the original
model to simulations in which the effects of various factors were modified as follows: (1)
dilution of NO3 was removed (“Dilut”), (2) abiotic light attenuation by SPM and CDOM was
removed by setting Kabiotic to that of water alone (0.046 m-1; “Kabiotic”), (3) light attenuation by
mixing was reduced by setting mixed layer depths to 1 m (“MLD”), (4) residence time was
increased by 50% (“Res”), (5) diatom sinking was set to zero (“Sink”), and (6) all grazing rates
44

were set to zero (“Graz”). For clarity, a subset of symbols are plotted in all panels, and low
salinities are not shown in panels D-F. As well, the “MLD” scenario has not been plotted in
panels D-F, because the trends are similar to the “Kabiotic” scenario.
45

Figure 9. Sensitivity to 10% increases in model parameters of (A) primary production and (B)
sedimentation, for a 112 μM riverine NO3 scenario. All parameters for which primary
production and sedimentation were sensitive (|s | > 1; dotted lines) are plotted. For brevity, the
sensitivities to -10% changes in model parameters are not shown.
46

References
Amon, R.M.W., Benner, R., 1998. Seasonal patterns of bacterial abundance and production
in the Mississippi River plume and their importance for the fate of enhanced primary
production. Microbial Ecology, 35, 289-300.
Anderson, T.R., Williams, P.J.B., 1998. Modelling the seasonal cycle of dissolved organic
carbon at station E1 in the English Channel. Estuarine, Coastal, and Shelf Science, 46,
93-109.
Benner, R., Opsahl, S., 2001. Molecular indicators of the sources and transformations of
dissolved organic matter in the Mississippi River plume. Organic Geochemistry, 32, 597-
611.
Bierman, V.J., Jr., Hinz, S.C., Zhu, D.-W., Wiseman, W.J., Jr., Rabalais, N.N., Turner, R.E.,
1994. A preliminary mass balance model of primary productivity and dissolved oxygen
in the Mississippi River plume/Inner Gulf Shelf region. Estuaries, 17, 886-899.
Breed, G.A., Jackson, G.A., Richardson, T.L., 2004. Sedimentation, carbon export and
food web structure in the Mississippi River plume described by inverse analysis. Marine
Ecology Progress Series, 278, 35-51.
Chai, R., Dugdale, R.C., Peng, T.-H., Wilkerson, F.P., Barber, R.T., 2002. One-dimensional
ecosystem model of the equatorial Pacific upwelling system. Part I: model development
and silicon and nitrogen cycle. Deep-Sea Research II, 49, 2713-2745.
Cotner, J.B., Jr., Gardner, W.S., 1993. Heterotrophic bacterial mediation of ammonium and
dissolved free amino acid fluxes in the Mississippi River plume. Marine Ecology
Progress Series, 93, 75-87.
47

Dagg, M.J., 1995. Copepod grazing and the fate of phytoplankton in the northern Gulf of
Mexico. Continental Shelf Research, 15, 1303-1317.
Dagg, M., Benner, R., Lohrenz, S., Lawrence, D., 2004. Transformation of dissolved and
particulate materials on continental shelves influenced by large rivers: plume processes.
Continental Shelf Research, 24, 833-858.
Duan, S., Bianchi, T.S., 2006. Seasonal changes in the abundance and composition of plant
pigments in particulate organic carbon in the lower Mississippi and Pearl Rivers.
Estuaries and Coasts, 29, 427-442.
Edwards, A.M., Yool, A., 2000. The role of higher predation in plankton population models.
Journal of Plankton Research, 22, 1085-1112.
Fasham, M.J.R., Ducklow, H.W., McKelvie, S.M., 1990. A nitrogen-based model of plankton
dynamics in the oceanic mixed layer. Journal of Marine Research, 48, 591-639.
Gardner, W.S., Cavaletto, J.F., Cotner, J.B., Johnson, J.R., 1997. Effects of natural light on
nitrogen cycling rates in the Mississippi River plume. Limnology and Oceanography, 42,
273-281.
Gordon, H.R., Brown, O.B., Evans, R.H., Brown, J.W., Smith, R.C., Baker, K.S., Clark, D.K.,
1988. A semianalytic radiance model of ocean color. Journal of Geophysical Research,
93, 10,909-10,924.
Govoni, J.J., Grimes, C.B., 1992. The surface accumulation of larval fishes by hydrodynamic
convergence within the Mississippi River Plume front. Continental Shelf Research, 12,
1265-1276.
Green, R.E., Bianchi, T.S., Dagg, M.J., Walker, N.D., Breed, G.A., 2006. Application of an
48

organic carbon budget for the Mississippi River turbidity plume to air-sea CO2 fluxes and
bottom-water hypoxia. Accepted, Estuaries.
Huret, M., Dadou, I., Dumas, F., Lazure, P., Garçon, V., 2005. Coupling physical and
biogeochemical processes in the Río de la Plata plume. Continental Shelf Research, 25,
629-653.
Jackson, G.A., 1990. A model of the formation of marine algal flocs by physical coagulation
processes. Deep-Sea Research, 37, 1197-1211.
Jackson, G.A., 2001. Effect of coagulation on a model planktonic food web. Deep-Sea
Research, 48, 95-123.
Jerlov, N.G., 1976. Marine Optics. Elsevier, Amsterdam.
Jochem, F.J., McCarthy, M.J., Gardner, W.S., 2004. Microbial ammonium cycling in the
Mississippi River plume during the drought spring of 2000. Journal of Plankton
Research, 26, 1265-1275.
Justić, D., Rabalais, N.N., Turner, R.E., 1997. Impacts of climate change on net productivity
of coastal waters: Implication for carbon budgets and hypoxia. Climate Research, 8, 225-
237.
Justić, D., Rabalais, N.N., Turner, R.E., 2002. Modeling the impacts of decadal changes in
riverine nutrient fluxes on coastal eutrophication near the Mississippi River Delta.
Ecological Modeling, 152, 33-46.
Kelly-Gerreyn, B.A., Anderson, T.R., Holt, J.T., Gowen, R.J., Proctor, R., 2004. Phytoplankton
community structure at contrasting sites in the Irish Sea: a modelling investigation.
Estuarine, Coastal, and Shelf Science, 59, 363-383.
Korpinen, P., Kiirikki, M., Koponen, J., Peltoniemi, H., Sarkkula, J., 2004. Evaluation and
49

control of eutrophication in Helsinki sea area with the help of a nested 3D-
ecohydrodynamic model. Journal of Marine Systems, 45, 255-265.
Lee, S., Fuhrman, J.A., 1987. Relationships between biovolumen and biomass of naturally
derived marine bacterioplankton. Applied Environmental Microbiology, 53, 1298-1303.
Leming, T.D., Stuntz, W.E., 1984. Zones of coastal hypoxia revealed by satellite scanning
have implications for strategic fishing. Nature, 310, 136-138.
Liu, H., Dagg, M., 2003. Interactions between nutrients, phytoplankton growth, and micro-
and mesozooplankton grazing in the plume of the Mississippi River. Marine Ecology
Progress Series, 258, 31-42.
Liu, H., Dagg, M., Campbell, L., Urban-Rich, J., 2004. Picophytoplankton and bacterioplankton
in the Mississippi River plume and its adjacent waters. Estuaries, 27, 147-156.
Lohrenz, S.E., Dagg, M.J., Whitledge, T.E., 1990. Enhanced primary production at the
plume/oceanic interface of the Mississippi River. Continental Shelf Research, 10, 639-
664.
Lohrenz, S.E., Fahnenstiel, G.L., Redalje, D.G., Lang, G.A., Chen, X., Dagg, M.J., 1997.
Variations in primary production of northern Gulf of Mexico continental shelf waters
linked to nutrient inputs from the Mississippi River. Marine Ecology Progress Series,
155, 45-54.
Lohrenz, S.E., Fahnenstiel, G.L., Redalje, D.G., Lang, G.A., Dagg, M.J., Whitledge, T.E.,
Dortch, Q., 1999. Nutrients, irradiance, and mixing as factors regulating primary
production in coastal waters impacted by the Mississippi River plume. Continental Shelf
Research, 19, 1113-1141.
Merico, A., Tyrrell, T., Lessard, E.J., Oguz, T., Stabeno, P.J., Zeeman, S.I., Whitledge, T.E.,
50

2004. Modelling phytoplankton succession on the Bering Sea shelf: role of climate
influences and trophic interactions in generating Emiliania huxleyi blooms 1997-2000.
Deep-Sea Research I, 51, 1803-1826.
Morel, A., 1991. Light and marine photosynthesis: a spectral model with geochemical and
climatological implications. Progress in Oceanography, 26: 263-306.
Neumann, T., Schernewski, G., 2005. An ecological model evaluation of two nutrient abatement
strategies for the Baltic Sea. Journal of Marine Systems, 56, 195-206.
Pagano, M., Gaudy, R., Thibault, D., Lochet, F., 1993. Vertical migrations and feeding
rhythms of mesozooplanktonic organisms in the Rhone River plume area (North-west
Mediterranean Sea). Estuary, Coastal and Shelf Science, 37, 251-269.
Pakulski, J.D., Benner, R., Whitledge, T., Amon, R., Eadie, B., Cifuentes, L., Ammerman, J.,
Stockwell, D., 2000. Microbial metabolism and nutrient cycling in the Mississippi and
Atchafalaya River plume. Estuarine, Coastal and Shelf Science, 50, 173-184.
Porter, K.G., Feig, Y.S., 1980. The use of DAPI for identifying and counting aquatic
microflora. Limnology and Oceanography, 25, 943-948.
Rabalais, N.N., Turner, R.E., Wiseman, W.J., Jr., Boesch, D.F., 1991. A brief summary of
hypoxia on the northern Gulf of Mexico continental shelf: 1985-1988., p. 35-47. In R.V.
Tyson and T.H. Pearson (eds.), Modern and ancient continental shelf anoxia. Geological
Society Special Publication No. 58, London.
Rabalais, N.N., Turner, R.E., Wiseman, W.J., Jr., 2002. Gulf of Mexico hypoxia, a.k.a. “The
Dead Zone." Annual Review of Ecology and Systematics, 33, 235-263.
Redalje, D.G., Lohrenz, S.E., Fahnenstiel, G.L., 1994. The relationship between primary
51

production and the vertical export of particulate organic matter in a river-impacted
coastal ecosystem. Estuaries, 17, 829-836.
Redfield, A.C., Ketchum, B.H., Richards, F.A., 1963. The influence of organisms on the
composition of sea-water. In: Hill, M.N. (Ed.), The Sea. Vol. 2. John Wiley and Sons,
New York, pp. 26-77.
Scavia, D., Rabalais, N.N., Turner, R.E., Justić, D., Wiseman, W.J., Jr., 2003. Predicting the
response of Gulf of Mexico hypoxia to variations in Mississippi River nitrogen load.
Limnology and Oceanography, 48, 951-956.
Scavia, D., Justić, D., Bierman, V.J., Jr., 2004. Reducing hypoxia in the Gulf of Mexico:
Advice from three models. Estuaries, 27, 419-425.
Skogen, M.D., Søiland, H., Svendsen, E., 2004. Effects of changing nutrient loads to the North
Sea. Journal of Marine Systems, 46, 23-38.
Steele, J.H., Henderson, E.W., 1992. The role of predation in plankton models. Journal of
Plankton Research, 14, 157-172.
Strom, S.L, Strom, M.W., 1996. Microplankton growth, grazing, and community structure in the
northern Gulf of Mexico. Marine Ecology Progress Series, 130, 229-240.
Tan, Y.H., Huang, L.M., Chen, Q.C., Huang, X.P., 2004. Seasonal variation in zooplankton
composition and grazing impact on phytoplankton standing stock in the Pearl River
Estuary, China. Continental Shelf Research, 24, 1949-1968.
Walsh, J.J., Penta, B., Dieterle, D.A., Bissett, W.P., 2001. Predictive ecological modeling of
harmful algal blooms. Human and Ecological Risk Assessment, 7, 1369-1383.
Wawrik, B., Paul, J.H., 2004. Phytoplankton community structure and productivity along the
52
axis of the Mississippi River plume in oligotrophic Gulf of Mexico waters. Aquatic
Microbial Ecology, 35, 185-196.
Acknowledgements
We sincerely thank Hongbin Liu and Malinda Sutor for making available plume
mesozooplankton and microzooplankton data. We also thank Tom Bianchi who provided
helpful comments and support. Fei Chai and Brad Penta provided helpful advice on ecosystem
model development. The manuscript was significantly improved during the review process by
Masahiko Fujii and two anonymous reviewers. This work was funded by the EPA and Louisiana
Board of Regents Agreement Number R-82942001.
53