Double Slit Experiments Is light a wave or particle? Is an electron a wave or a particle?

MODELING OF THE RECYCLING PARTICLE FLUX AND ELECTRON PARTICLE TRANSPORT IN THE
DIII-D TOKAMAK
by D.R. BAKER, R. MAINGI, L.W. OWEN,
G.D. PORTER, and G.L. JACKSON
OCTOBER 1996
GENERAL ATOMICS

Portions of this document may be illegible in electronic image products. Images are produced from the best avaiiable original document.

DISCLAIMER
This report was prepared as an account of work sponsored by an agency of the United States Government. Neither the United States Government nor any agency thereof, nor any of their employees, makes any warranty, express or implied, or assumes any legal liability or responsibility for the accuracy, completeness, or usefulness of any information, apparatus, product, or process disclosed, or represents that its use would not infringe privately owned rights. Reference herein to any specific commercial product, process, or service by trade name, trademark, manufacturer, or otherwise, does not necessarily constitute or imply its endorsement, recommendation, or favoring by the United States Government or any agency thereof. The views and opinions of authors expressed herein do not necessarily state or reflect those of the United States Government or any agency thereof.
G A-A22341
MODELING OF THE RECYCLING PARTICLE FLUX AND ELECTRON PARTICLE TRANSPORT IN THE
DIII-D TOKAMAK
bY D.R. BAKER, R. MAINGI? L.W. OWEN?
G.D. PORTER,O and G.L. JACKSON
This is a preprint of a paper to be presented at the 12th International Conference on Plasma Surface interactions in Controlled Fusion Devices, May 20-24,1996, Saint-Raphael, France and to be published in the Proceedings.
tOak Ridge Associated Universities *Oak Ridge National Laboratory
OLawrence Livermore National Laboratory
Work supported by the U.S. Department of Energy
under Contract Nos. DE-AC03-89ER51114, W-7405-ENG-48, and DE-AC05-960R22464
GA PROJECT 3466 OCTOBER 1996
GENEWL ATOM8CS

D.R. Baker, et al. MODELING OF THE RECYCLING PARTICLE FLUX AND ELECTRON
PARTICLE TRANSPORT IN THE DEI-D TOKAMAK
ABSTRACT
' One of the most difficult aspects of performing an equilibrium particle transport analysis in a diverted tokamak is the determination of the particle flux which enters the plasma after recycling from the divertor plasma, the divertor target plates or the vessel wall. An approach which has been utilized in the past is to model the edge, scrape-off layer (SOL), and divertor plasma to match measured plasma parameters and then use a neutral transport code to obtain an edge recycling flux while trying to match the measured divertor Da emissivity. Previous simulations were constrained by electron density (ne) and temperature (Te), ion temperature (Ti) data at the outer midplane, divertor heat flux from infrared television cameras, and ne, Te and particle flux at the target from fixed Langmuir probes, along with the divertor Da emissivity. In this paper, we present results of core fueling calculations from the 2-D modeling for ELM-free discharges, constrained by data from the new divertor diagnostics. In addition, we present a simple technique for estimating the recycling flux just after the L-H transition and demonstrate how this technique is supported by the detailed modeling. We will show the effect which inaccuracies in the recycling flux have on the calculated particle flux in the plasma core. For some specific density profiles, it is possible to separate the convective flux from the conductive flux. The diffusion coefficients obtained show a sharp decrease near a normalized radius of 0.9 indicating the presence of a transport barrier.
GENERAL ATOMICS REPORT GA-A22341 ... 111

D.R. Baker, et al. MODELING OF THE RECYCLING PARTICLE FLUX AND ELECTRON
PARTICLE TRANSPORT IN THE DIII-D TOKAMAK
1. INTRODUCTION
One of the major difficulties in performing particle transport calculations in a tokamak is to determine the particle sources from the wall and divertor area with sufficient accuracy for a meaningful result. This is especially difficult for a tokamak with an open divertor, since the particles recycling on the divertor target plate usually do not enter the plasma core directly but are cycled many times between the plates and the divertor plasma before they enter the core [l]. The effective recycling coefficient then depends in a complicated way on the divertor plasma and its relation to the divertor target plates. We present here a technique which, for ELM free H-mode in DIII-D, greatly simplifies the determination of the edge particle source.
GENERAL ATOMICS REPORT GA-A2234 I 1

D.R. Baker, et al. MODELING OF THE RECYCLING PARTICLE FLUX AND ELECTRON
PARTICLE TRANSPORT IN THE DIII-D TOKAMAK
2. SIMPLE MODEL OF ELM FREE H-MODE DENSITY RISE
Immediately after the L-H transition, there is a rise in total particle content in the plasma core, and the density profile changes from the typical L-mode peaked profile to a flatter profile which is typical of H-mode. The rate of rise of the particle content is approximated by,
9 (1) R(t)N(t) -- N(t) . -- dN(t) - s, +s, + dt ZP %
S is the particle source from the neutral beams. S, is the source of particles evolving from the wall and tiles, which we assume to be constant for the short time after the L-H transition. N(t) is the number of electrons in the plasma and TP is the particle confinement time. R(t) is the total recycling coefficient for particles leaving the core and then returning to the core, which can be time dependent. We neglect fueling from a gas puff source. The first three terms on the right hand side of Eq. (1) represent the total core fueling rate. The first two terms are approximately constant in time. In our simple model we assume that the third term is also approximately constant in time. The argument for this is: after the L-H transition, which is marked by a rapid drop in the Da light and which signals a major decrease in particle transport and edge recycling, the core density rises, there is an increased flow of particles out of the core and a resulting increase in Scrape Off Layer (SOL) and divertor plasma density; this causes the transparency of the SOL and divertor plasma to decrease and then R(t) - l/N(t) and thus R(t)N(t) is approximately constant in time for a few hundred ms after the L-H transition. This is shown in the following section and was reported in Ref.[ 13. It should be noted that during the ELM free H-mode the SOL transparency always remains much greater than in L-mode.
RN By defining SR = -,we can simplify Equation (1) to, [2]. zP
; sin = s, + s, + s, , N(t) - sin - - dt ZP
-- dN(t)
where Si, is the total particle core fueling rate. Si, can be approximately obtained directly from the time dependence of the density traces;
s. . In AN dt
(3)
AN is the difference between the final and initial total number of particles, dN/dtlo is the initial slope of the particle rise and Nf is the final number of particles in the plasma.
GENERAL ATOMICS REPORT GA-A22341 3
D. R. Baker, et al. MODELING OF THE RECYCLING PARTICLE FLUX AND ELECTRON
PARTICLE TRANSPORT IN THE DIII-D TOKAMAK
3. MODELING OF SOL PLASMA
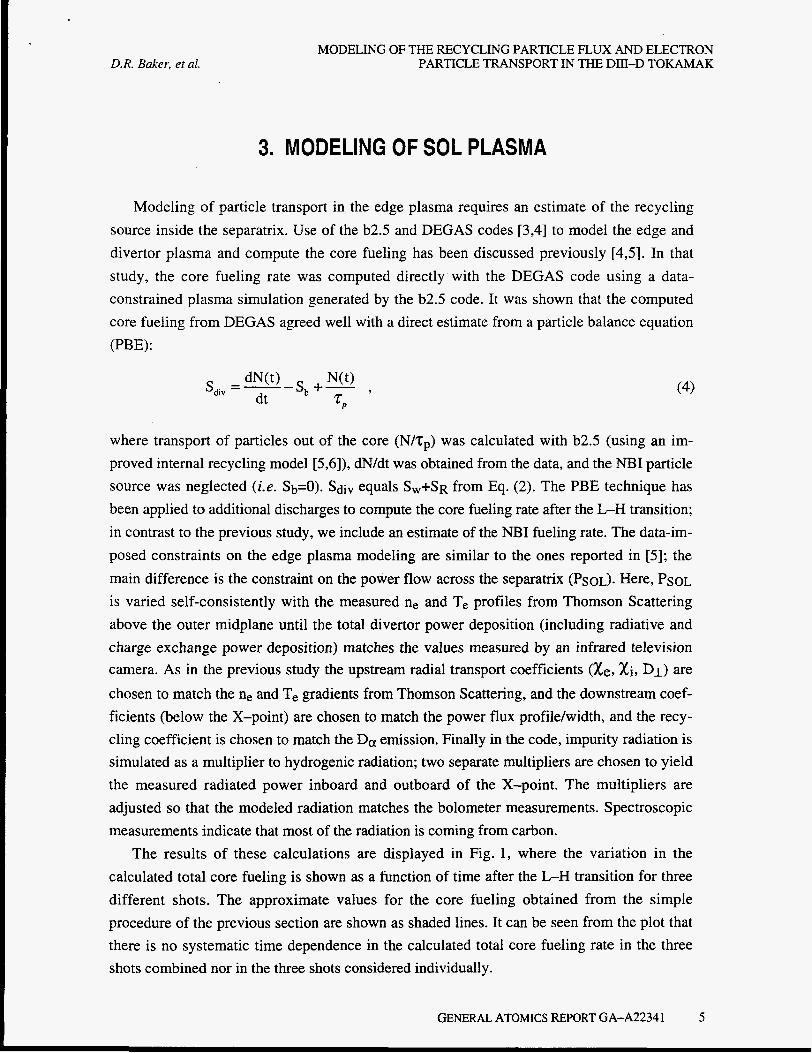
Modeling of particle transport in the edge plasma requires an estimate of the recycling source inside the separatrix. Use of the b2.5 and DEGAS codes [3,4] to model the edge and divertor plasma and compute the core fueling has been discussed previously [4,5]. In that study, the core fueling rate was computed directly with the DEGAS code using a data- constrained plasma simulation generated by the b2.5 code. It was shown that the computed core fueling from DEGAS agreed well with a direct estimate from a particle balance equation (PBE):
where transport of particles out of the core (N/Zp) was calculated with b2.5 (using an im- proved internal recycling model [5,6]), dN/dt was obtained from the data, and the NBI particle source was neglected (Le. Sb=O). Sdiv equals S,+SR from Eq. (2). The PBE technique has been applied to additional discharges to compute the core fueling rate after the L-H transition; in contrast to the previous study, we include an estimate of the NBI fueling rate. The data-im- posed constraints on the edge plasma modeling are similar to the ones reported in [ 5 ] ; the main difference is the constraint on the power flow across the separatrix (PsoL). Here, PSOL is varied self-consistently with the measured ne and Te profiles from Thomson Scattering above the outer midplane until the total divertor power deposition (including radiative and charge exchange power deposition) matches the values measured by an infrared television camera. As in the previous study the upstream radial transport coefficients (Xe, Xi, D i ) are chosen to match the ne and Te gradients from Thomson Scattering, and the downstream coef- ficients (below the X-point) are chosen to match the power flux profile/width, and the recy- cling coefficient is chosen to match the Dol emission. Finally in the code, impurity radiation is simulated as a multiplier to hydrogenic radiation; two separate multipliers are chosen to yield the measured radiated power inboard and outboard of the X-point. The multipliers are adjusted so that the modeled radiation matches the bolometer measurements. Spectroscopic measurements indicate that most of the radiation is coming from carbon.
The results of these calculations are displayed in Fig. 1, where the variation in the calculated total core fueling is shown as a function of time after the L-H transition for three different shots. The approximate values for the core fueling obtained from the simple procedure of the previous section are shown as shaded lines. It can be seen from the plot that there is no systematic time dependence in the calculated total core fueling rate in the three shots combined nor in the three shots considered individually.
GENERAL ATOMICS REPORT GA-A22341 5

MODELING OF THE RECYCLING PARTICLE FLUX AND ELECTRON PARTICLE TRANSPORT IN THE DIII-D TOKAMAK D.R. Baker, et al.
7 -
6 ’ e 10111111111111111111- - 6l z 5
I
A A
0 200 400 600 800 1000 1200 1400 1600 1800 2000 Time after L-H Transistion - ms
Fig. 1. Calculated value of the recycled core fueling vs. time after the L-H transition for three different shots. The points are the values from the b2.5 modeling. The lines are the values obtained from the simple approximation for the three analyzed shots. The legend shows the relation between the simple approximation and the calculated core fueling.
It has been found [7] that the uncertainties in the wall source obtained from these types of modeling techniques can be as much as f40%. We believe that the statistical error in the modeling is less than this based on different fits to the SOL data. However there may be a systematic error in the model which may yield a total uncertainty of about a factor of 2. The difference between the wall source from modeling and the simple approximation is within f40%. We will show in the next section that there is an important region in the plasma where having an approximate (and easily obtained) value for the core fueling rate provides useful information about particle transport in the ELM free H-mode.
6 GENERAL ATOMICS REPORT GA-A22341

D.R. Baker, et al. MODELING OF THE RECYCLING PARTICLE FLUX AND ELECTRON
PARTICLE TRANSPORT IN THE DIII-D TOKAMAK
1.0 x
-1.0 x
-1.5 x
1 020 C
1019
b 0
a 1019
1019
1 020 0.0 0.2 0.4 0.6 0.8
Normalized P
Fig. 2. The particle flux calculated from ONETWO for a time 25 rns after the L-H transition of one of the shots modeled by b2.5. The three curves are for three values of the edge source, varied by a factor of 2.0 about the value obtained from the simple approximation.
GENERAL ATOMICS REPORT GA-A22341 7

D. R. Baker, et al. MODELING OF THE RECYCLING PARTICLE FLUX AND ELECTRON
PARTICLE TRANSPORT IN THE DID-D TOKAMAK
4. PARTICLE TRANSPORT MODELING OF THE DIII-D CORE
We have analyzed the particle transport just after the L-H transition using the approximate value of the wall source. We have also investigated the general sensitivity of the transport coefficients to uncertainties in the magnitude of the wall source. In Fig. 2. is shown the values of particle flux calculated from transport modeling using the ONETWO code [8] at 30 ms after the L-H transition for one of the shots discussed in the previous section. The calculations were done for three different values of wall source which varied by a factor of 2, or +33%. It can be seen that inside of p = 0.8 the particle flux is completely independent of the edge source and outside of p = 0.98 the flux is sensitively dependent on the edge source, however between p = 0.8 and 0.98 there is an important region for the ELM free H-mode where use of the approximate value of edge source can give a useful approximate value for the particle flux.
The code GAptrans, solves the particle transport equation and fits the solution for the density profile to that measured by Thomson scattering by varying parameterized expressions for the particle diffusion coefficient, D and the pinch velocity, V,. Using the relation for Vp/D given by the consistent density profile of a turbulent L-mode plasma [9],
where V, negative is inward, nss is the “canonical” steady state density profile of the turbulent L-mode plasma and rho is proportional to the square root of the toroidal flux. We can obtain values for D and V,, as plotted in Fig. 3 for the three values of wall source. It can be seen that a factor of two variation in the wall source makes no qualitative difference in the behavior of D for all p, and V, is only significantly changed outside of p = 0.95. In general we find this to be true for all of the ELM free H-mode discharges and time slices which we have analyzed. The region, 0.8 < p < 0.98 is of importance for H-mode plasmas since it is in this region that the transport barrier forms (as shown by the sharp drop in D in Fig. 3).
GENERAL ATOMICS REPORT GA-A22341 9

MODELING OF THE RECYCLING PARTICLE FLUX AND ELECTRON PARTICLE TRANSPORT IN THE DIU-D TOKAMAK
X T- Y .- s C 0 .- a 2 0 v)
Shot 78037 Fit to Density Profile
0.8 [ I
0.6
0.4
o-2L--!l 0.0 0.0 0.2 0.4 0.6 0.8 1.0
P
Source & dndt
10 :
1.0 d c c
/
I /
/ /
' C
0.1 ,@ - - *
0.0 0.2 0.4 0.6 0.8 1.0
x2 = 0.00253269 P
D.R. Baker, et al.
Time 2150
0.8
0.0 v 0.0 0.2 0.4 0.6 0.8 1.0
P
-1.5 0.0 0.2 0.4 0.6 0.8 1.0
P
Fig. 3 . The results from GAptrans, which returns D and VP vs. r. Three different values of edge source are used. Figure 3(a,b,c) respectively correspond to the source term labeled a,b,c respectively in Fig. 2 (Page 1 of 3).
10 GENERAL ATOMICS REPORT GA-A22341

MODELING OF THE RECYCLING PARTICLE FLUX AND ELECTRON D.R. Baker, et al. PARTICLE TRANSPORT IN THE DIU-D TOKAMAK
Shot = 78037 Fit to Density Profile
Time = 2150 Diff. Coeff 0.8 1.0 1
0.8 1 3 0.6 I
r-J- E
h E 0.6 z - 0.4
'5 0.2
0.0
E 0 0.4
0.0
K Y Y
w-
E
- 0.2 t
. 0.0 0.2 0.4 0.6 0.8 1.0 0.0 0.2 0.4 0.6 0.8 1.0
P P
Source 81 dndt =loo - . - -
E E r-J
0
r; 10 r
g 1.0 ? /
s ' 0
0 0.1 4.
X2 = 0.00253269
F Y - - -
0 %
... I /
0 Q)
c
0.0 0.2 0.4 0.6 0.8 1.0 P
cn
Source 81 dndt r-J
0 cu 0
r; 10 r
g 1.0 ? /
s ' 0
0 0.1 4.
F Y - - -
0 %
... I /
0 Q)
c
0.0 0.2 0.4 0.6 0.8 1.0 cn
P X2 = 0.00253269
0.0
-0.5 h
E -1 .o >
-1.5 0.0 0.2 0.4 0.6 0.8 1.0
P
Fig. 3. The results from GAptrans, which returns D and VP vs. r. Three different values of edge source are used. Figure 3(a,b,c) respectively correspond to the source term labeled a,b,c respectively in Fig. 2 (Page 2 of 3).
GENERAL ATOMICS REPORT GA-A2234 1 1 1

MODELING OF THE RECYCLING PARTICLE FLUX AND ELECTRON PARTICLE TRANSPORT IN THE DIII-D TOKAMAK
Shot = 78037 Fit to Density Profile - A 0.8 1
*-€ "0 0.6
0.4
0
7
x v
0.0 0.2 0.4 0.6 0.8 1.0 P
. -- Source & dndt
g .- LOL- ' . c #/;-- T/ 1 I.
/
0.1 0.0 0.2 0.4 0.6 0.8 1.0
x2 = 0.00253269 P
D.R. Baker, et al.
Time = 2150
0.8
0.0 .. 0.0 0.2 0.4 0.6 0.8 1.0
P
0.0
h -0.5 2 E Y
-1.0
-1.5 0.0 0.2 0.4 0.6 0.8 1.0
P
Fig. 3. The results from GAptrans, which returns D and VP vs. r. Three different values of edge source are used. Figure 3(a,b,c) respectively correspond to the source term labeled a,b,c respectively in Fig. 2 (page 3 of 3).
12 GENERAL ATOMICS REPORT GA-A22341

D. R. Baker, et al. MODELING OF THE RECYCLING PARTICLE FLUX AND ELECTRON
PARTICLE TRANSPORT IN THE DIE-D TOKAMAK
5. CONCLUSIONS
Modeling of the scrape-off layer and divertor plasma interaction with the tokamak wall and divertor target plates of DIII-D ELM free H-mode plasmas indicates that within the accuracy of the modeling process, the core fueling does not change in time during the first few hundred milliseconds after the L-H transition. Thus a simple model using the time rate of change of the total particle content can give an approximate value for the edge fueling source to be used in transport codes. The values of calculated flux, D and V, do not depend sensitively on the magnitude of the edge source, except at the very edge of the plasma.
GENERAL ATOMICS REPORT GA-A22341 13
D.R. Baker, et al. MODELING OF THE RECYCLING PARTICLE FLUX AND ELECTRON
PARTICLE TRANSPORT IN THE DIII-D TOKAMAK
REFERENCES
M.E. Rensink, et al., Phys. Fluids B, Vol. 5, #7, July 1993 p. 2165. G.L. Jackson, et al., J. Nucl. Mater. 220-222, (1993, p. 173. L.W. Owen, et al., J. Nucl. Mater. 220-222 (1995) 315. B.J. Braams and D.K. Rayevski, Bull. Am. Phys. SOC. 38 (1993) 1919. D.B. Heifitz, et al., J. Comp. Phys. 46 (1982) 309. R. Maingi, et al., Nucl. Fusion 34 (1994) 283. H. Takenaga, et al., J. Nucl. Mater. 220-222 (1995) p. 429. W. W. Pfeiffer, et al., GA-A16178, December 1980 V.V. Yankov, JETP Lett. 60,171 (1994).
GENERAL ATOMICS REPORT GA-A2234 1 15

D.R. Baker, et al. MODELING OF THE RECYCLING PARTICLE FLUX AND ELECTRON
PARTICLE TRANSPORT IN THE DID-D TOKAMAK
ACKNOWLEDGMENT
Work supported by U.S. Department of Energy under Contract Nos. DE-AC03- 89ER5 1 1 14, DE-AC05-960R22464 and W-7405-ENG-48.
GENERAL ATOMICS REPORT GA-A22345 I7