
Modeling Of Metabolic Heat Regenerated Temperature Swing ...
18
Modeling Of Metabolic Heat Regenerated Temperature Swing Adsorption (MTSA) Subassembly For Prototype Design Chad E. Bower', Sebastian A. Padilla ` , and Christie S. Iacoimini3 Paragon Space Development Corporation, Tucson, AZ, 85714 Heather L. Pau14 NASA Johnson Space Center, Houston, TX, 77058 This paper describes modeling methods for the three core components of a Metabolic heat regenerated Temperature Swing Adsorption (MTSA) subassembly: a sorbent bed, a sublimation (cooling) heat exchanger (SHX), and a condensing icing (warming) heat exchanger (CIHX). The primary function of the MTSA, removing carbon dioxide from a space suit Portable Life Support System (PLSS) ventilation loop, is performed via the sorbent bed. The CIHX is used to heat the sorbent bed for desorption and to remove moisture from the ventilation loop while the SHX is alternately employed to cool the sorbent bed via sublimation of a spray of water at low pressure to prepare the reconditioned bed for the next cycle. This paper describes subsystem heat a mass transfer modeling methodologies relevant to the description of the MTSA subassembly in Thermal Desktop and SINDA./FLUINT. Several areas of particular modeling interest are discussed. In the sorbent bed, capture of the translating carbon dioxide (CO 2 ) front and associated local energy and mass balance in both adsorbing and desorbing modes is covered. The CIHX poses particular challenges for modelin g in SINDA/FLUINT as accounting for solids states in fluid submodels are not a native capability. Methods for capturing phase change and latent heat of ice as well as the transport properties across a layer of low density accreted frost are developed. This extended modeling capacity is applicable to temperatures greater than 258 K. To extend applicability to the minimum device temperature of 235 K, a method for a mapped transformation of temperatures from below the limit temperatures to some value above is given along with descriptions for associated material property transformations and the resulting impacts to total heat and mass transfer. Sinular considerations are given for the SHX along with functional relationships for areal sublimation rates as limited by flow mechanics in the outlet duct- 1 Sr. Thermal Analyst, 3481 E. Michigan Street Tucson, AZ, 8.5714 2 MTSA Project Lead, 3481 E. Michigan Street Tucson, AZ, 85714 3 Acting Director of Operational Programs, 3481 E. Michigan Street Tucson, AZ, 85714 4 Constellation Space Suit PLSS Ventilation Subsystem Lead, Space Suit and Crew Survival Systems Branch, Crew and Thermal Systems Division, 2101 NASA Parkway, Mail code EC5. American Institute of Aeronautics and Astronautics
Transcript of Modeling Of Metabolic Heat Regenerated Temperature Swing ...

Modeling Of Metabolic Heat Regenerated TemperatureSwing Adsorption (MTSA) Subassembly For Prototype
Design
Chad E. Bower', Sebastian A. Padilla ` , and Christie S. Iacoimini3Paragon Space Development Corporation, Tucson, AZ, 85714
Heather L. Pau14NASA Johnson Space Center, Houston, TX, 77058
This paper describes modeling methods for the three core components of a Metabolic heat regenerated TemperatureSwing Adsorption (MTSA) subassembly: a sorbent bed, a sublimation (cooling) heat exchanger (SHX), and acondensing icing (warming) heat exchanger (CIHX). The primary function of the MTSA, removing carbon dioxidefrom a space suit Portable Life Support System (PLSS) ventilation loop, is performed via the sorbent bed. TheCIHX is used to heat the sorbent bed for desorption and to remove moisture from the ventilation loop while the SHXis alternately employed to cool the sorbent bed via sublimation of a spray of water at low pressure to prepare thereconditioned bed for the next cycle.
This paper describes subsystem heat a mass transfer modeling methodologies relevant to the description of theMTSA subassembly in Thermal Desktop and SINDA./FLUINT. Several areas of particular modeling interest arediscussed. In the sorbent bed, capture of the translating carbon dioxide (CO 2) front and associated local energy andmass balance in both adsorbing and desorbing modes is covered. The CIHX poses particular challenges formodeling in SINDA/FLUINT as accounting for solids states in fluid submodels are not a native capability. Methodsfor capturing phase change and latent heat of ice as well as the transport properties across a layer of low densityaccreted frost are developed. This extended modeling capacity is applicable to temperatures greater than 258 K. Toextend applicability to the minimum device temperature of 235 K, a method for a mapped transformation oftemperatures from below the limit temperatures to some value above is given along with descriptions for associatedmaterial property transformations and the resulting impacts to total heat and mass transfer. Sinular considerationsare given for the SHX along with functional relationships for areal sublimation rates as limited by flow mechanics inthe outlet duct-1
Sr. Thermal Analyst, 3481 E. Michigan Street Tucson, AZ, 8.5714
2 MTSA Project Lead, 3481 E. Michigan Street Tucson, AZ, 857143 Acting Director of Operational Programs, 3481 E. Michigan Street Tucson, AZ, 857144 Constellation Space Suit PLSS Ventilation Subsystem Lead, Space Suit and Crew Survival Systems Branch, Crewand Thermal Systems Division, 2101 NASA Parkway, Mail code EC5.
American Institute of Aeronautics and Astronautics

Nomenclatureae = evaporation coefficientAc,.oss = total cross sectional area of the sorbent bedC = sonic velocityC, = system efficiency constantCz = threshold loading fraction for proportional flow controlC3 = desorption mass flow reduction factorC4 = desorption limit flow constantCP = Specific heat at a constant pressureCV = Specific heat at a constant volumedA = cross section of the unit volumeDh = hydraulic diameterDAB = mass flow rate per unit areaF = loading mass fraction
f = friction factorh l = heat of desorptionh„a r = volumetric heat transfer coefficientdh = solid to vapor phase change energyAh fg = phase change energy from gas to liquid
h„ = vapor heat transfer coefficientk = thermal conductivitykf = frost thermal conductivity
= mass flow rate= mass flow rate per unit area
Mice = mass of iceM = MachMA = molecular mass of constituent AMB = molecular mass of constituent BNu = Nusselt numberP = pressureq = heat flow rate
q" = heat flow rate per unit areaRgas = individual gas constantRe = Reynolds numberT = temperaturet = timeV = volumeVA = Diffusion volume of constituent AVB = Diffusion volume of constituent BX = flow CO2 mass fractiony = ratio of specific heats11 = efficiencyP = densitypf = frost density
Subscripts:bed = of the sorbent bedbark = bulk or free streamCO2 = Carbon DioxideC; = concentration at interfaceCm = concentration in free streamd = based on hydraulic diameter
2American Institute of Aeronautics and Astronautics
dv = discretized unit volumeenv = SHX chamber environmentflaw = of the bulk flowI = at interface
to = intomin = minimumn = newNCG = non condensable gas
a = old
s = ice surface exposed to SHX chamber environmentsat = saturationrank = in a unit volume CO 2 storage tanktat = totalwall = at Wall
I. MTSA System OverN4ew
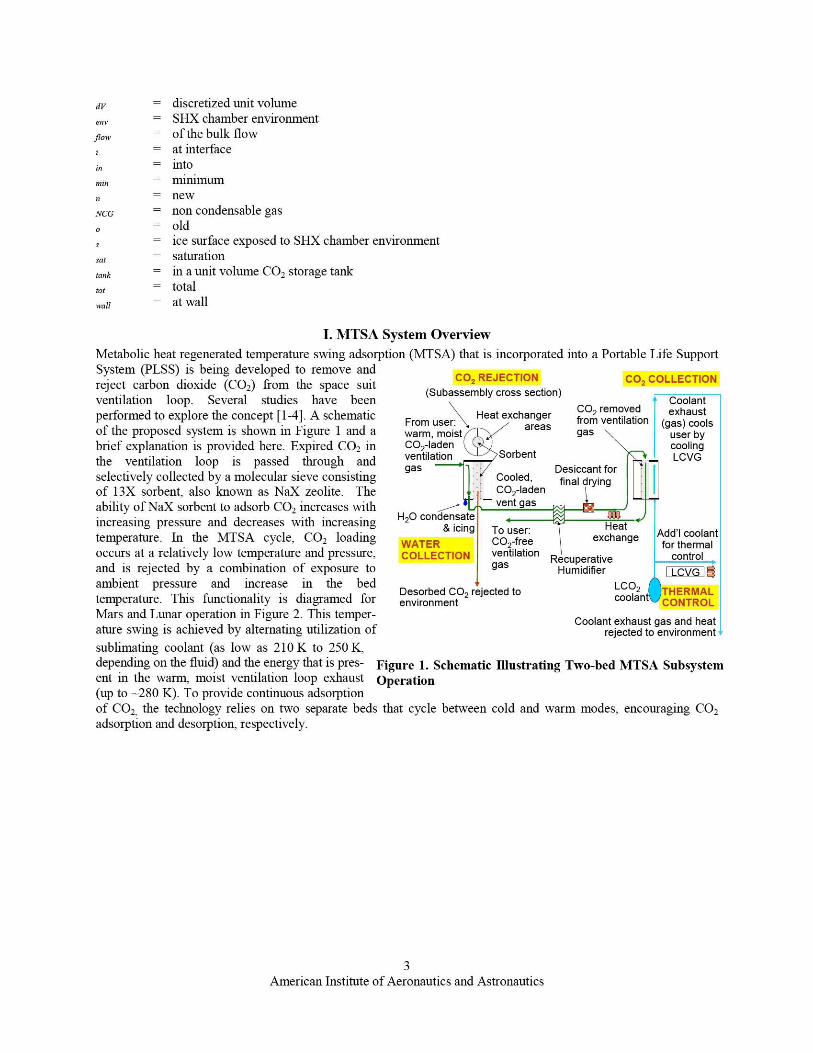
Metabolic heat regenerated temperature swing adsorption (MTSA) that is incorporated into a Portable Life SupportSystem (PLSS) is being developed to remove andreject carbon dioxide (CO 2) from the space suit
CO2 REJECTION COZ COLLECTION
ventilation loop. Several studies have been(Subassembly cross section)
Coolant1performed A schematicp to exp lore the concept 1 -4 ^' Heat exchanger CO2 removed exhaust
from ventilation of the proposed system is shown in Figure 1 and a
From us e areaswarm, moist gas(gas) cools
user bybrief explanation is provided here. Expired CO 2 in CO 2-laden coolingthe ventilation loop is passed through and ventilation Sorbent LCVG
selectively collected by a molecular sieve consistinggas Desiccant forCooled, final
I
of 13X Sorbent, also known as NaX zeolite. The l dryingCO2-ladenC
ability of NaX Sorbent to adsorb CO2 increases with vent gas
increasing pressure and decreases with increasing H 2O condensate& icing Heat
Ld'ltemperature. In the MTSA cycle, CO 2 loading WATERTo user: coolantCO -free exchange
2. for thermaloccurs at a relatively low temperature and pressure, COLLECTION ventilation Recuperative controland is rejected by a combination of exposure to gas Humidifier LCVGambient pressure and increase in the bed Desorbed CO Z rejected LCOto THERMALcoolanttemperature. This functionality is diagramed for environment CONTROLMars and Lunar operation in Figure 2. This temper-ature swing is achieved by alternating utilization of
Coolant exhaust gas and heatrejected to environment
sublimating coolant (as low as 210 K to 250 K,depending on the fluid) and the energy that is pres- Figure 1. Schematic Illustrating Two-bed MTSA Subsystement in the warm, moist ventilation loop exhaust Operation(up to --280 K). To provide continuous adsorptionOf CO2. the technology relies on two separate beds that cycle between cold and warm modes, encouraging CO2
yadsorption and desorption, respectively.
American Institute of Aeronautics and Astronautics

I Desorb; 1 Desorb;' i^^i I I ^ I
1T Adsorb 1, Adsorb j 1:
III
I
1 1I II 1
1
I11
LBed A
I I 1 1
i i 3I 1 1 1 0
Desorbl I Desorb_
^I I ^ I
Adsorb '~'' 1 t
Adsorb 1T t N .^
i i i@o
I
f^21 1
5
I J
3 4'
Bed BI I I I
Time
1 Completely desorbed, ambient PPCO22 Completely desorbed, isolated sorbent bed3 Completely adsorbed, 40 kPa O2/CO24 Lower total pressure to 0.8 kPa CO2 (Mars)
4 3 4'. Lower total pressure to lunar Vacuum
F1 7
ing CO2cleycle
-- -I 1I 1
1
2+ 4---------------------------- -j1I
T adsorb T desorb
Figure 2. Temperature (and Pressure) Swing Used to Regenerate the Sorbent Bed in Mars or LunarApplications
Each sorbent bed must be in contact with two separate heat exchangers: one for cooling (a sublimation heatexchanger that exhausts its coolant to the environment), and one for warning (condensing ice heat exchanger thatuses the warm, exhausted ventilation loop flow before it is recycled in the PLSS). To minimize sorbent contami-nation, the bed must be isolated from both of the heat exchangers. These heat exchangers cannot be combined intoone because of the vent loop volume that would be lost with each cycle when the sublinnator coolant is exhausted tothe environment. The heat exchangers must also be well connected to the system to allow for efficient energyexchange. A view of the primary MTSA subassembly containing the sorbent bed, condensing ice heat exchanger(CIHX) and sublimation heat exchanger (SHX) is shown in Figure 3. The following sections describe the operationand modeling methods used in the development of a MTSA subassembly model that will be used to support designof a unit suitable for use in a space suit ventilation loop while operating in a lunar environment.
Figure 3. MTSA subassembly cut view showing the three primary subsystems
4American Institute of Aeronautics and Astronautics

A. Sorbent Bed OverviewThe CO2 adsorption phase of the MTSA cycle handles a constant flow of a process gas, a mixture primarilyconsisting of OZ and CO, with small amounts of water vapor and other trace contaminants which can be neglected.This flow passes through the porous adsorbent bed consisting of an open cell aluminum foam, wash coated withsorbent NaX. The flow transfers heat to the solid media, quickly equilibrating with the bed temperature, as well astransferring CO2 mass. As the material nearest the inlet approaches holding capacity, CO, laden gas will travel overthe filled portions of the bed until reaching unsaturated sorbent. This sets up a CO, front and the associatedexothermic process at this front drives a thermal gradient through the bed. Since the amount of CO, that the bed canadsorb is inversely proportional to temperature, any energy deposited from the process flow and exothermicreactions is adverse to the capacity of the bed and needs to be removed by a heat exchange process. The localmechanism for moving this heat from the sorbent bed to the walls for removal by the SHX is the porous aluminumfoam. Development of a discretized sorbent bed model allows for evaluation of design dimensions (length, width,and thickness) and allows for assessment of the effectiveness of solid fins if necessary. The developed adsorptionmodeling methodology is also implemented to model the desorption portion of the cycle where the bed is exposed tolunar vacuum and heated via the CIHX to drive off the adsorbed CO,.
B. Sublimation Heat Exchanger overviewAs shown in Figure 2, the loading capacity of the sorbent bed increases as the sorbent temperature decreases. Sinceadsorption is exothermic and the process flow is supplied at ---280 K. the bed must be actively cooled while it isremoving CO2 from the ventilation loop.For Mars application, the baseline method MTSA sorbentfor cooling the bed is to expand liquid CO2 stored at --6000 kPa (--900 psi) to ambient
bed Exhaust Ductpressure (--0.8 kPa) through a valve,whereupon it cools to --150 K. This coolgas / solid mixture then travels through atube attached to the sorbent bed that servesto operate as a SHX. CO, was chosen forthe coolant due to in-situ resource Sublimationavailability. For Lunar application. an Surface Sublimationanalogous solution is proposed where Chamberliquid water is used as the coolant sourcesince CO, is not available in the
environment and water is a more massefficient coolant. Expansion of water to Figure 4. General SHX Component Modeling Descriptiontemperatures comparable to a CO2 systemhowever, requires reduction of operating pressure by more than 4 orders of magnitude. Restrictive passages such astubes will not allow sufficient mass flow at the pressures required to cool the system via sublimation. Instead theproposed system sprays expanded water in a solid/gas mixture near --235 K onto a surface to be cooled. The solidsubsequently sublimates carrying away system heat. A simplified version of a SHX in a lunar configuration isshown in Figure 4. The reference mass that requires heat extraction, in this case the sorbent bed, is represented in red(on the left). The blue surface represents the sublimation surface where the coolant water is sprayed. Sublimationdrives water vapor into the chamber, shown in gray, and the vapor travels down an exhaust duct (to the right) whereit exits to a lower pressure environment.
C. Condensing Ice Heat Exchanger overviewThe CIHX is employed to extract metabolic heat from a process flow in order to warns the sorbent bed. Thistemperature swing supports CO, desorption as shown in Figure 2. In the currently considered lunar case, exposure ofthe sorbent bed to lower CO, partial pressures, specifically lunar vacuum, also encoura ges desorption by reducingthe NaX loading capacity. In the CIHX, warm, humid gas exchanges heat with walls initially cooled to around 235K by the SHX, with a goal of heating the sorbent bed to 280 K. As the 0 2/ water vapor mixture flowing through theexchanger is cooled below the dew point, condensation forms on the heat exchange surfaces. While the surfacesremain below 273 K, the condensate forms as a low density frost on the surfaces [7]. As the bed warms to near
American Institute of Aeronautics and Astronautics

Sorbent Bed UnitVolume
Common Inlet FromSystem
Individual Flow Paths
Figure 5. Sorbent bed volume and flow discretization.
CO2 Tank to Sorbent BedThermal Short
CO2 Storage Tank
Nodal Thermal Mass(Aluminum Foam + NaX
Sorbent)
Volumetric ConvectionCoefficient
CO2 Adsorb/DesorbFlow
Process Flow Into Flow Volume Process Flow Out To DownUnit Volume
Stream Unit Volume
273 K. ice formation stops and the layer of deposited ice begins to melt while water ice continues to be deposited ina liquid form. Surface tension draws the liquid water into the ice layer, at first densifymg the layer since theuuiderlying surface remains below freezing, then melting it. When the interstitial spaces between the remaining ice isfull, water begins to nun off the bed and can be collected. Eventually, all the ice melts and liquid condensationoccurs directly on the heat exchanger surfaces for surface temperatures below the dew point.
II. System Modeling
Heat and mass transfer can be treated at the system level as a "black box" where heat and mass are transferred basedon an understanding of the system efficiency. While this type of model works well for doing system trades for firstorder design [ 10], a higher fidelity system model that captures the details of local heat and mass transfer is requiredin order to validate the larger systemic parametric efforts, to refine assessments of system performance, and supportdesign revision and optimization. To this end, a modeling methodology was developed for each of the describedsubsystems. This paper primarily speaks to development of the relevant heat and mass transport and energy storagecharacteristics of each subsystem with the intent that they can be coupled with the solid conduction analysiscapabilities of a general purpose thermal analyzer. The specific set of thermal software chosen for implementation ofthis modeling methodology is C&R Technologies Thermal Desktop® 5.x2 patch 5 with SINDA/FLUINT patchlevel 7. This allows for development of a detailed, discretized thernial model of the MTSA subsystem and localizeddescriptions of the physical processes that occur within the subassembly.
A. Sorbent Bed1. Sorbent Bed Discreti°ation
The methods developed for modeling mass andheat transfer through the sorbent bed are basedon the flow and thermal characteristics of aflow through a porous media. Modeling offlow through a porous media is significantlydifferent from free internal flow. In free internalflow, resistances are exerted only from thewalls of the enclosure resulting in ahydrodynamically developing flour gradientalong the duct, however, in a porous media, thedistributed surface area and associatedresistance results in a near constant velocityprofile throu gh the bed. This flow propertyallows for discretization of the flow to bepaired with thermal discretization of the sorbentbed media. A conceptual view of such adiscretized flow as developed in ThermalDesktop for a rectangular sorbent bed is shownin Figure 5.
The blue path labeled "common inlet fromsystem" contains the total input mass flow rate.This flow splits into smaller parallel flows inthe red paths and continues through thediscretized volumes ; dV, shown in blue. Figure6 shows a detailed view of a representativediscretized volume. As in Figure 5, the primaryflow through the volume is represented in redand contains the resistance to bulk flow throughthe volume. The primary flow path is thermallyconnected via the green Thermal Desktop tie tothe unit volume solid thermal mass, which isshown in blue. CO, mass transfer is handled Figure 6. Flow and heat transfer specifics at each discretized unit.
American Institute of Aeronautics and Astronautics

in the light blue path which connects the primary process flow to a stora ge tank which represents a CO 2 massstorage potential of the unit volume. Since adsorbed CO 2 mass is held in intimate contact with the sorbent bed, thestorage tank is thermally shorted to the nodal mass by a tie with a large conductance.
2. Sorbent Bed Material Properties
The primary parameters of interest in the sorbent bed are the thermal conductivity and the specific heat of the bedmaterials. The DuocelCR open cell aluminum substrate to which the NaX washcoat is applied is a 40 pores per inchfoam with 8% density manufactured by ERG aerospace. The composite density of this bed is the sum of the foammass per unit volume which is 216.5 kg/m3 at 8% density plus the calculated effective density of the NaX sorbent.The effective density of the sorbent can be determined as the difference in mass before and after wash coatingdivided by the volume of the sorbent bed. From testing [5], the effective sorbent density has been calculated to be77 kg/m3 on average, resulting in a total effective density of 293.5 kg/m 3 . Since NaX washcoat is a small fraction ofthe total bed mass, about 25%, and its specific heat can be presumed on the order of aluminum, the published valueof 896 J/kg-K for Al 6061 can be used with an expected error of less than 10%. The thermal conductivity of thisfoam is approximately 10.0 W/m-K as reported by the manufacturer [9]. While the thermal conductivity of the NaXwashcoat is unknown, it is a ceramic like material and can be expected to have thermal conductivity of 1-2 orders ofmagnitude lower than Aluminum. This paired with the low mass fraction of washcoat allows direct use of the foamthermal conductivity for the composite bed thermal conductivity.
Since the flow is being modeled directly and the rates are known, the latent heat of desorption for CO2 can beapplied to the fluid storage tank (or nodal mass for model stability) by multiplying the flow rate times theadsorption/ desorption energy to give an accurate input heat rate for the control volume.
3. Adsorption Mass Transfer and Associated Control Logic
Per the assumptions of a porous media, the flow into the bed is presumed to be equally distributed at the inlet. Thiswould indeed mimic the design intent to efficiently use the sorbent in the bed. Thermal gradients in the bed willoccur, especially as the current baseline assumes the bed is cooled by the SHX on one side only. Since the loadingcapacity of the sorbent is dependant on temperature there is the possibility for small amounts of cross flow,however, since the mass fraction of CO2 in the process flow is small, the effect of these cross flows is considerednegligible and the flows can be tracked independently. Thus at the inlet the flow into a unit volume is:
dA^ross,avYl2 dvtn — mo tor (1)` ffoss,tot
Where Across. tot is the total cross sectional area and dA is the cross section of the unit volume. Since all of the unitvolumes can be divided into equal cross section areas (and length) the mass flow in to each unit volume at the inletis equal. This mass flow rate passes through each of the subsequent paths minus the portion of CO 2 removed.
In previous studies with this sorbent; downstream measurements indicate that the process flow exits the bed fullydepleted of CO2 until breakthrou gh occurs at which point the outlet CO2 mass fraction approaches the inlet value.From this we assume that the flow reaches quasi-equilibrium with the bed over small distances relative to the beddimensions. This assumption enables a key assumption in the modeling. The developed adsorption logic is designedto achieve and maintain levels of bed loading durin g the adsorption cycle. This is to say that the bed seeksequilibrium with the local flow without considering a diffusion rate limit. The first step in any of the logic paths is todetermine the loading for a given unit volume. This loading capacity of the sorbent bed is qualified in terms of themass of loaded CO, to the mass of the dry, unladened sorbent as functions of pressure and temperature (which canbe determined empirically for our assumed design [5]). With equal sized discretized volumes the sorbent mass isdivided equally among n discretized volumes. The unit volume sorbent mass is paired with a tabular form of thesorbent performance data to give the saturated capacity of the control volume, in 5, This value is compared to thecurrent amount of CO2 mass stored in the volume, mt2 „k, to determine the loading fraction by the equation:
American Institute of Aeronautics and Astronautics
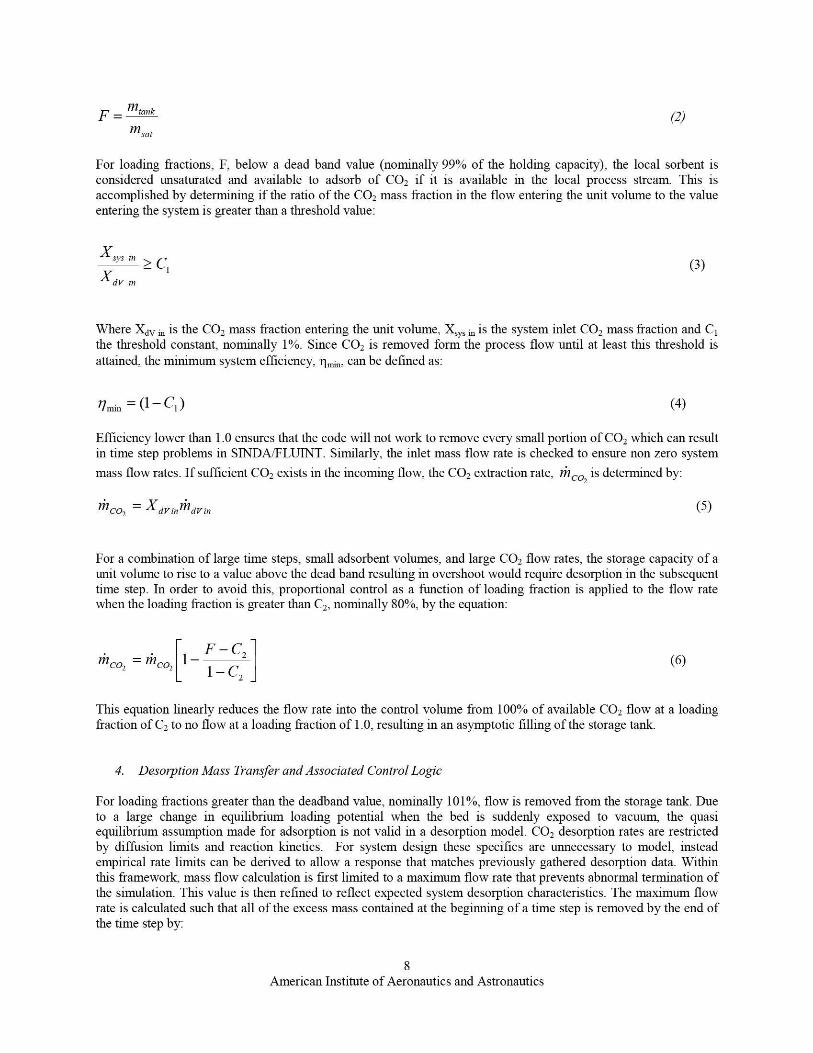
F= mtank (2)Msat
For loading fractions, F, below a dead band value (nominally 99% of the holdin g capacity), the local sorbent isconsidered unsaturated and available to adsorb of CO 2 if it is available in the local process stream. This isaccomplished by determining if the ratio of the CO 2 mass fraction in the flow entering the unit volume to the valueentering the system is greater than a threshold value:
X sys to
XdV to
Where Xdv ;,, is the CO, mass fraction entering the unit volume, X Sy, ll] is the system inlet CO2 mass fraction and Clthe threshold constant, nominally M Since CO, is removed form the process flow until at least this threshold isattained, the minimum system efficiency, fl,,, i,,, can be defined as:
77min = (1 — Cl) (4)
Efficiency lower than 1.0 ensures that the code will not work to remove every small portion of CO 2 which can resultin time step problems in SINDA/FLUINT. Similarly, the inlet mass flow rate is checked to ensure non zero system
mass flow rates. If sufficient CO2 exists in the incoming flow, the CO2 extraction rate, MCO2 is determined by:
mco, = XdVm1hdVm (5)
For a combination of large time steps, small adsorbent volumes, and large CO, flow rates, the storage capacity of atilt volume to rise to a value above the dead band resulting in overshoot would require desorption in the subsequenttime step. In order to avoid this, proportional control as a function of loading fraction is applied to the flow ratewhen the loading fraction is greater than C 2 , nominally 80%, by the equation:
F-C2( )mCOZ = mCO 1— 6
1 -C2
This equation linearly reduces the flow rate into the control volume from 100% of available CO 2 flow at a loadingfraction of C2 to no flow at a loading fraction of 1.0, resulting in an asymptotic filling of the storage tank.
4. Desorption Mass Transfer and Associated Control Logic
For loading fractions greater than the deadband value ; nominally 101%, flow is removed from the storage tank. Dueto a large change in equilibrium loading potential when the bed is suddenly exposed to vacuum, the quasiequilibrium assumption made for adsorption is not valid in a desorption model. CO2 desorption rates are restrictedby diffusion limits and reaction kinetics. For system design these specifics are unnecessary to model, insteadempirical rate limits can be derived to allow a response that matches previously gathered desorption data. Withinthis framework, mass flow calculation is first limited to a maximum flow rate that prevents abnormal termination ofthe simulation. This value is then refined to reflect expected system desorption characteristics. The maximum flowrate is calculated such that all of the excess mass contained at the beginning of a time step is removed by the end ofthe time step by:
American Institute of Aeronautics and Astronautics

C3 (M.t — m t.,& I
to -to
In this equation t„ is the time at the current timestep and t o previous time step. The value of C3 is nominally 0.5 orless for two reasons. First, a tank can not have a negative volume as values of 1.0 or greater could cause for a fixedtime step. Second, time steps are not fixed so using the previous time step for calculation has some caveats. If thenext time step is smaller than the previous, less mass will be removed than expected. This is of little consequencesince the value is recalculated for the next time step. If the time step is larger however, the calculated flow wouldmore than empty the tank. Fortunately, a time step in SINDA/FLUINT is restricted to a 2x growth between timesteps ; snaking a multiplier of 0.5 appropriate.
Large flow rates from the storage tanks would occur under this methodology during the sudden exposure to vacuum.This flow rate could in turn increase the bed pressure such that the next iteration would require adsorption causinginstability in the model. To avoid this, a limiting equation is developed in lieu of a diffusion linut by:
th — C4
(8)CO219
Where n is the number of control volumes in the model and:
_ nominal inlet flow rate * desorb cycle time * C3C4
minimum desired desorption time (9)
The parameters in this or a similar equation will be derived as needed to yield expected desorption performance
5. Heat Transfer in the Sorbent Bed
There are two sources for heat transfer in the sorbent bed model, convection from the warm process flow to the bedand adsorption/ desorption energy. Sorption energy is applied to the mass containing node of the control volume bythe equation:
1dV — ih o, h, (10)
Where qdY is the applied heat rate to the unit volume and h, is the latent heat of desorption. Convection in the
volume is handled via a volumetric heat transfer coefficient h, j (W/m3-K).
4dV hvod d V (T fdotia — Tbed )
(11)
Where Tfl,,, is the local flow temperature and Ts ed is the local bed temperature. The volumetric heat transfercoefficient can be determined from a correlation derived from experimental data for Doucel® foams of similarhydraulic diameters by the equation [11]:
Nu,j = b, Reap (12)
In this equation, b, is 0.325 and b, is 0.601 for 5% dense foam, which is considered sufficiently close to the 8%dense foam used in this design. In addition to heat loads in the sorbent bed media, there are loads imposed on thebed by the sublimation and condensing ice heat exchangers that are described in the following sections.
American Institute of Aeronautics and Astronautics

B. Sublimation Heat Exchanger
1. Sublimation Mass Transfer
The role of the SHX is to remove energy from the MTSA system. In this process, energy is moved across thesorbent bed to a cooled surface, the energy is removed from the surface by sublimation from a layer of ice, and aflow of evolved gas exits the system through an exhaust duct to lunar vacuum. The active component of the SHXconsists of a surface of area, A 5 , on to which water is sprayed. Feed water is supplied to one or more nozzles at atemperature of --280 K and a pressure of 1 atm (101 kPa) where it undergoes an isenthalpic expansion to thechamber pressure. For pressures that bring the temperature below the triple point, the liquid water transforms into asolid/ vapor mixture with a quality near 0.15. The solid fraction, 0. 85, can be considered to be evenly distributedover the SHX surface, while the remaining vapor is presumed to take no further part in energy exchange and isincorporated into the exit duct flow. When the deposited layer of ice is thin (as is an objective of the design), thetemperature of the ice surface, T s , exposed to the sublimation chamber can be considered equal to that of the heatexchanger surface. For a given ice surface temperature, the equilibrium ice surface pressure, P s , can be determinedby a formula attributed to Wexler [12]:
4ln(P )_ Jk;T`-' +k5 1nT (13)
=o
Where ko = -5.86x10 3 ,k1 = 2.23x101, k, = 1.39x10⁻² , k3 = -3.42x10-', k4 = 2.70x10⁻⁸ and k5 = 6.70x10-'
Similar to the mechanism by which a temperature difference serves as the driving potential for heat transfer from asurface to a fluid, a mass transfer process is governed by a pressure difference. When the pressure in the sublimationchamber is lower than the ice surface pressure, water vapor sublimates from the ice surface in an isothermalexpansion while the associated phase change results in energy transfer from the ice surface at a rate defined by theequation:
q = mAh (14)
Where q is the heat load rejected from the system, m is the surface mass flow and Ali the phase change enthalpyfor ice, which is approximately 2840 kJ/kg at 235 K. This mass flow rate can be expressed as [13]:
— A,ae. (P —P,,,v)(1 5 )15
2rrRg^,,TS
Where PS is the ice surface equilibrium pressure at the ice surface temperature T 5 , Penv is the environment pressure,R... is the individual gas constant for water, and a e is the evaporation coefficient. The evaporation coefficient canhave a value between 0 and 1 and essentially accounts for inefficiency in the mass transfer process thought to occurdue to collisions between sublimating molecules and molecules in the environment. For a high vacuum environmentat 214 K, the value was shown to be approximately 0.07 with values increasing to 0.11 at hi gher temperatures. Forthe purposes of this modeling, 0.07 is used. Equation 15 can be used to express the chamber pressure, P e14, requiredto reject a given n.i at a given Ts. In addition, the phase change process and the pressure drop across the SHXchamber that carries the flow to the environment are both isothernal processes such that the gas temperature in theSHX chamber equals T 5 . These values serve as inlet conditions to the resulting exit duct flow.
2. bent Duct Flow
The exit duct forms the final link in removing energy from the sorbent bed. This process, like the mass transfer thatprecedes it, requires a pressure drop to move the gas from the duct inlet to the duct exit. The expansion of an idealgas through a constant area duct to a vacuum can be characterized as frictional adiabatic flow. This process isneither isentopic nor isenthalpic; it is instead characterized as a fanno-line flow. In this type of flow the conditions
10
American Institute of Aeronautics and Astronautics

at the exit (temperature, pressure, and density) are dependant on the inlet conditions; the amount of friction forceexerted on the flow by the duct along the path, the duct length and its hydraulic diameter. An analysis of this typebegins with one important parameter assigned. Since the flow is vented to a vacuum, the flow accelerates to thesonic velocity at the exit of the duct. This can also be described as having an exit Mach number, M, of unity. TheMach number is defined as local velocity, V. divided by the local sonic velocity, c. [14]. Assumin g the flow in theduct is an ideal gas, the sonic velocity is defined by:
c = TRgas y (16)
Where T is the local temperature, and y is the ratio of specific heats, C p/C,,, which has a value of 1.3 for water. Thelocal velocity is determined by the continuity equation:
V= m (17)Ad P
Where Ad is the duct cross sectional area and p is the local flow density as determined by the ideal gas law. Forflow of this type, the Mach number at the inlet of the duct can be related to the length of the duct, L omax, the hydraulic
diameter, D 11 , and the average friction factor, f by:
L.J _ 1—M 2 + 7+1 In
(7+1^wl
D),_^27
27 21+ Y-12
2
In this equation the Mach number based on the inlet conditions. Furthermore, since the Reynolds number is expectedto be on the order of 100 or less, the flow is laminar and the friction factor is 64/Re. In practice the value of thefriction factor is approximated for the duct inlet properties.
3. Mass Flow Regimes
For a given duct hydraulic diameter, combination of Eqns. 16 through 18 yields an expression that relates therequired duct inlet parameters, T i„ and Pi„ that satisfy the outlet condition of sonic flow for a given duct geometryand value of Mn . These parameters are explicitly expressed by the heat and mass transfer derivation. I-lien ^2 issuch that conditions of T, and P, are equivalent to T i„ and Pi,,, the capacity of the system to reject mass flow isequal to the amount of flow generated. In this state, the system can be described as operating at the critical massflow rate.
In application, the provided mass flow may be lower than this critical mass flow rate, called a sub-critical mass flowrate. In this case, the supplied solid coolant mass still sublimates, but Eq. 14 dictates that the removed heat ratescales with the sublimation rate. For a fixed sorbent bed resistance, a reduced heat transfer rate results in a highervalue for the SHX surface temperature, and thus Ts (assuming, again, the ice layer is thin). An increased T s in turnresults in a greater P, and from Eq. 1.5 the process can take place at a higher environment pressure. On the duct side,reduced mass flow reduces the value of P i„ needed to move the flow through the duct. Thus, at subcritical mass flowrates, a state change occurs where P,reduces to Pi,, through an isenthalpic expansion. Due to the small change ininternal energy at these low pressures this expansion is approximately an isothermal one. In short, the rejected watervapor (both sublimated and the original -- 15% by mass supplied in the coolant feed) undergoes an uncontrolledexpansion in the sublimation chamber which ali gns the inlet conditions with those required to yreject the flow fromthe duct.
(18)
11
American Institute of Aeronautics and Astronautics

Conversely, for supercritical mass flow rates through the duct, the required duct inlet pressure. P i,,, would be higherthan the value of P e required to drive all of the deposited mass flow from the SHX surface. In this case P, againequals P i„ and mass flow is limited to the critical mass flow rate, with one difference. While part of the additionalmass flow can be deposited as an ice layer on the sublimation surface, the additional gas evolved during theisenthalpic expansion in the nozzle must still exit the system. This results in a reduced allowance for sublimationmass which results in operation below the critical mass and heat rejection rates. This effect is initially minimal forflow rates less than a few times the critical flow rate due to the 0.15 quality that enters the sublimation chamber, butover time can be compounded by reduced surface temperature if the accumulated ice layer becomes thick enough toachieve significant thermal resistance. From a system view, inlet (nozzle) mass flow rates above the critical massflow rate result in no change in outlet mass flow (from the duct) and result in reduced heat rejection from thesystem.
C. Condensing Ice Heat Exchanger
1. Heat and Mass Transfer- Modeling MethodologyThe primary modeling challenge in the CIHX is the simulation of both the effects of heat and mass transfer to andthrough the heat exchanger surface. To this end, heat and mass transfer relationships could be developed and directlyimplemented in any progranuning lan guage. However SINDA/FLUINT, the solution engine for Thermal Desktop,contains routines for handling both heat and condensation mass transfer suitable to this task. The applicableSINDA/FLUINT formulation is detailed in this section.
Convection heat transfer form the vapor flow is handled by the general heat transfer equation:
LI"
= h,, ^Tbrlk — T
(19)
Where hv is the vapor heat transfer coefficient, Ts„lk is the local nuxed mean fluid temperature and Ti is the localinterface temperature. The heat transfer coefficient is developed from standard Nusselt number correlations forlaminar, transitional, or turbulent flow based on Reynolds number. Flows in the CIHX are expected to be in thelaminar regime [6].
Mass transfer in SINDA/FLUINT is handled in a generally applicable heat to mass transfer parallel known as theChilton-Coulburn analogy. In this formulation, the local mass flux on a surface in contact with a fluid carrying acondensable species is described as a function of total and constituent states including density, p, and pressure P, aswell as fluid properties including mass diffusivity, D AB , thermal conductivity, and specific heat by the equation[17]:
ANCGi 2
Yli
In ^2] s
,
k= j1 * ^
PTO ^Jc ^c PNCGm ^ p * C ,k (20)^ ^PCm — Pci^ PNCGx _PNCG PNCGi PNCGI DAB
In this formulation, the subscript c^ denotes concentration in the free stream: c i is the concentration at the interface,tot is total rather than partial pressure, and NCG refers to a non condensable gas. Properties are evaluated at free streamconditions unless otherwise noted. In this equation all of the terms on the right hand side other than (pc. — pc,) can
be combined to form a term analogous to a heat transfer coefficient, while (pc. — pc_) is the gradient which drives
the mass transfer. In Eqn. 24, the mass diffusivity is estimated by [17]:
12
American Institute of Aeronautics and Astronautics

_ 10--3 T I.75IM
\A
+ MB I7^M\113]2AMB )
DAB P",[(I V JA / 3+ (Y V IB
Where MA and MB are the molecular masses of the non condensable gas and water constituents, and EV A and EVBare the diffusion volumes. Since heat transfer and mass transfer effects superpose, the mass transfer equation can bethought to operate in parallel with the heat transfer equation. The phase change energy associated with thecondensation that accompanies this mass flow can be described by:
q" — iW Ahfe (22)
Where hf,^ is the enthalpy difference between the gas and fluid phases. Note that the heat and mass transferequations are evaluated at interface conditions. When a condensate is present; this interface is the liquid to vaporinterface, allowing for the effect of an additional film resistance that occurs at the surface. Heat flow through thisresistance can be termed as:
4" — hflin (T — T vall ) (23)
Where Twall is the actual solid surface temperature and hf;lm is the condensation heat transfer coefficient based onRohsenow's correlation. In practice this resistance is automatically calculated and applied by the SINDA/FLUINTcommand ROHSEN [17]. While a condensate is present, the resulting series/ parallel arrangement of resistances toheat and mass transfer can be represented in a resistance network as shown in Figure 7.
Bulk fluidflow Tbulk, PC-
Heat exchanger surface
Figure 7. Series / parallel energy conduction description from a flow with condensate to the heat exchangersurfaces.
In this network, T j is unknown and must be iteratively solved by equating the sum of the heat flows from the heatand mass transfer equations with the condensation heat flow [17]:
hfly„ (T. - T,,ll) = m"Ahfg + h„ ^T̂ bulk - T) (24)
When ice is present h f,,,,, is driven to a large value and functionally replaced with the resistance through thedeposited ice layer.
(21)
13
American Institute of Aeronautics and Astronautics

2. Ice Formation and PropertiesThe mass transfer descriptions discussed above only describe the rate at which mass is deposited on the heatexchanger surfaces, the particular form of the deposition on surfaces is a separate matter. The final resistance to heattransfer in the CIHX as shown in Figure 7 is the ice resistance. Literature revealed no nondimensional correlationsfor ice properties for internal flows. The bulk of literature speaks to formation of ice on flat plates in external flow.While an external flow description may not be applicable in determining mass transfer, it is thought that theparameters of the formed ice should be independent of the particulars of the transport mechanism and are moredependant on properties such as the temperature under which the formation occurred, the amount of time that the icehas persisted, and the resultin g density of the ice. This view is consistent with literature, and a collection of sourcesfor ice properties given by Mago and Sherif [7] are used in modeling.
Ice density is very difficult to characterize. It is known that deposited ice begins as very low density hair-likestructures which densifies as crystals grow at all depths in the ice layer due to penetration of moist gas andsublimation and redeposition of existing ice. For the case of deposition on time scales shorter than that in whichsignificant redeposition can occur, a frost density function derived as a sole function of temperature has beenproposed by Hayashi [18]:
p f = 650 exp(0.227T,,,a11 ) (25)
Where pf is the frost (ice) density and T,,,ail is the ice surface temperature in degrees Celsius. This equation isrecommended for application in air under the following conditions: frost surface temperature between -25 and 0°C,(248 K and 273 K), airstream velocities between 2 and 6 m/s, and an airstream humidity ratio equal to 0.0075kg,/kg, (or absolute humidity of 0.75%). It is unknown whether the continuous temperature change in the depositiontemperature and the time frame will have a large effect on the ice density for the CIHX. Note that this compares toan absolute humidity of 3.5% or less for the CIHX which may alter this dependence. Additional consideration of theapplication of this correlation may be necessary if this resistance is found to be a dominant resistance. Also note thatfor 273 K. this equation yields an ice density of 650 kg,," in
3 , as compared to the value for fully dense ice of 919kg/m3 . This implies that under no condition is the ice applied or densified to a smooth; fully dense layer. While thiscorrelation was developed for use in air at atmospheric pressure, it is expected to be applicable for Oxygen atreduced temperature.
For the frost thermal conductivity kf, an empirical correlation proposed by Yonko and Sepsy [19] is applied. Thiscorrelation is given by the equation:
kf = 0.0242 + (0.000723p f )+ (0.00000118P 2 ) (26)
This correlation is valid for frost densities less than 573 kg/m3 corresponding to 272.45 K in Eqn. 30. The resultingconductivity at this temperature from the equation is 0.82 W/m-K. This compares to reported values of 1.8 to 2.3W./m-K for fully dense ice at --273 K. This is expected since frost is not deposited as solid, void free ice at anytemperature. Figure 8 demonstrates a methodology developed to correct the values of density and conductivity astemperatures reach the melting temperature and surface tension densifies the ice by drawing liquid into the frostlayer. The known values for ice density and conductivity at 273 K and the equation values up to 272.45 K areapplied in the model and values are linearly interpolated between. This is implemented in SINDA/FLUINT byentering the data in a tabular form where it is automatically interpolated for use in calculation.
14American Institute of Aeronautics and Astronautics

Density and Thermal Conductivity forDeposited Frost Near the Melting Point
1000 3
t Full density ice alteration900
* Density Equation (Left Axis)2.5
800 —41^— Full density ice conductivity alteration
700 —4*— Conductivity Equation (Right axis) Y
6002E
rn500 1.5
^,
•Zn
400cm a°
300n 1 o
U
2000.5
1DD
D 0
270 271 272 273 274
Temperature (Fn
Figure 8. Density and Thermal Conductivity based on given equations and altered properties based on fullydense ice at 273 K.
With the density of the ice layer calculated, the resulting ice thickness is determined from:
Ice thickness = mice
pfA,
where pf is the ice density and mire is the mass of ice stored in the domain, and As is the surface of that domain.
3. Implementation in SINDAIFLUINT
By default, all flows are homogeneous in SMA/FLUINT. Thus all constituents, in any phase, travel at the samevelocity as illustrated in Figure 9 (left). Condensate on a wall violates this assumption, since the condensate does nottravel with the flow or does so much slower than the vapor flow. This situation requires that either the condensatemass be entirely removed from the flow, or by allowing slip flow between the gaseous and liquid phases. Slip flowis modeled in SINDA,-FLUINT via the use of path twinning. Twinning of paths allows vapor and liquid phase pathsto have differing velocities and is shown at the right in Figure 9. This is often used for describing annular flows.This mechanism is also applicable to the description of the case of the CIHX. When the wall temperature is abovefreezing and below the dew point, water will condense on the walls and, due to surface tension, will travel at avelocity much slower than the interior gaseous flow. If this movement is quick enough, it will simulate the removalof the water from the system via gravity. This functionality can also be simulated by species specific suction if theaccumulated thickness is considered too great.
(27)
15
American Institute of Aeronautics and Astronautics

Vapor
Liquid 016=Homogeneous Flow Ship Flow
Figure 9. Graphical description of slip flow allowed by a twinned path. [17]
Modeling of the CIHX gets more complicated at and below the freezing temperature. In general ; FLUINT does nothandle solids. In the case of phase change to a solid, several approximations are used to make a liquidthermodynamically similar to a solid. First, the viscosity at and below freezing is dramatically increased, to the pointthat only very slow movement of the "solid fluid" on the wall occurs. To account for the freezing/sublimationenergy, the specific heat is increased over a small temperature range. When integrated, this localized spike equalsthe freezing/sublimation energy. Below the freezing temperature, the specific heat is that of solid ice.
This given formulation accounts for heat and mass transfer from the fluid to the wall/ "solid fluid" interface, as wellas energy storage and heat transport duough the developed ice layer. However a significant hurdle remains in thatC&R reports that the SINDA/FLUINT "solid fluid" approximation breaks down at temperature near 2.58 K due tothe reliance of SINDA/FLUINT on NIST's REFPROP data where as the initial temperature of the CIHX is 235 K.At temperatures below 258 K, one of the properties calculated to develop the mass transfer results in a fatal errorand the simulation terminates.
Fortunately, the equilibrium vapor pressure at 258 K is very low, thus the mass transfer rate from a warm saturatedflow is largely unaffected by temperatures less than this value. A method is proposed involving temperature andproperty transformations to keep the simulated temperatures above 258 K during simulation while accounting foralmost all of the mass transfer as well as most of the energy storage and heat transfer that would occur below thislimit temperature. In this method, the properties of all model materials and fluids are transformed over a temperaturerange of interest.
In this case of the CIHX, in order to keep temperatures above 258 K, the temperatures in the range of 235 K to265 K (a 30 K difference), are transformed (mapped) to a temperature between 260 and 265K, a 5 K difference. Thisratio, 6 to 1 is then applied to the material properties of specific heat and conductivity in the transformed range. Forspecific heat, this ensures that the total integrated thermal mass is maintained at the transformed temperatures.Performing this transformation on the thermal conductivity likewise results in a larger heat transfer coefficient inEquation 23, offsetting the proportionally smaller difference in temperature. Since mass flow rate is directlyproportional to the heat transfer rate as seen in Equation 24, this transformation is likewise carried over to masstransfer.
This transformation does give rise to two inaccuracies. First, while the material and gas properties are simple totransform due to their simple description in material and fluid databases, the water description is extremelycomplicated and transformation is not practical. Since the majority of the energy change between water as a vaporat 283 K and a solid at 265 K occurs in the phase changes, the effect on energy storage will vary minimally. Thelarger effect is in the amount of mass transferred. The mass transferred in Eq. 24 is a function of the difference in thefree stream and saturation densities at the liquid (or solid) to vapor interface. Since these pressures can not betransformed (both due to complexity of this operation and for the reason that FLUINT can not handle lower
16American Institute of Aeronautics and Astronautics

temperatures than 258 K) vapor pressures in the transformed range will be erroneously high. This error is highest atthe minimum transformation temperature and is estimated to be a maximum of 15% for a surface at 235 K. Since theflow is a mixture of gas and water, the composite error is somewhat less due to the correct transformation of gasproperties. The effect on the system energy balance is expected to be even lower since most of the water is expectedto be removed within the CIHX, in this case somewhat further from the inlet.
III. Conclusions
Sublimation, condensing/icing/melting, and flow throu gh sorbent media (and the associated energy exchange) are allvery complicated processes. Modeling any one of the processes that are experienced in the MTSA subassembly is achallenge in itself Integrating their operation and capturing the coupling effects in a single thermal model is afurther challenge. However, modeling to this level of detail is required if design optimization is to be realized,affording our space suit systems with light weight and efficient technology. Unfortunately, modelin g tools such asSINDA/FLUINT and the Thermal Desktop interface do not have native routines for all of the physics that areneeded to properly simulate the operation of the MTSA subassembly.
To address this, the methods presented lay the framework for describing the heat and mass exchange processes thatoccur in the three primary components of the MTSA subassembly. The described equations and logic can now beused to develop Thermal Desktop verification models which contain simplified geometry, boundary conditions, andflow inputs. These interim models verify operation of the code developed to simulate the physics of the threeseparate processes.
Each of the modeling methods contain assumptions that will require inputs or verification from testing. For example,the quasi-equilibrium adsorption assumption over predicts the rate at which the sorbent bed can adsorb COz andlimit rates for desorption are to date unknown. The density and thermal conductivity correlations assumed fordeposited CIHX ice may result in more or less thermal resistance that will occur under MTSA conditions. In theSHX, the evaporation coefficient is poorly characterized yet key in the rate of heat removal from the system. In eachof these cases the modeling methodologies allow for input of conservative values for the purposes of design andlater refinement of those inputs as test data allows. Development of the interim models is expected to give insightinto the design of possible intermediate tests aimed at refining model inputs and suggest testing procedures andinstrumentation that can support model calibration.
The next step in the modeling process will be to build an integrated MTSA subassembly model. The verified codefrom the interim models will be applied to the relevant heat exchange surfaces and sorbent volumes in a fullydiseretized thermal model of the MTSA subassembly with geometry that represents the next design iteration. Tosimulate the operation of the full, two bed MTSA s -stem, the completed subassembly model will be given inputsfrom a previously developed transient MTSA system model [10]. These simulations (the transient system model andthe discretized model) allow evaluation of geometric and other design parameters in order to influence design of aprototype to be tested in a relevant environment later this year. Test data from this prototype will be used to verifyand validate the developed subassembly and system models.
Several studies have been conducted to evaluate the feasibility of MTSA technology as well as simulateperforniance to influence the first design concepts. Implementation of the developed modeling methodologies is thenext step in generating higher fidelity models that will allow a more realistic evaluation and design of a prototype—quality piece of hardware.
17American Institute of Aeronautics and Astronautics
References'Iaconini, C. S., MacCallun, T., Morin, T, Straub-Lopez, K., Paul, H. L., "Martian Liquid CO2 and Metabolic Heat
Regenerated Temperature Swing Adsorption for Portable Life Support Systems," Space Technology and ApplicationsInternational Forum (STAIF) 2007, Albuquerque, N.M., Feb 11-15, 2007-
2lacomini, C. S., Powers, A., Bower, C., Straub-Lopez, K., Anderson, G., MacCallum, T., Paul. H. L., "Model CalibrationExperiments in Support of Metabolic Heat Regenerated Temperature Swing Adsorption Technology," 37th InternationalConference on Environmental Svstenrs, Chicago, IL, 2007-01-3273, 2007.
3Iacomini, C. S., Powers, A., Dunham, J., Straub-Lopez, K., Anderson, G., MacCallurn, T., Paul, H. L., "Demonstration ofMetabolic Heat Regenerated Temperature Swing Adsorption Technology," 37th International Conference on EnvironmentalSvstenrs, Chicago, IL, 2007-01-3274 7 2007.
'Iacomini, C. S., Powers, A., Lewis, M., Waguespack, G., Conger, B., Paul, H. L., "Testing, Modeling and System Impact ofMetabolic Heat Regenerated Temperature Swing Adsorption," 38th International Conference on Environmental Svstenrs, SanFrancisco, CA, 2008-01-2116, 2008.
SIacomini, C. S., Powers, A., and Paul, H. L., "PLSS Scale Demonstration of MTSA Temperature Swing Adsorption BedConcept for CO2 Removal/Rejection", 2009-01-2388, 39th International Conference on Environmental Systems, Savannah, GA,July 12 -July 16, 2009.
6Padilla, S., Powers, A., Ball, T., Iacomini, C. S., and Paul, H. L., "Investigation of Condensing Ice Heat Exchangers forMTSA Technology Development", 2009-01-2387, 39th International Conference on Environmental Systems, Savannah, GA,July 12 -July 16, 2009.
7Mago, P. J., Sherif, S.A,. "Frost formation and heat transfer on a cold surface in ice fog," International Journal ofRefrigeration, 28, (2005), 538-546.
8 Reference data for the wash coating data of aluminum.
9ERG Aerospace, "Duocel Alu nninun Foam," [online brochure]http://www.ergaerosi)ace.corn/foarnproi)erties,,'literature/ere duocelxdf [Cited January 20101
10Iacomini, C. S., Powers, A., Speight, G., Padilla, S., and Pual, H. L., " Transient Modeling and Analysis of a Metabolic Heat-Regenerated Temperature Swing Adsorption (MTSA) System for a PLSS," , 40th International Conference on EnvironmentalSystems, Barcelona, Spann, 2010-XX-XXXX, 2010.
11Hwang, G.-J., Yeh, R.-H., and Chao, C.-H., "Measurement of interstitial convective heat transfer and frictional drag for flowacross metal foams," Trans. ASME, February 2002, 124,120-129.
12 Hardy, B., "Its-90 Fornnulations For Vapor Pressure, Frostpoint Temperature, Dewpoint Temperature, And EnhancementFactors In The Range -100 To +100 C," The Proceedings of the Third International Synpositun on Humidity & Moisture, April1998.
13Novikov, P. A., "Rate OF Sublimation Of Ice At Low Pressures," Translasted from Inzhenerno-Fizicheskii Zhurnal, Vol. 17,No. 5, pp. 861-865, November 1969-
14Fox, R. W., McDonald, A., Introduction to Fluid Mechanics, John Wiley & Sons, Inc., Ney York, 1998, Chap. 12.15Korea Thernnophysical Properties Data Bank, "Temperature Dependent Properties: Low P Gas Viscosity of WATER",
Cherrrical Engineering Research Information Center [online database], URL:http://www.cheric.org/research/kdb/licprop/sliowcoefplip?cnrpid=1914&prop=VSG [Cited January 2010].
16Powers, A., "8029006NCTest Article Design Memo Final," June 26, 2008.17Cullirnore, B. A., Ring, S. G., Johnson, D. A., "SINDA/FLUINT User's Manual," C&R Technologies, Littleton, Colorado,
Version 5.2, July 2009.18Hayashi, Y. K. Aoki, H. Y., "Study of Frost Formation Based on a Theoretical Model of The Frost Layer," Heat Transfer-
Jpn Res 6, No. 3, July-September, 1977, pp. 79-94.19Yonko, J.D., Sepsy, C.F., "An Investigation of The Thermal Conductivity of Frost While Forming on a Flat Horizontal
Plate," ASHRAE Trans 73, Part 2, June, Paper No. 2043, 1967, I.1.1.-I.1.11.
18American Institute of Aeronautics and Astronautics