Refraction. How can we see transparent objects? Reflection & Refraction.

RTO-MP-IST-056 19 - 1
UNCLASSIFIED/UNLIMITED
UNCLASSIFIED/UNLIMITED
Modeling of Ionospheric Refraction of UHF Radar Signals at High Latitudes
Brenton Watkins Geophysical Institute
University of Alaska Fairbanks USA
Sergei Maurits and Anton Kulchitsky Arctic Regions Supercomputing Center
University of Alaska USA
ABSTRACT
A three-dimensional ray-tracing code has been developed to run in-conjunction with the University of Alaska polar ionospheric model. The ionospheric model may be run in a real-time predictive mode and its outputs have been used as an input to the ray tracing code. The objective of this work is to compute refractive effects on UHF radar signals due to time-varying ionospheric structures at high latitudes. Radar range and pointing errors are calculated continuously during two 24-hour periods in this paper to demonstrate the effects from a time-varying ionosphere during quiet and moderately disturbed geomagnetic conditions. Radar pointing errors that correspond to target errors up to about 500m have been found for low antenna elevation radar pointing directions during moderately disturbed geomagnetic conditions.
1.0 INTRODUCTION
The University of Alaska polar ionospheric model1 may be operated in a real-time predictive mode. The objective of this work is to use this ionospheric model to develop a predictive capability for the range and azimuth-elevation target errors for UHF radars that are affected by ionospheric refraction. The ionospheric model is described in detail in a companion paper and will not be discussed here.
A three-dimensional ray tracing code has been developed that may be run in-conjunction with the ionospheric model. The ray-tracing code has been set to a frequency of 430MHz for this study due to applications pertaining to UHF radars in polar regions, however the code will also work at lower frequencies such as HF. The three-dimensional feature of the ray-tracing code permits studies of both vertical and lateral deviations in the ray directions in response to electron density gradients. To illustrate this capability we have chosen two 24-hour periods to simulate that correspond to quiet and moderately-disturbed geomagnetic conditions. The ionospheric model outputs are three-dimensional time-dependent arrays of electron density. The current ionospheric model used for this study covers the latitude range from 50 degrees north to the pole, and from 100km to 600km altitude.
2.0 GEOPHYSICAL TIME PERIODS FOR STUDY
Two 24-hour time periods were chosen that represent quiet and moderately disturbed geomagnetic conditions. The first 24-hour period selected for our study is October 7, 2003 that was a relatively quiet day. The second
Watkins, B.; Maurits, S.; Kulchitsky, A. (2006) Modeling of Ionospheric Refraction of UHF Radar Signals at High Latitudes. In Characterising the Ionosphere (pp. 19-1 – 19-14). Meeting Proceedings RTO-MP-IST-056, Paper 19. Neuilly-sur-Seine, France: RTO. Available from: http://www.rto.nato.int/abstracts.asp.

Report Documentation Page Form ApprovedOMB No. 0704-0188
Public reporting burden for the collection of information is estimated to average 1 hour per response, including the time for reviewing instructions, searching existing data sources, gathering andmaintaining the data needed, and completing and reviewing the collection of information. Send comments regarding this burden estimate or any other aspect of this collection of information,including suggestions for reducing this burden, to Washington Headquarters Services, Directorate for Information Operations and Reports, 1215 Jefferson Davis Highway, Suite 1204, ArlingtonVA 22202-4302. Respondents should be aware that notwithstanding any other provision of law, no person shall be subject to a penalty for failing to comply with a collection of information if itdoes not display a currently valid OMB control number.
1. REPORT DATE 01 JUN 2006
2. REPORT TYPE N/A
3. DATES COVERED -
4. TITLE AND SUBTITLE Modeling of Ionospheric Refraction of UHF Radar Signals at High Latitudes
5a. CONTRACT NUMBER
5b. GRANT NUMBER
5c. PROGRAM ELEMENT NUMBER
6. AUTHOR(S) 5d. PROJECT NUMBER
5e. TASK NUMBER
5f. WORK UNIT NUMBER
7. PERFORMING ORGANIZATION NAME(S) AND ADDRESS(ES) Geophysical Institute University of Alaska Fairbanks USA
8. PERFORMING ORGANIZATIONREPORT NUMBER
9. SPONSORING/MONITORING AGENCY NAME(S) AND ADDRESS(ES) 10. SPONSOR/MONITOR’S ACRONYM(S)
11. SPONSOR/MONITOR’S REPORT NUMBER(S)
12. DISTRIBUTION/AVAILABILITY STATEMENT Approved for public release, distribution unlimited
13. SUPPLEMENTARY NOTES See also ADM002065., The original document contains color images.
14. ABSTRACT
15. SUBJECT TERMS
16. SECURITY CLASSIFICATION OF: 17. LIMITATION OF ABSTRACT
UU
18. NUMBEROF PAGES
14
19a. NAME OFRESPONSIBLE PERSON
a. REPORT unclassified
b. ABSTRACT unclassified
c. THIS PAGE unclassified
Standard Form 298 (Rev. 8-98) Prescribed by ANSI Std Z39-18
Modeling of Ionospheric Refraction of UHF Radar Signals at High Latitudes
19 - 2 RTO-MP-IST-056
UNCLASSIFIED/UNLIMITED
UNCLASSIFIED/UNLIMITED
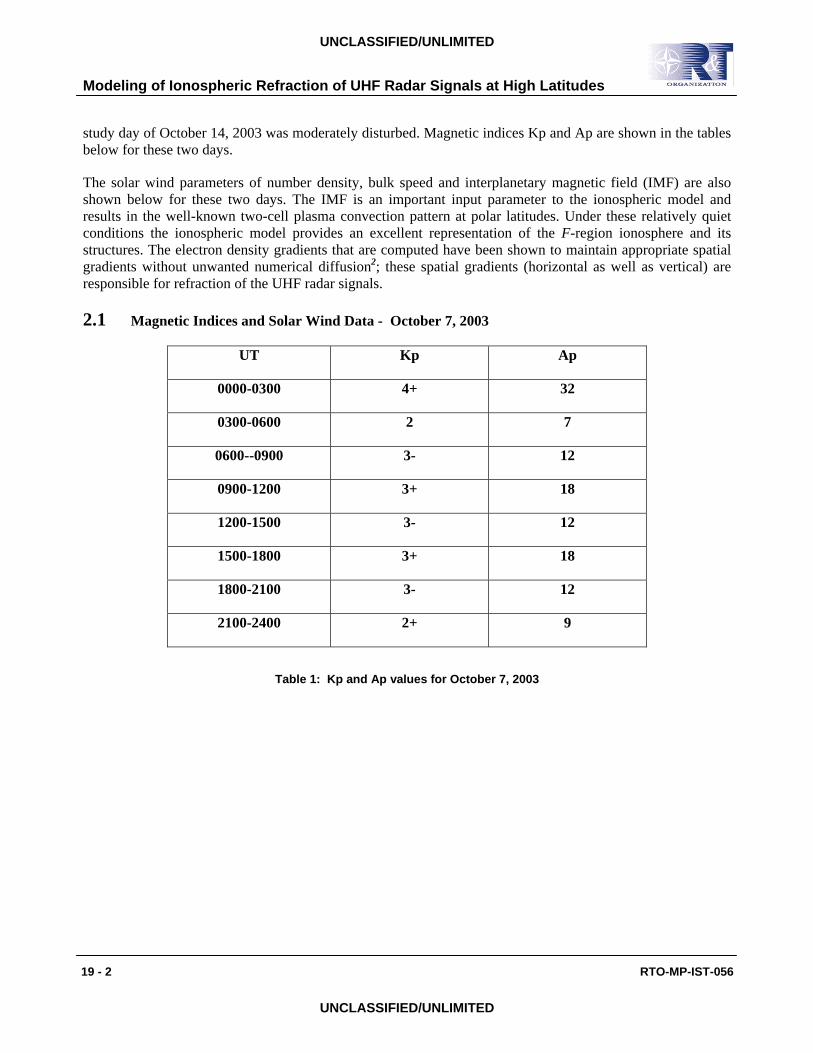
study day of October 14, 2003 was moderately disturbed. Magnetic indices Kp and Ap are shown in the tables below for these two days.
The solar wind parameters of number density, bulk speed and interplanetary magnetic field (IMF) are also shown below for these two days. The IMF is an important input parameter to the ionospheric model and results in the well-known two-cell plasma convection pattern at polar latitudes. Under these relatively quiet conditions the ionospheric model provides an excellent representation of the F-region ionosphere and its structures. The electron density gradients that are computed have been shown to maintain appropriate spatial gradients without unwanted numerical diffusion2; these spatial gradients (horizontal as well as vertical) are responsible for refraction of the UHF radar signals. 2.1 Magnetic Indices and Solar Wind Data - October 7, 2003
UT Kp Ap
0000-0300 4+ 32
0300-0600 2 7
0600--0900 3- 12
0900-1200 3+ 18
1200-1500 3- 12
1500-1800 3+ 18
1800-2100 3- 12
2100-2400 2+ 9
Table 1: Kp and Ap values for October 7, 2003

Modeling of Ionospheric Refraction of UHF Radar Signals at High Latitudes
RTO-MP-IST-056 19 - 3
UNCLASSIFIED/UNLIMITED
UNCLASSIFIED/UNLIMITED
Figure 1: Solar wind values - density, velocity, and IMF for October 7, 2003

Modeling of Ionospheric Refraction of UHF Radar Signals at High Latitudes
19 - 4 RTO-MP-IST-056
UNCLASSIFIED/UNLIMITED
UNCLASSIFIED/UNLIMITED
2.2 Magnetic Indices and Solar Wind Data - October 14, 2003
UT Kp Ap
0000-0300 3+ 18
0300-0600 4 27
0600--0900 6- 67
0900-1200 5 48
1200-1500 4+ 32
1500-1800 4+ 32
1800-2100 7+ 154
2100-2400 7+ 154
Table 2: Kp and Ap values for October 14, 2003

Modeling of Ionospheric Refraction of UHF Radar Signals at High Latitudes
RTO-MP-IST-056 19 - 5
UNCLASSIFIED/UNLIMITED
UNCLASSIFIED/UNLIMITED
Figure 2: Solar wind values - density, velocity, and IMF for October 14, 2003
3.0 THE RAY-TRACING APPLICATION
The ray-tracing code is used by first specifying two points in space that define the beginning and end point of the radio-wave signal path. For the application here one point is located on the earth’s surface; this corresponds to the location of a ground-based radar and in the examples presented in this paper we have used the coordinates of the UHF radar located in Alaska (63N, 150W). The end point of the radio-wave path chosen for the example in this paper is a target above the ionosphere; the azimuth direction is toward Thule, Greenland (76N, 68W). In addition various radar elevations angles have been used and in this paper we show results for 5 and 10 degrees radar antenna elevations.

Modeling of Ionospheric Refraction of UHF Radar Signals at High Latitudes
19 - 6 RTO-MP-IST-056
UNCLASSIFIED/UNLIMITED
UNCLASSIFIED/UNLIMITED
Figure 3: Convention for description of the wave deflection vector.
The ionosphere which is normally horizontally stratified tends to deflect the radio-wave beam downward and this is illustrated in figure 3. Along the entire path through the ionosphere the radio-wave may encounter different density values and gradients. The deflections are computed in small steps along the path and the final integrated defection is then stored at the end of the path. The magnitude of this total defection is measured in units of meters. While the ionosphere is generally horizontally stratified, there are frequently occurring horizontal gradients that produce lateral deflections. Although these lateral deflections tend to be relatively small at UHF frequencies they are significant and have been included in our computations. The figure 3 also shows our convention for quantifying the magnitude and direction of a deflection vector. For example, if the ‘clock angle’ shown has a value of -90 degrees the deflection is downward with no lateral deflection; in the figure 3 we illustrate the effect of a small lateral deflection as well as a downward deflection that results in a value of the clock angle of -110 degrees.
4.0 RESULTS
In the results that we present in this section from the ray-tracing code we plot three parameters. First, the range error due to group delay through the ionosphere is plotted; this is computed from the total electron content (TEC) derived from the ionospheric model along the ray path. Second we plot the magnitude of the deflection vector, and third the ‘clock angle’ that is defined in figure 3. These results are repeated for two radar elevation angles (5 and 10 degrees), and for the two study days (October 7 and 14, 2003).
Modeling of Ionospheric Refraction of UHF Radar Signals at High Latitudes
RTO-MP-IST-056 19 - 7
UNCLASSIFIED/UNLIMITED
UNCLASSIFIED/UNLIMITED
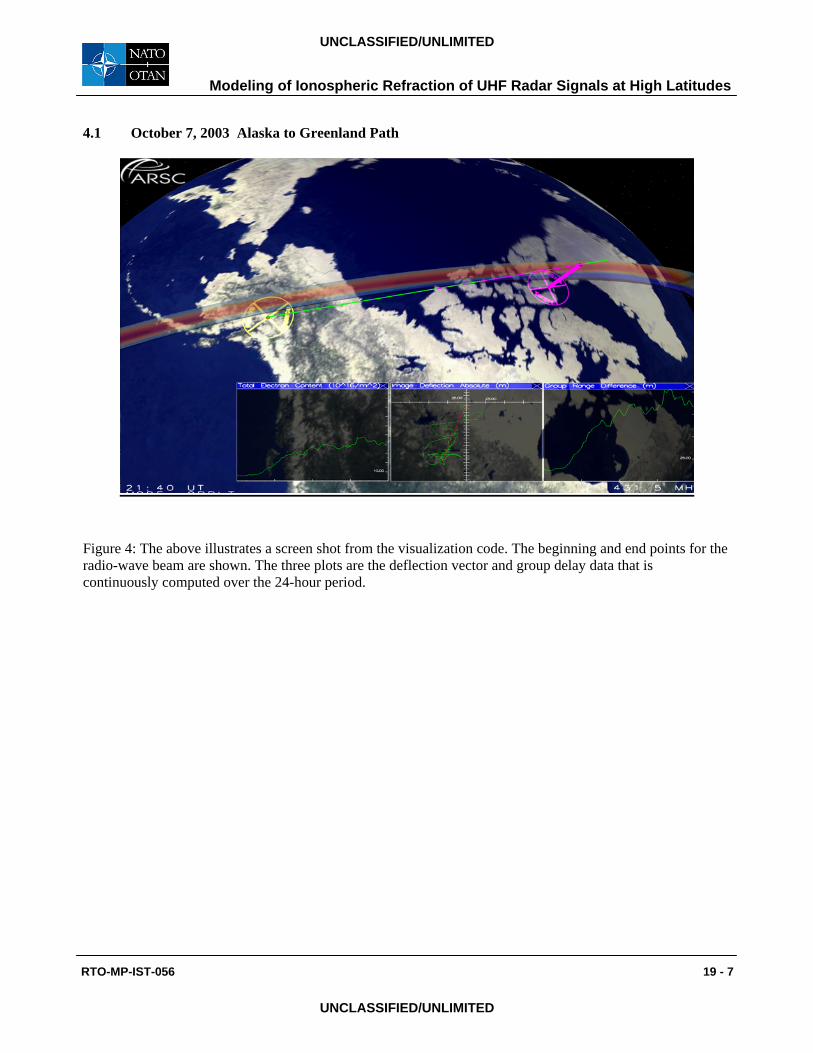
4.1 October 7, 2003 Alaska to Greenland Path
Figure 4: The above illustrates a screen shot from the visualization code. The beginning and end points for the radio-wave beam are shown. The three plots are the deflection vector and group delay data that is continuously computed over the 24-hour period.

Modeling of Ionospheric Refraction of UHF Radar Signals at High Latitudes
19 - 8 RTO-MP-IST-056
UNCLASSIFIED/UNLIMITED
UNCLASSIFIED/UNLIMITED
4.1.1 5-Degree Elevation Results – October 7, 2003
0
1 0
2 0
3 0
4 0
5 0
6 0
7 0
8 0
9 0
1 0 0
0 4 8 1 2 1 6 2 0 2 4
Gro
up
Ran
ge,
mete
rs
0
5 0
1 0 0
1 5 0
2 0 0
2 5 0
3 0 0
3 5 0
4 0 0
4 5 0
5 0 0
0 4 8 1 2 1 6 2 0 2 4
Delt
a R
an
ge,
m
-130
-120
-110
-100
-90
-80
-70
-60
-50
0 4 8 12 16 20 24
Clo
ck A
ng
le o
f D
efl
ect
ion
, d
eg
rees
Figure 5: Upper plot – group delay range error.
Center Plot – magnitude of the deflection vector. Lower plot – direction of deflection vector.
(5 degree elevation angle results – October 7, 2003)
Modeling of Ionospheric Refraction of UHF Radar Signals at High Latitudes
RTO-MP-IST-056 19 - 9
UNCLASSIFIED/UNLIMITED
UNCLASSIFIED/UNLIMITED
The above results indicate maximum range error due to the group delay to be about 100 meters. The downward deflection of the radio-wave beam reaches a maximum of about 500 meters. This is the integrated effect along the entire path that results from a number of electron density gradients along the path. Although the refraction is primarily downward (-90 degrees ‘clock angle’ shown in lower plot) there is a short period (just after 1200 UT) where the clock angle reaches a value of about -130 degrees; this lateral beam deflection toward the north results from a steep horizontal north-south gradient.
4.1.2 10-Degree Elevation Results – October 7, 2003
The results for the same time period with radar antenna elevation of 10 degrees are shown below. The results are quite different because the radio-wave beam intersects different ionospheric structures at different times compared to the lower elevation case.

Modeling of Ionospheric Refraction of UHF Radar Signals at High Latitudes
19 - 10 RTO-MP-IST-056
UNCLASSIFIED/UNLIMITED
UNCLASSIFIED/UNLIMITED
0
1 0
2 0
3 0
4 0
5 0
6 0
7 0
8 0
9 0
1 0 0
0 4 8 1 2 1 6 2 0 2 4
Gro
up
Ran
ge,
mete
rs
0
5 0
1 0 0
1 5 0
2 0 0
2 5 0
3 0 0
3 5 0
4 0 0
4 5 0
5 0 0
0 4 8 1 2 1 6 2 0 2 4
Delt
a R
an
ge,
m
-130
-120
-110
-100
-90
-80
-70
-60
-50
0 4 8 12 16 20 24
Clo
ck A
ng
le o
f D
efl
ect
ion
, d
eg
rees
Figure 6: Upper plot – group delay range error.
Center Plot – magnitude of the deflection vector. Lower plot – direction of deflection vector.
(10 degree elevation angle results – October 7, 2003)
4.2 October 14, 2003 Alaska to Greenland Path This day was moderately disturbed with Kp values ranging from about 4 to 7. As expected the ionosphere exhibited substantially greater temporal variations in the density and occurrence of density gradients.
Modeling of Ionospheric Refraction of UHF Radar Signals at High Latitudes
RTO-MP-IST-056 19 - 11
UNCLASSIFIED/UNLIMITED
UNCLASSIFIED/UNLIMITED
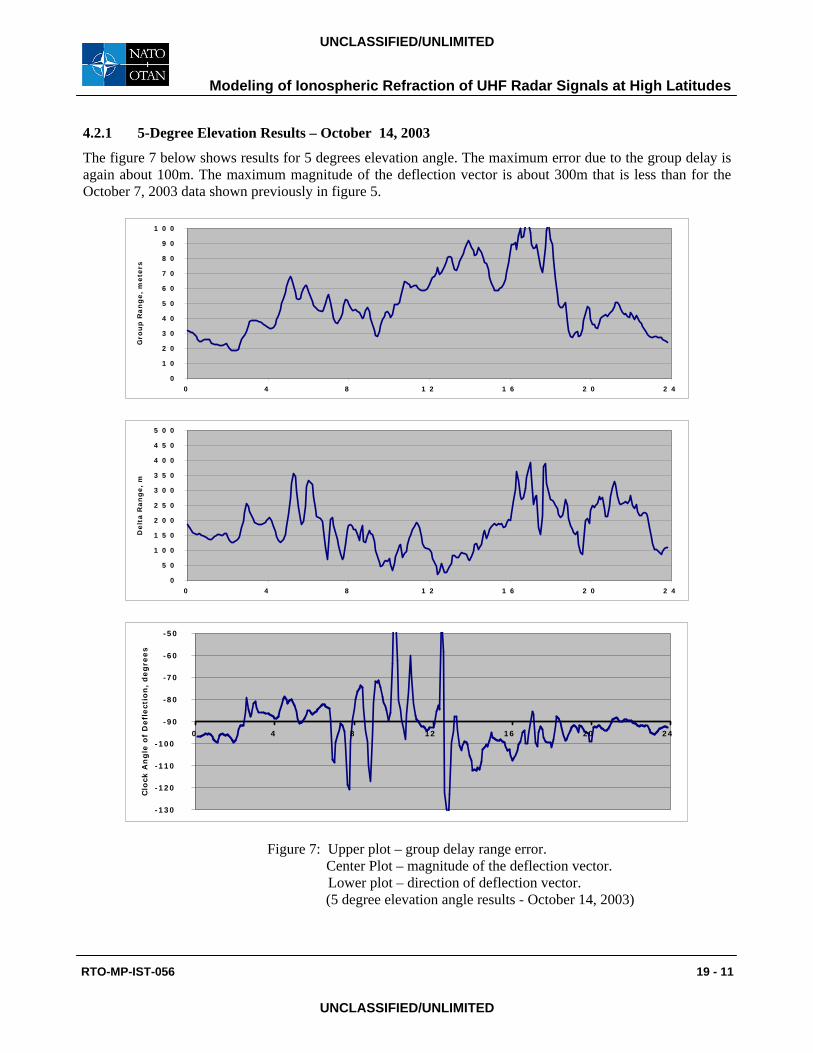
4.2.1 5-Degree Elevation Results – October 14, 2003 The figure 7 below shows results for 5 degrees elevation angle. The maximum error due to the group delay is again about 100m. The maximum magnitude of the deflection vector is about 300m that is less than for the October 7, 2003 data shown previously in figure 5.
0
1 0
2 0
3 0
4 0
5 0
6 0
7 0
8 0
9 0
1 0 0
0 4 8 1 2 1 6 2 0 2 4
Gro
up
Ran
ge,
mete
rs
0
5 0
1 0 0
1 5 0
2 0 0
2 5 0
3 0 0
3 5 0
4 0 0
4 5 0
5 0 0
0 4 8 1 2 1 6 2 0 2 4
Delt
a R
an
ge,
m
-130
-120
-110
-100
-90
-80
-70
-60
-50
0 4 8 12 16 20 24
Clo
ck A
ng
le o
f D
efl
ect
ion
, d
eg
rees
Figure 7: Upper plot – group delay range error. Center Plot – magnitude of the deflection vector.
Lower plot – direction of deflection vector. (5 degree elevation angle results - October 14, 2003)

Modeling of Ionospheric Refraction of UHF Radar Signals at High Latitudes
19 - 12 RTO-MP-IST-056
UNCLASSIFIED/UNLIMITED
UNCLASSIFIED/UNLIMITED
Referring to the lower plot in figure 7 it is evident that there are a number of electron density gradients that result in lateral displacements of the beam. From about 0700 to 1300UT the ‘clock angle’ has values -130 to -50 degrees.
4.2.2 10-Degree Elevation Results – October 14, 2003
0
1 0
2 0
3 0
4 0
5 0
6 0
7 0
8 0
9 0
1 0 0
0 4 8 1 2 1 6 2 0 2 4
Gro
up
Ran
ge,
mete
rs
0
5 0
1 0 0
1 5 0
2 0 0
2 5 0
3 0 0
3 5 0
4 0 0
4 5 0
5 0 0
0 4 8 1 2 1 6 2 0 2 4
Delt
a R
an
ge,
m
-130
-120
-110
-100
-90
-80
-70
-60
-50
0 4 8 12 16 20 24
Clo
ck A
ng
le o
f D
efl
ect
ion
, d
eg
rees
Figure 8: Upper plot – group delay range error.
Center Plot – magnitude of the deflection vector. Lower plot – direction of deflection vector.
(10 degree elevation angle results - October 14, 2003)

Modeling of Ionospheric Refraction of UHF Radar Signals at High Latitudes
RTO-MP-IST-056 19 - 13
UNCLASSIFIED/UNLIMITED
UNCLASSIFIED/UNLIMITED
The 10-degree elevation angle for this day show relatively minor effects. The magnitude of the range error due to group delay is no more than about 50m. The downward deflection of the beam has a maximum displacement of about 250m.
6.0 SUMMARY
We have developed a three-dimensional ray-tracing code that is applicable for frequencies from HF to above UHF and integrated this code with a real-time model of the polar ionosphere. A study to investigate range and pointing errors for UHF radars operating in polar regions has been conducted. In this paper we have shown sample results for a radar, located in Alaska, operating at low elevation angles along an azimuth toward Thule, Greenland. During a given 24-hour period the simulated radar beam intersects numerous time-varying ionospheric structures that have been computed by the ionospheric model. For a simulated target above the ionosphere we have computed temporal variations of the range and pointing errors. For the UHF frequency used here, the maximum group-range errors are about 100m, and the maximum magnitude of the error due to ionospheric refraction in locating the target is about 500m. Horizontal gradients in the ionospheric electron density also result in lateral displacements of the radio-wave beam.
ACKNOWLEDGEMENTS
This work was supported in part by a grant of HPC resources from the Arctic Region Supercomputing Center (ARSC) at the University of Alaska Fairbanks (UAF) as part of the Department of Defence High Performance Computing Modernization Program and by a grant of Applied Physics Laboratory for development of radio ray tracing capabilities.
References [1] Maurits,S.A and B.J.Watkins, in Solar terrestrial Energy program: Handbook of Ionospheric Models, ed
R.W.Schunk, August 1996.
[2] Kulchitsky, A., S. A. Maurits, B.J.Watkins, J. McAllister, ExB modeling in Eulerian Ionospheric Models, Journal of Geophys. Res, Vol. 110, A09310, doi:10.1029/2005JA011033, 2005, 2005.

Modeling of Ionospheric Refraction of UHF Radar Signals at High Latitudes
19 - 14 RTO-MP-IST-056
UNCLASSIFIED/UNLIMITED
UNCLASSIFIED/UNLIMITED