development of hybrid cementitious composite (hcc) for sustainable ...

Please cite this article as: A. Desai, V. Alonso, and S.R. Nutt, “Modeling of hybrid composite foam” J.
Cell. Plast. 46 (2010) 113-128. DOI: http://dx.doi.org/10.1177/0021955X09351195
Modeling of Hybrid Composite Foams
Amit A. Desai* And Steven. R. Nutt1
Mari´A Virginia Alonso2
1Gill Foundation Composites Center, Chemical Engineering and Materials Science
Department, University of Southern California
3651 Watt Way, VHE-602, Los Angeles, CA 90089-0241, USA 2Chemical Engineering Department, Faculty of Chemistry, Complutense, University of
Madrid, Avda de la Complutense s/n, 28040 Madrid, Spain
Abstract: An analysis of variance was applied to model the mechanical properties of hybrid foams.
The controlled variable used in the study was the fiber weight fraction of glass and aramid fibers,
and all foam samples were of similar density (250 kg/m3). The responses analyzed were elastic
modulus and strength for compressive and shear loading. The microstructure of the hybrid foam
samples was examined and the effects of fiber type on the cell geometry and distribution were
studied. The results showed that each fiber type in hybrid foam had significant effects on the
compression and shear properties and the fiber weight fraction affected the isotropy of the properties.
The utilization of a statistical model for predicting hybrid composite foam properties is an
appropriate tool that affords a global perspective of the influence of process variables on foam
properties.
Key words: foams, fibers, modeling, design of experiments.
1. INTRODUCTION
The combination of different types of fibers in a common matrix, known as hybrid composite,
has the potential of achieving balance between composite strength and ductility [1]. Also, hybrid
composites The combination of different types of fibers in a common matrix, known as hybrid
composite, has the potential of achieving balance between composite strength and ductility [1]. Also,

Please cite this article as: A. Desai, V. Alonso, and S.R. Nutt, “Modeling of hybrid composite foam” J.
Cell. Plast. 46 (2010) 113-128. DOI: http://dx.doi.org/10.1177/0021955X09351195
hybrid composites can provide a wider spectrum of mechanical properties and reduce the cost of
composites by mixing reinforcements such as glass fibers with more expensive high-performance
fibers.
Several hybrid composites have been designed to improve abrasion resistance and other
mechanical properties, and to reduce coefficient of thermal expansion. Desai et al. [1] reinforced
phenolic foams with glass and aramid fibers (Nomex® or Kevlar®), thus obtaining phenolic foams,
which were tough, stiff, and strong. Several-fold improvement in compression and shear properties
were demonstrated for foams by judicious selection of fibers. Hybrid composites of glass
fiber/wollastonite fiber-reinforced engineering thermoplastics (ETPs) were blended with various
levels of glass to wollastonite to obtain tailored composites, which showed high strength, good
dimensional stability, and warp resistance [2]. The mechanical properties of hybrid composites may
or may not follow the rule of mixtures (ROM) and this has attracted much attention [3]. The so-
called ‘hybrid effect’ is defined in two ways: (a) any deviation from ROM [4] or (b) a difference
between the failure strain of the low elongation (LE) fiber in a hybrid composite, and that of the LE
fiber in a single-fiber type (SFT) composite [2,5].
Several approaches have been employed to model the properties of composite foams. For
example, Desai et al. applied an analysis of variance (ANOVA) to analyze and describe the
mechanical behavior of fiber reinforced phenolic foam [6]. They studied material variables such as
fiber length, fiber weight fraction, etc. and developed a statistical approach to predict effects of the
variables on the elastic properties of composite foams. In other works, researchers have employed
analytical tools to predict elastic behavior of foams as a function of cell irregularity and relative
density. Siegmann et. al. constructed Voronoi models to simulate linear elastic behavior of open

Please cite this article as: A. Desai, V. Alonso, and S.R. Nutt, “Modeling of hybrid composite foam” J.
Cell. Plast. 46 (2010) 113-128. DOI: http://dx.doi.org/10.1177/0021955X09351195
cells [7]. They attempted to model linear behavior of filled foams using Kerner equations in two
steps.
For hybrid composites, complexity arises in modeling the mechanical properties because there
is more than one type of fiber or filler in the matrix, and thus the studies have been limited. Babu et
al. studied the elastic modulus of hybrid composites through micromechanical modeling [8]. They
examined the effect of filler concentrations, filler shape and aspect ratio on the effective elastic
properties of polymer based hybrid composites. Desai et al. [1] evaluated multiple composite
models, including parallel and series models, and the Halpin–Tsai, and Hirsch models to fit
experimental data. As hybrid composite foams become more widespread, there will be a need for a
modeling approach, which can reduce the experimental iterations required to optimize properties
and also serve as a predictive tool for similar fiber foam systems.
The aim of this work is to determine the relationship between fiber compositions, final morphology,
and elastic properties of hybrid composite phenolic foams reinforced with glass and aramid fibers.
A statistical model was utilized to describe the effects of glass and aramid fiber weight fractions,
and the responses measured were modulus and compressive strength. Foams were also examined to
understand the influence of hybrid foam morphology on the mechanical behavior.
2. EXPERIMENTAL
2.1. Materials and Foam Preparation
The formulation used for foam production was composed of phenolic resol resin (solid content
>80/100 parts). Fiber-reinforced hybrid phenolic foams were synthesized by blending chopped
fibers with the phenolic resin in a high-speed dual-axis mixer [9]. Aramid fibers (DuPont Nomex®)
were 6.4 mm in length and 12 mm in diameter. The glass fibers (Lauscha Fiber International) were

Please cite this article as: A. Desai, V. Alonso, and S.R. Nutt, “Modeling of hybrid composite foam” J.
Cell. Plast. 46 (2010) 113-128. DOI: http://dx.doi.org/10.1177/0021955X09351195
6.4 mm in length and 11 μm in diameter, and were treated with a silane coupling agent. Foams were
synthesized using a proprietary formulation [10] and a patented technology [9]. Polysulphonic acid
(PSA) was used as a catalyst and pentane was used as the blowing agent. A total of nine fiber-
reinforced hybrid foams were synthesized. Pentane and PSA were added in different amounts to
obtain foams with a density of ~80 kg/m3.
2.2. Statistical Experimental Design
Design of experiments (DOE) has been used to: (a) quantify the interrelationship between
variables, (b) screen a large number of variables to identify critical ones, (c) develop new products,
and (d) optimize processes through control schemes. The DOE method can reduce the number of
experimental iterations required to achieve necessary end results or properties. ANOVA is a
collection of statistical models and associated procedures in which the observed variance is
partitioned into components due to different explanatory variables. There are three conceptual
classes of such models, including (1) the fixed-effect model that assumes data from normal
populations which may differ only in their means, (2) the random effects model, which assumes that
the data describe a hierarchy of different populations whose differences are constrained by the
hierarchy, and (3) the mixed-effect model that describes situations where both fixed and random
effects are present [11].
In this study, we implemented 3k factorial design using ANOVA to study the influence of glass
and aramid fibers on the compression and shear properties of hybrid foams.
A 32 screening design with three central points was implemented and the DOE was carried out
to study the behavior of hybrid foams in compression and shear. The 32 screening design featured 2
factors, each at three levels. The nine treatment combinations for this type of design are shown in
Figure 1. A notation such as ‘20’ signifies that factor A is at its high level (2) and factor B is at its

Please cite this article as: A. Desai, V. Alonso, and S.R. Nutt, “Modeling of hybrid composite foam” J.
Cell. Plast. 46 (2010) 113-128. DOI: http://dx.doi.org/10.1177/0021955X09351195
low level (0). The effect of the factors on the response is measured by the change in the average
response in two or more combinations of levels. The combinations of treatments are written in
standard order, which means that one factor at a time is introduced successively, combining each
level with the set of the factors levels. The standard order for a 32 design is 00, 10, 20, 11, 11, 11,
02, 12, and 22 [12].
The experimental designs were employed to fit a linear statistical model to the response results,
with factor levels coded as ‘low’ or ‘high’. Statistical software was used to perform ANOVA and
multiple regression methods. After the regression coefficients were determined, an estimation or
validation of the results was performed. Thus, each effect yielded a p-value, which signified the
significance of that effect, either low or high. In addition, for determining the fit of the model, low
scatter in the data and an R2 value (fraction of the variance) near 1 were required. The responses
were plotted as a contour map or a response surface (2D and/or 3D plot).
Figure 1. Three square schematic effect.
2.3. Plan of Experiments
Nine samples of hybrid composite phenolic foam were formulated with glass and aramid fibers.
The proportion of blowing agent and PSA was measured for each formulation to obtain hybrid foams

Please cite this article as: A. Desai, V. Alonso, and S.R. Nutt, “Modeling of hybrid composite foam” J.
Cell. Plast. 46 (2010) 113-128. DOI: http://dx.doi.org/10.1177/0021955X09351195
with similar densities. Compression and shear tests were performed on each of the specimens using
the Gibson and Ashby micromechanical co-relation for Young’s modulus [13]. Scanning electron
microscope (SEM) images were obtained to determine the cell size distributions for the hybrid
foams. The variables studied were glass fiber weight fraction (G) and aramid fiber weight fraction
(N). The responses measured for developing the model were compressive modulus (Ec), compressive
strength (σc), shear modulus (Es), and shear strength (σs). Table 1 summarizes the experimental
conditions employed and the results of compression and shear testing of hybrid foams. Commercial
software (Statgraphics Plus) was used to process the data. Commercial software (Statgraphics Plus)
was used to process the data.
2.4. Compression Tests
The compression testing was performed using a universal testing machine (INSTRON 5564
system) in accordance with ASTM D1621. Specimens were cut with a diamond blade band saw and
polished to a size of 30 mm X 30 mm X 25.4 mm. The samples were compressed between two
stainless steel platens using a crosshead rate of 2.5 mm/min. From the stress–strain curves, the
compressive modulus values were determined from the steepest initial slope, and the strength was
calculated from the maximum load. Average values were determined from a minimum of five
replicates.

Please cite this article as: A. Desai, V. Alonso, and S.R. Nutt, “Modeling of hybrid composite foam” J.
Cell. Plast. 46 (2010) 113-128. DOI: http://dx.doi.org/10.1177/0021955X09351195
Table 1. Mechanical properties of hybrid foams with glass and Nomex® fibers.
Average
Glass Nomex ® Compression Compression Shear Shear cell
Sample fiber fiber modulus strength modulus strength diameter
number (wt%) (wt%) (MPa) (MPa) (MPa) (MPa) (mm)
1 2 2 26.5 0.282 22.1 0.44 0.090
2 1 1 22.7 0.224 18.1 0.34 0.075
3 2 2 26.8 0.276 21.7 0.43 0.089
4 3 3 38.5 0.312 28.2 0.68 0.076
5 3 1 34.5 0.320 22.5 0.38 0.071
6 1 3 23.4 0.304 21.4 0.35 0.059
7 2 1 24.8 0.255 19.3 0.36 0.067
8 2 2 26.6 0.279 21.8 0.43 0.091
9 2 3 29.4 0.309 25.9 0.51 0.077
2.5. Shear Tests
Lap shear testing was performed in accordance with ASTM C273. Foam specimens were bonded
to stainless steel plates with a fast-cure epoxy adhesive. The shear modulus was taken as the steepest
slope of the stress–strain curve, and strength as the peak stress value. At least five replicates were
tested for each specimen, and the results were presented as the average value of all replicates.
2.6. Scanning Electron Microscopy
A (SEM) was employed to observe the fracture surfaces of foam specimens. Samples were
carefully cut from the freshly peeled surfaces using a razor blade. Gold sputtering onto the sample
surface was used to impart electrical conductivity. The operation voltage of the SEM was 15 kV.
SEM images were recorded in a high-resolution electronic format and processed later with computer
software.
3. RESULTS AND DISCUSSION
3.1. Statistical Model for Compressive Properties of Hybrid Foams
Please cite this article as: A. Desai, V. Alonso, and S.R. Nutt, “Modeling of hybrid composite foam” J.
Cell. Plast. 46 (2010) 113-128. DOI: http://dx.doi.org/10.1177/0021955X09351195
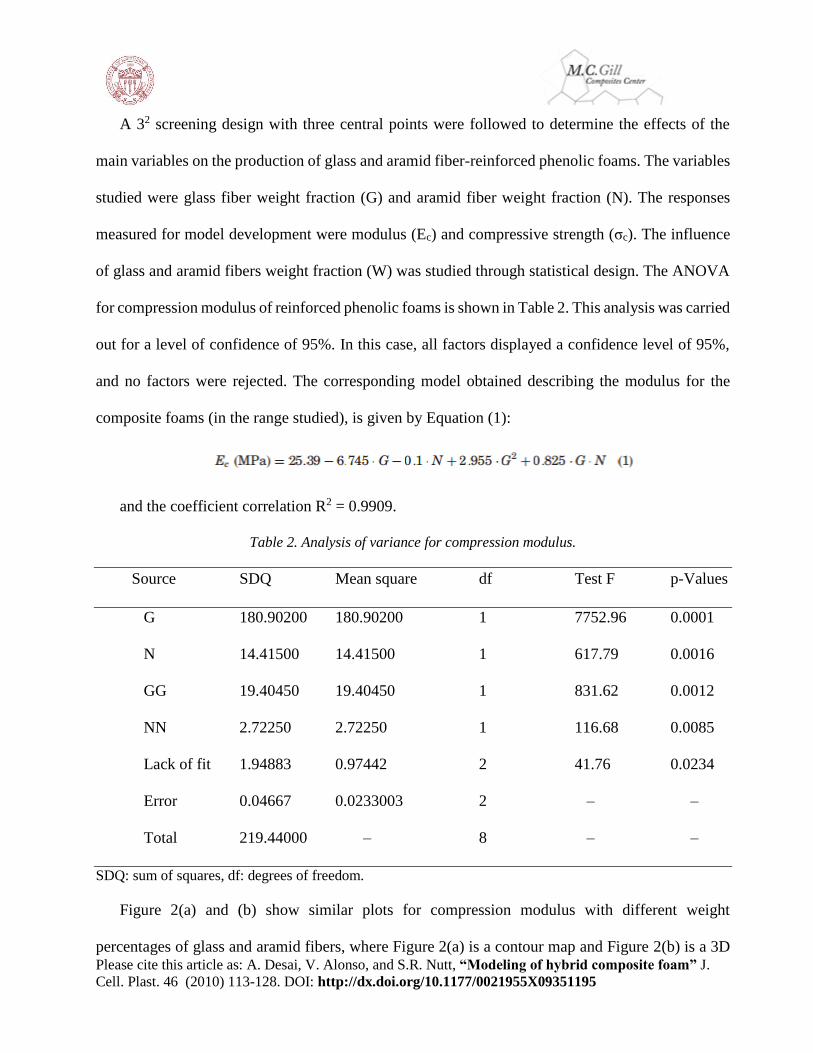
A 32 screening design with three central points were followed to determine the effects of the
main variables on the production of glass and aramid fiber-reinforced phenolic foams. The variables
studied were glass fiber weight fraction (G) and aramid fiber weight fraction (N). The responses
measured for model development were modulus (Ec) and compressive strength (σc). The influence
of glass and aramid fibers weight fraction (W) was studied through statistical design. The ANOVA
for compression modulus of reinforced phenolic foams is shown in Table 2. This analysis was carried
out for a level of confidence of 95%. In this case, all factors displayed a confidence level of 95%,
and no factors were rejected. The corresponding model obtained describing the modulus for the
composite foams (in the range studied), is given by Equation (1):
and the coefficient correlation R2 = 0.9909.
Table 2. Analysis of variance for compression modulus.
Source SDQ Mean square df Test F p-Values
G 180.90200 180.90200 1 7752.96 0.0001
N 14.41500 14.41500 1 617.79 0.0016
GG 19.40450 19.40450 1 831.62 0.0012
NN 2.72250 2.72250 1 116.68 0.0085
Lack of fit 1.94883 0.97442 2 41.76 0.0234
Error 0.04667 0.0233003 2 – –
Total 219.44000 – 8 – –
SDQ: sum of squares, df: degrees of freedom.
Figure 2(a) and (b) show similar plots for compression modulus with different weight
percentages of glass and aramid fibers, where Figure 2(a) is a contour map and Figure 2(b) is a 3D

Please cite this article as: A. Desai, V. Alonso, and S.R. Nutt, “Modeling of hybrid composite foam” J.
Cell. Plast. 46 (2010) 113-128. DOI: http://dx.doi.org/10.1177/0021955X09351195
plot. Glass fibers had a greater influence on compressive modulus of hybrid foams than aramid
fibers, and the values of modulus increased with increasing proportion of glass fibers. However,
when the glass fiber weight fraction was less than 2%, the modulus remained almost constant with
increasing proportion of aramid fibers. For hybrid foams with glass fiber weight fractions greater
than 2%, an increase in modulus was observed. This is partly attributed to the fact that glass fibers
tended to orient in the foam rise direction [14], and glass fibers are stiffer then aramid fibers.
A model was obtained describing the compression strength for hybrid composite foam in the
range studied (Table 3). The equation describing compressive strength of hybrid composite phenolic
foam is given below:
All factors display a
confidence level of 95%, and the coefficient correlation R2 = 0.9821. The corresponding contour
maps and 3D plot are shown in Figure 3(a) and (b), respectively. Both aramid and glass fibers had
similar influences on the compressive strength of the hybrid foams. An increase in compressive
strength was observed at both extremes of contour plots. Hybrid foam specimens with higher weight
fractions of glass and aramid fibers exhibited higher strength. Implementing this statistical approach
with ANOVA revealed the influence of fiber type on the properties of foam.

Please cite this article as: A. Desai, V. Alonso, and S.R. Nutt, “Modeling of hybrid composite foam” J.
Cell. Plast. 46 (2010) 113-128. DOI: http://dx.doi.org/10.1177/0021955X09351195
Figure 2. (a) Contour map showing effects of fiber type on compressive modulus, (b) 3D plot showing
effects of fiber type on compressive modulus.

Please cite this article as: A. Desai, V. Alonso, and S.R. Nutt, “Modeling of hybrid composite foam” J.
Cell. Plast. 46 (2010) 113-128. DOI: http://dx.doi.org/10.1177/0021955X09351195
Figure 3. (a) Contour map showing effects of fiber type on compressive strength, (b) 3D plot showing
effects of fiber type on compressive strength.

Please cite this article as: A. Desai, V. Alonso, and S.R. Nutt, “Modeling of hybrid composite foam” J.
Cell. Plast. 46 (2010) 113-128. DOI: http://dx.doi.org/10.1177/0021955X09351195
Table 3. Analysis of variance for compressive strength.
Source SDQ Mean square df Test F p-Values
G 0.002704 0.002704 1 300.44 0.0033
N 0.002646 0.002646 1 294.00 0.0034
GG 0.000213 0.000213 1 23.11 0.0397
NN 0.001936 0.001936 1 215.11 0.0046
Lack of fit 0.000119 0.000059 2 6.60 0.1316
Error 0.000018 0.000009 2 – –
Total 0.007636 – 8 – –
SDQ: sum of squares, df: degrees of freedom.
3.2. Statistical Model for Shear Properties of Hybrid Foams
The ANOVA for shear modulus of reinforced phenolic foams is shown in Table 4. This analysis
was carried out for a level of confidence of 95%. In cases where the factor had a distribution
F<18.58% and p-values>0.05, the factor or factors were rejected because the effects presented a
significance level less than 95%. As shown in Table 4, the factor GG is rejected from the analysis
of variance. The new ANOVA values for the modulus are shown between parentheses in Table 4.
All factors display a confidence level of 95%. The corresponding revised model obtained describing
the modulus for the composite foams (in the range studied), is given by:
Coefficient correlation R2 = 0.9665.
The shear properties of hybrid foams were influenced by both glass and aramid fibers. The
contour and 3D plot for shear modulus are shown in Figure 4(a) and (b), respectively. Glass and
aramid fibers exhibited a similar influence on the shear modulus of hybrid foams. The shear modulus
increased with an increase in weight fraction of glass and aramid fibers.
Table 5 shows ANOVA values for the shear strength of hybrid foams. The factor GG was
rejected because it displayed a confidence level of less than 95%. The new ANOVA values for the

Please cite this article as: A. Desai, V. Alonso, and S.R. Nutt, “Modeling of hybrid composite foam” J.
Cell. Plast. 46 (2010) 113-128. DOI: http://dx.doi.org/10.1177/0021955X09351195
strength are shown in parentheses in Table 5. The corresponding revised model obtained describing
the shear strength for hybrid composite foams (in the range studied) is given by:
Figure 4. (a) Contour map showing effects of fiber type on shear modulus, (b) 3D plot showing effects
of fiber type on shear strength.

Please cite this article as: A. Desai, V. Alonso, and S.R. Nutt, “Modeling of hybrid composite foam” J.
Cell. Plast. 46 (2010) 113-128. DOI: http://dx.doi.org/10.1177/0021955X09351195
Figure 5. (a) Contour map showing effects of fiber type on shear strength, (b) 3D plot showing effects of
fiber type on shear strength.
Please cite this article as: A. Desai, V. Alonso, and S.R. Nutt, “Modeling of hybrid composite foam” J.
Cell. Plast. 46 (2010) 113-128. DOI: http://dx.doi.org/10.1177/0021955X09351195
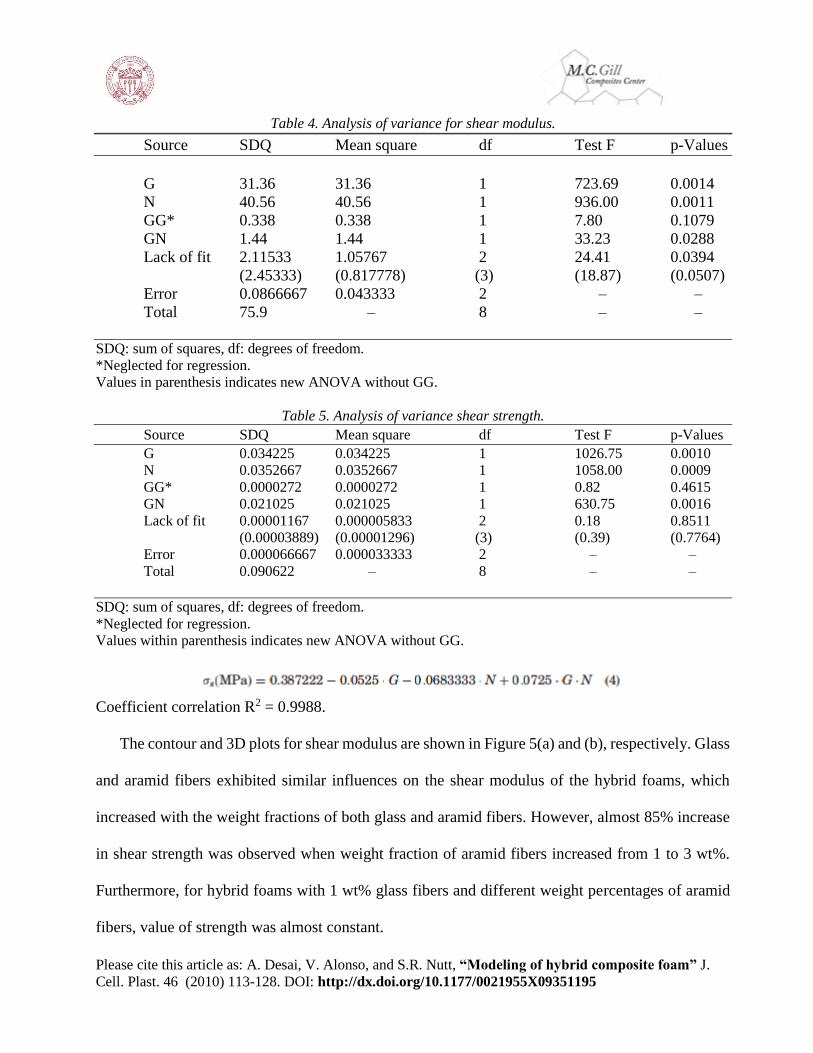
Table 4. Analysis of variance for shear modulus.
Source SDQ Mean square df Test F p-Values
G 31.36 31.36 1 723.69 0.0014
N 40.56 40.56 1 936.00 0.0011
GG* 0.338 0.338 1 7.80 0.1079
GN 1.44 1.44 1 33.23 0.0288
Lack of fit 2.11533 1.05767 2 24.41 0.0394
(2.45333) (0.817778) (3) (18.87) (0.0507)
Error 0.0866667 0.043333 2 – –
Total 75.9 – 8 – –
SDQ: sum of squares, df: degrees of freedom.
*Neglected for regression.
Values in parenthesis indicates new ANOVA without GG.
Table 5. Analysis of variance shear strength.
Source SDQ Mean square df Test F p-Values
G 0.034225 0.034225 1 1026.75 0.0010
N 0.0352667 0.0352667 1 1058.00 0.0009
GG* 0.0000272 0.0000272 1 0.82 0.4615
GN 0.021025 0.021025 1 630.75 0.0016
Lack of fit 0.00001167 0.000005833 2 0.18 0.8511
(0.00003889) (0.00001296) (3) (0.39) (0.7764)
Error 0.000066667 0.000033333 2 – –
Total 0.090622 – 8 – –
SDQ: sum of squares, df: degrees of freedom.
*Neglected for regression.
Values within parenthesis indicates new ANOVA without GG.
Coefficient correlation R2 = 0.9988.
The contour and 3D plots for shear modulus are shown in Figure 5(a) and (b), respectively. Glass
and aramid fibers exhibited similar influences on the shear modulus of the hybrid foams, which
increased with the weight fractions of both glass and aramid fibers. However, almost 85% increase
in shear strength was observed when weight fraction of aramid fibers increased from 1 to 3 wt%.
Furthermore, for hybrid foams with 1 wt% glass fibers and different weight percentages of aramid
fibers, value of strength was almost constant.
Please cite this article as: A. Desai, V. Alonso, and S.R. Nutt, “Modeling of hybrid composite foam” J.
Cell. Plast. 46 (2010) 113-128. DOI: http://dx.doi.org/10.1177/0021955X09351195
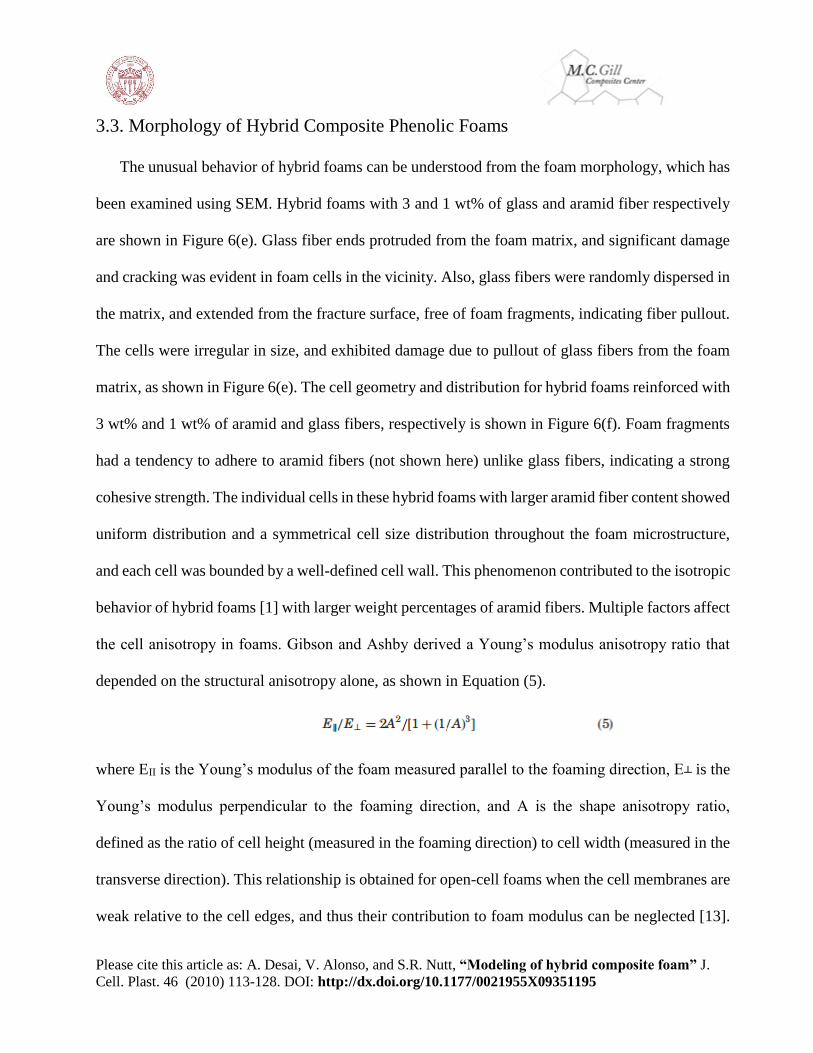
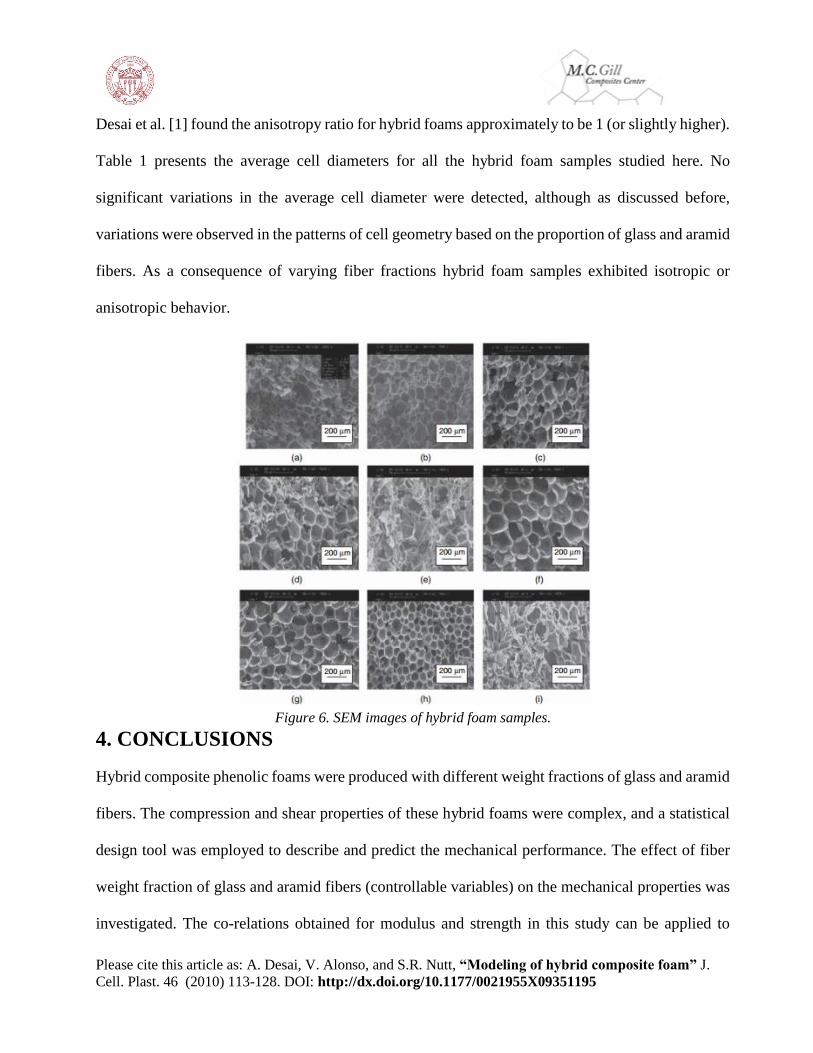
3.3. Morphology of Hybrid Composite Phenolic Foams
The unusual behavior of hybrid foams can be understood from the foam morphology, which has
been examined using SEM. Hybrid foams with 3 and 1 wt% of glass and aramid fiber respectively
are shown in Figure 6(e). Glass fiber ends protruded from the foam matrix, and significant damage
and cracking was evident in foam cells in the vicinity. Also, glass fibers were randomly dispersed in
the matrix, and extended from the fracture surface, free of foam fragments, indicating fiber pullout.
The cells were irregular in size, and exhibited damage due to pullout of glass fibers from the foam
matrix, as shown in Figure 6(e). The cell geometry and distribution for hybrid foams reinforced with
3 wt% and 1 wt% of aramid and glass fibers, respectively is shown in Figure 6(f). Foam fragments
had a tendency to adhere to aramid fibers (not shown here) unlike glass fibers, indicating a strong
cohesive strength. The individual cells in these hybrid foams with larger aramid fiber content showed
uniform distribution and a symmetrical cell size distribution throughout the foam microstructure,
and each cell was bounded by a well-defined cell wall. This phenomenon contributed to the isotropic
behavior of hybrid foams [1] with larger weight percentages of aramid fibers. Multiple factors affect
the cell anisotropy in foams. Gibson and Ashby derived a Young’s modulus anisotropy ratio that
depended on the structural anisotropy alone, as shown in Equation (5).
where EII is the Young’s modulus of the foam measured parallel to the foaming direction, E┴ is the
Young’s modulus perpendicular to the foaming direction, and A is the shape anisotropy ratio,
defined as the ratio of cell height (measured in the foaming direction) to cell width (measured in the
transverse direction). This relationship is obtained for open-cell foams when the cell membranes are
weak relative to the cell edges, and thus their contribution to foam modulus can be neglected [13].
Please cite this article as: A. Desai, V. Alonso, and S.R. Nutt, “Modeling of hybrid composite foam” J.
Cell. Plast. 46 (2010) 113-128. DOI: http://dx.doi.org/10.1177/0021955X09351195
Desai et al. [1] found the anisotropy ratio for hybrid foams approximately to be 1 (or slightly higher).
Table 1 presents the average cell diameters for all the hybrid foam samples studied here. No
significant variations in the average cell diameter were detected, although as discussed before,
variations were observed in the patterns of cell geometry based on the proportion of glass and aramid
fibers. As a consequence of varying fiber fractions hybrid foam samples exhibited isotropic or
anisotropic behavior.
Figure 6. SEM images of hybrid foam samples.
4. CONCLUSIONS
Hybrid composite phenolic foams were produced with different weight fractions of glass and aramid
fibers. The compression and shear properties of these hybrid foams were complex, and a statistical
design tool was employed to describe and predict the mechanical performance. The effect of fiber
weight fraction of glass and aramid fibers (controllable variables) on the mechanical properties was
investigated. The co-relations obtained for modulus and strength in this study can be applied to
Please cite this article as: A. Desai, V. Alonso, and S.R. Nutt, “Modeling of hybrid composite foam” J.
Cell. Plast. 46 (2010) 113-128. DOI: http://dx.doi.org/10.1177/0021955X09351195
predict mechanical properties of hybrid foams. Furthermore, these relations can be used to tailor the
properties to end use applications, thus significantly reducing the number of experimental iterations
needed.
The study of foam morphology revealed that the type and amount of fiber used in the hybrid
foams influenced the isotropic or anisotropic behavior of hybrid foams, although the average cell
size was not significantly affected. The statistical design approach employed here can be applied to
other hybrid foam systems (epoxy, polyurethane, etc.), and doing so will reduce the number of
experimental iterations needed to optimize foam properties and identify critical process variables.
References:
1. Desai, A., Auad, M.L., Shen, H. and Nutt, S.R. Mechanical Behaviors of Hybrid Composite
Phenolic Foam, J. Cell. Plast., 2008: 44: 15–36.
2. Jacobson, R. and Caulfield, D. (2003). Hybrid Composites: Combining Cellulose Fibers and
Woolastonite Mineral Fibers into a Nylon 6 Matrix, In: The Seventh International Conference on
Woodfiber-Plastics Composites, Madison, WI, 19–20 May.
3. Kretsis, G. A Review of the Tensile, Compressive, Flexural and Shear Properties of Hybrid Fiber-
Reinforced Plastic, Composites, 1987: 1: 13–23.
4. Marom, G., Fischer, S., Tuler, F.R. and Wagner, H.D. Hybrid Effects in Composites: Conditions
for Positive or Negative Effects Versus Rule of Mixtures Behavior, J. Mater. Sci., 1978: 13: 1419–
1426.
5. Fukuda, H. An Advanced Theory of the Strength of Hybrid Composites, J. Mater. Sci., 1983: 19:
947–82.
6. Desai, A., Alonso, M.V. and Nutt, S.R. Modeling of Fiber Reinforced Phenolic Foam, J. Cell.
Plast., 2008: 44: 391–413.
7. Siegmann, A., Kenig, S., Alperstein, D. and Narkis, M. Mechanical Behavior of Reinforced
Polyurethane Foams, Polym. Composites, 1983: 4: 113–119.
8. Babu Prem, E.J., Savithri, S., Pillai, U.T.S. and Pai, B.C. Micromechanical Modeling of Hybrid
Composites, Polymer, 2005: 46: 7478–7484.
9. Nutt, S.R. and Shen, H. (2005). US Patent 6,841,584.
10. Cohen, M.I. (1994). WO 94/04604.
11. Box, G.E., Hunter, W.G. and Hunter, J.S. (1978). Statistics for Experimenters: An Introduction
to Design, Data Analysis and Model Building, New York, John Wiley and Sons.
12. Montgomery, J.S. (1991). Design and Analysis of Experiments, New York, Wiley and Sons, Inc.
13. Gibson, L.J. and Ashby, M.F. (1998). Cellular Solids: Structure and Properties, Oxford,
Pergamon Press.

Please cite this article as: A. Desai, V. Alonso, and S.R. Nutt, “Modeling of hybrid composite foam” J.
Cell. Plast. 46 (2010) 113-128. DOI: http://dx.doi.org/10.1177/0021955X09351195
14. Shen, H., Nutt, S.R. and Hull, D. Direct Observation and Measurement of Fiber Architecture in
Short Fiber-Polymer Composite Foam through MicroCT imaging, Compos. Sci. Technol., 2004: 64:
2113–2120.