Malcolm Bateman Middlesbrough Welfare Rights Unit Welfare Reform.
Iran. Econ. Rev. Vol. 19, No. 2, 2015. p. -
Modeling of Growth and Welfare Effects of Tax Reform
in Iran: A Static Computable General Equilibrium Analysis
Hamid Hooshmandi1, Majid Sameti
2, Rozita Moayedfar
3
Received: 2015/10/13 Accepted: 2015/11/21
Abstract
or several decades, the selection of a proper tax base has been
among the most serious concerns for the economic policy makers.
The computable general equilibrium models analysis provides a
comprehensive framework for the investigation of the effects of the
adopted policies on the economy of a country. In the present study,
using a static computable general equilibrium, the effects of tax reform
in Iran have been taken into account. The results of the static
comparative analysis show that a reduction in the capital income tax
and the wage tax leads to the enhancement of the economic growth and
welfare of Iranian households. Besides, the policy of decreasing the
consumption tax results in a decrease in the economic growth of the
country. Simulation results of the comparative static analysis show that
the wage tax has the greatest effect on the economy of the country. The
second greatest effects are associated with the capital income tax and
the consumption income tax, respectively.
JEL classification: H21, H24, D58
Keywords: economic growth, GAMS, static computable general
equilibrium, taxation.
1. Introduction
The idea of the multipart general equilibrium growth model was first
developed by Johansen (1960) as the first experiment in the application of
the general equilibrium model. Dervis et al. suggested that CGE models are
more appropriate than the other methods for programming and analysis of
the economic policies in the compound markets since independent decisions
in these markets are made by different associations and the market
mechanisms exert a significant effect on the allocation of the resources.
CGE models are mostly used in the economics of developing countries in
1. Ph.D. Student of Economics, University of Isfahan, Iran (Corresponding Author: [email protected]) 2. Associate Professor, Economics Department, University of Isfahan, Iran ([email protected]) 3. Assistant Professor, Economics Department, University of Isfahan, Iran ([email protected])
F

2/ Modeling of Growth and Welfare Effects of Tax Reform in Iran…
microeconomic scale, where estimation of the effects of the different
structures of tax and tariffs or energy policies on social welfare is in the
focus of attention. In developing countries, these models are applied in the
medium-term and long-term programs of the different microeconomic and
macroeconomic scenarios (Tayyebi, 2006). Robinson (1989) was a pioneer
in the application of the CGE models in developing countries. Demelo
(1988) also made use of these models for the analysis of commerce policies
in developing countries.
In recent years, numerous studies on the implementation of the tax on the
consumption and its corresponding merits over the taxation on the capital
income and wages have been conducted so that the accumulated capital and
saving can be encouraged. In the conduction of tax reform, the main problem
is to select an appropriate and correct taxation basis. This choice has
important consequences in terms of savings, economic growth, and
accumulated capital.
Both public finance and policy makers are willing to know which kind of
taxation causes the least damage and shows the maximum efficiency in
achieving the target income. One important issue related to the taxation
system is to determine whether the taxation helps in the promotion of
economic growth or rather hinders the growth. In the economic literature,
several questions concerning the relationship between the income tax of the
production factors and economic growth may be posed as follows: How does
the income tax of the production factors affect the long-term pattern of
economic growth? How do modifications in the amounts of the accumulated
capital change the results of the incidence of taxation in practice?
The aforementioned questions have been taken into account by Atkinson
and Stiglitz (1980) within the framework of the neoclassical balanced
growth pattern as well as the life cycle.
The preliminary work on taxation using the general equilibrium model
was carried out by Harberger (1962). In his study, Harberger made use of a
bipartite equilibrium model with two parameters (i.e., the work force and the
capital). Subsequently, Shoven and Whalley (1972) used the computable
general equilibrium model of taxation for the USA. These preliminary
studies set the ground for further research on computable general
equilibrium models (Shoven and Whalley, 1992).
2. Literature Review
2.1. Related theories
Atkinson and Stiglitz (1980) provided a theoretical analysis of the impacts of
capital income tax within the two frameworks of neoclassic growth and life

Iran. Econ. Rev. Vol.19, No. 2, 2015 /3
cycle model. Based on their observations, in both cases, tax exerts a negative
effect on savings and accumulated capital.
Blanchard and Fisher (1989) analyzed the government in a decentralized
economy based on the Ramsey model, where government costs are defined
as exogenous. In their study, the effects of variations in government costs–
with respect to the financing method– on the equilibrium were also taken
into account. In this regard, variations in government costs have been
analyzed while the budget is balanced. It has also been assumed that the
government consumes the resources and pays the related costs through taxes.
If the government imposes lump sum tax per capita, then in the steady state
of the government costs, the private sector’s consumption dramatically
deteriorates while the accumulated capital remains unchanged. If the
government applies tax on the capital returns and revenues the taxes to the
private sector as lump sum, the said tax causes disturbance and thus affects
the resource allocation. In this scenario, the capital tax causes the
accumulated capital of the steady state to decrease. Furthermore, the level of
consumption in the steady state goes down. By modeling the overlapping
generation pattern, they then concluded that if the increases in the
government expenses are compensated by parallel increases in the taxes, the
accumulated capital and consumption in the steady state decrease.
Using a series of modifications, Barro and Sala-Martin (2004) considered
the role of the government in the preliminary model of Ramsey. It has been
assumed that the government performs a balanced budget, and also wage
income tax w, private asset income tax a, consumption tax c, and firms'
earnings tax f, are imposed. It has also been assumed that each household
creates a fixed amount of work. In the said model, capital income is
effectively doubly taxed: once in the firm level in the rate of f, when the
earnings are given to the firm, and the second tax is associated with the
household level in the rate of a when this income is received as the rental
payments. In their suggested model, the rates of the income tax and wage tax
are disregarded from the equilibrium conditions. This problem is due to the
assumption that the amount of the work force supply by the household is
fixed. In this case, the lump sum wage tax is presumed to be with no
disturbance. If the leisure-work can be selected, then w is no longer
considered as a lump sum tax and does not affect the equilibrium. If c is
fixed, then the rate of consumption tax does not affect the consumption
choice by the passage of time. On the other hand, probable changes in c
affect the current and future consumption growth. For instance, if the rate of
the consumption tax is expected to increase in the future ( ̇ ), then
4/ Modeling of Growth and Welfare Effects of Tax Reform in Iran…
individuals are inclined to increase their current consumption while they are
likely to decrease their future consumption. In this context, as time passes,
the consumption rate decreases. Despite the selection of leisure-work, even a
fixed c with an impact on the work force supply can affect the equilibrium.
In the said model, the imposition of taxes on the income from capital results
in a decrease in the level of capital and consumption in the long term. These
effects are due to the fact that the said taxes are inclined to decrease the
saving.
2.2. Empirical studies
Using computable general equilibrium, Zonoor (2003) conducted a case
study of Iran and concluded that the imposition of tax on sale with a rate of
25% results in a decrease in the rate of employment in construction and
industrial sectors, while it increases the employment in the service sector.
Tax imposition on the wage in the industrial sector results in a decrease in
the work force involved, while it increases the employment in other sectors.
The imposition of tax (as great as 25%) on the capital income results in a
decrease in the capitals and an increase in the employment in the industrial
section. However, this generally results in a decrease in the production
amount in the industrial section. This taxation has resulted in an increase in
the accumulated capital in the construction and service sectors, while it has
decreased the accumulated capital in the agricultural sector.
Using a general equilibrium approach, Bhattarai and Okyere (2005)
investigated the growth and welfare effects of replacing the taxation on sale
with different ratios with the taxation on sale with uniform ratios among all
sectors in Ghana. Through the implementation of different scenarios, it has
been demonstrated that the replacement of the different tax on sale ratios
existing in the basic state with the uniform tax on sale ratios of 1% and 5%–
based on the 0.15 and 0.25 elasticity of substitution in production – results in
the static profits of 2.2% and 2.5% GDP in Ghana.
According to Myles (2009), taxation produces a negligible effect on
economic growth. He made use of both the final price and the average price
of the tax. Based on his study, economic growth is affected by numerous
factors, and hence the totality of all these factors must be taken into account.
Lumbantobing and Ichihashi (2012) studied the effects of tax structure on
economic growth and income distribution. The panel dataset used consisted of
65 countries over the period 1970-2006. Based on their findings, the rates of the
income tax of the companies have a significant negative effect on the economic
growth and income inequality. However, the rates of the income tax of the
individuals produce no effect on economic growth and income inequality.
Iran. Econ. Rev. Vol.19, No. 2, 2015 /5
Using a computable general equilibrium model, Hernandez (2012)
investigated the effects of removing the wage income taxes on the work
force market of Columbia. Based on his study, removal of the said tax has a
negligible effect on the rate of unemployment.
Amir et al. (2013) studied the effects of the latest tax reforms on key
macroeconomic variables and distribution of assets and incomes in
Indonesia. They found that, under the assumption of the balanced budget,
reductions in the income tax of individuals and that of companies might
affect economic growth. These modifications in the policies also result in a
slight decrease in the tax incidence of the assets. However, the said policies
can also increase income inequality since such reductions in taxes are more
advantageous for upper class families who have higher incomes.
3. Research Model
In order to achieve the research objectives, the present study has adopted the
standard general equilibrium model, developed by Lofgern et al. (2002) and
Decaluwé et al. (2013). The suggested model has also been modified in
terms of the economic properties of Iran. In what follows, this model will be
explained in detail.
3.1. Production sector
It is assumed that firms are active in a competitive environment. Each firm
maximizes its profits with respect to the production technology, and
accordingly the price of all commodities and services as well as the
production factors are defined. In other words, any given firm is presumed to
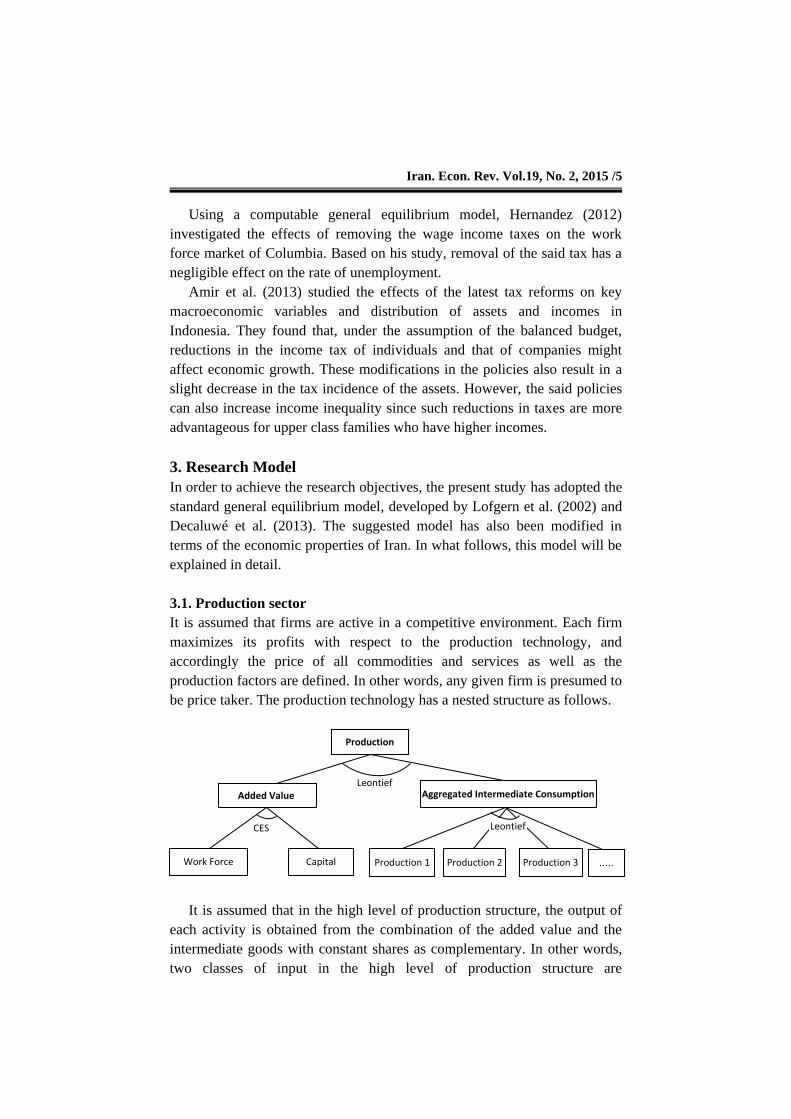
be price taker. The production technology has a nested structure as follows.
It is assumed that in the high level of production structure, the output of
each activity is obtained from the combination of the added value and the
intermediate goods with constant shares as complementary. In other words,
two classes of input in the high level of production structure are
CES
Production
Aggregated Intermediate Consumption Added Value
Capital Work Force Production 1 Production 2 Production 3 .....
Leontief
Leontief

6/ Modeling of Growth and Welfare Effects of Tax Reform in Iran…
complementary rather than substitutive. This combination is done based on
the production function of Leontief as follows.
VAj= νjXSTj (1)
CIj= iojXSTj (2)
In these relations, CIj is the total intermediate goods of the jth industry,
VAj is the added value of the ith industry, XSTj demonstrates the total output
of the ith industry, ioj shows the intermediate consumption factor in Leontief
function, and νj is the coefficient of the added value in Leontief function.
In the next stage of the production structure, the added value consumed
by each industry is achieved by the combination of the work force and the
capital. In this study, it is assumed that the combination of the work force
and the capital has a flexible substitution property. Besides, they are
assumed to be combined based on the production function with constant
elasticity substitution. Thus:
[
]
(3)
where Kj is the demand of the jth industry for the capital, Lj is the demand of
the jth industry for the work force, is the scale parameter of the added
value, is the share parameter for the added value, and finally
shows
the elasticity parameter for the added value.
The optimization behavior of the firm based on the maximization of
profit or minimization of the related costs results in the demand for the work
force and the capital. Moreover, if the marginal products of the work force
and the capital are considered equivalent to their prices, then the wage rate
and the capital rent rate are respectively obtained. Under the assumption of
the CES structure, based on the optimum behavior of the firm, the firm’s
demand from the work force with respect to the capital can be expressed as
follows:
[
]
(4)
In the above relation, Rj is the rate of the capital rent by the jth industry
and Wj the rate of the work force rent by the jth industry. Moreover,
stands for the transformation elasticity of the added value in CES function,
which can be written as follows.
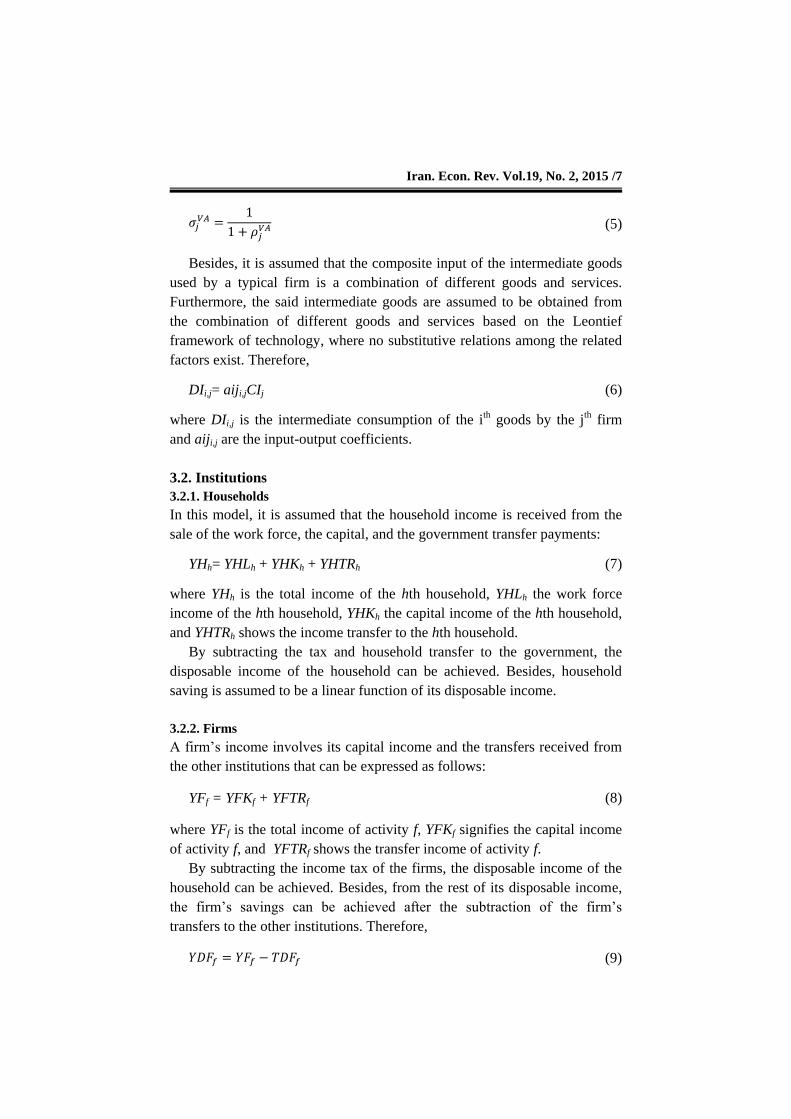
Iran. Econ. Rev. Vol.19, No. 2, 2015 /7
(5)
Besides, it is assumed that the composite input of the intermediate goods
used by a typical firm is a combination of different goods and services.
Furthermore, the said intermediate goods are assumed to be obtained from
the combination of different goods and services based on the Leontief
framework of technology, where no substitutive relations among the related
factors exist. Therefore,
DIi,j= aiji,jCIj (6)
where DIi,j is the intermediate consumption of the ith goods by the jth firm
and aiji,j are the input-output coefficients.
3.2. Institutions
3.2.1. Households
In this model, it is assumed that the household income is received from the
sale of the work force, the capital, and the government transfer payments:
YHh= YHLh + YHKh + YHTRh (7)
where YHh is the total income of the hth household, YHLh the work force
income of the hth household, YHKh the capital income of the hth household,
and YHTRh shows the income transfer to the hth household.
By subtracting the tax and household transfer to the government, the
disposable income of the household can be achieved. Besides, household
saving is assumed to be a linear function of its disposable income.
3.2.2. Firms
A firm’s income involves its capital income and the transfers received from
the other institutions that can be expressed as follows:
YFf = YFKf + YFTRf (8)
where YFf is the total income of activity f, YFKf signifies the capital income
of activity f, and YFTRf shows the transfer income of activity f.
By subtracting the income tax of the firms, the disposable income of the
household can be achieved. Besides, from the rest of its disposable income,
the firm’s savings can be achieved after the subtraction of the firm’s
transfers to the other institutions. Therefore,
(9)
8/ Modeling of Growth and Welfare Effects of Tax Reform in Iran…
∑
(10)
where SFf is the saving from activity f, TDFf is the income tax of activity f,
YDFf shows the disposable income of activity f, and TRag,f represents the
income transfers from activity f to the institutions.
3.2.3. Government
In the presented model, it is assumed that the government earns its income
from the income taxes of both households and firms, goods and services tax,
import tax, and other kinds of income. Moreover, the government earns
some income from the transfer income and capital income of other
institutions. The related equation can be written as follows:
(11)
∑ (∑
)
(12)
∑
(13)
where TDFT shows the total income of the government from the income tax
of the firms, TDHT represents the total income of the government from the
income tax of the households, TPRCTS is the total income of the government
from the import and production taxes, TPRODN stands for the total income
of the government from the other production taxes, YGK signifies the total
capital income of the government, and YGTR is the government transfer
income.
In this model, it is assumed that the government budget deficit (positive
or negative saving of the government) is the difference between the
government income and expenditure. Government income subsumes
transfers to the institutions and the current costs of goods and services as
follows:
∑
(16)
Here, SG is the government saving, G the government expenditures on
goods and services, and TRagng,gvt is the government transfers to the
institutions.
Iran. Econ. Rev. Vol.19, No. 2, 2015 /9
3.2.4. Foreign section
It is hypothesized that the foreign section receives payments for the values of
the imports, some part of the capital income, and transfers from the domestic
institutions. On the other hand, foreign costs in the domestic economy
involve the value of the exports and transfers to the domestic institutions.
The difference between the foreign receipts and payments is called the
foreign savings, which is equal to the value of the balance of trade:
∑
∑
(∑
)
∑
(15)
∑ ∑
(16)
(17)
Here, CAB is the balance of the current account, is the free on
board (FOB) price of the export of the ith product (per home currency),
SROW is the foreign savings, and YROW and is the foreign income.
3.3. Demand
The demand for goods and services, which may be either domestic or foreign
products, subsumes the intermediate demand, household consumption
demand, investment demand, government demand, and transportation
demand with margin trading. Households are presumed to have Stone-Geary
utility function. These utility functions are characterized by the minimum
goods consumption. Besides, they are privileged over the Cobb-Douglass
utility functions by the fact that such characterization does not impose the
cross price elasticity of zero between two types of commodities and the unit
elasticity of income for all commodities on the utility caused by the
household consumption. Furthermore, the said characterization provides
flexibility towards the possibility of transformation in terms of the variations
in the relative prices of the commodities in the model. The demand of
household h for each commodity is found based on the maximization of the
utility in terms of the budget limit. Therefore, the demand of household h for
the ith commodity can be expressed as follows:
( ∑
) (18)
10/ Modeling of Growth and Welfare Effects of Tax Reform in Iran…
where Ci,h shows the consumption of the ith commodity by household h,
is the minimum consumption of the ith commodity by household h,
PCi is the purchase price of the ith composite commodity (subsuming all
taxes and margin profit), and is the final share of the ith commodity in
the consumption budget of household h.
Investment demand involves the gross fixed capital formation (GFCF)
and variations in the inventory. The said two components of the investment
demand are separated from each other. It is assumed that the total investment
cost is determined by the equilibrium constraint of the investment-savings,
where the savings are presumed to be endogenous.
It is also assumed that the gross fixed capital formation is achieved by
subtracting the cost of variations in the inventories from the total investment
cost. Also, the GFCF is designated for different commodities with fixed
parts, which clearly implies that the new capital production function is of the
Cobb-Douglas type. Consequently, for a given level of investment costs, the
amount of demand for any given ith commodity for the investment target is
in proportion to its purchase price. The same hypothesis can be used for the
current government expenditures on goods and services. With a given value
of the current expense budget, it can be suggested that the demand value of
each commodity is inversely related to its price.
∑
(19)
(20)
(21)
where GFCF is the gross fixed capital formation, INVi shows the final
demand of the ith commodity for the investment targets, IT is the total
investment cost, VSTKi represents the variations in the inventory of the ith
commodity, is the part of the ith commodity in the total investment
cost, CG shows the public consumption of the ith commodity, and is
the part of the ith commodity in the total current public spending of the
government on goods and services.
In addition to the final application of the produced goods and services,
some parts of the said goods and services are used as intermediate
commodities in the production process. The intermediate demand for each
goods and services can be defined as the summation of the industry’s
demands as follows:
Iran. Econ. Rev. Vol.19, No. 2, 2015 /11
∑
(22)
Here, is the total intermediate demand for the ith commodity.
Finally, some commodities such as transportation and wholesale and
retail transactions are used to transport and deliver the commodities in the
market. Therefore, the final rates for the volume of the domestic productions
and imports are applied to determine the said final services, which are
required for the distribution of the commodities among the customers.
∑ ∑ ∑
(23)
where MRGNi is the demand of the ith commodity as the margin of
transportation or transaction.
3.4. Supply of producers and foreign trade
This section investigates the trade relations between the domestic and
foreign economies. These relations involve supply for exports and demands
for imports. These two relations are found based on the specification of the
customers’ behaviors towards different supply resources and the supply
behavior of domestic manufacturers. In this model, a small-sized country is
hypothesized, and thus the prices of the transacted commodities are global
and fixed (i.e., prices of imports and exports are assumed to be exogenous).
It is hypothesized that the products of each industry are supplied to both
domestic and foreign markets. The basis for the amount of supply in each of
these two markets is also determined based on the income maximization
behavior of the firm. The products supplied to a market are presumed to be
slightly different from the products supplied to another market. In other
words, it is assumed that an imperfect substitution exists between the
products produced for the domestic market and those intended for the export.
This assumption is used in the suggested model through the application of
the aggregation function with constant elasticity transformation (CET).
[
]
(24)
where XSj,i is the production of the ith commodity by the jth industry, shows
the supply of the ith commodity by the jth industry for domestic market,
is the scale parameter, β
points to the share parameter, and
shows the
elasticity parameter.

12/ Modeling of Growth and Welfare Effects of Tax Reform in Iran…
Relative supply functions are achieved from the first condition of the
income maximization with respect to the aggregation function of CET:
[
]
(25)
In this relation, is the transformation elasticity in CET function,
which can be written as follows:
(26)
In brief, the producer's behavior, defined in terms of the nested CET
functions, is in a way that at the higher level, the total products are assigned to
the products of different firms in the industry, while at the lower level, the
supply of each product is distributed between the domestic market and export.
Purchasers’ behavior coincides with the producer’s behavior.
Presumably, the local products are imperfect substitutions for the imports. In
other words, the commodities are heterogeneous in terms of their production
origin. Therefore, the commodities that are demanded in the domestic
market are composite commodities, which are provided through the
combination of the local (i.e., domestic) and the imported products.
Imperfect substitution between these two groups of commodities can be
defined based on the aggregation function with constant elasticity
transformation as follows:
[
]
(27)
Here, Qi is the amount of demand for the ith composite commodity,
is the scale parameter, is the share parameter, and
is the elasticity
parameter.
Unlike the sellers, the purchasers minimize their expenses with respect to
the CES aggregation function. The relative demand functions derived from
the first-order optimization conditions can be expressed as follows:
[
]
(28)
Here, PDi stands for the price of the domestic product i in the domestic
market, PMi represents the price of the import product i in the domestic
market, and refers to the elasticity transformation.

Iran. Econ. Rev. Vol.19, No. 2, 2015 /13
3.5. Prices
Different prices and price indexes naturally depend on the assumptions and
the subordinated figures used. In the aggregation states, the price of an
aggregation is the weighted sum of the prices of all its constituent parts.
Different prices have been considered in our suggested model as follows:
3.5.1. Cost of each Production Unit in the Industry
The cost of each production unit in the industry is equal to the weighted sum
of the prices of the added value and aggregated intermediate consumption;
thus,
(29)
In this relation,
⁄ and
⁄ are weights. By multiplying the
two sides of the above equation by XSTj, we have:
PPjXSTj = PVAjVAj + PCIjCIj (30)
The aggregated intermediate consumption price is a combination of the
prices of the intermediate input commodities of the industry. Besides, the
added value price is a combination of the capital and work force prices.
Thus:
( )
(31)
∑
(32)
(33)
where PTj is the basic price of the production of the jth firm and PCIj is the
intermediate consumption price index of the jth industry.
3.5.2. International Transactions Price
The exporting industries are permitted to sell their products in international
and domestic markets. Consequently, their aggregated production equals the
weighted sum of the obtained price in each market, which follows the
aggregate price rule. Weights of each market are indeed the ratio of the sold
products to the total amount of products. These weights change in response
to the changes in relative prices, which depend on the transformation
elasticity in CET. The basic price obtained by the jth industry is a weighted
14/ Modeling of Growth and Welfare Effects of Tax Reform in Iran…
sum of the basic prices in the domestic and export markets. The FOB price,
which is paid by the purchasers in the export market, is different from what
the producers receive in the said market. This difference is due to the price
margin and export taxes, which are to be considered in the model.
∑
(34)
(35)
( ∑
) (36)
The price of the composite commodity is a weighted sum of the paid
prices for the domestic and import products. The price paid for the domestic
products is equal to the sum of the prices considered by the producers, the
price margins, and indirect taxes. Similarly, the price paid for the imported
product is a global price, which is written in terms of the home currency and
is added to the import tax, price margins, and indirect tax.
3.5.3. Price indexes
Four price indexes have been defined in the model: GDP deflator index,
consumer price index, investment price index, and public expenses price
index.
The GDP deflator index is determined based on Fisher’s index, while the
consumer price index is defined based on Laspeyre’s price index. On the
other hand, the investment price and the public expense price indexes are
determined based on the price indexes.
3.6. Equilibrium in model
In order to solve the model, it is essential to balance the supply and demand
in the goods and service market with those in the factor market.
Furthermore, the investment cost is supposed to be equal to the summation
of the savings of the institutions. Finally, supply of the goods intended for
export is to be kept in balance with the demand for the said commodities.
∑
(37)
∑
(38)
Iran. Econ. Rev. Vol.19, No. 2, 2015 /15
∑
(39)
∑
∑
(40)
∑
(41)
∑
(42)
where LS is the work force supply and KS is the capital supply.
4. Experimental Results
4.1. Required data
In order to solve our designed general equilibrium model, the data from the
social accounting matrix (SAM), issued in the year 2010, has been used. Due
to the model's characteristics, the SAM matrix has been modified and its
extracted data have been used to solve the suggested model. In this study,
four different economic sectors (i.e., agriculture, mining and industry, oil
and gas, and service sectors) have been considered and aggregated.
Furthermore, different economic deciles of the rural and urban households
have been aggregated and used in our suggested model in the form of two
institutions as rural and urban households. Besides, the required data for
such parameters as part of the production factors and scale parameters have
been obtained based on the economic optimization relations. Moreover, in
this study, with respect to the general equilibrium model characteristics,
some of the model parameters have been assumed as exogenous and have
thus been investigated based on the previous national and international
studies while considering the economic conditions of Iran.
Using GAMS software programming, the proposed model in the previous
section has first been solved for the basic state. Then, using different
scenarios for the considered taxes, the model has been solved again and the
results of the variations in the target variables have been found. Finally, the
basic values have been compared with the values obtained after the
application of decreased taxes and the results have been presented. With
regard to each tax, the designed scenarios are 5%, 10%, 15%, 20%, 25%,
and 30% reduction in the considered tax rate.
4.2. Static analysis of growth and welfare effects of wage tax reform
Decreased tax on the wage income through the increased capability for
saving from the work force income results an increase in the volume of
investment. As shown in Table 1, a reduction in the wage tax rate as large as

16/ Modeling of Growth and Welfare Effects of Tax Reform in Iran…
30% results in a 2.8% increase in the investment (changes of the
accumulated capital) and a 0.15% increase in the gross domestic production
(GDP). Reduction in the wage tax leads to an increase in the work force
supply and a decrease in the production cost, and thus it results in increased
investment and GDP. Decrease in the rate of wage tax affects the structure of
production in the country with respect to the economic sectors. A decrease in
the said tax by increasing the returns (wage) after the work force tax results
in an increase in the work force supply in different sectors. In the
agricultural sector, a 30% reduction in the wage tax rate leads to a 0.22%
increase in the added value of the said sector. Besides, a 30% reduction in
the rate of the said tax results in an approximately 0.1% increase in the
added value of the industrial sector. Therefore, it can be suggested that
reduced wage tax affects the agricultural sector more than the industrial
sector, which is indicative of the fact that the agricultural sector is more
labor-intensive than the industrial sector. Reduced wage tax rate increases
the added value of the services sector much greater than that of the other
considered sectors, to the effect that a 30% reduction in the said tax leads to
an increase in the added value of the said sector as large as 2.7%. This
finding demonstrates that the services sector is the most labor-intensive of all
economic sectors, and hence it enjoys a big increase in its related added
value.
Table 1. Effects of wage tax reform (%)
Scenario 6 Scenario 5 Scenario 4 Scenario 3 Scenario 2 Scenario 1 Variable
4.02 5.3
3.33 4.4
2.65 3.49
1.98 2.6
1.3 1.72
0.65 0.85
Goods consumption by the urban and the rural households
2.8 2.45 2.12 1.7 1.17 0.86 Investment (changes in accumulated capital)
0.15 0.124 0.098 0.073 0.048 0.023 Gross domestic production
0.224 0.09 2.7
-2.67
0.186 0.074 2.23 -2.25
0.147 0.059 1.77 -1.84
0.11 0.044 1.32 -1.32
0.072 0.03 0.87 -0.65
0.036 0.014 0.43 -0.28
Added value sector Agricultural Industrial services Oil and gas
0.62 0.5 0.41 0.3 0.2 0.098 Government tax income
-2.67 -2.14 -1.84 -1.45 -1.02 -0.72 Government consumption
Source: research findings
Iran. Econ. Rev. Vol.19, No. 2, 2015 /17
Compared to the other sectors, in the oil and gas sector, reduction in the
income tax has produced a different effect and has thus resulted in a decrease
in the added value of the said sector under different scenarios. Decision
making on investment in the oil and gas sector is not as much affected by the
market signs and signals as it is increasingly affected by the government
policies, foreign exchange resources from the export of oil and gas, and
foreign resource adsorption state. Two main and salient features of the said
sector are its capital intensiveness and technology intensiveness. Due to the
nature of its plans and projects, this industry requires considerable
investments through the adsorption of different investors. In Iran, the private
sector cannot generally afford to finance oil and gas projects. In the present
time, parts of the financial resources required for oil and gas projects in Iran
are provided with Buy Back and finance, while some parts of these projects
are financed through the domestic (generally governmental) resources. It can
be expressed that a decrease in government income due to the decreased rate
of the wage tax leads to a decrease in the governmental capability to invest
in oil and gas projects, whereas the added value in this sector goes up.
At first, the decreased rate of the wage tax reduces the tax income of the
government, which in turn results in a decrease in the government
expenditures. A 30% decrease in the rate of the said tax leads to an
approximately 2.7% decrease in the government expenditures. On the other
hand, after a delay, reduction in the rate of the wage tax increases the
investment and gross national production, which in turn results in a increase
in the government tax income. For example, a 30% decrease in the rate of
the wage tax leads to a 0.6% increase in the government income. As
represented by Table 1, the decrease in the amount of the said tax generally
develops and produces a positive effect on the budget of the country.
Different criteria exist for the measurement of household welfare. In this
work, household welfare has been measured based on the consumption of
goods by households. Reduction in the rate of the wage tax has resulted in a
greater increase in the household welfare of the rural families than that of the
urban ones. Under scenarios 1 to 6, consumption of the urban households
has risen from 0.65 to 4.02%, whereas the rural households have increased
their consumption from 0.85 to 5.3%.
4.3. Static analysis of the growth and welfare effects of capital income
tax reform
Decreased rate of the capital tax leads to the relative cheapness of the
production factor of the capital with respect to the work force, and
consequently the investment volume increases due to the decrease in the
18/ Modeling of Growth and Welfare Effects of Tax Reform in Iran…
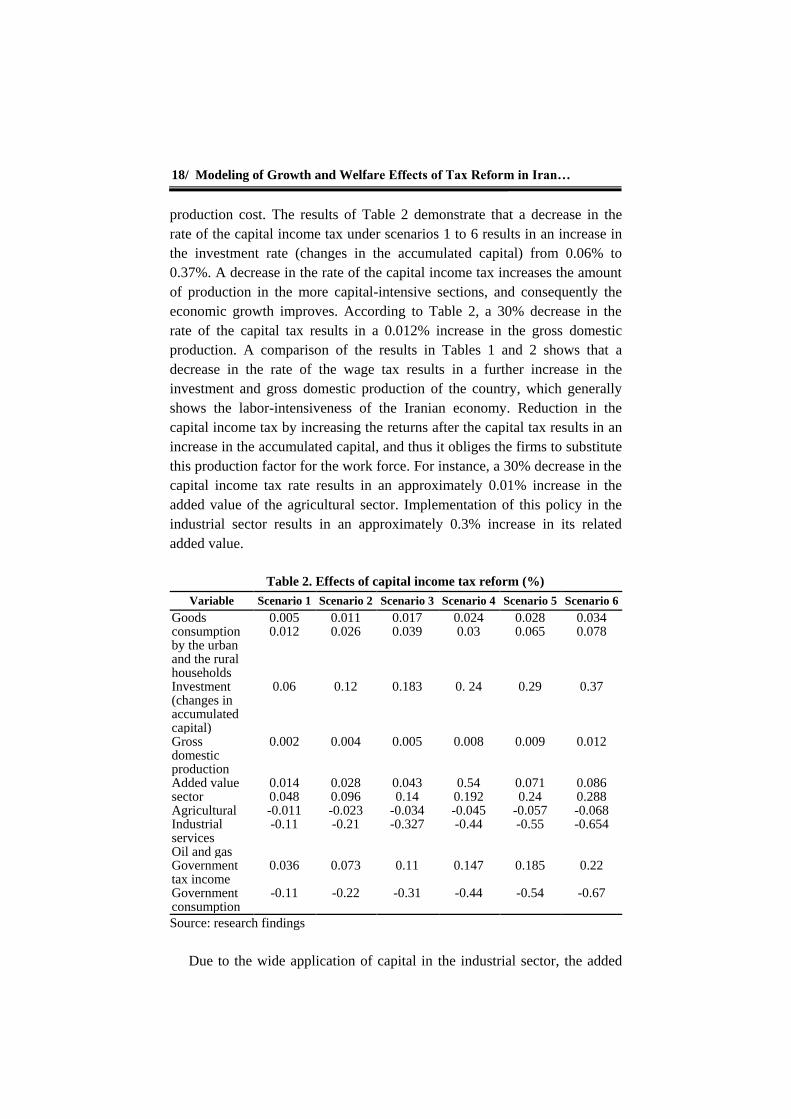
production cost. The results of Table 2 demonstrate that a decrease in the
rate of the capital income tax under scenarios 1 to 6 results in an increase in
the investment rate (changes in the accumulated capital) from 0.06% to
0.37%. A decrease in the rate of the capital income tax increases the amount
of production in the more capital-intensive sections, and consequently the
economic growth improves. According to Table 2, a 30% decrease in the
rate of the capital tax results in a 0.012% increase in the gross domestic
production. A comparison of the results in Tables 1 and 2 shows that a
decrease in the rate of the wage tax results in a further increase in the
investment and gross domestic production of the country, which generally
shows the labor-intensiveness of the Iranian economy. Reduction in the
capital income tax by increasing the returns after the capital tax results in an
increase in the accumulated capital, and thus it obliges the firms to substitute
this production factor for the work force. For instance, a 30% decrease in the
capital income tax rate results in an approximately 0.01% increase in the
added value of the agricultural sector. Implementation of this policy in the
industrial sector results in an approximately 0.3% increase in its related
added value.
Table 2. Effects of capital income tax reform (%)
Scenario 6 Scenario 5 Scenario 4 Scenario 3 Scenario 2 Scenario 1 Variable
0.034 0.078
0.028 0.065
0.024 0.03
0.017 0.039
0.011 0.026
0.005 0.012
Goods consumption by the urban and the rural households
0.37 0.29 0. 24 0.183 0.12 0.06 Investment (changes in accumulated capital)
0.012 0.009 0.008 0.005 0.004 0.002 Gross domestic production
0.086 0.288 -0.068 -0.654
0.071 0.24
-0.057 -0.55
0.54 0.192 -0.045 -0.44
0.043 0.14
-0.034 -0.327
0.028 0.096 -0.023 -0.21
0.014 0.048 -0.011 -0.11
Added value sector Agricultural Industrial services Oil and gas
0.22 0.185 0.147 0.11 0.073 0.036 Government tax income
-0.67 -0.54 -0.44 -0.31 -0.22 -0.11 Government consumption
Source: research findings
Due to the wide application of capital in the industrial sector, the added
Iran. Econ. Rev. Vol.19, No. 2, 2015 /19
value of the said sector is increased more by the policy of reduced capital tax
than the policy of decreased wage tax. This indicates the capital-
intensiveness of the industrial sector in Iran. Reduced rate of the capital
income tax in the services results in the increased production in the said
sector. However, this increase is not enough to compensate for the decreased
production due to the loss of the work force in this sector, and subsequently
the added value of the services decreases. Therefore, a 30% decrease in the
rate of the capital income tax results in an approximately 0.07% decrease in
the added value of services. Based on the results in Table 2, the
implementation of this policy also results in a decrease in the added value in
the oil and gas sector.
Reduced rate of the capital income tax first reduces the government
expenditures and then increases its income tax, and thus the government
budget improves. However, the policy of decreasing the said tax has less
effect on the government budget than the policy of decreasing the wage tax.
A 30% decrease in the rate of the capital income tax results in an
approximately 0.7% decrease in the government expenditure, while it leads
to a 0.2% increase in the rate of the government tax income.
According to our results, a decrease in the rate of the capital income tax
in our considered scenarios has generally increased the Iranian households’
welfare. However, the Iranian rural families have enjoyed more household
welfare than the urban families. In this context, the reduced rate of the
capital tax has caused the rural households to increase their consumption
from 0.012 to 0.078%.
4.4. Static analysis of growth and welfare effects of consumption tax
reform
In this section, the static computable general equilibrium model is analyzed
in light of the consumption tax. It is expected that a decrease in the rate of
the consumption tax increase the consumption demands of the individuals
and decrease their savings, which in turn results in the reduced volume of
investment in the economy. A 30% decrease in the rate of the consumption
tax results in a 0.12% decrease in the investment as well as a 0.0022%
decrease in the gross domestic production (Table 3). It can be observed that,
compared to the other two said taxes, this tax has a minimal effect on the
investment and production in the country. This finding is in complete
agreement with our theoretical expectations.

20/ Modeling of Growth and Welfare Effects of Tax Reform in Iran…
Table 3. Effects of consumption tax reform (%)
Scenario 6 Scenario 5 Scenario 4 Scenario 3 Scenario 2 Scenario 1 Variable
0.08 0.021
0.064 0.018
0.051 0.014
0.038 0.011
0.025 0.007
0.03 0.004
Goods consumption by the urban and the rural households
-0.12 -0.099 -0. 079 -0.059 -0.039 -0.019 Investment (changes in accumulated capital)
-0.0022 -0.0019 -0.0015 -0.001 -0.0007 -0.0003 Gross domestic production
0.062 0.2
0.004 -1.31
0.051 0.16
-0.003 -1.11
0.041 0.13
-0.003 -0.89
0.031 0.098 -0.002 -0.67
0.02 0.065 -0.001 -0.44
0.01 0.03 00
-0.22
Added value sector Agricultural Industrial services Oil and gas
0.1 0.084 0.067 0.05 0.033 0.017 Government tax income
-1.32 -1.11 -0.89 -0.65 -0.44 -0.22 Government consumption
Source: research findings
A 30% decrease in the rate of the consumption tax in industrial,
agricultural, and services sectors results in 0.2%, 0.062%, and 0.004%
increases in the added value of the said sectors, respectively. Based on the
observations, the greatest increase is related to the added value of the
industrial sector. This can be explained by the fact that in the industrial
sector, larger volume of commodities passes through the market channel.
Similar to the abovementioned policies, this policy also has a negative effect
on the added value of the oil and gas sector.
Based on the results of Table 3, the decreased rate of the consumption tax
under our considered scenarios increases the government tax income and
decreases its related costs, and consequently it generally improves the
government budget. A 30% decrease in the rate of consumption tax results in
a 0.1% increase in the government tax income and a 1.3% decrease in the
government expenditures.
According to Table 3, the decreased consumption tax effect on the
household welfare for the urban households is greater than the said effect for
the rural households. This can be due to the more dependency of the urban
families on the market commodities. The results show that, based on the
defined scenarios, the urban household consumption has increased from 0.03
to 0.08%.

Iran. Econ. Rev. Vol.19, No. 2, 2015 /21
5. Results and Discussion
Financial policies can affect the level of economic activities by changing the
returns after the application of the tax. The idea of transferring from the
income tax into the consumption tax is a challenging issue in economics. In
the present study, a static general equilibrium analysis of the effects of the
tax reform on the investment, gross domestic production, household welfare,
structure of production, and government budget variables has been provided.
Based on the analysis of the effect of reduction in the wage tax, it has been
observed that the said policy brings about some positive effects on the
accumulated capital and gross domestic production. This policy differently
affects the structure of product in various economic sectors. Reduction in the
wage tax rate has the greatest effect on the services, which indicates that the
said sector is the most labor-intensive sector in the economy of the country,
using this policy, the welfare of the rural households increases more than
that of the urban ones. This result shows that, in order to consume goods, the
rural households are more dependent on the income from their work force
than the urban households. In other words, the rural households’ marginal
propensity to consume based on the income from the work force is greater
than that of the urban households. Therefore, the reduction in the wage
income tax rate increases the consumption of the rural households more than
that of the urban families.
According to our obtained results on the decreased capital income tax, the
application of this policy increases the investment and gross domestic
production. The implementation of this policy affects the structure of
production in various sectors. Apart from the oil and gas sector, the most
affected sector by this policy is the industrial sector, which indicates the
capital-intensiveness of the said sector, compared to the other considered
economic sectors. This policy has also increased the household welfare of
both rural and urban families.
The results of Table 3 demonstrate that the reduction in the rate of the
consumption tax results in a decrease in the investment volume and gross
domestic production. Reduction in the rate of the consumption tax through
the reduction in the prices of consumable goods leads to an increase in the
households' demands for the said commodities, and hence it enhances the
household welfare.
Reductions in all three kinds of taxes negatively affect the added value of
the oil and gas sector. In Iran, domestic investment in oil and gas sector is
generally performed by the government, and reduction in the government tax
income decreases the added value created in the said sector. Our results also
show that reduction in the rates of the wage tax, capital income tax, and
22/ Modeling of Growth and Welfare Effects of Tax Reform in Iran…
consumption tax improves the government budget state. In this context, the
greatest effect is related to the wage tax.
The analytic results of the static general equilibrium tax model show that,
in Iran, wage tax reform exerts the greatest effects on the state economy –
followed by the capital income tax and consumption tax. Therefore, a
taxation ranking can be defined in the order of magnitude as wage tax,
capital income tax, and consumption tax. Based on the obtained results, our
policy recommendation is that, in order to reform the tax structure in Iran,
the government should follow the policy of transferring the taxes from the
wage tax through the capital income tax into the consumption tax.
Furthermore, the results of the research show that taxation on wages and
capital income negatively and taxation on consumption positively affect the
economic growth. In general, our obtained results demonstrate that the
conduction of tax reforms through a decrease in the wage tax and capital
income tax and through an increase in the consumption tax paves the way for
further economic growth and household welfare so that the government can
adopt the policy of transferring the tax base from the tax on the production
factors (i.e., work force and capital) to the tax on the consumption.
References
1. Amir, H., Asafu-Adjaye, J., & Ducpham, T. (2013). The Impact of the
Indonesian Income Tax Reform: A CGE Analysis. Economic Modeling,
31, 492–501.
2. Atkinson, A. B., & Stiglitz, J. E. (1980). Lectures on Public Economics.
McGraw-Hill.
3. Barro, R. J., & Sala-i-Martin, X. (2004). Economic Growth. McGraw-Hill.
4. Bhattari, K. R. & Okyere, A. (2005). Welfare and Growth Impacts of Tax:
Applied General Equilibrium Models of Ghana. Research Memorandum 53.
5. Blanchard, O. J., & Fisher, S. (1989). Lectures on Macroeconomics. The
MIT Press.
6. Dcaluwé, B., André, L., & Véronique, R. (2013). The PEP Standard,
Single- Country, Static CGE Model. Department of Economic,
University of Laval, Quebec.
6. DE Melo, J. (1988). Estimating the Cost of Protection: General
Equilibrium Approach. Quarterly Journal of Economics, 92, 2.
7. Dervis, K., DE Melo, J. & Robinson, Sh. (1981). A General Equilibrium
Analysis of Foreign Exchange Shortages in a Developing Economy. The
Economic Journal, 91, 891-906.
8. Harberger, A.C. (1962). The Incidence of Corporation Income Tax.
Journal of Political Economy, 70, 215-40.
Iran. Econ. Rev. Vol.19, No. 2, 2015 /23
9. Hernandez, G. (2012). Payroll Taxes and the Labor Market: A
Computable General Equilibrium Analysis. Latin American Journal of
Economics, 59, 123-99.
10. Johansen, L. (1960). A Multi-Sectoral Study of Economic Growth.
Amsterdam: North- Holland Publishing Co.
11. Lofgren, H., Harris, R. L., & Robinson, Sh. (2002). A Standard
Computable General Equilibrium (CGE). International Food Policy
Research Institute.
12. Lumbantobing, I. A., & Ichihashi, M. (2012). The Effects of Tax
Structure on Economic Growth and Income Inequality. IdEC Discussion
Paper, Hiroshima University.
13. Myles, G. D. (2009). Economic Growth and the Role of Taxation:
Aggregate Data. OECD Economics Department, ECO/WKP55.
14. Robinson, Sh. (1989). Multi-sectoral Models. Handbook of Development
Economics, 2, Elsevier Science Publisher, B.V.
15. Shoven, J. B., & Whalley, J. (1992). Applying General Equilibrium.
Cambridge Surveys of Economic Literature.
16. ---------- (1972). A General Equilibrium Calculation of the Effects of
Differential Taxation of Income from Capital in the U.S. Journal of
Public Economics, 1, 281-321.
17. Tayyebi, K., & Mesrinejad, S. (2006). Methodology of Computable
General Equilibrium (CGE): Theory and Application. Quarterly of
Economic Studies, 1, 103-132.
18. Zonoor, H. (2003). Pattern of Applied General Equilibrium for Analysis
of the Effect of Tax Imposition in Iran. Tehran: Economic Affairs Deputy
Publications, Ministry of Finance and Economy.