
Disease Progression in Multiple Sclerosis: Predicting Outcomes

Biometrics 000, 1–25 DOI: 000
000 0000
Modeling Multiple Correlated Functional Outcomes with Spatially
Heterogeneous Shape Characteristics
Kunlaya Soiaporn1,∗, David Ruppert2,∗∗, and Raymond J. Carroll3,∗∗∗
1School of Operations Research and Information Engineering, Cornell University, New York 14853, U.S.A.
2Department of Statistical Science and School of Operations Research and Information Engineering,
Cornell University, New York 14850, U.S.A.
3Department of Statistics, Texas A&M University, Texas, 77843, U.S.A.
*email: [email protected]
**email: [email protected]
***email: [email protected]
Summary: We propose a copula-based approach for analyzing functional data with multiple outcomes exhibiting
spatially heterogeneous shape characteristics. To accommodate the possibly large number of parameters in multiple
outcome data, parameter estimation is performed in two steps: first, the parameters for the marginal distributions are
estimated using the skew t family, and then the dependence structure both within and across outcomes is estimated
using a Gaussian copula. We develop an estimation algorithm for the dependence parameters based on the Karhunen-
Loeve expansion and an EM algorithm that significantly reduces the dimension of the problem and is computationally
efficient. We also demonstrate prediction of an unknown outcome when the other outcomes are known. We apply
our methodology to diffusion tensor imaging (DTI) data for multiple sclerosis (MS) patients with three outcomes,
and identify differences in both the marginal distributions and the dependence structure between the MS and control
groups. ROC curves show that the cross-correlations between DTI outcomes are predictive of MS status. Our proposed
methodology is quite general and can be applied to other functional data with multiple outcomes in biology and other
fields.
Key words: Diffusion Tensor Imaging; Gaussian copulas; Multiple sclerosis; Skewed functional data; Tractography
data
This paper has been submitted for consideration for publication in Biometrics

Modeling Multiple Correlated Functional Outcomes 1
1. Introduction
Functional data analysis (FDA) is a powerful tool for modeling data observed at various
time points or locations to uncover the underlying features that are assumed to vary over
a continuum of time points or locations. Ramsay and Silverman (2005) and Ferraty and
Romain (2010) provide a comprehensive review of functional data analysis. Often we obtain
multiple functional observations and we wish to study them simultaneously. In this case, it
is important to have tools to study the dependence structure between different outcomes.
The methodology should be efficient in reducing the dimension of the data to accommodate
the possible large size of functional data, especially in the case of multiple outcomes.
[Figure 1 about here.]
This study proposes a method for studying functional data with multiple outcomes that
exhibits some shape characteristics that vary with spatial or temporal location. Figure 1 illus-
trates an example of data that motivated this study. The data were obtained from a diffusion
tensor imaging (DTI) study of neuronal tracts in 162 multiple sclerosis (MS) patients and 42
healthy controls. DTI is a magnetic resonance imaging technique for measuring the diffusion
of water that can be used to detect abnormalities in brain tissue (see Basser et al., 1994,
2000). DTI tractography can be summarized by 3 functional outcomes, fractional anisotropy,
parallel diffusivity and perpendicular diffusivity, each along the normalized tract distance.
As seen in Figure 1, for each outcome, the pointwise mean and variance of both groups
seem to vary along the tract location and are different between the two groups. Another
interesting characteristic of this data is that the amount of skewness seems to vary along
the tract location as well. An appropriate methodology to study the data should be able
to capture this variation in the skewness, especially because skewness is related to disease
status and could provide insights into the disease process.

2 Biometrics, 000 0000
Much of the FDA literature assumes Gaussian marginal distributions, but non-Gaussian
functional data is not uncommon. Fortunately, models for non-Gaussian data are now being
developed. Staicu et al. (2011) developed a copula-based approach for analyzing functional
data with one outcome and applied their study to the parallel diffusivity measurement
from this DTI data. The data were assumed to have pointwise marginal distributions in a
parametric family with shape parameters such as a skew normal or skew t family (Azzalini,
1985; Azzalini and Capitanio, 1985). The mean, standard deviation and shape parameter
functions were modeled nonparametrically as functions of location. The dependence structure
was estimated assuming an underlying Gaussian or t copula using methods based on principal
component analysis (PCA) or the sample Kendall’s tau matrix. Their results showed that
the marginal mean, variance, and skewness functions were different between the healthy and
MS groups, while the correlation within the outcome is remarkably similar between the two
groups. In contrast, we found the interesting result that the correlation between two different
outcomes can differ between the MS patients and controls; see Section 5.
There have been many other studies using the DTI tractography for MS patients. For
instance, Reich et al. (2005) analyzed various indices obtained from DTI tractography to
identify abnormalities in MS patients. Goldsmith et al. (2011a,b, 2012) studied DTI data
using penalized functional regression. Longitudinal functional PCA (LFPCA) was introduced
by Greven et al. (2010) to account for the longitudinal variability of tractography data in
MS. LFPCA extended the MFPCA approach of Di et al. (2009) who focused on replicated
functional data. See Staicu et al. (2003) for the application of PCA for complex multilevel
spatially correlated functional data. McLean et al. (2012) introduced a functional generalized
additive model and applied it to the relationship between a cognitive test score and DTI
tractography.
Modeling Multiple Correlated Functional Outcomes 3
There are relatively few previous studies that analyze the relationship between multiple
functional outcomes. Ramsay and Silverman (2005) explained and demonstrated a PCA
methodology to study the simultaneous variation of more than one functional outcomes. Zhou
et al. (2008) used a functional data approach to analyze paired longitudinal data based on a
mixed-effect model framework. One of the main challenges in analyzing functional data with
multiple outcomes is the number of parameters that need to be estimated. As the number of
outcomes grows, the traditional method of moment estimators might not be practical. We
overcome this challenge with two important tools: 1) using the copula approach introduced
by Staicu et al. (2011) so that the marginal distributions of the data and its dependence
structure can be modeled separately, and, 2) under the Gaussian copula assumption, applying
the Karhunen-Loeve (KL) expansion for Gaussian processes to write the data processes as a
sum of a small number of components. The dependence between outcomes can be modeled
through the dependence between their components. The resulting covariance structure of
these components is similar to those in the study by Zhou et al. (2008) under a mixed-
effect model framework. We develop a similar EM algorithm as done by Zhou et al. (2008)
to calculate maximum likelihood estimators of the copula parameters. Our algorithms are
fast and does not require separated steps to model the dependence within each outcome
and between different outcomes. This allows the use of a bootstrapping technique to obtain
confidence intervals for the estimates. We also explain the steps needed to predict an outcome
when all of the other outcomes are known, along with its prediction intervals.
We demonstrate our methodology using the DTI data from the healthy and MS groups.
The objective is to identify the locations where the abnormalities occur and also explain the
characteristics of the abnormalities. The intention is to use differences between controls and
diseased subjects in any DTI characteristics to help understand the disease process. These
differences should be useful for detecting MS and for monitoring the progress of a treatment.

4 Biometrics, 000 0000
We found the same result as in Staicu et al. (2011) for parallel diffusivity. Each of the mean,
variance, and skewness functions differs between the two groups. For fractional anisotropy
and perpendicular diffusivity, only the mean and variance functions are significantly different.
The correlations within each outcome are similar for the two groups. Our most important
finding is that the cross-correlation between fractional anisotropy and parallel diffusivity is
different between the MS and control groups in the middle part of the tract (roughly from
tract locations 0.2 to 0.8). The cross correlation in this tract section is slightly positive in
the control group, while it is negative in the MS group. Bootstrapping confirms that the
difference is significant. In Section 5 we develop a novel method for predicting disease status
using the difference in cross-correlation structure between MS cases and controls. ROC curves
with confidence intervals show that there is statistical significant predictive power.
The difference between the two groups in the cross-correlation between the fractional
anisotropy and the perpendicular diffusivity is less apparent, while the cross-correlation
between the perpendicular and parallel diffusivities is similar in most parts of the tract.
The article is organized as follows. We briefly explain the process for estimating marginal
distributions and present the model for the dependence structure in Section 2. In Section 3,
the EM and prediction algorithms are presented. In Sections 4 and 5, the methodology is
applied to simulated data sets and the DTI data, respectively. Section 6 concludes with a
discussion including possible extensions.
2. Modeling Multiple Outcomes
Let Yip(tij); tij ∈ T with j = 1, 2, . . . ,mi be the data from outcome p, p = 1, 2, . . . , P for
subject i, i = 1, 2, . . . , N observed at a grid points ti1, . . . , timi ∈ T . Following the copula
approach introduced by Staicu et al. (2011), we suppose that
Yip(t) = µp(t) + σp(t)G−1 Wip(t);αp(t) (1)

Modeling Multiple Correlated Functional Outcomes 5
where µp(t) is the mean function and σp(t) is the standard deviation function of outcome
p. Here Wip(t) is a latent process such that for each t, Wip(t) is uniformly (0,1) distributed,
and G−1(·, α) is the inverse of G in a parametric family of distribution functions with zero
mean, unit variance, and shape parameter α. For example, G can be a skew normal or skew t
distribution. In the case of the skew normal, the shape parameter is the skewness parameter,
while in the case of the skew t, the shape parameter includes the skewness parameter and the
degree of freedom (Azzalini, 1985; Azzalini and Capitanio, 1985). We assume that µp(t), σp(t)
and αp(t) vary smoothly with t. The main objective is to estimate the marginal parameter
functions and the dependence structure within each outcome and across different outcomes.
We take a two-step approach. In the first step, we estimate the marginal parameter functions
µp(t), σp(t), and αp(t) for each outcome p. In the second step, we estimate the correlation
function of Wip(t).
2.1 Modeling Marginal Distribution
This section summarizes the method used to estimate the marginal parameter functions. For
details, see Staicu et al. (2011). The estimation is done in two steps.
step 1: For simplicity, suppose the data are observed on a common dense grid of points
so that tij = tj for all i and j = 1, 2, . . . ,m. In this first step, we obtain an undersmoothed
estimates µp(t), σp(t) and αp(t) for µp(t), σp(t), and αp(t) by maximizing the pointwise
likelihood function
ℓ µp(tj), σp(tj), αp(tj) =N∑i=1
log
[g
Yip(tj)− µp(tj)
σp(tj)
;αp(tj)
]− logσp(tj) (2)
where g(y;α) = ∂G(y;α)/∂y is the density function corresponding to the distribution
function G. When G is assumed to be a skew normal or skew-t distribution, the estimates
µp(t), σp(t) and αp(t) can be computed using the functions sn.mle or st.mle from R package

6 Biometrics, 000 0000
sn (Azzalini, 2011). See Staicu et al. (2011) for a discussion for the case of sparse data and
alternative methods.
step 2: The estimates from step 1 are smoothed further using penalized splines. Write
the mean function as µp(t) = B(t)Tβµ,p, where B(t) is a vector of spline functions evaluated
at t and βµ,p is a vector of spline coefficients. The estimates βµ,p for βµ,p are obtained by
minimizing the penalty criterion
PLµ(βµ,p) =m∑j=1
µp(tj)−BT
j βµ,p
2+ λµ,pΩµ,p(βµ,p), (3)
where Ωµ,p = βTµ,pDµ,pβµ,t, Bj = B(tj), and Dµ,p is a penalty matrix. See Ruppert et al.
(2003) for a discussion of penalized splines and penalty matrices. The final estimates µp is
B(t)T βµ,p. The estimates for the standard deviation function can be computed similarly. For
the shape parameter function, Staicu et al. (2011) proposed a penalized marginal pseudo-
likelihood criterion where the mean and variance parameter functions are fixed at estimates.
That is, the criterion to be minimized are
PLα(βα,p) = −2N∑i=1
m∑j=1
[ℓijβα,p; Yip(tj)] + λα,pΩα,p(βα,p) (4)
where Yip(tj) = Yip(tj)− µp(tj /σp(tj) are the standardized observations and ℓij(βα,p; Yip(tj)) =
log[gYip(tj);BTj βα,p]. In some cases, it might be better to model a transformed parameter
h(α) instead of α. Some possible criteria for choosing smoothing parameters are the restricted
maximum likelihood (REML) (Wood, 2006), AIC, corrected AIC (Ruppert et al., 2003) and
cross-validation (CV). See Staicu et al. (2011) for details and a discussion of smoothing
parameter selection and an alternative method.
2.2 Modeling the Dependence across Different Outcomes
We assume Gaussian copulas for simplicity and because they seem adequate for our purposes.
After the estimates of the parameters of marginal distributions for each outcome µp(t), σp(t)

Modeling Multiple Correlated Functional Outcomes 7
and αp(t) are obtained, we transform the observed outcome by
Rip(t) = Φ−1
[G
Yip(t)− µp(t)
σp(t); αp(t)
], (5)
where Φ is the cumulative distribution function of the standard normal distribution, and
G(·;α) is the distribution function of a distribution with mean 0, variance 1, and shape
parameter α. We model Rip as the sum of two independent components: 1) a finite Karhunen-
Loeve (KL) expansion with a small number of components, and 2) a white noise process with
variance σ2ϵp. That is,
Rip(t) =
Kp∑k=1
Zipkfkp(t) + ϵip(t), (6)
where Zikp, k = 1, 2, . . . , Kp are normally distributed with mean 0 and are independent
across k, and fkp are the eigenfunctions of the covariance function of the process Rip(t) (Levy,
2008). To have the marginal variance of Rip(t) equal to 1, we require that for all t,
Kp∑k=1
f 2kp(t)var(Zipk) + σ2
ϵp = 1. (7)
For identifiability purpose, we assume that the variances of Zikp, k = 1, 2, . . . , Kp are in
decreasing order.
The eigenfunctions fkp can be estimated using splines as follows. Let b(t) = b1(t), . . . , bq(t)T
be an orthonormal spline basis, i.e.∫T bk(t)bl(t)dt = δkl where δkl is the delta function. We
estimate fp = (f1p, . . . , fKp,p)T using b(t) as
fp(t)T = b(t)TΘp (8)
where Θp is a matrix of spline coefficients with dimension q ×Kp with orthogonal columns.
The orthogonality of b(t) and Θp implies the orthogonality of the principal component curves
fkp.
Let Zip =(Zip1, . . . , ZipKp
)Tand Zi =
(ZT
i1, . . . , ZTiP
)T. Let Dp = cov(Zip), which is
diagonal since the Zipk are independent across k. To have identifiability, we also have that

8 Biometrics, 000 0000
the diagonal elements of Dp are in a decreasing order. Let Cpp′ = cov(Zip, Zip′). Then we can
write the covariance matrix Σ of Zi as
Σ = cov(Zi) =
D1 C12 · · · C1P
C21 D2 · · · C2P
......
. . ....
CP1 CP2 · · · DP
(9)
Suppose that we have the same observation times tj, j = 1, 2, . . . ,m for every subject i.
Let Rip = Rip(t1), . . . , Rip(tm)T , B = b(t1), . . . , b(tm)T and ϵip = ϵip(t1), . . . , ϵip(tm)T .
Putting everything together, we have the following reduced-rank model for Rip,
Rip = BΘpZip + ϵip (10)
ϵip ∼ N(0, σ2ϵpIm), Zip ∼ N(0, Dp), cov(Zip, Zip′) = Cpp′ , for p = p′.
Our reduced-rank model for the latent processes (10) has a similar dependence structure
as the model for two outcomes introduced by Zhou et al. (2008). Here we adopt a similar
approach using an iterative EM algorithm for estimating the parameters.
To have identifiability, it is sufficient to require that the first nonzero elements of each
column of Θp are positive. With finite samples, it is best to determine the sign using the
elements with the largest magnitude in each column of Θp, since this choice is least influenced
by finite-sample random fluctuation (for details, see Zhou et al., 2008). In our estimation
algorithm, we require that, in every iteration, the element with the largest magnitude in
each column of Θp is positive. In the next section, we develop an algorithm for estimating
parameters in model (10).

Modeling Multiple Correlated Functional Outcomes 9
3. Estimation Algorithms
This section explains the criterion and algorithm for estimating parameters, along with a
discussion of tuning parameter specification. We also explain how to predict an outcome
after we have observed each of the other outcomes.
3.1 Parameter Estimation Algorithm
The estimates of the dependence parameters can be obtained by maximizing the pseudo-
likelihood, with Rip obtained by transforming the observed data using the estimates of the
marginal parameters. Let Li(Λ) denote the contribution to the likelihood from individual i,
where Λ is the covariance matrix of Ri = (RTi1, . . . , R
TiP )
T . The loglikelihood for individual i
is given as
logLi(Λ) = −Pm
2log(2π)− 1
2log |Λ| − 1
2RT
i Λ−1Ri, (11)
where Λ can be computed in terms of(Θp ,Σ,
σ2ϵp
)as
cov(Ri) = Λ =
Λ11 Λ12 · · · Λ1P
Λ21 Λ22 · · · Λ2P
... · · · . . ....
ΛP1 ΛP2 · · · ΛPP
where
Λpp = BΘpDpΘTpB
T + σ2ϵpIm and Λpp′ = BΘpCpp′Θ
Tp′B
T (12)
Even though the main interest here is to estimate the covariance matrix Λ of Ri, not the
principal component functions which can obtained from Θp, we use the reduced-rank model
for Rip so that our estimation algorithm involves estimating Dp, Cpp′ and Θp which are of
much smaller size than Λ. The KL expansion also provides a nice diagonal structure for Dp.
Our iterative algorithm estimates Dp and Cpp′ sequentially. Once the estimates for all of the

10 Biometrics, 000 0000
parameters are obtained, the estimated covariance of Rip(t) can be computed by plugging in
the estimates to equation (12).
Extending the approach as in Zhou et al. (2008), we use the penalized pseudo-likelihood
and minimize
−2N∑i=1
logLi(Λ) +P∑
p=1
λp
Kp∑k=1
ΘTpk
∫b′′(t)b′′(t)TdtΘpk
=N∑i=1
Pm log(2π) + log |Λ|+RT
i Λ−1Ri
+
P∑p=1
Kp∑k=1
λpkΘTpk
∫b′′(t)b′′(t)TdtΘpk, (13)
where Θpk denotes the kth column of Θp, and λpk are the smoothing parameters. In general,
we can have different λpk for each fpk. Since smoothing parameters are mostly determined by
the scale of data, to simplify the computation, we assume that λpk = λp for all k = 1, . . . , Kp.
Minimizing this expression can be complicated. Instead, we treat the Zi as missing values
and use the EM algorithm (Dempster et al., 1977). The joint loglikelihood is given as
logL(Ri, Zi) = log f(Ri1|Zi1) . . . f(Rip|Zip)f(Zi)
=P∑
p=1
−m
2log(σ2
ϵp)−1
2σ2ϵp
(Rip −BΘpZip)T (Rip −BΘpZip)
−1
2log(|Σ|)− 1
2ZT
i Σ−1Zi. (14)
The EM algorithm is performed as follows:
The E-step: Compute the conditional distribution of Zi given Ri
The M-Step: Update the parameter estimates by minimizing
−2E
N∑i=1
logL(Ri, Zi)
∣∣∣∣Ri
+
P∑p=1
λp
Kp∑k=1
ΘTpk
∫b′′(t)b′′(t)TdtΘpk (15)
The details for each step are given in Web Appendix A.

Modeling Multiple Correlated Functional Outcomes 11
3.2 Specification of Splines and Tuning Parameters
Recall that we require the splines b(t) used to estimate the eigenfunctions fp(t) to be
orthonormal; see equation (8). This implies that the matrix B = b(t1), . . . , b(tm)T has
to be orthogornal. As in Zhou et al. (2008), to obtain an orthogonal matrix B, we start
by choosing any spline basis b(t), such as a truncated power basis, and then we evaluate
these functions at the observation points to obtain the matrix B = b(t1), . . . , b(tm)T . Let
B = QR be the QR decomposition of B, where Q is an orthogonal matrix and R is an upper
triangular matrix. Then the orthogonal matrix B is obtained by B = BR−1. R package
orthogonalsplinebasis (Redd, 2011) provides functions for orthogonalizing a spline basis.
The two sets of tuning parameters that need to be specified are the spline smoothing
parameters, λp, and the number of components in the KL expansion, Kp. For penalized
splines, the knots are typically placed at fixed quantiles of the observation times or locations,
and the number of knots are not critical provided that it is sufficient large. The smoothness of
the curves is mainly determined by the smoothing parameters λp (Ruppert, 2002; Ruppert
et al., 2003). We start by performing the analysis for each individual outcome. For each
outcome p, we specify a range of λp for the grid search. For each λp fixed at a value in the
grid search range, we vary the number of components starting with only one component.
The EM algorithm (as explained in Section 3.1) is used to fit each 1-outcome curve. We
keep adding another component and performing the EM algorithm until the variance of the
newly added principal component score is less than a prespecified small fraction of that of the
previously added component. The number of components before adding this last component
is Kp chosen for this λp. The corrected AIC (Ruppert et al., 2003) is computed for this
(λp, Kp). The pair (λp, Kp) with the minimum corrected AIC is selected for this outcome.
Other criteria such as CV and AIC can also be used. Once we analyze multiple outcomes,
the number of components can be fine tuned further. We do not expect the values of λ to

12 Biometrics, 000 0000
change from the individual to the multiple outcome case, as λ should depend on the scale of
individual outcome data more than the dependence structure between outcomes.
3.3 Confidence Intervals for Estimates
Bootstrapping can be easily applied to obtain pointwise confidence intervals for the esti-
mates for the marginal distribution parameters and the correlations. Bootstrap samples are
obtained by resampling the subjects from the original data Yip. For each bootstrap sample,
we calculate estimates for the marginal distribution parameters (as explained in section 2.1),
use them to transform the data as in equation (5), and then perform the EM algorithm to
obtain estimates for the correlations, by plugging in the parameter estimates to equation
(12). The pointwise confidence intervals for the estimates of both the marginal distribution
parameters and the correlations are computed based on sample quantiles of the estimates
for the bootstrap samples.
3.4 Prediction of an Outcome Using all the Other Outcomes
In addition to simplifying the computation for parameter estimation, our reduced-rank model
for multiple outcomes also provides a straightforward way of predicting an outcome for an
individual when all the other outcomes of the same subject are known. This can be done
using the conditional distribution property of the multivariate normal random variables as
follows. Suppose we have the observation Yip of a subject i for all outcomes p = 1 and we
want to predict outcome 1 for this individual. Let Rip denote the transformed process as in
equation (5). Since we have that (Ri1, . . . , RiP ) ∼ N(0,Λ), we can compute the conditional
distribution of Ri1 as
Ri1|Ri2, . . . , RiP ∼ N(µ1, Σ1
)(16)

Modeling Multiple Correlated Functional Outcomes 13
where
µ1 =
(Λ12 . . . Λ1P
)Λ22 . . . Λ2P
.... . .
...
Λ2P . . . ΛPP
−1
Ri2
...
RiP
,
and
Σ1 = Λ11 −(Λ12 . . . Λ1P
)Λ22 . . . Λ2P
.... . .
...
Λ2P . . . ΛPP
−1
Λ21
...
ΛP1
.
Then µ1 can be used as a predictor forRi1. A prediction Yi1 for Yi1 is obtained by transforming
µ1 back as
Yi1(t) = G−1 Φ(µ1); α1(t) σ1(t) + µ1(t), (17)
using the estimates µ1(t), σ1(t), α1(t) obtained earlier. The standard deviation of the pre-
diction error can be computed using bootstrapping and used for a prediction interval. The
prediction for other outcomes can be done similarly.
4. Simulation Studies
In this section, we demonstrate our methodology using simulated data. As far as we are
aware, there exist no other estimators for multiple functional outcomes of the type we are
considering, that is, with spatially varying non-Gaussian characteristics. Therefore, there are
no competing estimators to compare with ours.
The simulated data contains 100 datasets, each containing P = 3 outcomes from N = 200
subjects. Each observation is taken at the common time points tj, j = 1, 2, . . . , 80. The data
are generated using the finite KL expansion for Gaussian processes as follows:

14 Biometrics, 000 0000
(1) For p = 1, 2, 3, generate
Qip(t) =
Kp∑k=1
Zipkhkp(t) + ϵip(t), (18)
where K1 = K2 = 2, K3 = 3, ϵip(t) ∼ N(0, τ 2p ), τ21 = 0.2, τ 22 = 0.3, τ 23 = 0.4, Zi =
(Zi11, Zi12, Zi21, Zi22, Zi31, Zi32, Zi33) is normal with mean 0 and covariance matrix
6.47 0 −4.46 1.53 2.93 0.31 1.76
0 4.08 0.02 0.89 0.99 −2.39 −1.14
−4.46 0.02 20.03 0 −3.52 2.61 −4.05
1.53 0.89 0 7.46 3.51 −2.01 −1.43
2.93 0.99 −3.52 3.51 16.34 0 0
0.31 −2.39 2.61 −2.01 0 7.63 0
1.76 −1.14 −4.05 −1.43 0 0 2.98
The functions hkp(t) are the normalized version of sin(πt) and cos(πt) for p = 1,
t2 − 13t+ 43/6 and t+ 0.5 for p = 2, and et, t− (e− 1)−1 and t2 − 1.0025t+ 0.1654 for
p = 3. Then we transform Qip(t) to
Rip(t) =Qip(t)
σp(t), where σ2
p(t) =
Kp∑k=1
var(Zipk)h2kp(t) + τ 2p , (19)
so that Rip(t) has a marginal N(0,1) distribution.
(2) Generate the observations
Yip(t) = µp(t) + σp(t)G−1 [Φ Rip(t) ;αp(t)] , (20)
where Φ(·) and G(·;α) denote the cumulative distribution functions of the standard
normal and skew normal distribution with mean 0, variance 1 and shape parameter α,
respectively. The mean and shape parameter functions are
Modeling Multiple Correlated Functional Outcomes 15
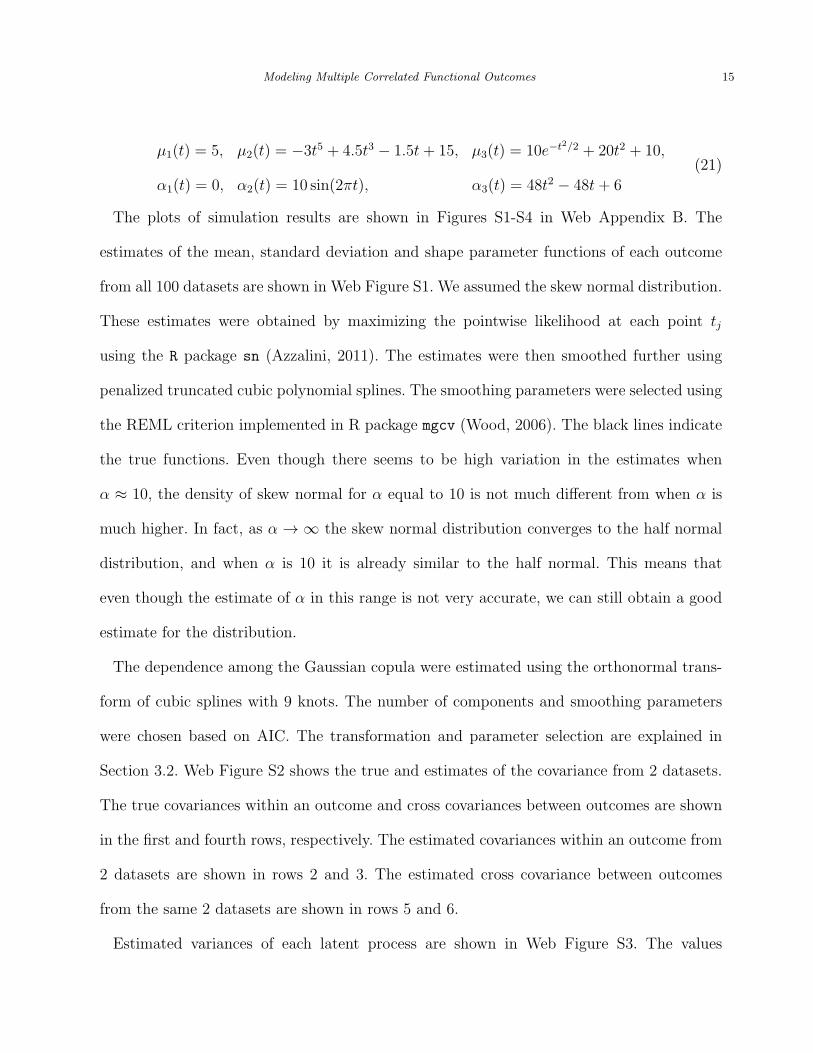
µ1(t) = 5, µ2(t) = −3t5 + 4.5t3 − 1.5t+ 15, µ3(t) = 10e−t2/2 + 20t2 + 10,
α1(t) = 0, α2(t) = 10 sin(2πt), α3(t) = 48t2 − 48t+ 6
(21)
The plots of simulation results are shown in Figures S1-S4 in Web Appendix B. The
estimates of the mean, standard deviation and shape parameter functions of each outcome
from all 100 datasets are shown in Web Figure S1. We assumed the skew normal distribution.
These estimates were obtained by maximizing the pointwise likelihood at each point tj
using the R package sn (Azzalini, 2011). The estimates were then smoothed further using
penalized truncated cubic polynomial splines. The smoothing parameters were selected using
the REML criterion implemented in R package mgcv (Wood, 2006). The black lines indicate
the true functions. Even though there seems to be high variation in the estimates when
α ≈ 10, the density of skew normal for α equal to 10 is not much different from when α is
much higher. In fact, as α → ∞ the skew normal distribution converges to the half normal
distribution, and when α is 10 it is already similar to the half normal. This means that
even though the estimate of α in this range is not very accurate, we can still obtain a good
estimate for the distribution.
The dependence among the Gaussian copula were estimated using the orthonormal trans-
form of cubic splines with 9 knots. The number of components and smoothing parameters
were chosen based on AIC. The transformation and parameter selection are explained in
Section 3.2. Web Figure S2 shows the true and estimates of the covariance from 2 datasets.
The true covariances within an outcome and cross covariances between outcomes are shown
in the first and fourth rows, respectively. The estimated covariances within an outcome from
2 datasets are shown in rows 2 and 3. The estimated cross covariance between outcomes
from the same 2 datasets are shown in rows 5 and 6.
Estimated variances of each latent process are shown in Web Figure S3. The values

16 Biometrics, 000 0000
close to 1 indicate the closeness to our assumption that the latent processes have marginal
variance of 1. The square root of the integrated mean square error (IMSE), integrated square
bias (IBIAS) and integrated variance (IVAR) for the marginal parameter functions and
covariance parameters are shown in Table S1 in Web Appendix B. These quantities are
calculated, for example, for the mean function by IMSE =∫ 1
0E µ(t)− µ(t)2 dt, IVAR =∫ 1
0Var µ(t) dt and IBIAS =
∫ 1
0
[E µ(t) − µ(t)
]2dt. Here E and Var denote the sample
mean and sample variance, respectively. Overall, the bias and variance are low for the mean
and standard deviation estimates. The bias for the shape parameter estimates are somewhat
high, especially, as seen from Web Figure S1, at locations with high α (in absolute value).
This should not affect our estimated marginal distributions too much as explained earlier.
The covariance estimates have small IMSE. The contour plots of pointwise square root of
the mean square error for the covariance estimates are shown in Figure S4.
5. Application to Diffusion Tensor Imaging (DTI)
In this section, we apply our methodology to the DTI data. A subset of our data set is freely
available as the DTI data set in R’s refund package Crainiceanu et al. (2012).
DTI is a magnetic resonance imaging technique that measures the diffusion of water in
tissue. The anisotropy of water diffusion allows images of the white matter in the brain to be
generated. White matter tracts are made up of axons that transmit signals between different
regions of the brain. These axons are surrounded by and insulated by a fatty substance called
myelin which helps the signal to be carried quickly. Multiple sclerosis is an autoimmune
disease associated with damage to myelin and can lead to significant disabilities in patients
(Goldsmith et al., 2012).
DTI provides many measurements of water diffusion. In this study, we consider 3 mea-
surements: 1) fractional anisotropy, 2) parallel diffusivity and 3) perpendicular diffusivity.
Parallel and perpendicular diffusivities are diffusion parallel and perpendicular to the long

Modeling Multiple Correlated Functional Outcomes 17
axis of a fiber bundle, respectively, while fractional anisotropy measures the difference of
diffusion in the two directions. Mathematically, at each location, DTI tractograpy can be
described as a 3 × 3 symmetric, positive definite matrix. Suppose the eigenvalues of the
matrix are λ1 > λ2 > λ3. The parallel and perpendicular diffusivities are given by λ1 and
12(λ2 + λ3), respectively. The fractional anisotropy is calculated as[
3(λ1 − λ)2 + (λ2 − λ)2 + (λ3 − λ)2
2(λ2
1 + λ22 + λ2
3)
]1/2
, (22)
where λ = (λ1 + λ2 + λ3)/3 (McLean et al., 2012).
Our data consists of measurements along the corpus callosum from 42 healthy controls
and 162 MS patients, measured at 93 locations along the tract. Figure 1 displays the 3
outcomes for both groups. Our goal is to estimate for each group the marginal distributions
the outcomes and the dependence structure across locations within and between outcomes.
We also wish to identify differences between the two groups.
5.1 Marginal Parameter Estimation for DTI Data
We assumed that each measurement from each group follows a skew-t marginal distribution.
We assumed that the mean, standard deviation, and skewness parameter vary along the tract,
while the degrees of freedom are constant along the tract locations. (There were insufficient
observations to estimate spatially-varying degrees of freedom parameters.) Using R package
sn (Azzalini, 2011), we obtained the maximum likelihood estimates for the degree of freedom
for the fractional anisotropy, parallel diffusivity and perpendicular diffusivity equal to 24.93,
11112 and 16.30, respectively for the control group, and 11732, 5.98 and 8.47 for the MS
group. We used the skew normal distribution to model any outcome with the estimated
degrees of freedom > 100. The undersmoothed estimates for the mean, standard deviation,
and skewness parameters were obtained via pointwise maximum likelihood estimation using
function st.mle in the R package sn (Azzalini, 2011). The mean and standard deviation

18 Biometrics, 000 0000
estimates were smoothed further by penalized spline fitting using generalized additive model
implemented in package mgcv in R (Wood, 2006). The skewness parameters were smoothed
further by fitting the penalized spline to maximize the penalized pseudo likelihood computed
using the estimates of the mean and standard deviation as in equation (4).
The estimated mean, variance and skewness functions for the three outcomes for both
groups are shown in Figure S5 in Web Appendix C. The bootstrap 90% pointwise confidence
intervals for the differences of the marginal parameters between the two groups are shown
in Figure 2. The mean, variance, and skewness functions are all statistically significantly
different between the two groups for parallel diffusivity, while only the mean and variance
are significantly different for fractional anisotropy and perpendicular diffusivity. The mean
of fractional anisotropy for the MS group is higher than the control group, but the means of
parallel and perpendicular diffusivities are lower in the MS group. The variances for the MS
group are higher in all of the three outcomes. The skewness of the fractional anisotropy is close
to zero for both groups. The parallel diffusivity of the MS group is positively-skewed while the
skewness is close to zero in most part of the tract in the control group. The difference in the
skewness between the two groups is significant. The perpendicular diffusivity is positively-
skewed in most part of the tract in both groups. There is no significant difference in the
skewness between the two groups.
[Figure 2 about here.]
5.2 Dependence Structure of DTI Data
After the estimates µp, σp, αp for the mean, standard deviation and skewness parameters
for the outcome p = 1, 2, 3 for each group were obtained, the data were transformed using
equation (5). Here, G is the skew-t distribution with mean 0, variance 1, skewness parameter
αp and degree of freedom for each outcome and each group as stated earlier. The method
explained in Section 3 was applied to the transformed data. The transformation implies that

Modeling Multiple Correlated Functional Outcomes 19
the marginal variance of the transformed process is 1, and, hence, the covariance function
for the transformed process is also its correlation function. In our study, estimates of the
marginal variance vary from 0.6 to 1.3 for the MS group, and 0.6 to 1.5 for the control
group, due to the small sample sizes. We verified this by a simple simulation as follows. We
generated data with 42 observations for control group, and 162 observations for MS group
according to the skew t distribution using the estimated parameters obtained earlier. Then
we transformed the simulated data as in Equation (5) and computed the marginal sample
variances. The variances vary similarly to those of the DTI data. The sample variances are
noticeably closer to 1 as the number of observations for each group increases to 200. Most of
the sample variances lie well within [0.9,1.1] as the number of observations increases to 500.
[Figure 3 about here.]
[Figure 4 about here.]
The estimated correlations for the DTI data were obtained by converting the estimated
covariances for the transformed process (i.e., scale the covariances by the marginal variances).
Figure S6 in Web Appendix C displays the estimated correlations within each of the three
outcomes for the healthy and MS groups. Figure 3 displays the estimated cross-correlations
between different outcomes for the healthy and MS groups. The correlations within the
outcomes look somewhat similar for the two groups, while there is a noticeable difference
between the two groups for the cross-correlations, especially for the cross-correlation between
parallel diffusivity and fractional anisotropy. The pointwise confidence intervals for the
estimated correlations can be computed using bootstrapping. Figure 4 shows the significance
levels of the difference of the correlations between the two groups calculated from the 90%
and 95% bootstrap pointwise confidence intervals based on 1000 samples.
The bootstrapping results confirm that there is no significant difference in the correlations
within fractional anisotropy and parallel diffusivity. The correlation within perpendicular

20 Biometrics, 000 0000
diffusivity is different in various small regions of the tract. There is a significant difference
between the two groups in the cross-correlation between the fractional anisotropy and the
parallel diffusivity in a large middle part of the tract (at around locations 0.2 to 0.8; see
the bottom, left panel of Figure 4). The cross-correlation is slightly positive in the control
group, while it is negative in the MS group. The difference in the cross-correlation between
the fractional anisotropy and the perpendicular diffusivity is significant in a smaller part
of the tract (at around locations 0.4 to 0.8; see the bottom, middle panel of Figure 4).
The cross-correlation is more negative in the MS group in this region. The cross-correlation
between the parallel and perpendicular diffusivities is somewhat similar between the two
groups with the parallel diffusivity at around location 0.2 being more positively-correlated
with the overall perpendicular diffusivity in the MS group.
5.3 Case Status Prediction for DTI Data
In this section, we demonstrate an application of the prediction introduced in Section 3.4 to
predict subjects’ case status. For each subject with unknown case status, we use the parallel
and perpendicular diffusivities to obtain two predictions for the fractional anisotropy using 2
sets of parameters: one for the MS group and the other for the control group. If this subject
is a MS patient, the prediction using the MS parameters should be more similar to the real
observed curve than the prediction using the control parameters. One possible criterion for
measuring the similarity between curves is to compare the areas between each predicted
curve and the observed curve. The prediction can be similarly applied to the parallel and
perpendicular diffusivities.
We studied the discriminating power of our prediction using a leave-one-out analysis.
To predict case status for subject i, we obtained estimates for marginal and dependence
parameters using all of the subjects but subject i. Then we performed prediction of an
outcome using the other two outcomes as explained in Section 3.4 to subject i using the

Modeling Multiple Correlated Functional Outcomes 21
obtained parameter estimates for MS and control groups. Let Areai,control,p and Areai,MS,p
denote the areas between the observed outcome p of subject i and the predicted outcome p
for subject i using the control and MS parameters, respectively. To predict the case status,
we use a test statistic
Ti,p = Areai,control,p − Areai,MS,p,
and classify this subject to be MS patient if Ti,p > τp for some threshold value τp. Figure 5
depicts receiver operating characteristic (ROC) curves with confidence intervals as the thresh-
old values vary using predicted curves for each of the 3 outcomes. The vertical axis shows the
true positive rate which is the proportion of MS patients that are correctly classified, and the
horizontal axis shows the false positive rate which is the proportion of healthy subjects that
are incorrectly classified. The ROC curves and their confidence intervals were produced by
the R package pROC (Robin et al., 2011). The confidence intervals lie almost entirely above
the 45o line, which indicates that the differences in correlation structure between the MS
and control groups have statistically significant predictive power.
[Figure 5 about here.]
6. Discussion
We have developed a copula-based approach for modeling functional data with multiple
outcomes. The copula approach, together with the KL expansion, significantly reduces the
dimension of the model and allows fast estimation of the marginal distributions and the
dependence structure. This is essential in the analysis of functional data, especially in the
case of multiple outcomes where the data set can be very large.
Our methodology performed very well in our simulation study. We extended the study done
by Staicu et al. (2011) to include three outcomes from DTI study and were able to identify
the differences in the pointwise marginal distributions between the control and MS groups.

22 Biometrics, 000 0000
Our dependence structure study shows that the correlations within the same outcome are not
different between the two groups, while the cross correlation between outcomes, especially
between the parallel diffusivity and fractional anisotropy, are different. ROC curves show
that the cross-correlations between DTI outcomes are predictive of MS status.
One extension to our Gaussian assumption would be to a t-copula. The t-copula covers
a larger class of models than Gaussian copula and is better in capturing tail dependence
behavior (McNeil et al., 2005). The KL expansion used in our model does not apply directly
to the t-copula. Another efficient alternative methodology will need to be developed.
Another possible extension is to study functional data in a longitudinal setting. For
example, the data used in this study, which contains only the data from the first visit
of each subject, was taken from a larger dataset that contains measurements from subjects’
multiple visits. This data set was studied by, for example, Goldsmith et al. (2012) and Greven
et al. (2010). Goldsmith et al. (2012) studied the relation between cognitive disability in MS
patients by incorporating DTI tractograpy measurement from multiple visits as functional
covariates in a longitudinal penalized functional regression setting. Greven et al. (2010)
developed a longitudinal functional principal component analysis approach to decompose the
longitudinal DTI data into a time-dependent population average, baseline subject-specific
variability, longitudinal subject-specific variability, subject/visit-specific variability and mea-
surement error. A longitudinal extension to our methodology would allow ones to assess how
the pointwise marginal distributions of each outcome and/or the dependence within and
across the outcomes across tract locations of the subjects from each group change over time.
7. Supplementary Materials
Web Appendices, Table and Figures referenced in Section 4 and Section 5 are available with
this paper at the Biometrics website on Wiley Online Library.
Modeling Multiple Correlated Functional Outcomes 23
Acknowledgements
Carroll’s research was supported by a grant from the National Cancer Institute (R37-
CA057030). This publication is based in part on work supported by Award Number KUS-
CI-016-04, made by King Abdullah University of Science and Technology (KAUST).
The authors also thank Daniel Reich and Peter Calabresi and their research teams, who
were instrumental in collecting the data for this study. Scans were funded by grants from the
National Multiple Sclerosis Society and EMD Serono. We are grateful to Ciprian Crainiceanu
for providing access to the data and for meaningful discussions and personal communications.
References
Azzalini, A. (1985). A class of distributions which includes the normal ones. Scandinavian
Journal of Statistics 12, 171–178.
Azzalini, A. and Capitanio, A. (2003). Distributions generated by perturbation of symmetry
with emphasis on a multivariate skew t distribution. Journal of the Royal Statistics
Society, Series B 65, 367–389.
Azzalini, A. (2011). R Package ‘sn’: The skew-normal and skew-t distributions (version 0.4-
17). URL http://azzalini.stat.unipd.it/SN, accessed August 1, 2012.
Basser, P. J., Mattiello, J., and LeBihan, D. (1994). MR diffusion tensor spectroscopy and
imaging. Biophysical Journal 66, 259–267.
Basser, P. J., Pajevic, S., Pierpaoli, C., Duda, J., and Aldroubi, A. (2000). In vivo fiber
tractography using dt-mri data. Magnetic Resonance in Medicine 44, 625–632.
Crainiceanu, C.M., Reiss, P., Goldsmith, J., Huang, L., Huo, L., Scheipl, F. et al. (2012).
R Package ‘refund’: Regression with functional data (version 0.1-6). URL http://cran.r-
project.org/web/packages/refund/index.html.

24 Biometrics, 000 0000
Dempster, A. P., Laird, N. M., and Rubin, D. B. (1977). Maximum likelihood from incomplete
data via the EM algorithm. Journal of the Royal Statistical Society, Series B 39, 1–38.
Di C., Crainiceanu C.M., Caffo B.S., and Punjabi N.M. (2009). Multilevel Functional
Principal Component Analysis. The Annals of Applied Statistics 3, 458-488.
Ferraty, F. and Romain, Y. (2010). The Oxford Handbook of Functional Data Analysis. New
York: Oxford University Press.
Greven, S., Crainiceanu, C. M., Caffo, B., and Reich, D. S. (2010). Longitudinal functional
principal component analysis. Electronic Journal of Statistics 4, 1022–1054.
Goldsmith, J., Feder, J., Crainiceanu, C. M., Caffo, B., and Reich, D. S. (2011a). Penalized
functional regression. Journal of Computational and Graphical Statistics 20, 830–851.
Goldsmith, J., Crainiceanu, C. M., Caffo, B., and Reich, D. S. (2011b). Penalized functional
regression analysis of white-matter tract profiles in multiple sclerosis. NeuroImage 57,
431–439.
Goldsmith, J., Crainiceanu, C. M., Caffo, B., and Reich, D. S. (2012). Longitudinal penalized
functional regression for cognitive outcomes on neuronal tract measurements. Journal of
the Royal Statistical Society, Series C 61, 453–469.
Levy, B. C. (2008). Principles of Signal Detection and Parameter Estimation. New York:
Springer.
Li, Y. and Ruppert, D. (2008). On the asymptotics of penalized splines. Biometrika 95,
415–436.
McLean, M. W., Hooker, G., Staicu, A., Scheipl, F., and Ruppert, D. (2012). Functional
generalized additive models. Journal of Computational and Graphical Statistics, to
appear.
McNeil, A., Frey, R., and Embrechts, P. (2005). Quantitative Risk Management. Princeton:
Princeton University Press.

Modeling Multiple Correlated Functional Outcomes 25
Ozturk, A., Smith, S.A., Gordon-Lipkin E.M., Harrison, D.M., Shiee, N., Pham, D.L. et al.
(2010). MRI of the corpus callosum in multiple sclerosis: association with disability.
Multiple Sclerosis 16, 166–177.
Ramsay, J. and Silverman, B. W. (2005). Functional Data Analysis. New York: Springer.
Redd, A. (2011). R Package ‘orthogonalsplinebasis’: Orthogonal bspline basis functions
(version 0.1.5). URL http://osplinebasis.r-forge.r-project.org, accessed February 1, 2013.
Reich, D. S., Smith, S. A., Zackowski, K. M., Gordon-Lipkin, E. M., Jones, C. K., Farrel,
J. A.D. et al. (2005). Multiparametric magnetic resonance imaging analysis of the
corticospinal tract in multiple sclerosis. NeuroImage 38, 271–279.
Robin, X., Turck, N., Hainard, A., Tiberti, N., Lisacek, F., Sanchez, J. C. et al. (2011).
pROC: an open-source package for R and S+ to analyze and compare ROC curves.
BMC Bioinformatics 12, 77–84.
Ruppert, D. (2002). Selecting the number of knots for penalized splines. Journal of Compu-
tational and Graphical Statistics 11, 735–757.
Ruppert, D., Wand, M. P., and Carroll, R. J. (2003). Semiparametric Regression, Cambridge:
Cambridge University Press.
Staicu, A.-M., Crainiceanu, C. M., and Carroll, R. J. (2010). Fast methods for spatially
correlated multilevel functional data. Biostatistics 11, 177-194.
Staicu, A., Crainiceanu, C. M., Reich, D. S., and Ruppert, D. (2011). Modeling functional
data with spatially heterogeneous shape characteristics. Biometrics 68, 331–343.
Wood, S. N. (2006). Generalized Additive Models: An Introduction with R. Boca Raton, FL:
Chapman & Hall/CRC.
Zhou, L., Huang, J. Z., and Carroll, R. J. (2008). Joint modelling of paired sparse functional
data using principal components. Biometrika 95, 601–619.

26 Biometrics, 000 0000
0.0 0.2 0.4 0.6 0.8 1.0
0.3
0.5
0.7
Fractional Anisotropy, Control
Tract distance0.0 0.2 0.4 0.6 0.8 1.0
1.0
2.0
3.0
4.0
Parallel Diffusivity, Control
Tract distance0.0 0.2 0.4 0.6 0.8 1.0
0.5
1.0
1.5
2.0
2.5
Perpendicular Diffusivity, Control
Tract distance
0.0 0.2 0.4 0.6 0.8 1.0
0.3
0.5
0.7
Fractional Anisotropy, MS
Tract distance0.0 0.2 0.4 0.6 0.8 1.0
1.0
2.0
3.0
4.0
Parallel Diffusivity, MS
Tract distance0.0 0.2 0.4 0.6 0.8 1.0
0.5
1.0
1.5
2.0
2.5
Perpendicular Diffusivity, MS
Tract distance
Figure 1. Plot of DTI data. The top row shows the three outcomes from 42 healthycontrols. The bottom row shows the same three outcomes from 162 MS patients. The tractdistance is normalized to [0,1]

Modeling Multiple Correlated Functional Outcomes 27
0.0 0.2 0.4 0.6 0.8 1.0
−0.
10−
0.04
Fractional anisotropy
Tract distance
Mea
n di
ffere
nce
0.0 0.2 0.4 0.6 0.8 1.0
−0.
50.
51.
5
Tract distance
Log−
varia
nce
diffe
renc
e
0.0 0.2 0.4 0.6 0.8 1.0
−2.
0−
0.5
1.0
Tract distance
Ske
wne
ss d
iffer
ence
0.0 0.2 0.4 0.6 0.8 1.0
0.00
0.15
Parallel diffusivity
Tract distance
Mea
n di
ffere
nce
0.0 0.2 0.4 0.6 0.8 1.0
0.0
1.0
Tract distance
Log−
varia
nce
diffe
renc
e
0.0 0.2 0.4 0.6 0.8 1.0
−1
12
3
Tract distance
Ske
wne
ss d
iffer
ence
0.0 0.2 0.4 0.6 0.8 1.0
0.00
0.15
0.30Perpendicular diffusivity
Tract distance
Mea
n di
ffere
nce
0.0 0.2 0.4 0.6 0.8 1.0
0.0
1.0
2.0
Tract distance
Log−
varia
nce
diffe
renc
e
0.0 0.2 0.4 0.6 0.8 1.0
−1.
00.
52.
0
Tract distance
Ske
wne
ss d
iffer
ence
Figure 2. Estimated differences (black solid lines) in the mean, log-variance and skewnessbetween the healthy and MS groups. The black dashed lines show 90% confidence intervalscomputed using bootstrapping with 1000 samples. The gray dashed horizontal lines arethrough 0.

28 Biometrics, 000 0000
0.0 0.4 0.8
0.0
0.4
0.8
Fractional aniso.
Par
alle
l diff
.
−0.1 0.1
0.1
0.3
0.3
Control
−0.5
0
0.5
0.0 0.4 0.8
0.0
0.4
0.8
Fractional aniso.
Par
alle
l diff
.
−0.3
−0.3
−0.1
−0.1 MS
0.0 0.4 0.8
0.0
0.4
0.8
Fractional aniso.
Per
pend
icul
ar d
iff.
−0.7
−0.5
−0.5
−0.3
−0.3
−0.
1
−0.8
0
0.4
0.0 0.4 0.8
0.0
0.4
0.8
Fractional aniso.
Per
pend
icul
ar d
iff.
−0.7
−0.5
−0.5
−0.
3
0.0 0.4 0.8
0.0
0.4
0.8
Parallel diff.
Per
pend
icul
ar d
iff.
−0.1 0.1
0.1
0.3 0.5
0.7
−0.5
0
0.8
0.0 0.4 0.8
0.0
0.4
0.8
Parallel diff.
Per
pend
icul
ar d
iff. 0.1
0.1
0.3
0.3
0.3 0.5
0.7
Figure 3. Estimated cross-correlations between different outcomes for the control group(left panel) and the MS group (right panel). This figure appears in color in Figure S7 in WebAppendix C.

Modeling Multiple Correlated Functional Outcomes 29
0.0 0.2 0.4 0.6 0.8 1.0
0.0
0.4
0.8
t1
t 2
90%95%
Fractional anisotropy
0.0 0.2 0.4 0.6 0.8 1.00.
00.
40.
8t1
t 2
Parallel diffusivity
0.0 0.2 0.4 0.6 0.8 1.0
0.0
0.4
0.8
t1
t 2
Perpendicular diffusivity
0.0 0.2 0.4 0.6 0.8 1.0
0.0
0.4
0.8
Fractional aniso.
Par
alle
l diff
.
Cross correlation
0.0 0.2 0.4 0.6 0.8 1.0
0.0
0.4
0.8
Fractional aniso.
Per
pend
icul
ar d
iff.
Cross correlation
0.0 0.2 0.4 0.6 0.8 1.0
0.0
0.4
0.8
Parallel diff.
Per
pend
icul
ar d
iff.
Cross correlation
Figure 4. The differences of the correlations within each outcome (top panel) and betweenoutcomes (bottom panel) between the healthy and MS groups. The gray and black regionsare the areas at which the differences are statistically significant at 90% and 95% levels,respectively. The computation is based on bootstrap pointwise confidence intervals using1000 samples.

30 Biometrics, 000 0000
False positive rate
True
pos
itive
rat
e
0.0
0.2
0.4
0.6
0.8
1.0
0.0 0.2 0.4 0.6 0.8 1.0
Fractional Anisotropy
False positive rate
True
pos
itive
rat
e
0.0
0.2
0.4
0.6
0.8
1.0
0.0 0.2 0.4 0.6 0.8 1.0
Parallel Diffusivity
False positive rate
True
pos
itive
rat
e
0.0
0.2
0.4
0.6
0.8
1.0
0.0 0.2 0.4 0.6 0.8 1.0
Perpendicular Diffusivity
Figure 5. Receiver operating characteristic curves with 95% confidence intervals forcase status prediction using the predicted fractional anisotropy, parallel diffusivity andperpendicular diffusivity.


